desert tortoise recovery plan assessment · dtrpac report page iv table of contents desert tortoise...
TRANSCRIPT

DTRPAC Report page i
Desert Tortoise Recovery Plan Assessment
Tracy, C.R., R. Averill-Murray, W. I. Boarman, D. Delehanty, J.
Heaton, E. McCoy, D. Morafka, K. Nussear, B. Hagerty, P. Medica

DTRPAC Report page ii
Dedication
This report is dedicated to our colleague and friend David Morafka.

DTRPAC Report page iii
Assessment Committee
C. Richard Tracy (Chair)Professor of BiologyUniversity of Nevada, RenoReno, Nevada
Roy Averill-Murray William I. BoarmanBiologist BiologistArizona Game and Fish Department U.S. Geological Survey/ BRDPhoenix, Arizona San Diego, California
Dave Delehanty Jill HeatonAssistant Professor of Biology Assistant Professor of GeographyIdaho State University University of Nevada, RenoPocatello, Idaho Reno, Nevada
Jeff Lovich Earl McCoyBiologist Professor of BiologyU.S. Geological Survey University of South FloridaFlagstaff, Arizona Tampa, Florida
Phil Medica Dave MorafkaBiologist Research AssociateU.S. Geological Survey California Academy of SciencesLas Vegas, Nevada San Francisco, California
Ken Nussear Bridgette HagertyResearch Ecologist Ph.D. StudentU.S. Geological Survey University of Nevada, RenoLas Vegas, Nevada Reno, Nevada

DTRPAC Report page iv
Table of Contents
DESERT TORTOISE RECOVERY PLAN ASSESSMENT ................................................................... I
DEDICATION ......................................................................................................................................II
ASSESSMENT COMMITTEE.......................................................................................................... III
TABLE OF CONTENTS ................................................................................................................... IV
TABLE OF TABLES ........................................................................................................................XII
TABLE OF RECOMMENDATIONS............................................................................................ XIII
ACKNOWLEDGEMENTS ............................................................................................................ XIV
BULLETED ABSTRACT OF FINDINGS AND RECOMMENDATIONS .............................. XVI
EXECUTIVE SUMMARY ............................................................................................................XVII
1. INTRODUCTION ............................................................................................................................ 1
1.1 Charge of the Desert Tortoise Recovery Plan Assessment Committee .................................................1
1.2 Desert Tortoise Recovery Plan Assessment Committee Members ........................................................2
1.3 Scientific Evaluation of the Recovery Plan ................................................................................................71.3.1 Recovery Prescriptions from the Recovery Plan ...................................................................................71.3.2 Topics Addressed in the Scientific Evaluation ......................................................................................91.3.3 Overview of Observations from the Assessment.................................................................................11
2. QUANTITATIVE LITERATURE REVIEW: THE STATE OF KNOWLEDGE..................... 16
2.1 Translocation ................................................................................................................................................19Translocation Recommendations ....................................................................................................22
3. DISTINCT POPULATION SEGMENTS..................................................................................... 27
3.1 Definition and intentions of Distinct Population Segments...................................................................273.1.1 Background ............................................................................................................................................273.1.2 Discreteness............................................................................................................................................283.1.3 Significance............................................................................................................................................30
Direct Life-History Measures:...................................................................................................................32

DTRPAC Report page v
Ecological/Demographic Indicators:.........................................................................................................32Possible Environmental Correlates: ..........................................................................................................32
3.1.4 Conservation Status ...............................................................................................................................32
3.2 DPSs of the Desert Tortoise........................................................................................................................333.2.1 Reappraisal of 1994 Recovery Units ....................................................................................................333.2.2 Provisional Revised List of DPSs.........................................................................................................36
DPS Recommendations ...................................................................................................................38
4. STATUS AND TRENDS............................................................................................................... 40
4.1 Recovery Plan Implementation .................................................................................................................40Recovery Action Review and Implementation Recommendations: .............................................44
4.2 Trend Analyses of Populations ..................................................................................................................464.2.1 History of Long-Term Study Plots .......................................................................................................464.2.2 Trends Range-wide (East and West) ....................................................................................................514.2.3 Trend Analyses by Recovery Unit........................................................................................................52
Upper Virgin River Recovery Unit (and DPS) ........................................................................................54Northeastern Mojave Recovery Unit ........................................................................................................55Eastern Mojave Recovery Unit .................................................................................................................56Northern Colorado Recovery Unit ............................................................................................................56Eastern Colorado Recovery Unit...............................................................................................................57Western Mojave Recovery Unit (and DPS) .............................................................................................58
4.2.4 Trend Analyses by Distinct Population Segment ................................................................................59Lower Virgin River DPS ...........................................................................................................................59Eastern Mojave and Colorado DPS...........................................................................................................60Northeastern Mojave DPS .........................................................................................................................61
4.2.5 Summary of Trend Analyses.................................................................................................................61
4.3 Spatial Analyses............................................................................................................................................624.3.1 History of Desert Tortoise Transects ....................................................................................................63
Total Corrected Sign Transects .................................................................................................................63Distance Sampling Transects ....................................................................................................................64
4.3.2 Observation Rates ..................................................................................................................................664.3.3 Presence/Failure to Detect.....................................................................................................................684.3.4 Conditional Probability of Live Encounter ..........................................................................................70
Resampling .................................................................................................................................................70Logistic Regression ....................................................................................................................................71
4.3.5 Kernel Analyses .....................................................................................................................................734.3.6 Nearest Neighbor Clustering.................................................................................................................84
4.4 Implications of Population and Spatial Analyses....................................................................................86Plot and Spatial Analysis Recommendations .................................................................................88
4.5 Status and Trends of Habitat and Environmental Setting for Tortoise Populations .......................894.5.1 Road Case Study ....................................................................................................................................89
Road Case-Study Recommendations ..............................................................................................914.5.2 Patterns of Precipitation Case Study................................................................................................97
Patterns of Precipitation Case Study Recommendations...............................................................994.5.3 Disease Case Study...........................................................................................................................99
What is known and what is not known? ............................................................................................100Risk from disease threats ....................................................................................................................103

DTRPAC Report page vi
Disease Case-Study Recommendations........................................................................................105
5. LINKING IMPACTS, HABITAT, AND DEMOGRAPHY TO RECOVERY ....................... 108
5.1 Cumulative, Interactive, and Synergistic Impacts of Multiple Threats ............................................1095.1.1 Threats Network...................................................................................................................................112
Threats Recommendations.............................................................................................................119
6. MONITORING, EVALUATING, AND DELISTING.............................................................. 122
6.1 Strategies of Desert Tortoise Monitoring ...............................................................................................1236.1.1 Historical Background for Desert Tortoise Monitoring ....................................................................1236.1.2 Scope and Purpose of Modern Monitoring ........................................................................................1246.1.2 Categories of Monitoring ....................................................................................................................126
6.2 Monitoring Desert Tortoises ....................................................................................................................1286.2.1 Monitoring Desert Tortoise Populations ............................................................................................128
Long-Term Study Plots............................................................................................................................129Distance Transect Sampling ....................................................................................................................130
6.2.2 Monitoring Individual Desert Tortoises .............................................................................................134Condition indices......................................................................................................................................134Behavior....................................................................................................................................................134
Behavior of Embryos and Neonates...................................................................................................136Behavior of Juveniles..........................................................................................................................136Behavior of Adults ..............................................................................................................................137
6.3 Habitat monitoring ....................................................................................................................................138Monitoring Recommendations ......................................................................................................138
6.4 Delisting Criteria........................................................................................................................................142Criterion 1 .................................................................................................................................................142Criterion 2 .................................................................................................................................................142Criterion 3 .................................................................................................................................................142Criterion 4 .................................................................................................................................................142Criterion 5 .................................................................................................................................................142
7. INTEGRATING RESEARCH AND MANAGEMENT............................................................ 146
7.1 Synopsis of Recommendations.................................................................................................................1467.1.1 Research and Monitoring ....................................................................................................................146
• Re-evaluating the status of DPSs and the positioning of DWMAs....................................................146• Improve population sampling methods ................................................................................................146• Develop tools .........................................................................................................................................147• Improve the focus on the recovery goal ...............................................................................................147• Improve information gathering .............................................................................................................148• Improving information dissemination ..................................................................................................148• Improve the utility of monitoring efforts .............................................................................................149• Improve the focus on recovery goals....................................................................................................149• Develop research agendas .....................................................................................................................149• Employing “outside” expertise .............................................................................................................150• Improve information dissemination/access..........................................................................................150
7.1.3 Data Management ................................................................................................................................150

DTRPAC Report page vii
• Improve information dissemination/access..........................................................................................150• Re-evaluate the status of DPSs and the positioning of DWMAs .......................................................150• Improve the focus on the recovery goal ...............................................................................................150
7.2 Adaptive Management ..............................................................................................................................1517.2.1 Ingredients of Inventory, Monitoring, and Research.........................................................................1517.2.2 Relationships among Inventory, Monitoring, Research, and Adaptive Management.....................1537.2.3 Definitions ............................................................................................................................................1537.2.4 Inventory ..............................................................................................................................................1547.2.5 Monitoring............................................................................................................................................1547.2.6 Research ...............................................................................................................................................1567.2.7 Adaptive Management Decision Making...........................................................................................1567.2.8 The Circle of Status and Trends and of Monitoring ..........................................................................157
7.3 Cooperation and Coordination ................................................................................................................1577.3.1 Desert Tortoise Recovery Office ........................................................................................................1607.3.2 Science Advisory Committee..............................................................................................................160
7.4 Data Management ......................................................................................................................................1637.4.1 Distribution of Monitoring Resources................................................................................................1637.4.2 Data Management Plan........................................................................................................................1647.4.3 Types and Sources of Errors ...............................................................................................................1647.4.4 Errors Detection and Correction .........................................................................................................166
APPENDIX A. DTRPAC RESPONSES TO COMMENTS ......................................................... 168
APPENDIX B. DTRPAC MEETING MINUTES.......................................................................... 177
LITERATURE CITED..................................................................................................................... 237

DTRPAC Report page viii
Table of Figures
Fig. 2.1 Distribution of all literature types before and after the publication of the Recovery Plan. .............17
Fig. 2.2 Distribution of literature among the major research categories........................................................17
Fig. 2.3 Distribution of professional journal literature in the research categories before and after thepublication of the Recovery Plan. The proportion of Recovery Plan prescriptions associated with eachmajor research topic are included for comparison with the distribution of professional journal literature.18
Fig. 2.4. Percent of early life stage documents in professional journals that focused on ecology andautecology.............................................................................................................................................................19
Fig. 3.1. Depiction of recovery units proposed in the 1994 Recovery Plan. Green outlines within therecovery units are proposed DWMAs. ................................................................................................................34
Fig. 3.2. Ratio of rainfall in winter compared to summer in the Mojave Desert. Weather stations, and thelongitudes for those stations, are given in the table. .........................................................................................35
Fig. 3.3 Map of the proposed distinct population segments for desert tortoise. .............................................37
Fig. 4.1 Relative number of threats to desert tortoises in each critical habitat unit (i.e., DWMA), asidentified by the Recovery Plan in 1994. ............................................................................................................40
Fig. 4.2 Relative number of threats to desert tortoises in each critical habitat unit (i.e., DWMA), asidentified by the Desert Tortoise Management Oversight Group in 2003. ......................................................41
Fig. 4.3 Relative numbers of management actions recommended for each DWMA in the 1994 RecoveryPlan. ......................................................................................................................................................................42
Fig. 4.4 Relative numbers of management actions by DWMA reported to the USFWS that have been atleast partially implemented by 2002. ..................................................................................................................43
Fig. 4.5 Locations of desert tortoise permanent study plots within the federally listed range of deserttortoises in the southwestern United States. .......................................................................................................47
Fig. 4.6 Trends in relative population densities for desert tortoises in the eastern and western permanentstudy plot sites. .....................................................................................................................................................52
Fig. 4.7 Active (green tortoise symbols) and discontinued (orange triangles) permanent study plotsgrouped within the 1994 Recovery Units............................................................................................................54
Fig. 4.8 Plot of adult densities over time for the City Creek permanent study plot located within the UpperVirgin River Recovery Unit. Error bars are 95% confidence intervals for the density estimate. ..................55
Fig. 4.9 Plot of adult densities over time for the study plots located within the Northeastern MojaveRecovery Unit. Error bars are 95% confidence intervals for the density estimate. ........................................55

DTRPAC Report page ix
Fig. 4.10 Plot of adult densities over time for the study plots located within the Eastern Mojave RecoveryUnit. Error bars are 95% confidence intervals for the density estimate..........................................................56
Fig 4.11 Plot of adult densities over time for the PSPs located within the Northern Colorado RecoveryUnit. Error bars are 95% confidence intervals for the density estimate..........................................................57
Fig. 4.12 Plot of adult densities over time for the PSPs located within the Eastern Colorado Recovery Unit.Error bars are 95% confidence intervals for the density estimate. ..................................................................57
Fig. 4.13 Plot of adult densities over time for the permanent study plots located within the Western MojaveRecovery Unit. Error bars are 95% confidence intervals for the density estimate. ........................................58
Fig. 4.14 Active (green tortoise symbols) and discontinued (orange triangles) study plots grouped byDistinct Population Segment. ..............................................................................................................................59
Fig. 4.15 Plot of adult densities over time for the Lower Virgin River Distinct Population Segment. Errorbars are 95% confidence intervals for the density estimate. .............................................................................60
Fig. 4.16 Plot of adult densities over time for the Eastern Mojave and Colorado Distinct PopulationSegment. Error bars are 95% confidence intervals for the density estimate. ..................................................60
Fig. 4.17 Plot of adult densities over time for the Northeastern Mojave Distinct Population Segment. Errorbars are 95% confidence intervals for the density estimate. .............................................................................61
Fig. 4.18 The ratio of carcasses to live tortoises for DWMAs..........................................................................67
Fig. 4.19 Presence/”Failure to Detect” tortoises and carcasses for combined distance sampling (2001-2003) and total corrected sign (1998, 1999, and 2001) transects. Dark green areas are those in which atortoise and/or scat were present. Light green areas are those in which a tortoise and/or scat and carcasseswere present. Red areas indicate only carcasses were present. White areas indicate no tortoises, scat, orcarcasses were found. Light tan areas indicate no distance sampling or total corrected sign transects wereconducted. .............................................................................................................................................................69
Fig. 4.20 Results from the resampling analysis - Areas depicted in red are points in bins 6 and 12, whichhad lower than average probabilities of live encounters; green points are bins 7 and 16, which had higherproportions of live animals. Points in all other bins are blue in color.............................................................71
Fig. 4.21 Results from the logistic regression analysis. Cooler colors indicate higher probabilities ofencountering a live tortoise, and warmer colors indicate a lower probability................................................73
Fig. 4.22 Kernel analysis for the Upper Virgin River DWMA. The 95% kernel for live animals is indicatedby the green polygon; the 95% kernel for carcasses is indicated by the red outlined polygon. Transects thatwere sampled for which no tortoises (live or dead) were found are indicated by the letter X on the map. ...75
Fig. 4.23 Kernel analysis for the Beaver Dam Slope / Mormon Mesa / Gold Butte-Pakoon DWMAs. The95% kernel for live animals is indicated by the green polygon; the 95% kernel for carcasses is indicated bythe red outlined polygon. Transects that were sampled for which no tortoises (live or dead) were found areindicated by the letter X on the map. ..................................................................................................................76
Fig. 4.24 Kernel analysis for the Coyote Springs Valley DWMA. The 95% kernel for live animals isindicated by the green polygon; the 95% kernel for carcasses is indicated by the red outlined polygon.

DTRPAC Report page x
Transects that were sampled for which no tortoises (live or dead) were found are indicated by the letter Xon the map. ...........................................................................................................................................................77
Fig. 4.25 Kernel analysis for the Piute-Eldorado Valley DWMA. The 95% kernel for live animals isindicated by the green polygon; the 95% kernel for carcasses is indicated by the red outlined polygon.Transects that were sampled for which no tortoises (live or dead) were found are indicated by the letter Xon the map. ...........................................................................................................................................................78
Fig. 4.26 Kernel analysis for the Chuckwalla DWMA. The 95% kernel for live animals is indicated by thegreen polygon; the 95% kernel for carcasses is indicated by the red outlined polygon. Transects that weresampled for which no tortoises (live or dead) were found are indicated by the letter X on the map. ............79
Fig. 4.27 Kernel analysis for the Pinto Mountain and Joshua Tree DWMAs. The 95% kernel for liveanimals is indicated by the green polygon; the 95% kernel for carcasses is indicated by the red outlinedpolygon. Transects that were sampled for which no tortoises (live or dead) were found are indicated by theletter X on the map. ..............................................................................................................................................80
Fig. 4.28 Kernel analysis for the Chemehuevi DWMA The 95% kernel for live animals is indicated by thegreen polygon; the 95% kernel for carcasses is indicated by the red outlined polygon. Transects that weresampled for which no tortoises (live or dead) were found are indicated by the letter X on the map. ............81
Fig. 4.29 Kernel analysis for the Ivanpah DWMA. The 95% kernel for live animals is indicated by thegreen polygon; the 95% kernel for carcasses is indicated by the red outlined polygon. Transects that weresampled for which no tortoises (live or dead) were found are indicated by the letter X on the map. ............82
Fig. 4.30 Kernel analyses for Fremont-Kramer / Superior-Cronese, and Ord-Rodman DWMAs. The 95%kernel for live animals is indicated by the green polygon; the 95% kernel for carcasses is indicated by thered outlined polygon. Transects that were sampled for which no tortoises (live or dead) were found areindicated by the letter X on the map. ..................................................................................................................83
Fig. 4.31 Nearest Neighbour Hierarchical Cluster analysis for the Western Mojave. Green areas areclusters of living tortoises; red outlines are clusters of carcasses. ..................................................................85
Fig. 4.32 Routes in the Western Mojave DWMAs in 1985-87. Blue routes were designated as open, brownas either closed, limited, undetermined, or non-route. Large roadless areas such as southwest Ord-Rodman, and the most southwestern portion of Fremont-Kramer were not without roads in 1985-87, butwere instead not inventoried. On the other hand, the DTNA was designated by the BLM as an Area ofCritical Environmental Concern and fenced in the late 1970’s, thus creating a roadless area.....................92
Fig. 4.33 Routes in the Western Mojave DWMAs in 2001. Orange routes were designated as open, brownas either closed, limited, or non-BLM owned routes. The most southwestern portion of Fremont-Kramerremains un-inventoried as does portions of northern Fremont-Kramer, excluding the DTNA. .....................93
Fig. 4.35 Comparison of 1985-87 and 2001 designated open BLM routes. The red routes represent 2001routes not formally designated as open in 1985-87. The lack of designation as open in 1985-87 could be aresult of the fact that the route was inventoried in 1985-87 but not designated as open, not inventoried in1985-87 but existing, or not existing in 1985-87. ..............................................................................................95
Fig. 4.36 Comparison of 2001 and 1985-87 designated open BLM routes. The blue routes represent 1985-87 routes not formally designated as open in 2001. The lack of designation as open in 2001 could be theresult of the fact that the route was inventoried in 2001 but not designated as open, not inventoried in 2001but existing, or not existing in 2001....................................................................................................................96

DTRPAC Report page xi
Fig. 4.37 Seasonal rainfall in the Mojave Desert, 1930-2000..........................................................................98
Fig. 5.1 Network of threats demonstrating the interconnectedness between multiple human activities thatinteract to prevent recovery of tortoise populations. Tier 1 includes the major land use patterns thatfacilitate various activities (Tier 2) that impact tortoise populations through a suite of mortality factors(Tier 3). ...............................................................................................................................................................113
Fig. 5.2 A section from the Threats Network from Fig. 5.1 that shows how multiple land uses and humanactivities provide food subsidies to predators on tortoises, thereby increasing mortality. ...........................115
Fig. 5.3 A section from the threats network from Fig. 5.1 showing just the primary activities associatedwith utility corridors. The causes of tortoise mortality associated with physical structures are also shown..............................................................................................................................................................................117
Fig. 5.4 A subsection of the Threats Network shown in Fig. 5.1 that illustrates the mortality factors directlyassociated with unpaved roads used for maintenance of utilities...................................................................118
Fig. 5.5 A much more complex web showing the interconnectedness among many activities associated withutilities and their impacts on tortoise populations...........................................................................................119
Fig. 6.1 Idealized population trends before recovery planning implemented, as a result of implementingrecovery planning, and after delisting. .............................................................................................................123
Fig. 6.2 Dimensions of elements important to recovery, and therefore, needing monitoring. .....................125
Fig. 6.3 Kernel analysis of presence data for living desert tortoises (green polygons) and carcasses (redoutlines. ...............................................................................................................................................................128
Fig.6.4 Simulated population growth at a 2% growth rate with (a) a 10% coefficient of variation aroundthe trend and (b) a 40% coefficient of variation around the same trend. ......................................................129
Fig. 6.5 Tortoise activity measured over a three year period at Bird Spring Valley, NV. Tortoise activity isexpressed as the proportion of animals active for each hour during each week of the year and ranges from0 to 1. The gray areas represent times for which tortoise activity was not sampled. Warmer colors indicatehigh proportions of animals active, and cooler colors indicate fewer animals active. .................................132
Fig. 7.1 Relationships among the desired objectives of a recovery program, a conceptual model of thefunctional relationships among species, and monitoring activities in the adaptive management................155
Fig. 7.2 Relationships among factors contributing to disease important to demography of the deserttortoise. ...............................................................................................................................................................159
Fig. 7.3 Relationships among offices, teams, committees, etc. functioning to produce strategies for recoveryand implementation of the listed species. .........................................................................................................162
Fig. 7.4 Kinds of activities associated with monitoring. .................................................................................163

DTRPAC Report page xii
Table of Tables
Table 1.1. Schedule of DTRPAC meetings ...........................................................................................................1
Table 2.1 Research categories used in quantitative literature review. ............................................................16
Table 4.1. Recovery actions listed in the Recovery Plan (and DWMA supplement) reported by managementagencies as implemented through 2002 (Redlands Institute (2002a-f). 0 = No Implementation; 1 =Implementation Initiated; blanks indicate actions not applicable to that unit, according to the RecoveryPlan. ......................................................................................................................................................................45
Table 4.2 Years surveyed on permanent study plots for desert tortoises. A number (0 or 1) indicates thatdata were taken at this plot. A zero indicates that the data are not available or sufficient for analysis, and aone indicates that data were available for analyses in this report. ..................................................................48
Table 4.3 Citations for sources of data used in permanent study plot analyses ..............................................50
Table 4.4 Study plots from which data were used to assess trends in population size in the originalRecovery Plan.......................................................................................................................................................51
Table 4.5 Summary of data, year, and region used for each analysis. TCS = total corrected sign surveys;LDS = line distance sampling. ............................................................................................................................63
Table 4.6 Percentages of live animals and dead animals found on LDS transects. The third column is theratio of the percent of dead animals encountered to the percent of live animals encountered.......................66
Table 4.7 Observed ratios of live to dead tortoises. The P values indicate bins of transects in which theratios were different from that expected at random. The sign of the observed value indicates the direction ofthe difference. .......................................................................................................................................................70
Table 4.8 Statistical table for the logistic regression analysis. ........................................................................72
Table 4.9 The estimated coefficients for the logistic regression model............................................................72
Table 4.10 Weather stations in the Mojave Desert used in analysis of precipitation (Fig. 4.37). .................97
Table 7.1 Summary of sources and types of error that have been found in Line Distance Sampling. .........165

DTRPAC Report page xiii
Table of Recommendations
Bulleted Abstract of Findings and Recommendations xv
Recommendations on Translocations 23
Recommendations on Distinct Population Segments 38
Recommendations for Recovery Action Review and Implementation 44
Recommendations on Study Plot and Spatial Analyses Techniques 88
Recommendations from Road Case Study 91
Recommendations from Precipitation Case Study 99
Recommendations from Disease Case Study 105
Recommendations for Dealing with Threats 119
Recommendations on Monitoring 138
Considerations for Delisting Criteria 143
Synopsis of Overall Recommendations 146

DTRPAC Report page xiv
Acknowledgements
We would like to thank U.S. Fish and Wildlife Service staff, which assertively providedan interface between the DTRPAC and the public during the process leading to thisreport. The Biological Resources Research Center at the University of Nevada, Renoprovided most of the logistic support for the process of creating this report. TheUniversity of Redlands, the Redlands Institute, and Lisa Benvenuti helped in producingmaps. The Western Ecological Research Center of The U.S. Geological Service providedsome financial and staff support. The Arizona Heritage Fund and a State Wildlife Grant(USFWS) supported Roy Averill-Murray as a member of DTRPAC. U.S. Fish andWildlife Service provided funds for this project.

DTRPAC Report page xv
Preface
This report of the assessment of the Desert Tortoise Recovery Plan of 1994 is the resultof more than a year of work by a committee who spent many hours conducting analysesand writing the report. A thorough understanding of the assessment process and productsrequires reading the entire report. Appendix B contains the minutes of all workingmeetings of the committee. This appendix allows a general tracking of the discussionsand the process by which the report was assembled. For those who wish only to read therecommendations resulting from the report, there are three sources of recommendations.There is a one-page bulleted list of the general recommendations on page xv. TheExecutive Summary on page xvi presents an abstract of the report. All recommendationsassociated with each chapter of the report can be located by using the Table ofRecommendations on page xii.

DTRPAC Report page xvi
Bulleted Abstract of Findings and Recommendations
• The Recovery Plan of 1994 was fundamentally sound, but some modifications forcontemporary management will likely make recovery more successful.
• Complex meta analyses of tortoise distributions and abundances indicate trends leadingaway from recovery goals in some parts of the species range. These results indicate aneed for more aggressive initiatives to facilitate recovery.
• A USFWS Desert Tortoise Recovery Office (DTRO) should be established to facilitateand coordinate recovery efforts based upon an adaptive-management approach withadvice from a Science Advisory Committee (SAC).
• Many of the original prescriptions of the Recovery Plan were never implemented. Theseprescriptions continue to be appropriate and they should be implemented. However,synergistic, interacting, and cumulative threats, not appreciated by the original RecoveryTeam, also must be addressed and new prescriptions should be prioritized from analysesof analyses of “threats network topologies” assembled by the DTRPAC to assessredundancies and synergies within individual threats.
• Recovery planning should reflect distinctness of population segments within the speciesrange. The genetic distinctness of tortoise populations and of their pathogens must beassessed to guide all manipulative management (e.g., head starting, translocation, habitatrestoration, corridor management, etc.). A newly proposed (by the DTRPAC)delineation of DPSs should be revised with new scientific information.
• Status and trends of populations/metapopulations within DPSs are potentially impossiblebased only upon assessment of tortoise density because assessing density of populationsfor rare and cryptic species is exceedingly difficult (and potentially impossible). Thus,monitoring the efficacy of management actions should be based upon a comprehensiveassessment of the status and trends of threats and habitats as well as population numbers.
• A new definition of recovery is needed as assessing recovery defined in terms of apopulation that is demonstrably increasing or remaining stable may not be possible. Thenew definition should be based upon achievable assessment of progress toward recoveryas assessed in the status and trends of threats, habitats, and population distribution andabundance.
• The original paradigm of desert tortoises being recovered in large populations relievedof intense threats may be flawed as tortoises may have evolved to depend uponmetapopulation dynamics. Assessing the appropriateness of the metapopulationparadigm is very important as management under this paradigm could require moreintense actions (including head starting, genetics management, habitat management andfacilitated dispersal, herd immunization, and other artificially facilitated ecosystemprocesses).

DTRPAC Report page xvii
EXECUTIVE SUMMARY
The Desert Tortoise Recovery Plan Assessment Committee (DTRPAC) was appointed bythe U.S. Fish and Wildlife Service (USFWS) in 2003 and charged with carrying out ascientific assessment of the Desert Tortoise Recovery Plan published in 1994. Theassessment committee consisted of credentialed academic and agency scientists withexpertise in ecology, tortoise biology, conservation biology, geography and GIStechnologies, scientific ethics and philosophy of science, the Endangered Species Act of1973 as amended and the implementation of that law, and desert natural history.Additionally, the assessment committee solicited input from nationally recognizedscientists to provide expert advice and opinion in highly technical areas central to tortoiserecovery including tortoise epidemiology, remote sensing, and multi-scale populationmonitoring.
The resultant assessment reviews the Recovery Plan in the context of scientific andanalytical advances made since the Recovery Plan was published in 1994. The primarygoal of this assessment is to provide a critical scientific evaluation of the Recovery Planprior to any renewal or revision of the plan. The assessment produced by DTRPAC is nota Recovery Plan, and it does not seek to make social, legal, or political decisions ondesert tortoise recovery. Rather, the assessment is a scientific evaluation of the currentstate of scientific knowledge regarding tortoise recovery, and the assessment revealsdirections, via analytical examples, towards the scientific knowledge necessary to achievedesert tortoise recovery. The committee explicitly demonstrates how recent analyticaladvances can be applied to desert tortoise recovery by carrying out original and rigorousanalyses of existing data. Not only are these analyses meant to provide a detailedscientific perspective for a possible future recovery plan panel to consider, the examplesalso demonstrate the power of analyses now available for tortoise recovery whenappropriate data exist and the true loss in potential information incurred when tortoisedata acquisition is poorly planned or only intermittently carried out.
The DTRPAC found that original Recovery Plan was fundamentally strong but couldbenefit substantially from modification. Modifications center on the following areas: (1)recognition of new patterns of diversity within the Mojave desert tortoise population, (2)explicit implementation of original Recovery Plan prescriptions, (3) greater appreciationof the implications of multiple, simultaneous threats facing tortoise populations, and (4)applying recent advances in analytical techniques to desert tortoise recovery.
Much of the inability to implement the original Recovery Plan owes to the lack ofcoordinated, range-wide tracking and reporting of management implementation. TheDTRPAC recommends that a much more aggressive coordination and facilitation effortshould become the responsibility of the USFWS. A Desert Tortoise Recovery Office(DTRO) should be established in the USFWS to implement the needed oversight,tracking, and reporting of new information about the efficacy of management actions andthe methods by which that efficacy is assessed. This office should empanel a Science

DTRPAC Report page xviii
Advisory Committee (SAC - including members from academia and USGS) to serve inan advisory role to the DTRO.
Research and management efforts can and should be integrated to increase the likelihoodof tortoise recovery. It appears that many opportunities to accumulate scientificallyrigorous data to examine tortoise and habitat trends, as well as to explore mechanismsunderlying tortoise population dynamics, have been missed. Recovery depends upon asubstantially greater understanding of tortoise behavior, genetics, disease transmission,and demography, and the DTRO should facilitate increased scientific understanding inthese areas by increasing research activity outlined in the original Recovery Plan andhere, and working to improve cooperation between managers and research scientists.Scientists need to emphasize research that will address urgent management needs andtheir efforts will benefit from consulting with managers on their “on-the-groundknowledge” of tortoise populations. Managers can contribute to recovery bycollaborating and consulting with researchers on data acquisition, storage, and access.Additionally, sophisticated data oversight and management as well as independentexpertise in data acquisition design and statistical analysis are essential to the processleading to desert tortoise recovery.
The recovery prescriptions of the original Recovery Plan were only partiallyimplemented and, as implemented, the Recovery Plan neither appears to be leading todesert tortoise recovery, nor is it likely to do so. In particular, explicit recommendationsfor research designed to provide rigorous data essential to understanding desert tortoisedemography and population dynamics were not carried out. The failure to implementresearch recommendations means that the understanding of desert tortoise demographyand population dynamics has advanced very little. The call for rigorous data was anessential part of the adaptive management approach at the core of the original RecoveryPlan. In adaptive management, management actions are modified based upon incomingdata that assesses whether or not current management actions are working. Establishingan aggressive DTRO will help us avoid missing more opportunities to facilitate recovery.
Desert tortoises face an array of threats, which act simultaneously and synergistically.The far-reaching implications of this concept were not fully appreciated in the originalRecovery Plan. Multiple, simultaneous threats are particularly insidious to formulatingrecovery actions because it is possible that potential gains made in tortoise numbersthrough one action can be lost when potentially “saved” tortoises perish or fail toreproduce due to a different threat not alleviated by the management action. Thesynergism of multiple threats refers to the biological fact that effects from one threat canbe magnified when the threat co-occurs with another threat. The original Recovery Plandoes not fully appreciate that threats to tortoises can act in this non-additive way.
Due to the natural progression of science, the original Recovery Plan does not incorporatetechnological and analytical techniques now available. The DTRPAC reviewed thescientific literature, sought to acquire recent data in the “gray” literature (agency reports,etc.), and applied a suite of analytical techniques to existing desert tortoise data. These

DTRPAC Report page xix
analyses were meant to yield new insights into desert tortoise biology and recovery, toprovide examples of approaches that a new recovery plan could employ, and also tounderscore the true need for, and benefit of, rigorous and scientific data that directlyaddress issues underlying desert tortoise recovery.
The assessment presents a modified set of desert tortoise Distinct Population Segments(DPS) relative to the original Recovery Plan. The new DPS delineations reflect thecommittee’s review and interpretation of recent desert tortoise and conservation biologyliterature. The DTRPAC delineations reflect the prevailing concepts of subpopulation“discreteness, “ and “significance,” and incorporate morphological, behavioral, genetic,and environmental information. The DTRPAC suggestion reduces the number DPSs fromsix to five by leaving the original Upper Virgin River and Western Mojave units intactand recombining the four central units into three reconfigured units.
The assessment provides a highly detailed meta-analysis of desert tortoise populationstatus and trends. The DTRPAC found the data on status and population trends often tobe statistically unwieldy due to inconsistencies in data collection, suboptimal datacollection design, and the truly daunting task of measuring animals that are difficult todetect and that occupy a harsh environment. Because much of the data currently availableto address tortoise recovery was originally collected for purposes other than tortoiserecovery, the DTRPAC analyses are meta-analyses using data of mixed quality. To adjustfor very low statistical power in current data sets, DTRPAC used transect samplingcarried out by various agencies and managers to derive tortoise occurrence data, thenused spatial analysis of tortoise occurrence to map tortoise status and possible trends.Results are complex, but resulting maps suggest that in many areas tortoise populationsappear be facing continued difficulty. Spatial analyses did not indicate zones of recovery.Kernel analyses of transect data – limited to only one year due to lack of additionalsufficient data – identified several regions that may have experienced significant localdie-offs. Statisticians consulting with DTRPAC derived an original analysis called“Conditional Probability of Being Alive” that spatially illustrated regions of low,intermediate, and high probability of encountering live tortoises during surveys. Theseanalyses identified large regions within historic desert tortoise habitat as being associatedwith having a low probability of detecting live tortoises during surveys. In other words,probably few tortoises occur in these areas currently. The West Mojave recovery unitstood out within overall tortoise range as unambiguously experiencing continuedpopulation decline.
The DTRPAC also performed spatial analyses of habitat and other geographic trends withspecial emphasis on potential impacts of roads and disease: two issues of historicimportance in desert tortoise recovery. GPS technology and renewed survey effortindicate that more roads currently are documented in the western Mojave zone of tortoisedecline than were documented in 1987. Some portion of the increase in roads probablyrepresents legal or illegal road creation from 1987-2001. Some portion probablyrepresents new documentation of previously existing roads. The relationship betweenroad type and road density to tortoise decline needs to be clarified. Expert consultation

DTRPAC Report page xx
with wildlife disease epidemiologists and emerging evidence from tortoise studiesindicate that the relationship between ELISA-positive assays of live tortoises,Mycoplasma infection, and tortoise decline is not a simple and easily predictedrelationship. Disease experts sought out by the DTRPAC described a growing awarenessthat the probability of infection leading to death in tortoises may be a function of chronicstress (e.g., malnutrition) and the strain of infectious agent. This means that the presenceof disease alone is not sufficient to explain tortoise die-offs. For example, it is possiblethat habitat degradation results in physiologically stressed tortoises that then succumb todisease agents that are normal at background levels in healthy populations. Therelationships between disease, physiological status, and tortoise death are scientificallytractable, but they have not been rigorously addressed.
The assessment presents a threats network topology. This network illustrates theprofoundly daunting array of threats facing the desert tortoise and should discourage afuture recovery team, if it is necessary to form one, from viewing threats in overlysimplistic way. A substantial body of evidence indicates that tortoises face a complexsuite of threats. It is naïve to propose a recovery action that addresses a single threat andthen anticipates straightforward additive increases in tortoises as a response to themanagement action.
It is also clear that effective desert tortoise monitoring and the creation of an effectiverestoration strategy will entail a new and greater level of cooperation and coordinationamong managers and scientists. Currently, no group is charged with managing scientificdata on the desert tortoise, and data often are collected and reported in ways that makethem difficult to use in conjunction with other data. Currently, important desert tortoisedata are widely scattered among state and federal agencies and the scientific community.Data have been gathered, “organized”, and stored in a multitude of ways. Some data havebeen organized and other still exists in raw, unanalyzed states. Accessibility of data formanagers, scientists, and the public is highly variable. In short, a great deal of importantlong-term data cannot be used readily. Organizing and “mining” currently existing deserttortoise data could be highly productive and helpful. Establishing a DTRO would helpfocus attention towards learning from existing data and promoting new scientificinitiatives.
The current definition of desert tortoise recovery requires populations within recoveryunits to be stable or increasing for at least 25 years (one tortoise generation). Todemonstrate recovery based on population stability, scientists must be able to distinguishamong populations that are truly stable as opposed to populations that superficiallyappear to be stable because monitoring data are not sufficiently rigorous to detectdeclines when in fact declines are occurring. A new multi-dimensional monitoringstrategy may be the most effective approach for redefining and verifying recovery. Themonitoring approach presented in the assessment refers to three tiers of monitoring. Tiers1 and 2 perform status and trend monitoring by using repeated measures taken over time(tier 1) and inferential statistics applied across broad geographical areas (tier 2). Theseare designed to meet current management objectives and also to monitor changes over

DTRPAC Report page xxi
long time periods. Tier 3 is research monitoring designed to detect or to verifymechanistic links between actions and tortoise responses. Both population and habitatmonitoring will require multi-scale approaches to achieve information needed foradaptive management and assessment of recovery.
It is no longer clear that the original population paradigm upon which definitions ofrecovery were based is correct. Existing data do not exclude the possibility that tortoisepopulations evolved to be distributed in metapopulations instead of single, largepopulations. The dynamics of metapopulations, and the conservation prescriptions formetapopulations are entirely different from single, large populations. Thus, the originalRecovery Plan prescribed establishing large wildlife management areas and reducingthreats within those areas. For metapopulations, it may be additionally necessary toprotect corridors among habitat patches, and to recognize that natural metapopulationdynamics require areas suitable for desert tortoises, but periodically vacant of tortoises.Thus, new data and analyses are needed immediately to determine the biological basis fordefining recovery in light of the possibility that unforeseen ecosystem processes need tobe protected as part of recovery.

DTRPAC Report page xxii
“SScciieennccee ccaann oonnllyy ssttaattee wwhhaatt iiss,, nnoott wwhhaatt sshhoouulldd bbee..”
Albert Einstein, Out of My Later Years. (1950)

DTRPAC Report page 1
1. Introduction
The original Desert Tortoise Recovery Team recognized the importance of including newdata and analyses for recovery efforts as they become available. Indeed, the RecoveryTeam called for the Recovery Plan to be reassessed every three to five years to ensurethat recommendations to management were made with the best available scientificinformation (USFWS 1994, p. 37). Since the Recovery Plan's publication in 1994, therehave been no overt efforts to revise the Recovery Plan in light of new informationpertinent to desert tortoise recovery, despite the fact that there has been new research onmany aspects of desert tortoise ecology, threats, conservation biology, and monitoring, aswell as public challenges to the validity of the Plan.
1.1 Charge of the Desert Tortoise Recovery Plan Assessment Committee
The U.S. Fish and Wildlife Service (USFWS) initiated a two-step process to revise the1994 Desert Tortoise Recovery Plan. Step 1 is a review and assessment of new researchand information gathered on many aspects of desert tortoise ecology, threats,conservation biology, monitoring, and recovery actions. Step 2 will be the revision of theRecovery Plan by a newly established recovery team of scientists, agency resourcespecialists, and stakeholders, if a future recovery team is necessary.
Following is a description of Step 1 of the process that has been initiated by the DesertTortoise Recovery Plan Assessment Committee (DTRPAC). The charge of the DTRPACis to review the entire Recovery Plan in relation to contemporary knowledge and, basedon that review, prepare recommendations about which parts of the Recovery Plan needupdating. Under this charge, the DTRPAC was to assemble and review all new literaturepertinent to the Recovery Plan, to hold meetings to conduct an in-depth review ofselected topics (disease, monitoring, etc.), and submit a final report to the USFWS. Aschedule of DTRPAC meetings, including focal topics for each meeting is shown inTable 1.1. The minutes from each meeting are contained in Appendix B.
TABLE 1.1. Schedule of DTRPAC meetings
Topic Dates LocationOrientation and Agenda 11 April 2003 San Francisco, CADistinct PopulationSegments and Threats
15-16 May 2003 Palm Springs, CA
Disease Workshop Debrief,Disease, Status of Threats
9-10 June 2003 San Francisco, CA
Status of Populations,Demography, FinalizeThreats
31 July – 1 August 2003 Truckee, CA
Monitoring and DelistingCriteria
4-5 September 2003 Monterey, CA

DTRPAC Report page 2
Habitat ConservationPlanning, Research
2-3 October 2003 Tucson, AZ
Review and ReportPreparation
6-7 November 2003 Las Vegas, NV
Report Preparation 26-27 February 2004 Reno, NVReport Preparation 22-23 April 2004 Carlsbad, CAAddress Public Comments 26-27 May 2004 Reno, NVFinalize Report 14-15 June 2004 Reno, NV
1.2 Desert Tortoise Recovery Plan Assessment Committee Members
The DTRPAC was purposely assembled with scientists and experts diverse in terms ofState representation, institutions of employment, gender, and scientific expertise. Somemembers were chosen who are not doing research on the desert tortoise. The committeewas assembled with representatives with the following characteristics:
1. expertise and experience with the desert tortoise and/or ecosystems containingdesert tortoises,
2. expertise and experience in conservation biology and other areas important to theDTRP evaluation process,
3. ability to serve as “internal peer-reviewers” (i.e., scientists serving as generalscience analysts whose job it will be to keep tortoise scientists from becomingmyopic while focusing on new data, analyses, and opinions for the desert tortoise),
4. academic and agency scientists,5. representation of the original Recovery Team,6. broad representation from the geographic range of the listed species.
The committee included the following members:
C. Richard Tracy (Ph.D.), [Chair of the Committee] Professor of Biology and Directorof the Biological Resources Research Center, University of Nevada, Reno, NV
Dr. Tracy is the former Director of the Ecology, Evolution, and Conservation BiologyGraduate Program at the University of Nevada, Reno. He currently serves as thescience advisor for the Clark County Desert Conservation Program in Nevada. Heearned his B.A. and M.S. from California State University, Northridge and his Ph.D.from the University of Wisconsin. He has served on faculties at Colorado StateUniversity, the University of Wisconsin, the University of Washington, theUniversity of Puerto Rico, Pepperdine University, the University of Nebraska, and theUniversity of Michigan. He has been honored as a Guggenheim Fellow, as aDistinguished Scholar at Pepperdine University, and as a Fellow of the Association ofWestern Universities. He also has received an American Society of ZoologistsService Award, a Desert Tortoise Council Conservation Award, a Service Awardfrom the U.S. Fish and Wildlife Service, and he has served in leadership roles in theEcological Society of America and the American Society of Zoologists. Dr. Tracy is

DTRPAC Report page 3
an ecologist who has published more than 140 articles and book chapters on a widerange of topics in ecology, population biology, physiology, biophysics, and naturalhistory of animals (mostly amphibians and reptiles), and whose studies have includedresearch on herbivorous reptiles since 1977, and on desert tortoises since 1988. Hewas a member of the original Desert Tortoise Recovery Team, and he is a member ofthe Houston Toad Recovery Team. He has served as major professor for 37 mastersand Ph.D. students, and he has directed theses, dissertations, and postdoctoralresearch of several graduate students and postdoctoral scholars who have studied thedesert tortoise.
Roy C. Averill-Murray (M.S.), Amphibians and Reptiles Program Manager,Arizona Game and Fish Department, Phoenix, AZ
Mr. Averill-Murray earned his B.S. in Wildlife and Fisheries Sciences (cum laude)from Texas A&M University in 1990. In 1993 he earned his M.S. in Wildlife andFisheries Science from the University of Arizona, where he completed his thesis onestimating density and abundance of desert tortoises in the Sonoran Desert. He beganworking for the Arizona Game and Fish Department in 1995 as the NongameBranch's Desert Tortoise Coordinator. As Desert Tortoise Coordinator, he directedthe state's population monitoring program; conducted research on desert tortoiseecology, especially reproduction; and co-chaired the Arizona Interagency DesertTortoise Team. He has published 8 peer-reviewed scientific papers on deserttortoises, including 3 chapters in the new book The Sonoran Desert Tortoise: NaturalHistory, Biology, and Conservation. He assumed the duties of Amphibians andReptiles Program Manager in 2002, and he is responsible for the management of allamphibians and reptiles in Arizona. He is also co-chair of Partners in Amphibian andReptile Conservation's Southwest Regional Working Group.
William I. Boarman (Ph.D.), Research Wildlife Biologist, U.S. Geological Survey,Western Ecological Research Center, San Diego, CA
Dr. Boarman received his Ph.D. in ecology from Rutgers University. He has workedfor the Department of Interior for 13 years studying the ecology, behavior, andmanagement of the desert tortoise and common raven. His desert tortoise researchfocuses on the impacts of roads on desert tortoise populations and the effectiveness ofbarrier fences and culverts at recovering desert tortoise populations. The associationbetween raven ecology and anthropogenic resources to develop means to reduceraven predation on juvenile tortoises is the aim of his work with ravens. He haswritten a comprehensive evaluation of the state-of-the-art of our knowledge of threatsto desert tortoise populations. He is also involved in research on the Salton Seaecosystem, prairie falcon ecology, and marbled murrelet conservation. He haspublished 25 papers in peer-reviewed scientific journals.
Dave J. Delehanty (Ph.D.), Assistant Professor of Biology, Idaho State University,Pocatello, ID
Dr. Delehanty received his Ph.D. from the Ecology, Evolution, and ConservationBiology Program at the University of Nevada, Reno in 1997. He has taught

DTRPAC Report page 4
Conservation Biology at UNR and ISU, and he is well known for his innovativeapproach to this important subject. He has studied mechanisms underlying behaviorand the physiological importance of dietary carotenoid pigments on steroid-mediatedphysiological events involved with sexual maturation, sexual behavior, andreproductive performance in vertebrates. Importantly, he seeks to develop animproved understanding of animal behaviors integral to the success of conservationactions. He is implementing Nevada restoration programs for mountain quail andColumbian sharp-tailed grouse, two native species extirpated from all or part of theirhistoric ranges. This includes developing new restoration techniques that account forbehavioral and life history constraints. He is a critical thinker whose prowess inecology, conservation biology, genetics, statistical analyses, research design, as wellas species repatriation makes him an excellent member for the DTRPAC.
Jill S. Heaton (Ph.D.), Assistant Professor of Geography, University of Nevada,Reno, NV
Dr. Heaton was previously an assistant professor in Environmental Studies at theUniversity of Redlands. She was Principal Investigator for the Redlands Institute (RI)Desert Tortoise Project (DTP). The RI and DTP are comprised of numerous researchanalysts, ecologists, GIS analysts, programmers, and systems analysts, among otherpositions. She and her DTP research team are building a desert tortoise decisionsupport system. This system uses a scientific knowledge base linked to geospatialdata within an application framework allowing users to evaluate decision andmanagement options as well as identify knowledge and data gaps, thus clarifyingresearch priorities. She is an arid lands ecologist, with degrees in biology andgeography. She earned her B.S. and M.S. in Biology from the University of NorthTexas, in 1993 and 1996, respectively. Dr. Heaton earned her Ph.D. in PhysicalGeography from Oregon State University in 2001. Her research career has been spentin the arid southwest working with mammals in the Chihuahuan Desert and reptiles inthe Mojave. She is experienced in applying quantitative and statistical techniques toecological problems, and integrating ecological theory and principles with the spatialand temporal complexity of the natural environment. She has experience andexpertise in habitat modeling, statistical modeling, environmental issues on militaryinstallations, urban and development biodiversity boundary interactions, and issuesrelating to land use and conservation. She is trained in GIS applications, primarily thesuite of ESRI GIS products, remote sensing and image analysis, and traditionalstatistical and geo-statistical analyses. She has extensive fieldwork experience andstrives to spend a quarter of her time in the field conducting research.
Jeffrey E. Lovich (Ph.D.), Chief, Grand Canyon Monitoring and Research Center,U.S. Geological Survey, Flagstaff, AZ
Dr. Lovich is the former Director of the U.S. Geological Survey, Western EcologicalResearch Center. Headquartered in Sacramento, California, the Center employs astaff of over 100 employees, located at 14 duty stations in California and Nevada. Hestarted his federal career in 1979 at the National Museum of NaturalHistory/Smithsonian Institution in the Division of Amphibians and Reptiles while still

DTRPAC Report page 5
an undergraduate student at George Mason University. After finishing his B.S. inBiology, he stayed on at George Mason, earning an M.S. in Biology. From there, hewent to the University of Georgia, obtaining a Ph.D. in Ecology in 1990. Most of histenure at the University of Georgia was spent at the Savannah River EcologyLaboratory, a research facility of the University of Georgia in South Carolina. After abrief Post Doctoral fellowship at the Savannah River Ecology Laboratory, he went towork for the Bureau of Land Management, first as a staff biologist at the CaliforniaDesert District Office in Riverside, then as the Lead Wildlife Biologist in PalmSprings. As a charter member of the National Biological Survey (now BiologicalResources Division of USGS), he conducted research on desert tortoises and desertecology in southern California. His research on turtles and tortoises spans almost 25years. During that time he published over 60 scientific papers, most on the ecologyand evolution of North American and Asian freshwater turtles. He discovered andformally described three of the world's 280 or so turtle species, including two in theUnited States and one in Japan. In addition he published two books. He is co-authorof the book "Turtles of the United States and Canada" published by the SmithsonianInstitution Press in 1994, and co-editor of, and contributor to, the book "BiologicalDiversity: Problems and Challenges" published by the Pennsylvania Academy ofScience the same year.
Earl D. McCoy (Ph.D.), Professor of Biology, University of South Florida, Tampa, FL
Dr. McCoy earned a B.S. in Biology at Florida State University in 1970, a M.S. inBiology at the University of Miami in 1973, and a Ph. D. in Biology at Florida StateUniversity in 1977. He has published over 100 peer-reviewed publications, many ofwhich focus on the ecology and conservation biology of gopher tortoises. He has alsopublished extensively on the philosophy of science and the basis of experimentaldesign in ecology, including the book Method in Ecology: Strategies for ConservationProblems. He is currently on the editorial board for three journals, including Ecologyand Ecological Monographs. He has been at the University of South Florida since1977. He has been the associate Chairman for the Department of Biology since 1992.He has also been a Visiting Assistant Professor at the University of Virginia onseveral occasions. He has mentored three postdoctoral students, 10 Ph.D. students,and 27 masters students. He is currently the primary investigator or a collaborator onseveral research projects, including a large multi-disciplinary project examining thefield epidemiology of the Upper Respiratory Tract Disease in the gopher tortoise.
David J. Morafka (Ph.D.), [deceased] Research Associate, Department ofHerpetology, California Academy of Sciences, San Francisco, CA
Dr. Morafka was the Lyle E. Gibson Emeritus Professor of Biology, CSU,Dominguez Hills. He earned his B.S. in Biology (with honors) at the University ofCalifornia at Berkeley in 1967, and a Ph. D. at the University of Southern Californiain 1974. He was a member of the original Desert Tortoise Recovery Team and amember of the IUCN Freshwater Turtle and Tortoise Conservation Group. He hadmore than 50 publications and one book on North American desert reptiles and theirconservation. He was the principal investigator on neonatology and hatchery nursery

DTRPAC Report page 6
studies of the desert tortoise at Ft. Irwin and Edwards Air Force Base, and of theendangered Bolson tortoise in Mexico.
Ken E. Nussear (Ph.D.), Research Ecologist, U.S. Geological Survey, WesternEcological Research Center, Las Vegas Field Station, Las Vegas, NV
Dr. Nussear is a recent graduate from the Ecology, Evolution, and ConservationBiology Program at the University of Nevada, Reno. He received his B.S. in Zoology(summa cum laude) from Colorado State University. He has published several peer-reviewed publications on the physiology of desert reptiles. He has worked on manyresearch projects involving desert tortoises since 1995. His research has focused onconservation biology, nutritional ecology, and physiological ecology of deserttortoises. These research projects included a multi-site, multi-state translocationproject designed to examine the efficacy of translocation as a conservation tool fordesert tortoises. The study looked within and beyond the geographic range of deserttortoises and gives insights into the habitat requirements of this species. His work isbeing used to develop management strategies for desert tortoises in the face of thefastest growing human populations in the country. He had a pre-doctoral fellowshipfrom the University of Redlands to continue his research. This research involvesapplied biophysical-ecology studies of tortoises to enhance our understanding oftortoise activity and how this impacts monitoring efforts. This work will help to refinedesert tortoise monitoring efforts throughout the range of the listed population.
Bridgette E. Hagerty, Ph.D. Student, University of Nevada, Reno (DTRPACmanager)
Ms. Hagerty is a current doctoral student in the Ecology, Evolution, andConservation Biology Program at the University of Nevada, Reno. She earned herB.A. in Biology (magna cum laude) from St. Mary’s College of Maryland in 2000.Prior to beginning her graduate studies, she was an Environmental ManagementFellow with the Chesapeake Research Consortium and staffed committees at theEPA Chesapeake Bay Program. Her research focuses on the use of indirect methodsto quantify movement among desert tortoise populations in the Mojave Desert. Theresults of her genetics research will be used to help make decisions concerningdistinct populations segments of the desert tortoise.
Phil A. Medica (M.S.), Biologist, U.S. Geological Survey, Western RegionalResearch Center, Las Vegas Field Station, (USFWS liaison representative)
Mr. Medica is a Wildlife Biologist with the U.S. Geological Survey, WesternEcological Research Center, at the Las Vegas Integrated Science Office. He receivedhis B.S. in Wildlife Management (Game Management) and his M.S. in Biology(Herpetology) from New Mexico State University in 1964 and 1966, respectively. Hehas worked on reptiles and small mammals throughout the southwestern U.S. for thepast 40 years. He began his career working at the Nevada Test Site (NTS) in 1966 asa field technician for Brigham Young University, Department of Zoology, and wassubsequently employed as a Staff Research Associate by UCLA, Laboratory ofNuclear Medicine and Radiation Biology from 1967-1981. While with UCLA at

DTRPAC Report page 7
NTS, he studied the effects of gamma irradiation upon natural populations of animalsand plants at the Rock Valley facility, documented sterility among the lizardinhabitants, and conducted lizard demographic and reproductive studies. Hedeveloped and implemented environmental research studies on natural populations oflizards and small mammals in conjunction with drought upon the ecosystem as wellas disturbances, i.e., roads, fire, grading, cratering, and irradiation. From 1992-1993,he served as an Ecologist with the Bureau of Land Management, Las Vegas DistrictOffice, and was transferred to the National Biological Survey in 1993. As a ResearchWildlife Biologist with the National Biological Survey, subsequentlyUSGS/Biological Resources Division (1993-2000), he conducted extensive fieldstudies pertaining to desert tortoise translocation, reproduction, and survivorship.Most recently, he served as the Mojave Desert Tortoise Coordinator for the U.S. Fishand Wildlife Service (2000-2004), initiating rangewide population monitoring usingthe Line Distance Sampling technique. He has authored or co-authored 70 reports,scientific papers, and peer reviewed journal articles pertaining to the ecology ofdesert reptiles and small mammals of the southwestern United States.
1.3 Scientific Evaluation of the Recovery Plan
1.3.1 Recovery Prescriptions from the Recovery Plan
The passage in the following text box is taken directly from the Recovery Plan of 1994.This passage expresses the core of what needs to be compared with current managementand knowledge. The comparison we present in this document is meant to be a scientificevaluation of the Recovery Plan in relation to contemporary knowledge of (a) the biologyof the desert tortoise and (b) the extent to which the Recovery Plan was implemented.

DTRPAC Report page 8
“The desert tortoise was listed as threatened primarily because of a variety of humanimpacts that cumulatively have resulted in widespread and severe desert tortoisepopulation decline and habitat loss. The destruction, degradation, and fragmentation ofdesert tortoise habitat and loss of individual desert tortoises from human contact,predation, and disease are all important factors in the decline of the Mojave population.If the desert tortoise is to be recovered within its native range, the causes of the declinemust stop, at least within the DWMAs. Some factors are likely more important thanothers; for instance, urbanization has probably caused more habitat loss than lightcattle grazing. However, eliminating all factors that are deleterious to desert tortoisepopulations will certainly result in faster recovery than will selective elimination of afew.
Accomplishing the prescribed recovery actions is needed to reduce or eliminatehuman-caused impacts in the recovery units and to implement the recovery strategydescribed in the Recovery Plan.
1. Establish DWMAs and implement management plans for each of the six recoveryunits
a. Select DWMAs
b. Delineate DWMA boundariesi. Reserves that are well-distributed across a species' native range will be more
successful in preventing extinction than reserves confined to small portionsof a species' range.
ii. Large blocks of habitat, containing large populations of the target species,are superior to small blocks of habitat containing small populations.
iii. Blocks of habitat that are close together are better than blocks far apart.iv. Habitat that occurs in less fragmented, contiguous blocks is preferable to
habitat that is fragmented.v. Habitat patches that minimize edge to area ratios are superior to those that
do not.vi. Interconnected blocks of habitat are better than isolated blocks, and
linkages function better when the habitat within them is represented byprotected, preferred habitat for the target species.
vii. Blocks of habitat that are roadless or otherwise inaccessible to humans arebetter than blocks containing roads and habitat blocks easily accessible tohumans.
c. Secure habitat within DWMAs.
d. Develop reserve-level management within DWMAs.
e. Implement reserve-level management within DWMAs.
f. Monitor desert tortoise populations within recovery units.

DTRPAC Report page 9
1.3.2 Topics Addressed in the Scientific Evaluation
The DTRPAC reviewed the Recovery Plan to determine which parts requiredmodification based on new knowledge. As a result of this review, the topics listed inTable 1.1 were addressed. To conduct the topic reviews most efficaciously, thecommittee invited outside experts to help conduct the reviews. This effectively expandedthe panel of experts to very large numbers and provided the expertise needed to conduct
2. Establish environmental education programs.a. Develop environmental education programs.
b. Implement environmental education programs.
3. Initiate research necessary to monitor and guide recovery efforts.a. Obtain baseline data on desert tortoise densities both inside and outside of
DWMAs.
b. Develop a comprehensive model of desert tortoise demography throughoutthe Mojave region and within each DWMA.i. Initiate epidemiological studies of URTD and other diseases.ii. Research sources of mortality, and their representation of the total
mortality, including human, natural predation, diminishment of requiredresources, etc.
iii. Research recruitment and survivorship of younger age classes.vi. Research population structure, including the spatial scale of both genetic
and demographic processes and the extent to which DWMAs andrecovery units conform to natural population subdivisions.
c. Conduct appropriately designed, long-term research on the impacts of grazing,road density, barriers, human-use levels, restoration, augmentation, andtranslocation on desert tortoise population dynamics.
d. Assess the effectiveness of protective measures (e.g., DWMAs) in reducinganthropogenic causes of adult desert tortoise mortality and increasingrecruitment.
e. Collect data on spatial variability of climate and productivity of vegetationthroughout the Mojave region and correlate this information with populationparameters (e.g., maximum sustainable population size, see Appendix G).
f. Conduct long-term research on the nutritional and physiological ecology ofvarious age-size classes of desert tortoises throughout the Mojave region.
g. Conduct research on reproductive behavior and physiology, focusing onrequisites for successful reproduction.”

DTRPAC Report page 10
an extremely thorough review of the Recovery Plan. The expertise brought to bear on thetopics represented the highest level of scientific expertise available. The panel included:
• Elliott Jacobson, DVM, Tortoise disease• Mary Brown, Ph.D., Mycoplasma• David Rostal, Ph.D., Tortoise reproduction• David Thawley, Ph.D., Veterinary epidemiology• Kristin Berry, Ph.D., Desert tortoise biology• Barry Noon, Ph.D., Conservation biology of endangered species• Michael Reed, Ph.D., Conservation biology, population modeling• Jim Sedinger, Ph.D., Population biology• Chuck Peterson, Ph.D., Herpetology, reptile ecology• Mary Cablk, Ph.D., Remote sensing• Ron Marlow, Ph.D., Conservation planning• Ann McLuckie, M.S., Conservation planning• Ray Bransfield, M.S., Conservation planning• Bryan Manly, Ph.D., Statistics (consultant for user groups)• Lyman MacDonald, Ph.D., Statistics (consultant for user groups)
USFWS also invited diverse stakeholders to send representatives as observers to theDTRPAC meetings. Some of those representatives contributed substantively todiscussions or report preparation and review. Representatives and observers included:
• Clarence Everly, Consultant for the Department of Defense• John Hamill, Department of Interior and Desert Managers Group• Rebecca Jones, California Department of Fish and Game• Ron Marlow, Ph.D., Clark County Habitat Conservation Plan• Ann McLuckie, Utah Division of Wildlife Resources• Karen Phillips, U.S. Geological Survey• Lewis Wallenmeyer, Clark County Habitat Conservation Plan• John Willoughby, Bureau of Land Management
After completion of the scientific evaluation, the DTRPAC focused on the followingmajor topics for the report.
1. Distinct Population Segments (DPS) in relation to the Recovery Units designatedby the original Recovery Team. Recovering the Mojave population of deserttortoise in all its diversity (genetic, ecological, behavioral) in relation toconservation challenges is basic to a recovery plan. The concept of distinctpopulation segments was mentioned in the original Recovery Plan, but the distinctpopulation segments were referred to as recovery units. The original RecoveryPlan suggested that genetic resolution of those recovery units was necessary.Research has been conducted since the original Recovery Plan, so this areacertainly needs revisiting by the DTRPAC.
2. Knowledge advances since the listing of the desert tortoise occurred in thefollowing areas: (a) populations and demography, (b) impacts to habitats, (c)

DTRPAC Report page 11
literature, and (d) recovery plan implementation. Ten years have passed since theoriginal Recovery Plan, so new research and conservation planning needed to bereviewed to assess whether new knowledge naturally leads to old conservationprescriptions or whether new knowledge requires new directions in conservationand management prescriptions.
3. Linking impacts, habitat, and demography to recovery (Specific threats and theirmitigations with special attention to impacts resulting from interactions amongindividual threats; the relationships among threats and the importance of disease)The original Recovery Plan attempted to list specific threats and link those threatsto specific places. For 10 years, the identified threats have been the subject of muchdebate and planning. Insofar as some evidence has been that some populations arestill declining, it was clear that threats needed reevaluation.
4. Monitoring, evaluating, and delisting. Monitoring provides the informationnecessary to adapt management. Nevertheless, monitoring has been elusive andcontentious. The ability to monitor rare and cryptic species has always beendifficult, and new approaches to monitoring have been suggested since the originalRecovery Plan.
5. Integrating research needs and management. Numerous research needs werepublished in the original Recovery Plan. Some of those needs have been pursuedvigorously and others neglected. This area needed updating and evaluation in lightof years of experience.
It is important to note that this summary is intended to serve as a “strategic” review ofthe current Plan. Although, we have conducted several new analyses of existing data tounderstand current status better or to illustrate various points, this report primarilyprovides recommendations for consideration in revising and more effectivelyimplementing the Plan.
1.3.3 Overview of Observations from the Assessment
What follows in this report are evaluations of the original Recovery Plan in light ofcontemporary knowledge. Immediately below, we make eight general observations thatbear on difficulties of implementing the original Recovery Plan or of lack of attempt toimplement the original Recovery Plan. The remainder of the report is a more detailedsummary of conclusions from this committee.
The desert tortoise invokes three fundamental challenges in understanding its biologyand managing its recovery: time scale, detectability, and metapopulation structure.
Time Scale – Desert tortoise recovery is fundamentally a demographic problem.Diminished populations require some period of population growth (average lambda> 1.0) to recover. Populations that are stable and secure may fluctuate in size inresponse to local, prevailing conditions, meaning that population growth rate(lambda) will vary around an overall stable mean (lambda = 1.0). However, desert

DTRPAC Report page 12
tortoise natural history is not well suited to demographic analysis using short-termstudy. Individual tortoises grow slowly, take many years to reach sexual maturity,and have low reproductive rates during a long period of reproductive potential. Thismeans that studies of 1-10 years, or even longer, do not necessarily yield data ofsufficient statistical power to reveal population trends.
Detectability – Desert tortoise behavior and morphology make them very difficult todetect and observe. Other than in the Upper Virgin River Recovery Unit, wheretortoise population densities have been high, the personnel and resources necessary toovercome the problem of low detectability have not been appropriate to allow preciseestimates of population size of desert tortoise within the Mojave Desert. If deserttortoise density declines in the Upper Virgin River, even this recovery unit mayultimately suffer from problems of low detectability.
Population paradigm – The original paradigm about how tortoise populations areorganized, and the prescriptions made within that paradigm might be wrong anddangerously misleading. Existing data are consistent with the possibility that tortoiseshave evolved to exist in metapopulations. The original Recovery Plan and the originalparadigm conceived desert tortoises to be distributed in large populations thatrequired large areas and large densities to recover. Metapopulation theory, on theother hand, conceives that tortoises are distributed in metapopulation patchesconnected with corridors that allow inefficient and asynchronous movements ofindividuals among the patches. This paradigm conceives that some habitat patcheswithin tortoise range will have low population numbers or no tortoises at all, andothers will have higher population numbers. Movement among the patches isnecessary for persistence of the “system.” If desert tortoises evolved to exist inmetapopulations, then long-term persistence requires addressing habitatfragmentation caused by highways and satellite urbanization. Indeed, mitigatingabrogations of natural corridors among habitat patches might require activemanagement of tortoise densities in habitat patches.
Desert tortoises face simultaneous, multiple threats. Tortoises face an array of threatsand these threats act simultaneously. This concept is central to recovery, because itportends profound difficulties in formulating effective recovery actions. In particular, amanagement action that alleviates one threat may not yield meaningful recovery,because the deleterious effects of another threat operating simultaneously suppress thegains sought by the original management action. In other words, one threat cannegatively compensate for another threat when threats are simultaneous.
Threats to desert tortoises are interactive and synergistic. The magnitude of thedeleterious effects of one threat can be a function of another threat. For example, ifincreased mortality reduces the lifetime fecundity of a female tortoise by removing thatfemale from the population before she reaches her period of maximum annual fecundity,then deleterious factors to other life stages (e.g., raven predation on neonatal tortoises)may have a greater effect on tortoise demography. Why? The negative effect on neonatesby raven predation, for example, now affects a larger proportion of neonates in thepopulation, because new neonates are not produced when adults are killed. Also, disease

DTRPAC Report page 13
may only be an important contributor to population declines during years of drought or topopulations stressed by invasion of exotic plants or by off-road vehicles or any number ofother stresses. In other words, threats to tortoise populations are complex, because thethreats interact to cause impacts rather than creating impacts just directly.
Recommendations made in the original Recovery Plan for carefully controlledexperiments to generate data and analyses important to monitoring and recoveryhave not been implemented. The original Recovery Plan recommended a suite ofexperimental approaches which, if carried out, could have provided key data andanalyses needed for understanding tortoise population dynamics, especially relevant tomanagement effectiveness, important in guiding current recovery. Many of theserecommendations appear to have been largely ignored. Unfortunately, ten years ofopportunity to collect critical data and perform critical analyses have been diminishedor lost for a variety of reasons.
Much of the data currently available to address tortoise recovery was originallycollected for purposes other than tortoise recovery (hence we are doing meta-analysesusing data of mixed quality to perform analyses that would be more efficacious usingdata from well designed studies). Perhaps for historical reasons, certain tortoise studieshave been carried out more-or-less continuously. For example, permanent study plotshave been used to study demography and biology of tortoises in non-random sites.Various forms of distance sampling have been carried out at mixed levels of magnitudeand intensity. A more efficient approach for the future might be to design studies usingstatistical and scientific expertise expressly to obtain key data to address centralproblems.
Mapping of even poorly collected data reveals very important apparent patterns.Technological advances since the first Recovery Plan have resulted in powerful analyticaltools that bear directly on analyzing and monitoring desert tortoise populations. Inparticular, GIS analyses of data diligently derived from large, disparate data sets thatwere collected by various agencies are yielding intriguing patterns. “Mining” historicaldata and applying powerful new analyses or applying older analyses in new ways will behelpful in prescribing recovery actions. As demonstration of the substantial value of thisapproach, we present several new analyses from existing data. These include (i) a kernelanalysis of spatial distribution of live and dead tortoises, (ii) a cluster analysis of spatialdistribution of live and dead tortoises, (iii) a spatial analysis of the probability of findinglive versus dead tortoises, (iv) a multi-dimensional, multi-scale approach to monitoring,(v) a threats network topology, (vi) a quantitative literature review of all available tortoiseliterature, (vii) a weighted analysis of variance (ANOVA) of tortoise density frompermanent study plots across 24 years, and (ix) a spatial analysis of the implementationof recovery actions from the first Recovery Plan.
No group is charged with managing scientific data on the desert tortoise. Currently,important desert tortoise data are widely scattered among state and federal agencies andthe scientific community. Data have been gathered, organized, and stored in a multitudeof ways. Some data have been reviewed, collated, or otherwise organized. Other data

DTRPAC Report page 14
have not. Accessibility of tortoise data to managers, scientists, and the public is highlyvariable. In short, a great deal of important long-term data cannot be readily used. This isan ineffective data management strategy for species recovery. A new infrastructure forensuring quality, accessibility, and analyses of data is desperately needed. Theseobservations apply equally well to information on and status of recovery actionimplementation.
Scientific information important for recovery is entirely ad hoc. In general, newknowledge acquisition seems frequently to be directed at land-management agencymandates vis-à-vis management decisions. Thus, the limited supply of tortoise biologistsis frequently absorbed into contracts for local issues (e.g., DOD needs for data to complywith NEPA). However, there is a real need to pursue the research agenda outlined in theRecovery Plan of 1994. Some HCPs have scientific oversight and direction, but there isessentially no coordination of the scientific enterprise conducted in different managementunits in a way to get more than accidental accumulation of necessary knowledgeimportant for recovery of the desert tortoise and its ecosystems.

DTRPAC Report page 15
“SScciieennttiiff iicc pprriinncciipplleess aanndd llaawwss ddoo nnoott ll iiee oonn tthhee ssuurrffaaccee ooff nnaattuurree..TThheeyy aarree hhiiddddeenn,, aanndd mmuusstt bbee wwrreesstteedd ffrroomm nnaattuurree bbyy aann aaccttiivvee aannddeellaabboorraattee tteecchhnniiqquuee ooff iinnqquuiirryy..”
John Dewey, Reconstruction in Philosophy. (1920)

DTRPAC Report page 16
2. Quantitative Literature Review: the state of knowledge
The most recent annotated bibliography (Grover and DeFalco 1995) published on deserttortoises (Gopherus agassizii) identified trends in research prior to 1991 and mentionedgaps in knowledge that influenced research prescriptions in the Desert Tortoise RecoveryPlan (1994). The original Recovery Team made several recommendations for researchnecessary to fill information gaps important to the recovery of desert tortoise populations.These items included:
• long-term demography (particularly recruitment and survivorship ofyounger age classes, sources of mortality, and epidemiology),
• population structure (spatial scale of genetics and demography),• long-term analysis of impacts,• effectiveness of protective measures,• spatial variation in climate and vegetation,• nutritional and physiological ecology,• reproductive behavior and physiology, and• restoration, augmentation, and translocation.
The Recovery Plan highlighted the need for long-term studies, which are necessary tocapture temporal variation and ecologically relevant trends. In addition, the RecoveryPlan prescribed research on non-reproductive age classes. Few studies have beenconducted on survivorship or recruitment rates in young Gopherus tortoises due to theircryptic morphology and behavior.
A recent literature review employed a quantitative approach to 1) compare the foci ofresearch before and after the publication of the Recovery Plan, and 2) identify presentgaps in desert tortoise knowledge (Hagerty, Sandmeier, and Tracy in prep.). Availabledesert tortoise literature, obtained by the Clark County Multi-Species HabitatConservation Plan database (1378 total papers), was classified by age class, literaturetype, and one or more research categories (Table 2.1). Contingency table analyses wereperformed to determine differences among the types of research before and after theRecovery Plan was published.
TABLE 2.1 Research categories used in quantitative literature review.
Research Category Relevant topics included in each categoryEcology life history characteristics, demography, ecologyAutecology physiology, behavior, morphologyConservation threats, management, effectiveness of conservation effortsSystematics molecular and morphological systematicsDisease pathology, veterinary procedures, pharmacologyHistory natural history, evolution, fossil record, paleoecologyBibliographies literature reviews and annotated bibliographies

DTRPAC Report page 17
Academic researchers and agency biologists studying desert tortoises communicate theirresults in professional journals, government documents, Desert Tortoise Council (DTC)symposia, and other professional society meetings. Overall, 22% of catalogued deserttortoise literature was published in professional journals. After the Recovery Plan, thepercentage of literature published in professional journals increased, while the percentageof gray literature decreased (Fig. 2.1). The latter result may be an artifact of theavailability of government reports, however there was an increased trend for researchersto publish their results in professional journals.
Fig. 2.1 Distributionof all literature typesbefore and after thepublication of theRecovery Plan.
Further, professional journal documents were dominated by autecological research, whileother documents contained mainly conservation and ecological studies ( 2 = 154.115, df= 6, p<0.0001) (Fig. 2.2). This result may suggest a dichotomy of research being donewithin agencies and academia, respectively. Tortoise conservation studies consistedmainly of descriptions of threats to tortoises and how these threats are being managed.Population density and habitat studies, which are typically performed by governmentagencies, are alsoincluded in the grayliterature category.
Fig. 2.2 Distributionof literature amongthe major researchcategories.

DTRPAC Report page 18
The Recovery Plan prescriptions for future research did appear to have a limited impacton desert tortoise research. After the Recovery Plan was published, more documents inprofessional journals focused on ecology and implementation of conservation, with acontinued emphasis on autecology ( 2 = 25.88, df = 5, p<0.0001) (Fig. 2.3). A change inthe distribution of gray literature corresponding to the publication of the Recovery Planwas marginally significant ( 2 = 13.49, df = 7, p<0.06).
Fig. 2.3 Distribution of professional journal literature in the research categories before and afterthe publication of the Recovery Plan. The proportion of Recovery Plan prescriptions associatedwith each major research topic are included for comparison with the distribution of professionaljournal literature.
Since the Recovery Plan was published, there has been considerable research on someaspects of tortoise biology, in particular nutritional ecology, reproductive physiology, andthe effects of several specific impacts on tortoise populations. However, very littleresearch has been published on other recommended topics, such as long-termdemography, the effectiveness of recovery actions, translocation (but see below), andclimatic and vegetative variability. Virtually no research has been conducted or publishedon other important topics, such as epidemiology and many long-term impacts on tortoisepopulations. Some additional areas that have been the topic of active research yet werenot identified in the Recovery Plan prescriptions, include disease and health status,habitat conditions, and fire ecology. In the case of disease, recent studies have focused onpathology instead of the focus on epidemiology that was prescribed by the RecoveryPlan. These new areas of research are important and may need to be continued at somelevel, however not in place of the recovery plan recommendations.

DTRPAC Report page 19
Research prescriptions in the Recovery Plan also emphasized the need for research onimmature age classes within the categories of ecology and autecology. In particular, theRecovery Plan recommended research on recruitment and survival rates of non-reproductive age classes and their nutritional and physiological ecology. After theRecovery Plan, an increase in the percentage of studies on immature age classescorresponded to general prescriptions in these areas, suggesting that the Recovery Planprescriptions were followed (Fig. 2.4). However, no studies included in the analyses wereconducted that focus specifically on recruitment and survival of young age classes. Aquantifiable deficiency in knowledge of the ecology of non-reproductive tortoisesremains a missing link to understanding desert tortoise population structure anddynamics. Literature on early life stages is under represented in all age-relevantcategories, with only 5% of documents focusing exclusively on immature life stages.
Fig. 2.4. Percent ofearly life stagedocuments inprofessional journalsthat focused on ecologyand autecology.
Implementation of effective management strategies to recover the Mojave population ofthe desert tortoise requires an accurate characterization of population structure, threats topopulation persistence, and the effectiveness of protective measures. Determining lifehistory characteristics, such as age-specific survivorship, is critical and requires largesample sizes and long study periods. In addition, hypothesis-based experiments on thelong-term effects of recovery actions are also necessary. These gaps in knowledge wereidentified in the Recovery Plan, have not been addressed, and remain importantprescriptions for research.
2.1 Translocation
There were many topics for research recommended by the Recovery Plan that have beenthe subject of active research and publication over the last decade. Translocation of deserttortoises has recently come to the forefront because of the impending expansion of Ft.Irwin in the West Mojave and the continued urbanization of the Las Vegas Valley.
0
5
10
15
20
Ecology Autecology
Early life s
tage journ
al docum
ents
(%
) Pre recovery plan
Post recovery plan

DTRPAC Report page 20
Because no peer reviewed papers on recent research on translocation of desert tortoiseshave been published yet on this topic, and at the request from several reviewers of thedraft DTRPAC report, we include a brief synopsis of recent translocation studies here.Translocation was regarded by the Recovery Team as both a threat and as a potentialconservation measure to mitigate take of tortoises, to augment depleted populations, andre-colonize extirpated populations (USFWS 1994).
Prior to the publication of the Recovery Plan, few studies of the effects of translocationon desert tortoises had been conducted, and no study was extensive enough to evaluatetranslocation as a conservation tool for this species. The results of previous efforts aregenerally reported in government documents (Berry 1974, Berry 1975, Berry 1976), asanecdotes (e.g., see Cook et al. 1978), or unpublished accounts (Crooker 1971, Bryan andWest 1972, McCawley and Sheridan 1972, Cook et al. 1978, Corn 1991, SAIC 1993).Because of the dearth of literature on translocation of desert tortoise, the potential forsuccess of translocation in this species had not previously been thoroughly examined, andas a result translocation as a tool for conservation has remained controversial (Berry1986, Dodd and Seigel 1991, USFWS 1994). Nevertheless, the Recovery Plan recognizedthe potential of the technique for augmenting populations with tortoises taken outside ofDWMAs, and the plan recommended that more thorough research on translocation beconducted.
The definition of success of translocating a species is typically taken to be the ability ofthe translocated or augmented population to become self-sustaining in the long-term(Griffith et al. 1989, Dodd and Seigel 1991, Fisher and Lindenmayer 2000). Success,however, may be measured at several temporal scales, which may be importantprecursors to judging the long-term success of a translocation program (Tasse 1989,Dickinson and Fa 2000, Fisher and Lindenmayer 2000). For example, there may be somelevel of initial mortality above which a translocation study is judged to be unsuccessful(Platenberg and Griffiths 1999). In addition, other goals may be used to judge success inthe short-term, such as the colonization of a particular site (Lohoefener and Lohmeier1986), the social integration of translocated animals into the existing population (Berry1986, Reinert 1991), and the ability of the animals to find mates and reproduce (Berry1986, Pedrono and Sarovy 2000).
Extensive translocation studies have been conducted in Nevada and Utah that quantifiedsurvivorship, growth, pre-release conditions, reproduction, microhabitat use, andmovements (one index of behavior, which can be especially important to land-managementdecisions) of translocated and resident animals in six locations spanning elevations from500 to 1500 meters (Field 1999, Field et al. 2003, Nussear 2004, Nussear et al. in prep.).These projects included tracking more than 300 tortoises (resident and translocated) forseveral years. Some tortoises were translocated to habitats with vegetation not normallyassociated with desert tortoise populations (in order to assess the mechanistic determinantsof geographic range in tortoises). Some tortoises were translocated into areas cleared of anyresident tortoises and some into areas containing populations with resident tortoises (toassess the effect of translocation both on the animals translocated and on the tortoisesalready present in the habitat). Some translocated tortoises were formerly pet tortoises

DTRPAC Report page 21
moved from urban settings to wild locations, and some tortoises were wild tortoisestranslocated from one wild location to another (to assess the potential to repatriate tortoisesthat had been removed from the wild for long periods prior to their release into the wild).Tortoises were translocated into the wild in three seasons of the year (in order to assess theextent to which season predicts success in translocation) (Field et al. 2003). Only tortoisescertified as not having an immune response to Mycoplasma agassizii were translocated, andall areas studied had populations with resident tortoises having immune responses toMycoplasma agassizii.
In general, translocated tortoises had the same survivorship and reproductive success asresident animals. This result was the same in drought years and in El Niño years.Tortoises moved to atypical habitat generally moved until they reached habitat morecommonly associated with desert tortoise presence. Even when desert tortoises weretranslocated into typical tortoise habitat, they tended to move greater distances in the firstyear after translocation, but their movements in the second year were indistinguishablefrom resident tortoises. Knowing how translocated tortoises displace after translocation isnecessary in order to plan for any needed fencing of managed areas, or to determine thesize of translocation release areas. Important in any of these measures of success arecomparisons between translocated and resident animals in the area. This allows the effectof translocation to be statistically separated from factors normally expected in residentpopulations in particular areas.
The results of these translocation studies indicate a very optimistic potential for success intranslocating individual tortoises in a wide variety of circumstances. The mortalitydocumented in previous translocation experiments on desert tortoises was largely becauseanimals were translocated during the most stressful thermal environments of the year (e.g.,when the weather is stressfully hot). The results of these recent studies suggest that bothwild and pet tortoises can thrive and reproduce after translocation. These results alsosuggest that it is necessary to plan for translocated tortoises to move great distances in thefirst year after translocation. It is especially important to recognize that tortoises cannot bemoved to unnatural habitats and expected that the tortoises will remain in those habitats(unless confined by fencing). Indeed, the fact that tortoises do not accept beingtranslocated to atypical habitats suggests that some needs for the tortoises are only met inmore typical habitat.
Knowing that it is possible to translocate tortoises successfully is important inconservation planning. Translocation should not be substituted for habitat protection as aconservation measure, but translocation can be important as a means to supplementexisting populations that may have declined abnormally (e.g., in regions formerly heavilyused by recreationists or by construction projects such as gas pipelines, etc.).Translocation can be used to create new populations in areas where populations areknown to have existed in the historic past, however, creating new populations alwaysshould be regarded as experiments until the reasons why historic populations are absentare known and logic and science suggests that a new population can thrive in the area.Future translocations could be used as an experimental tool to assess the effects of certain

DTRPAC Report page 22
management prescriptions (e.g., fencing, ablation of cattle grazing, reducing the densityof unpaved roads, etc.).
The remaining cautions, vis-à-vis translocation, are that the process of translocation maydisrupt community interactions and that the impacts of those alterations might be difficultto predict. In other words, we know that individual and population responses totranslocation are generally benign and suggest that translocation can be an effective toolin the conservation arsenal for a land manager, but we do not yet know all that is neededabout community interactions potentially modified by translocation. Thus, translocatingtortoises into an area containing, for example, a strain of pathogen that is foreign to thetranslocated tortoises may alter the balance between host-pathogen relationships in waysthat might not be easily predictable and potentially dangerous. Thus, additional researchis needed to increase our understanding of host-pathogen relationships and othercommunity-level interactions (e.g., competition, predator-prey, pathogen, etc.) to supportcarefully considered translocation programs.
Translocation Recommendations
• Translocation should not be substituted for habitat protection as a conservation measurebut rather as a last resort to mitigate the take of displaced animals.
• Translocation can be used to supplement or augment depleted populations, but alltranslocations should be conducted as an experiment with research to ensure that thethreats originally causing the depletion have been removed.
• Translocation can be used as an experimental tool to assess the effects of certainmanagement prescriptions, or to assess the presence of threats that affect thepopulation.
• Translocated animals are likely to have large movements in the first two years. Iftortoises are translocated near roads with high traffic volume, these roads should befenced. In addition, if the goals of the translocation project are to retain animals in arelatively small area, then experimental fencing should be used for a few years as givenin the translocation guidelines (Recovery Plan Appendix B).
There are seven guidelines for translocation given in the Recovery Plan (see appendix B).These guidelines, while well intentioned have little chance of all being appliedsimultaneously. The use of these guidelines requires the knowledge of measures that arecurrently unavailable, or have poor precision for desert tortoises such as historic densitiesand carrying capacity. We recommend that these guidelines be revisited in light of recentinformation on translocation in desert tortoises, and in light of the consideration ofrealistic management constraints and conditions where translocations are likely to occur.

DTRPAC Report page 23
A summary of each guideline with commentary on its applicability is given below.
Guideline 1 “Experimental translocations should be done outside experimentalmanagement zones. No desert tortoises should be introduced into DWMAs—at leastuntil relocation is much better understood.”
• Unless experimental management zones, or other areas within DWMAs can be usedfor translocation, translocated tortoises cannot be assured protection into the future.This is particularly important when long-term conservation of translocatedpopulations comes into conflict with changes to the environment by humans such asurbanization or flood control projects.
Guideline 2 “All translocations should occur in good habitat where the desert tortoisepopulation is known to be substantially depleted from its former level of abundance.Translocation of reproductively competent adults into depopulated areas can havebeneficial effects on population growth. Before population growth can occur, however,individuals must establish home ranges and enter into any existing social structure.Desert tortoises should be periodically evaluated against a defined health profile(proportional weight/size, fecal scans, and blood panels).”
• These criteria have two possible limitations. First it tacitly assumes an explicitknowledge of the former abundance of animals (this is usually unavailable for mostof the listed range of the tortoise). Second, if this guideline is strictly followed, thentortoises displaced from an area could be translocated to areas where tortoises couldhave different population composition.
Guideline 3 “Areas into which desert tortoises are to be relocated should be surroundedby a desert tortoise-proof fence or similar barrier. The fence will contain the deserttortoises while they are establishing home ranges and a social structure. If the area is notfenced, past experience suggests that most animals will simply wander away from theintroduction site and eventually die. (Fencing is not cheap; estimates range from $2.50 to$5.00 per linear foot). Once animals are established some or all of the fencing can beremoved and probably reused.”
• The final sentence of this guideline has not been scientifically evaluated. The goals ofeach proposed translocation should be considered individually. If one of the goals of atranslocation program is to populate a specific area, then fencing the area may bedesirable (but should be tested scientifically). If however the goal is to move tortoisesto a non-specific area, such as a large valley, then fencing may be impractical, andun-necessary.
Guideline 4 “The best translocations into empty habitat involve desert tortoises in all ageclasses, in the proportions in which they occur in a stable population. Such translocationsmay not always be possible, since young desert tortoises are chronically underrepresentedin samples, often due to observer sampling error, and may now actually beunderrepresented in most populations due to poor recruitment and juvenile survivorship

DTRPAC Report page 24
during the last several years. Desert tortoises smaller than the 7-year age-size class areparticularly vulnerable to predation and may be a poor investment for translocation,unless predator exclusion (fencing, for example) is incorporated into such endeavors.Mature females would probably be the best sex/age class to introduce into below carryingcapacity extant populations because of their high reproductive value (low potentialmortality, high potential fecundity for many years).”
• This guideline seems to provide different recommendations. First it recommends thatthe best case would be to translocate all size classes, but it also suggests that juvenilesmay be a poor investment. Fencing of translocated tortoises is recommended as aprotection from predation but this has not been confirmed. It is unlikely that mostpredators would be excluded using fencing, and juveniles have been reported to sufferfrom avian predation from ravens and other large birds. The concept of carryingcapacity may not be appropriate for desert tortoise, and it would be extremelydifficult to measure. It is difficult to reconcile the reportedly high tortoise densitiesprior to the 1980s with the concept of carrying capacity.
Guideline 5 “The number of desert tortoises introduced should not exceed the pre-decline density (if known). If the pre-decline density is not known, introductions shouldnot exceed 100 adults or 200 animals of all age classes per square mile in category 1habitat (Bureau of Land Management designation for management of desert tortoisehabitat) unless there is good reason to believe that the habitat is capable of supportinghigher densities. Post-introduction mortalities might be compensated by subsequentintroductions if ecological circumstances warrant this action.”
• Caution should be used if persistent post-introduction mortality continues over longperiods of time. This may signal that threats originally causing are still present. Ifthreats persist, the situation should be considered an opportunity to more about theimportance of threats.
Guideline 6 “All potential translocatees should be medically evaluated in terms ofgeneral health and indications of disease, using the latest available technology, beforethey are moved. All translocatees should be genotyped unless the desert tortoises are tobe moved only very short distances or between populations that are clearly “genetically”homogeneous. All translocated animals should be permanently marked, and most shouldbe fitted with radio transmitters so that their subsequent movements can be closelytracked.”
• The application of radio transmitters should depend on the experimental design of thetranslocation project, and the questions that are to be asked of the translocatedanimals. If, for example, the study is to be used for the sole purpose of measuringlong-term population genetics, then the costs and the intensive labor required tomonitor all of the translocated animals monthly are probably not warranted.

DTRPAC Report page 25
• All translocations should be guided by a genetic management plan. Such a plan willhelp to ensure that translocated individuals are moved conservatively amongpopulations that are genetically similar.
Guideline 7 “If desert tortoises are to be moved into an area that already supports apopulation—even one that is well below carrying capacity—the recipient populationshould be monitored for at least 2 years prior to the introduction. Necessary data includethe density and age structure of the recipient population, home ranges of resident deserttortoises, and general ecological conditions of the habitat.
Areas along paved highways can serve as good translocation sites, if properly fenced.Many such areas support good habitats, but vehicle-caused mortalities and/or collectinghave substantially reduced or totally extirpated adjacent desert tortoise populations. Anytranslocation sites should be isolated by a desert tortoise barrier fence or similar barriernext to the highway or road. The purpose of fencing the highway is obvious—to keeptranslocated animals from being crushed by vehicles on the road. However, fencing theother sides of the translocation area is critical for establishment. If a fenced area or stripof habitat approximately 0.125 to 0.25 mile wide is established along highways, sometranslocatees should establish home ranges and a social structure within this strip. Whenthe inside fence is removed, the translocated desert tortoises and those from the extantpopulation farther away from the road will eventually expand their home ranges into theremaining low-density areas. A second reason for inside fencing is to prevent anydiseased, but asymptomatic, desert tortoises from infecting nearby, healthy populations.In the event that disease is an issue and a resident population is present nearby, doubleinside fencing should be considered."
• Guideline 7 appears to address two topics. The first topic (monitoring residents)should be the focus of an experiment and not a criterion for all. As with guideline 6,the conditions of this monitoring should be guided by the experimental design foreach specific translocation project.
The second part of this guideline seems overly specific and speculative. While it istrue that habitat reclaimed by fencing of major highways could provide receptivehabitat, it is unknown if the threats associated with traffic are alleviated by fencing.For example, are tortoises affected by air pollution from traffic, or are ravenpopulations artificially elevated near highways due to the presence of trash, and otheranimals killed on the road? Until these and other questions are answered theconditions of this guideline may constitute a sound research suggestion not a routineguideline.

DTRPAC Report page 26
“IIff EEiinnsstteeiinn hhaadd ttoo ggoo tthhrroouugghh aall ll tthhaatt iiss nneecceessssaarryy ttoo ddoo sscciieenncceettooddaayy,, wwhhoo kknnoowwss wwhhaatt ‘‘ee’’ wwoouulldd eeqquuaall..”
President Josiah Bartlett, West Wing. (2003)
DTRPAC Report page 27
3. Distinct Population Segments
3.1 Definition and intentions of Distinct Population Segments
Given the Endangered Species Act’s definition of “species” to include “any distinctpopulation segment of any species of vertebrate fish or wildlife which interbreeds whenmature,” the 1994 Recovery Plan identified six recovery units of the Mojave populationof the desert tortoise. These recovery units were identified under the concept ofevolutionary significant units (ESU), as described by Waples (1991) and Ryder (1986),but a specific policy on how distinct population segments (DPS) would be defined andapplied would only be formally proposed six months after the publication of the Plan(USFWS and National Oceanic and Atmospheric Administration 1994). A final policywas published in 1996 (USFWS and National Marine Fisheries Service [NFMS] 1996).
Two issues arise from the identification of recovery units as DPSs or ESUs prior to afinal DPS policy. First, the current policy identifies specific criteria that must be met indefining a DPS. The current recovery units need to be evaluated in light of these criteria.Second, the Recovery Plan stated that each recovery unit, considered to be separateDPSs, may be individually delisted upon meeting the recovery criteria listed in the Plan.However, DPSs must be designated through a formal listing (or delisting) process.Because the tortoise was listed as a single population throughout the Mojave Desert(USFWS 1990), recovery units may not now be individually delisted without formal DPSdesignation. This chapter addresses these two issues.
3.1.1 Background
USFWS and NFMS (1996) defined DPSs based upon three elements for recognizingindividual sub-populations of a single species for differential protection under theEndangered Species Act (ESA):
(1) discreteness of the population segment in relation to the remainder of the species towhich it belongs,
(2) significance of the DPS relative to the species to which it belongs, and
(3) conservation status of the population in relation to the ESA standard for listing.
The criterion of discreteness must be satisfied as prerequisite to recognizing both thephysical existence (= geographical reality) and the biological/conservation significance(criteria #2 and 3) of a proposed DPS. The Congressional intent of the DPS provision ofthe ESA was that “the interests of conserving genetic diversity would not be well servedby efforts directed at either well-defined but insignificant units or entities believed to besignificant but around which boundaries cannot be recognized” (U.S. Court of Appeals,Ninth Circuit 2003).
DPSs and ESUs were until 1994 largely equated with one another and are still treated assynonyms by NMFS. Since 1994, ESU has become much more narrowly defined in the

DTRPAC Report page 28
discipline of comparative biology, where it is most often used. Typically, ESU refers toconspecific populations that are distinguishable by substantial and mutuallymonophyletic differences in their mitochondrial or nuclear DNA sequences (Moritz 1994,2002; see also its use by Avise 2000), differences sufficient to reflect past geographicalisolation by “vicariance events” (Berry et al. 2002). Currently only NMFS still utilizes anarrow, genetic definition to designate DPS status, most prominently for salmonid fish(Pennock and Dimmick 1997) and fresh water mussels (Nammack 1998). For most taxa,both Services apply the much broader definition of DPS, provided above, for reasonsreviewed by Pennock and Dimmick (1997). In terms of legal policy, agency and courtprecedence, and practicality, it is the broader definition of DPS that is particularlyappropriate for defining subdivisions of the desert tortoise (Berry et al. 2002). Regardlessof the historical divergence of ESU from the broader DPS, these concepts share acommon objective of conserving genetic diversity and divergent evolutionary trajectories,whether these trajectories are demonstrated specifically through DNA (ESU sensustricto) or inferred through both direct and indirect evidence (DPS sensu lato). In somesense, these units replace the poorly defined and highly subjective anachronism ofsubspecies (Frost and Hillis 1990, Frost et al. 1992). Influenced in part by the traditionaluse of morphology, and more recently genetics, in defining subspecies, USFWS andNMFS cite the use of these lines of evidence as appropriate parameters by which todefine DPSs. However, these criteria were not to exclude other important information.
The expressed Congressional intent was that differential protection of DPSs be applied“sparingly” to avoid important losses of genetic diversity. While genetics is generallyrecognized as the primary determinant of distinction, the definition and precedent use ofDPSs for the ESA allows genetic, and by extension, evolutionary significance, to beinferred from other parameters. Even compelling differences in conservation status amongsubdivisions of a species may be invoked both to define and justify a DPS (e.g.,differential conservation across international boundaries).
Difficulties in the application of the term DPS largely hinge on the following questions.
(1) What degree of genetic/evolutionary distinctness, either demonstrated or inferred,justifies DPS designation for a specific spatial entity as “discrete”?
(2) What degree of ecological or behavioral differentiation, conservation status, and/orinternal homogeneity would make a DPS significant?
(3) To what extent do our existing databases for the desert tortoise subpopulations northand west of the Colorado River make it possible to discern distinctness anddocument both ecological significance and conservation status?
3.1.2 Discreteness
Resolution of the issue of discreteness is the first requirement in the justification of a DPS.A population may be considered discrete if 1) it is markedly separated from otherpopulations of the same taxon as a consequence of physical, physiological, ecological, orbehavioral factors, which may be evidenced by genetics or morphology, or 2) it isdelimited by international boundaries within which significant differences in control of

DTRPAC Report page 29
exploitation, management of habitat, conservation status, or regulatory mechanisms exist(USFWS and NFMS 1996). Determining discreteness is intrinsically challenging, becauseit involves diverse criteria, subjective judgments about degrees of distinctness, and aperspective from comparative biology that places discreteness in context of its particulartaxonomic unit. The difficulty of determining distinctness has been exacerbated by thehistorical commingling of terms like DPS, ESU, and Recovery Unit as in the 1994Recovery Plan (Pennock and Dimmick 1997, Berry et al. 2002). Furthermore only coreareas of most DPSs are resolved by current databases; discrete borders of DPSs are lesseasily delineated (see McLuckie et al. (1999) for illustration of the complexity of evenusing the Colorado River as boundary).
Discreteness traditionally has referred to reproductive isolation from other conspecificpopulation units (Nammack 1998). Yet, by definition, DPS units are recognized asconspecific, so reproductive isolation may be less than complete reproductiveincompatibility. Reproductive isolation may be based on geographical, ecological,physiological, or behavioral difference(s), and quantitative genetics or morphology maybe used as evidence of such difference(s). Although quantitative genetics is an arbiter toassist determination of discreteness (e.g., Spidle et al. 2003), other evidence ofreproductive isolation may be considered (e.g., Haig et al. 2002), especially in the contextof current policy definition of DPS. In the case of the desert tortoise, quantitativebiochemical/genetic information is available (Rainboth et al. 1989, Britten et al. 1997,Lamb and Lydehard 1994, and McLuckie et al. 1999), and it should be used as theprimary database.
A second obvious source of comparative data is morphology. Morphological/meristicdifferences are traditional tools of taxonomists. Indeed, virtually all chelonian species andsubspecies have been defined almost exclusively in terms of morphology. Such evidencemay be misleading, especially at the subspecies level, particularly given the susceptibility oftortoise shell ontogeny to environmental factors (e.g., diet, seasonality, temperature regimes,etc., see Berry et al. 2002 and Jackson et al. 1976) that are not heritable. If, however,reproductive isolation is not detected because of incompleteness of genetic or morphologicalsampling, recentness of the isolating mechanism, anthropogenic translocations ofindividuals, or other reasons, then a case may be made for (1) additional quantitative geneticsampling in specific locations and/or (2) recognition of a DPS based on other criteria.However, such designations would be difficult justify, because they would require extensiveknowledge of organism-environment interactions (actually it might well require moreknowledge than we are able to obtain within the foreseeable future).
The more generous definition in current use by USFWS (Pennock and Dimmick 1997)conveys “discreteness” to DPS units using criteria that would not justify discreteness in aliteral evolutionary sense, but which are very relevant both to the conservation of specieslike the desert tortoise, in particular. Examples include recognizing populationsfragmented or isolated by international boundaries and those demonstrating markedphysical, physiological, ecological, or behavioral differences. Behavioral and ecologicaldifferences among populations may be used both to infer genetic/reproductive isolation

DTRPAC Report page 30
and to establish the ecological significance of a proposed DPS, but the two concepts areso intertwined that they will be discussed together in the following section.
In most cases, only DPS core areas may be defined but their boundaries are rarelydiscerned. Both spatially inadequate and genetically incomplete sampling precludes theresolution of such boundaries. This task needs to be addressed for many reasons, butespecially when new DPS units are being subdivided from old, or when a pre-existingunit is subsumed into another.
3.1.3 Significance
Ecological and behavioral criteria need to be considered under the current definition ofDPS. Genetic evidence generally comes from small samples of the genome of thespecies, and phenotypic differences in ecology and behavior also can provide evidence ofgenetic distinctness. Ecological differences help establish the “significance” ofdifferences among populations. Thus, if a sub-population already has been demonstratedto be genetically “distinct,” when should it be considered ecologically “significant”? TheUSFWS and NFMS (1996) determine the significance of a discrete population byconsidering the following non-exclusive factors.
(a) Persistence of the discrete population segment in an ecological setting unique orunusual for the taxon.
(b) Evidence that loss of the discrete population segment would result in a gap in therange of a taxon.
(c) Evidence that the discrete population segment represents the only surviving naturaloccurrence of a taxon that may be more abundant elsewhere as an introducedpopulation outside its historic range.
(d) Evidence that the discrete population segment differs markedly from otherpopulations of the species in its genetic characteristics.
A “significant” subdivision refers to evolutionary legacy. Thus, a DPS should eitherrepresent an independent component in the evolution of the species (Nammack 1998) oran irreplaceable component in the conservation of the species in its full diversity(Pennock and Dimmick 1997).
What would be convincing ecological evidence that a DPS represents an independentevolutionary component or irreplaceable component in the conservation of a species? Wepropose that an important piece of evidence would be a difference in life history trait(s)such that individuals in the putative DPS may be affected differently from individualselsewhere when faced with the same threat(s) to population persistence. Unfortunately, thiscriterion is not independent of existing threat(s) because data prior to the existence ofthreats are lacking. Thus, a more tractable criterion might be difference(s) in life historytrait(s) such that individuals in the putative DPS may be affected differently fromindividuals elsewhere when faced with new threat(s).

DTRPAC Report page 31
Life history traits are adaptations influencing survivorship and reproduction. Theseadaptations include age and size at reproductive maturity, length of reproductive life, clutchsize and size of hatchlings, number of clutches per year, sex ratios, mating systems andsperm storage, etc. Differences in these traits are the result of selection in differentenvironments. Thus, life-history theory predicts that when stochastic selective pressuresdifferentially select against young tortoises, then there should be life-history adaptations toincrease the length of reproductive life of adults. Alternatively, when stochastic selectivepressures differentially select against adult tortoises, then there should life-historyadaptations to produce larger clutches of eggs. When there are differences in life historiesamong populations, and when there are threats to a sensitive species, then the adaptationsto environments can be inadequately matched to environments. Thus, the life-history traitsmost likely to contribute to the evolutionary independence of a sub-population are thosethat reflect the adaptation to place and contribute to ecological success.
Sometimes an understanding of these important life-history traits can be captured with asmall number of population-level attributes. For example, age-specific mortality rates,clutch size and number of clutches each year, bodily growth rate, body size atreproductive maturity, and primary and secondary sex ratios (e.g., Tanner 1978). Morerecently, ecologists have been able to infer much of importance in ecological attributescontributing to the evolutionary independence of a sub-population from genetics,dispersion and dispersal, and size and arrangement of habitat patches (see Krebs 1994 andRicklefs and Miller 1999). A fundamental list of population-level attributes for monitoringspecies recovery would be very similar and include population size, demographic rates,mode of reproduction, and age at sexual maturity (e.g., Hoekstra et al. 2002).
Even though the information needed to understand the basic ecology of a species isreasonably clear, lack of knowledge about the basic biology of rare species often plaguesrecovery plans (Tear et al. 1993, Schemske et al. 1994, Crouse et al. 2002). While suchinformation is largely lacking or inadequate to characterize existing DPS units within thethreatened Mojave tortoise population, a robust set of life-history characteristics, bothstable and pronounced in their differences, distinguish the Mojave desert tortoise from itscounterpart in the Sonoran desert. The degree of isolation between populations east andwest of the Colorado River correlates well with parallel genetic data used to separate thetwo currently conspecific groups of populations (Lamb and McLuckie 2002). For thisreason, we do not entirely discount the eventual discovery of similar, if less pronounced,life history differences within Mojave tortoise populations.
With the list of important population-level attributes in hand, we are in a position todevelop a hierarchy of ecological evidence that can be used to determine if a putativeDPS actually represents an independent evolutionary component. A suggested listfollows, arranged from the most- to the least-convincing evidence.

DTRPAC Report page 32
Direct Life-History Measures:
(a) survivorship(b) fecundity (clutch size and frequency)(c) dispersion rates(d) seasonality of mating and hormonal cycles(e) size at reproductive maturity(f) bodily growth rate and sex ratio
Ecological/Demographic Indicators:
(a) age distribution/size distribution(b) population growth rate(c) sex ratio/mating system(d) age at sexual maturity/generation time(e) reproductive value (per age class)(d) body size/number of clutches/timing of reproduction(e) population density
Possible Environmental Correlates:
(a) vegetation – both for diet/shelter(b) rainfall(c) soils(d) burrow size, shape, and orientation; hibernacula(e) other habitat variables (slope, proximity to ephemeral water channels, etc.)
At least three caveats accompany this list. (1) Short- and long-term variability in any ofthese measures, indicators, or correlates could be important in concert with each other orindependently. (2) It is not likely that direct demographic measures will be available fromthroughout a putative DPS, so establishing boundaries may require use of indicators andcorrelates, once their relationships to direct demographic measures have been established.Likewise, the establishment of long-term (10-20 year) study sites could verify correlates(they could even serve to ”ground truth” remote sensing inferences). (3) Standardstatistical techniques can be used to establish significant differences in any of thesemeasures, indicators, or correlates between locations.
3.1.4 Conservation Status
The conservation status of the species, as measured by the five listing factors identified inSection 4 of the ESA, provides final justification for its legal protection as a discrete andsignificant entity (i.e., DPS). Particularly germane to desert tortoise populations, so manyof which are differentially affected by upper respiratory tract disease and other healththreats, is the fact that health status should be used to recognize an individual populationas discrete and significant (Pennock and Dimmick 1997).

DTRPAC Report page 33
The emphasis on threat(s) is further re-enforced by recent evaluations of recovery plans.These evaluations have led to several recommendations for improving the use of sciencein recovery plans (Clark et al. 2002). These recommendations include: (1) make threats aprimary focus, (2) specify monitoring tasks for species status and recovery tasks, (3)ensure that species status-trend data are current, quantitative, and documented.
3.2 DPSs of the Desert Tortoise
3.2.1 Reappraisal of 1994 Recovery Units
The 1994 Recovery Plan identified six Recovery Units (Fig. 3.1): Northern Colorado,Eastern Colorado, Upper Virgin River, Eastern Mojave, Northeastern Mojave, andWestern Mojave. The current Recovery Units represent appropriate hypotheses ofdiscreteness. Certainly all of the Desert Wildlife Management Areas (DWMAs) withinthese recovery units are valuable to the conservation of the desert tortoise. However, eachof the Recovery Units must be reviewed under the more current and elaborate definitionof DPS provided above.
How well justified are these recovery units in terms of modern application of DPSs:should some be split, merged, or eliminated? At the species-wide scale, major differencesin genetics, morphology, ecology, and behavior separate Mojave, Sonoran, and Sinaloanassemblages of the tortoise (Woodbury and Hardy 1948, Burge 1977, Jennings 1985,Turner et al. 1986, Weinstein and Berry 1987, Lamb et al. 1989, Glenn et al. 1990,Germano 1993, Lamb and Lydehard 1994, Wallis et al. 1999, Averill-Murray et al.2002a, Averill-Murray et al. 2002b, Averill-Murray 2002a,). These major geneticassemblages were resolved with a parsimony approach, using relative mitochondrialDNA differences exhibited by the other North American tortoise species (Lamb et al.1989). Recognizably different shell morphology between populations east and west of theColorado River corresponds to the two described assemblages north of Mexico(Weinstein and Berry 1987). Each assemblage occupies a unique ecological setting(Berry et al. 2002). There is overwhelming support from several facets of science, whichpoint to a clear separation between the Mojave and Sonoran assemblages of the deserttortoise. Within the Mojave assemblage, finer-scale genetic, morphological, ecological,and behavioral differentiation has been acknowledged in the Desert Tortoise RecoveryPlan (USFWS 1994).
The Western Mojave, Eastern Colorado, Northern Colorado, and the eastern end of theEastern Mojave recovery units have poor justification as separate DPSs from each other,despite the geographical importance of their DWMAs, based on current genetic data(Lamb et al. 1989). Currently, the Eastern Mojave Unit combines distinctive Californiaand Nevada haplotypes. We expect the Western Mojave Recovery Unit to be geneticallydiscrete from other units, but additional research needs to be conducted to confirmgenetic differences. Tortoises in the western Mojave Desert produce relatively largereggs, produce fewer eggs overall, and lay their second clutches later than tortoises in theadjacent eastern Mojave Desert (Wallis et al. 1999). Behaviorally, western Mojave

DTRPAC Report page 34
tortoises are much less active during summer than in other recovery units. Extremelywinter-dominant rainfall and resultant effects on the vegetation community, as well as itsposition on the western end of the distribution, contribute to the significance of thisrecovery unit (USFWS 1994). Furthermore, range reduction already observed at thewestern edge of the species’ distribution (Bureau of Land Management et al. 2003, Map3-10) contributes to the significance of this putative DPS on the basis of the gap in therange that would be created by the loss of the DPS if not recovered.
Fig. 3.1. Depiction of recovery units proposed in the 1994 Recovery Plan. Green outlines withinthe recovery units are proposed DWMAs.

DTRPAC Report page 35
The entire complex east of the Baker Sink needs more data and analyses, as well ascomprehensive reevaluation in terms of genetic diversity and ecological geographicboundaries. An attractive division line for the Western Mojave Recovery Unit runs alonga line from Saline Valley in California in the north, then south through Death Valley,Silurian Valley, Baker Sink, and Cadiz Valley. It is particularly attractive because thelower elevations and extremely hot climates along this line divides the ecological westernMojave Desert with its quite variable winter-spring precipitation regime, lowerelevations, and Mojave River hydrology, from the more eastern Mojave Desert, subject tomore predictable winter and summer monsoon precipitation, more variable elevations,and closed basin and Colorado River hydrology. Rainfall pattern differences (Fig. 3.2)
induce profound vegetation differences, forage, and possibly reproductive differences(seasonality of mating, egg clutch size, frequency, and timing). Furthermore, rainfalldifferences create the potential for different interactions among threats (Section 5).
Fig. 3.2. Ratio of rainfall in winter compared tosummer in the Mojave Desert.Weather stations, and the longitudesfor those stations, are given in thetable.
Station Latitude
Adelanto 117.4167
Apple Valley 117.2167
Barstow 117.0333
Cantil 117.9667
China Lake 117.6833
El Mirage 117.6333
Hesperia 117.3000
Inyokern 117.8167
Lucerne Valley 116.9500
Mojave 118.1667
Randsburg 117.6500
Trona 117.3833
Victorville 117.3000
Boulder City 114.8500
DNWLR 115.3667
Dunn Siding 116.4333
Kyle Canyon 115.6000
Las Vegas 115.1500
Little Red Rock 115.4167
Mitchell Caverns 115.5500
Mountain Pass 115.5500
North Las Vegas 115.1167
Red Rock Canyon 115.4667
Searchlight 114.9167
Sunrise Manor LV 115.0833

DTRPAC Report page 36
While life history patterns and strategies should be expected to differ in tortoisepopulations east and west of the Baker sink, they have not yet been demonstrated otherthan for aspects of reproductive ecology noted above between sites in the Western andEastern Mojave Desert Recovery Units. Tortoises are rare in the lowlands comprising thisdivision, yet they are not entirely absent. Furthermore, neither allozyme nor mitochondrialcomparisons yet support differentiation across this axis of potential separation (Rainbothet al. 1989, Lamb and Lydehard 1994).
The western ends of each of the Northeastern Mojave and Eastern Mojave recovery unitsare indistinguishable genetically (Lamb et al. 1989, Britten et al. 1997). On the otherhand, the eastern end of the Northeastern Mojave Recovery Unit falls out geneticallydistinct from the western end of this unit (Britten et al. 1997). A distinct shell phenotypeoccurs in the Beaver Dam Slope region of this unit (USFWS 1994).
While we expect that significant differences in genetics and morphology exist, additionalstudy is needed to quantify differences between the Upper Virgin River Recovery Unitand the Northeastern Mojave Recovery Unit (Berry et al. 2002). The Upper Virgin RiverRecovery Unit is discrete on the basis of behavioral/ecological factors (USFWS 1994)and also has a unique and unusual vegetation community, topography, and soil type(USFWS 1994). Loss of this unit would result in a gap at the northeastern extent of thespecies’ distribution.
3.2.2 Provisional Revised List of DPSs
We offer here a provisional recognition of a new set of DPS units (Fig. 3.3): UpperVirgin River Desert, Lower Virgin River Desert, Northeastern Mojave Desert (includingAmargosa Valley, Ivanpah Valley, and Shadow Valley), East Mojave and ColoradoDesert, and Western Mojave Desert. These include two of the original units (UpperVirgin River and Western Mojave) and add or revise four other units, based largely onthe best resolving biochemical/genetic data of Rainboth et al. (1989), Lamb et al. (1989),Lamb and Lydehard (1994), and Britten et al. (1997). We do not consider these divisionsdefinitive. These suggested revisions will require more data and analyses, as well asevaluation and expansion of the analyses of Britten et al. (1997), and may result inadditional modification. Prior genetic studies pertinent to the foregoing case and othersare largely piecemeal, confined to mtDNA, or limited to allozyme or morphological data.They provide us with little insight with regards to gene flow or discrete boundaries.Depending on the outcome of future studies, various DWMAs could be reassigned todifferent DPSs than currently proposed. In addition, we note that our provisionalrecommendations leave a single DWMA within the revised Northeastern Mojave DesertDPS, without specific habitat protection throughout the northern half of this segment. Allof the DWMAs/critical habitat units remain well justified to sustain survival of G.agassizii: it is only their assignment to particular DPSs that concerns us.
Although we recommend that additional data be collected to refine or revise theseproposed DPSs, the evidence for particular DPS designation does not need to be absoluteand incontrovertible. Note that an agency must have discretion to rely on the reasonable

DTRPAC Report page 37
opinions of its own qualified experts even if a court might find contrary views morepersuasive. Courts, however, must set aside agency actions that are arbitrary, capricious,an abuse of discretion, or otherwise not in accordance with law. The standard for reversalof an agency action is if the agency has “relied on factors which Congress has notintended it to consider, entirely failed to consider an important aspect of the problem,offered an explanation for its decision that runs counter to the evidence before theagency, or is so implausible that it could not be ascribed to difference in view or theproduct of agency expertise” (U.S. Court of Appeals, Ninth Circuit 2003). Note also “thefact that the evidence is weak, and thus not dispositive, does not render the agency’sdetermination arbitrary and capricious” (U.S. Court of Appeals, Ninth Circuit 2003).
Fig. 3.3 Map of the proposed distinct population segments for desert tortoise.
DTRPAC Report page 38
DPS Recommendations
We recognize that DPSs may not officially be designated in a recovery plan, but revisionof the 1994 Plan should lay sufficient groundwork so that DPSs may be formallyproposed in future delisting proposals as delisting criteria are met for each DPS (e.g.,USFWS 2003). Future revisions will need to respond to the three criteria by whichmodern DPS units are defined: discreteness, significance, and conservation status. Themechanisms are as follows:
• Genetic core units need to be assessed using both nuclear and mitochondrial genes(Berry et al. 2002).
• The genetic boundaries and gene flow among units need to be critically examined.
• Once these data are available, ecological, morphological, and behavioral attributesshould be assigned to each of these genetic units. Correlations should be evaluatedamong established genetic units and carefully quantified and standardizedecological affinities, health status, life history patterns, and stereotypic behaviors.
• The natural history of host-parasite associations for the major disease relationshipsfor desert tortoise should be more deeply elucidated, including the genetics of hostsand strains of pathogens.
• At least three disparate, long-term study sites should be established within eachproposed DPS to verify the reality, consistency, homogeneity, and variability ofthese defining traits.
• DWMAs within each DPS should be geographically revised to maximize theirconservation potential in consultation with ecologists and local resourceadministrators including the USFWS for coordinating recovery efforts range wide.

DTRPAC Report page 39
“AAnn eexxppeerriimmeenntt iiss aa qquueessttiioonn wwhhiicchh sscciieennccee ppoosseess ttoo NNaattuurree,, aanndd aammeeaassuurreemmeenntt iiss tthhee rreeccoorrddiinngg ooff NNaattuurree’’ss aannsswweerr..”
Max Planck, Scientific Autobiography and Other Papers. (1949)

DTRPAC Report page 40
4. Status and Trends
4.1 Recovery Plan Implementation
The Recovery Plan identified specific management actions for each DWMA to addressperceived threats identified during the listing of and recovery planning for the deserttortoise. If sheer numbers of threats are used as an indication of threatened status, all butthe Chuckwalla DWMA have seen increased numbers in the intervening years between1994 and 2003 (Fig. 4.1 and 4.2).
Fig. 4.1 Relative number of threats to desert tortoises in each critical habitat unit (i.e., DWMA),as identified by the Recovery Plan in 1994.

DTRPAC Report page 41
Fig. 4.2 Relative number of threats to desert tortoises in each critical habitat unit (i.e., DWMA),as identified by the Desert Tortoise Management Oversight Group in 2003.
In answer to these threats the Recovery Plan recommended a number of managementactions per DWMA. The relative numbers of recommended management actions areillustrated in Fig. 4.3. In 2002 land and wildlife management agencies responded to aquestionnaire from the USFWS to document implementation of the Plan (RedlandsInstitute 2002a- 2002f). Survey responses were not specific enough to quantify the levelof implementation for specific actions. Therefore, we did not attempt to interpret thedegree to which agencies actually implemented each action, only whether some actionhad been taken. We intend this brief analysis to simply represent a “first-cut” review ofthe general status of recovery plan implementation without delving into a comprehensiveanalysis of each recommendation in the Plan.

DTRPAC Report page 42
Fig. 4.3 Relative numbers of management actions recommended for each DWMA in the 1994Recovery Plan.
Based on survey responses in 2002, it appears that implementation has been unevenrelative to recommended management (Fig. 4.4, Table 4.1). Many reviewers of the priordraft of this report made it clear that they disagreed with the representation of RecoveryPlan implementation in Fig. 4.4 and Table 4.1, both by not crediting implementationwhere it had occurred and by giving credit for implementation where it may have beennegligible. Our main conclusion from this survey is not the specific degree to which theRecovery Plan has been implemented in any given area. Rather, it is clear that theUSFWS and other management agencies need to better document and quantify recoveryefforts recommended in the Recovery Plan or its revision (Section 4.5.1) provides a

DTRPAC Report page 43
specific example of this), because to date the only source of collated and easily accessibleinformation on the degree to which the Plan’s management recommendations have beenimplemented is a questionnaire that inadequately addresses Plan managementrecommendations.
Fig. 4.4 Relative numbers of management actions by DWMA reported to the USFWS that havebeen at least partially implemented by 2002.
If left to this questionnaire as the only source of information from which to comparerange-wide implementation efforts, we would be forced to conclude that little if anyimplementation has occurred within the western Mojave Desert (Fig. 4.4), even thoughthe Recovery Plan called for a relatively high degree of management in this area (Fig.4.4). In fact, once again if left to this questionnaire alone, an average of 36% (n = 12;

DTRPAC Report page 44
Coyote Springs Valley is combined with Mormon Mesa and Joshua Tree not included) ofthe management recommendations per DWMA were not reported as having beenimplemented as of 2002, ranging from 100% (at least partial) implementation at UpperVirgin River to only 32% implementation at Ord-Rodman (Table 4.1). Only 38% ofrecommended management actions were reported to be implemented overall in theWestern Mojave Recovery Unit, and tortoise populations in this region have shown themost dramatic declines (Section 4.2 or Fig. 4.13).
Recovery Action Review and Implementation Recommendations:
With better planning and implementation of a new questionnaire that specificallyaddresses Recovery Plan implementation, we will be better able to assess the level ofimplementation of management recommendations. We offer the following specificrecommendations regarding recovery action review and implementation:
• Land managers and policy makers should undertake a coordinated, range-wideeffort today, not waiting for the possible formation of a future recovery team, toassess the level to which Plan recommendations have been implemented withineach DWMA. This effort should be directly correlated to Recovery Planmanagement recommendations. Without this effort, it will be impossible to assessthe level of Plan implementation and thus objectively assess the reasons why thedesert tortoise continues to appear to be declining throughout much of its range.
• At the same time, if a future recovery team is formed, it will be essential that theteam review and revise recovery recommendations for each DWMA and/orprovisional DPS to ensure that recommended recovery actions address relevantsite-specific impacts or threats.
• Most recovery actions should be implemented in an experimental framework (inat least some areas) to determine the effectiveness of those actions. Appropriateresponse variables (e.g., tortoise numbers or density, reproductive output,nutrition, juvenile survival, etc.) may vary depending on the action. Likewise, thenecessary study duration may vary depending on the action and response variable;long-term studies should be expected, given the life history of the tortoise.
• The USFWS and other management agencies should develop a forward-looking,quantitative recovery actions database. Database development should begin duringthe Recovery Plan revision process with site-specific baseline measures (e.g., milesof authorized/unauthorized roads and trails, number of landfills in a particularDWMA) for each recovery action. Subsequently, agencies should document in thedatabase specific levels of recovery action implementation (e.g., miles of roadsclosed, number of landfills closed or managed appropriately in a particularDWMA). Lundquist et al. (2002) and Hatch et al. (2002) found that recovery tasksand monitoring were significantly more likely to be implemented for plans with arecovery coordinator or committee and a centralized recovery database.

DTRPAC Report page 45
Table 4.1. Recovery actions listed in the Recovery Plan (and DWMA supplement) reported by management agencies as implemented through 2002 (RedlandsInstitute (2002a-f). 0 = No Implementation; 1 = Implementation Initiated; blanks indicate actions not applicable to that unit, according to the Recovery Plan.
Upper Beaver Gold
Virgin Piute- Dam Butte- Mormon Fremont- Ord- Superior-
Recovery Action Chemehuevi Chuckwalla River Fenner Ivanpah Eldorado Slope Pakoon Mesa Kramer Rodman Cronese
1 Prohibit Vehicles off Roads 1 1 1 1 1 1 1 1 1 0 0 0
2 Prohibit Competitive/Organized
Events
1 1 1 1 1 1 1 1 1 0 0 0
3 Prohibit Surface Disturbance 1 1 1 1 1 1 1 1 1 0 0 0
4 Prohibit Grazing 1 1 1 1 1 1 1 1 0 0 0 0
5 Prohibit Burros/Horses 1 1 1 1 1 1 0 1 0 0 0 0
6 Prohibit Vegetation Harvest 1 1 1 1 1 1 1 1 1 0 0 0
7 Prohibit Collection 1 1 1 1 1 1 1 1 1 1 1 1
8 Prohibit Dumping/Littering (+
cleanup)
1 1 1 1 1 1 1 1 0 1 1 1
9 Prohibit Releases 1 1 1 1 1 1 1 1 0 1 1 1
10 Prohibit Uncontrolled Dogs 0 0 1 0 1 1 0 0 0 1 0 0
11 Prohibit Discharge of Firearms 0 0 1 0 0 0 0 0 0 1 0 1
12 Restrict New Roads 0 0 1 0 1 1 1 1 1 0 0 0
13 Close Roads 1 1 1 1 1 1 1 1 0 0 0 0
14 Designate Roads 1 1 1 1 1 1 1 1 1 0 0 0
15 Fence Roads/Install Culverts 0 0 1 0 0 0 1 0 0 1 0 1
16 Law Enforcement 1 1 1 1 1 1 1 1 1 1 1 1
17 Restore Habitat 0 0 1 0 1 1 0 1 0 0 0 0
18 Sign/Fence Boundaries 0 0 1 0 0 1 1 1 0 0 0 0
19 Landfill Management 1 1 1 1 1 1 0 1 1 1 1 1
20 Environmental Education 1 1 1 1 1 1 1 1 1 1 1 1
21 Withdraw Mining 0 0 1 0 0 0 0 0 0 0 0 0
22 DWMA Mgt. Plan 1 1 1 1 1 1 1 1 1 0 0 0
23 Secure Non-federal
Lands/Habitat
1 1 1 1 1 1 0 0 0 1 1 1
24 Halt Unauthorized ORV Use 0
25 Halt Vandalism of Tortoises 0 0 0 0 0 0 0 0 0
26 Install Railroad Barriers/Culverts 0 0 0 0 0 0
27 Install Aqueduct Barrier 0
28 Monitor Health of Population 1 1 1 1 1 1 1 1
29 Evaluate Raven Use 0
30 Install Urban/Other Barriers 1 0 1 0
31 Raven Control 1 0 1 1 0 0
32 Distribution/Density Surveys 1 1 1 1 1 1 1 1 1 1
% Partially Implemented 67% 64% 100% 64% 78% 85% 67% 80% 44% 47% 32% 36%

DTRPAC Report page 46
4.2 Trend Analyses of Populations
No existing data or analyses are adequate to estimate long term status or trends in (a) deserttortoise populations, (b) habitat for desert tortoises in any recovery unit, and/or (c) threatsto tortoise populations regionally. However, we assembled as much data as was possible,within the time constraints for preparing the DTRPAC report, to perform the equivalent ofmeta-analyses on existing information (Hunter et al. 1982). Our analyses consist of twogeneral approaches: 1) evaluation of long-term trends in the densities of desert tortoiseswithin Recovery Units and within the Distinct Population Segments that are proposed bythe DTRPAC, and 2) evaluation of qualitative and quantitative spatial analyses of thepresence of live and dead tortoises on transects for (a) “total corrected sign” and (b)distance sampling. These analyses provide insight as to where, within larger managementunits, tortoises may be doing better or worse than in other areas. The successes of theseanalyses portend efficacious approaches for exploring data in new and innovative ways thatcan be terrifically important to the future successes of monitoring programs.
4.2.1 History of Long-Term Study Plots
Long-term permanent study plots were established in California in the early 1970’s as partof an inventory of Bureau of Land Management (BLM) resources (Berry 1984).Permanent study plots were also established in Arizona, Nevada, and Utah (Fig. 4.5).These plots originally were established to generate data on demography and populationtrends as well as ecological relationships with abiotic and biotic factors (Berry 1984).Various methods were used to assess population size in the initial surveys on those plots(e.g., 30-day spring surveys, 20-day fall surveys, and winter den surveys), but eventually astandard method became a 60-day spring survey of a one square mile plot. In this protocol,survey effort was divided into two periods of roughly equal times (capture and recaptureperiods). Tortoise density has been estimated using the Lincoln-Peterson calculation(Turner and Berry 1984); analyses for most plots limit abundance estimation to tortoises>180 mm MCL, due to reduced capture probabilities for smaller tortoises, but abundanceof tortoises of all sizes on California plots is often estimated with a stratified LincolnIndex (Overton 1971). Additional data collected on study plots include health profiles,burrow or cover characteristics, tortoise size, information on carcasses, and vegetation onthe plots. Few of these latter data have been analyzed beyond descriptive summaries.
Plots typically were located on public lands and in areas containing “adequate tortoisedensities for sampling,” sometimes explicitly where many tortoises had been reported;however, some plots were originally located in areas where strip-transect surveys hadpreviously documented little or no tortoise sign (Berry 1984). Plots were located in areasgenerally considered to have been the least disturbed “representative habitats” within thedesert ecosystems (e.g., Mojave Desert, Colorado Desert, etc.). Several plots on whichfew tortoises were found have been discontinued (K.H. Berry, pers. comm. 2003). Sixty-day plot surveys began in California in the early 1970’s, in Nevada and Utah in 1981, andin Arizona in 1987. Only a small subset of the plots has been surveyed in any one year,and fixed survey intervals have not been maintained (Table 4.2).

DTRPAC Report page 47
Fig. 4.5 Locations of desert tortoise permanent study plots within the federally listed range ofdesert tortoises in the southwestern United States.
Permanent study plot data were used to give the committee some insight into the range-wide status of tortoises over the most recent two decades. Density estimates andconfidence limits for those estimates were collected from published literature, reports,and from personal communications with researchers who supervised surveys of thepermanent study plots within the listed range of the desert tortoise from 1979 to 2002(Table 4.2). Not all plots were sampled in all years, and not all data were calculated orobtainable for plots that were sampled in some years (Table 4.2).

DTRPAC Report page 48
Table 4.2 Years surveyed on permanent study plots for desert tortoises. A number (0 or 1) indicates thatdata were taken at this plot. A zero indicates that the data are not available or sufficient for analysis, and aone indicates that data were available for analyses in this report.
Study Site State 71/72 76/77 78 79 80 81 82 83 84 85 86 87 88 89 90 91 92 93 94 95 96 97 98 99 00 01 02 03
Southern Argus CA 0
Fremont Valley CA 0 0 1 1 1 1
DTNA (interior) CA 1 1 1 1 1 1
DTNA (inter. Center) CA 1 1 1 1 0 0
Fremont Peak CA 1 1 1 1 1
Kramer Hills CA 1 1 1 1 1
Stoddard Valley CA 1 1 1
Lucerne Valley CA 1 1 1 1
Johnson Valley CA 1 1 1 1
Shadow Valley CA 0 1 1 1
Ivanpah Valley CA 1 1 1 1 1
Fenner Valley (Goffs) CA 0 1 0 0 0 0 1 1 1
Ward Valley CA 1 1 1 1 1
Chemehuevi CA 0 0 1 1 1 1 0
Chuckwalla Valley CA 1 1 1
Chuckwalla Bench CA 0 0 1 1 1 1 1 0 1
Last Chance NV 0
Sheep Mountain NV 1 1 1 1
Piute Valley NV 0 0 1 1 1
Christmas Tree NV 1 1 1
Coyote Spring NV 1 1 1
Gold Butte NV 1 1 1
Sand Hollow NV 1 1
Mormon Mesa NV 1 1
Trout Canyon NV 1 1
Eldorado Valley NV 1
LMNRA
Tassi NV 0
Road 152 NV 0 0
Road 149 NV 0
Road 60 NV 0 0
Road 58 NV 0 0 0
Road 42 NV 0 0
River Mountains NV 1 0 1 1
Pinto Valley NV 0
Overton NV 1 1
Lake Las Vegas NV 0
Grapevine NV 1 1 1 0 0 0 0 0
Government Wash NV 0
Dupont Mine NV 0
Cottonwood NV 1 1 1 0 0 0 0 0 0
Cat Claw NV 0
Bitter Springs NV 0 0 0
Pakoon Basin AZ 0
Virgin Slope AZ 1 1 0
BDS Exclosure AZ 0 1 0
Littlefield AZ 0 0 1 1
City Creek UT 1 1
Woodbury-Hardy UT 0 1 1 1
Beaver Dam Slope UT 1

DTRPAC Report page 49
Data on population densities on permanent study plots were assembled from numeroussources (Table 4.3). Data from these plots have limits to their value for scientificassessment of status and trends for several reasons. For example, the plots are not randomsamples of desert tortoise habitat, so extrapolations from them cannot be made. The plotswere not sited to address specific hypotheses about management actions so it is not clearto what the contained tortoises are responding. The plots were not censused in the sameyears, and the timing of measuring the plots makes comparisons among plots of limitedvalue. Detectability of tortoises was never measured which further limits temporalcomparisons of status and trends. In spite of the inadequacies of these data, and with somecaveats, they can be used to estimate the status and trends of desert tortoise populationswith appropriate caution. When the Recovery Plan was assembled, information regardingthe status of desert tortoise populations largely depended upon analyses of tortoisedensities from permanent study plots. While these data showed that populationsexperienced significant declines in the western extent of the listed range (i.e., California,see USFWS 1994, Page 4, Fig. 1), no trend in adult densities for the eastern portion wasdiscernable at that time (see USFWS 1994, Appendix C, Page C9, Fig. C4).Interpretations of analyses of data from permanent study plots have been controversial(Corn 1994, Bury and Corn 1995), and new sampling methods were advocated. Permanentstudy plots continued to be sampled in the years following the publication of the RecoveryPlan, and many continue to be sampled. However, many of the study plots in Nevada, andUtah were not sampled beyond ~ 1996, as new methods of density estimation wereimplemented. Thus, the status of tortoise populations in California, as measured by datataken from study plots, is more current than that from Nevada or Utah. Nevertheless, databeyond those relied upon by the Recovery Team in 1994 are available and are analyzedherein, and those analyses show similar patterns in trends of desert tortoise densities tothose published in the 1994 Plan.

DTRPAC Report page 50
Table 4.3 Citations for sources of data used in permanent study plot analyses
Advantage Environmental Consulting. undated (1992)Bashor, A.N. undated (1991)Berry, K.H. 1989Berry, K.H. 1990Berry. K.H. 1992Berry. K.H. 1995Berry, K.H. 1996Berry, K.H. 1999Berry, K.H., L.L. Nicholson, S. Juarez, and A.P. Woodman. 1986Berry, K.H., T. Shields, and C. Knowles. In prep.Duck, T.A., and E. Schipper. undated (1989)Duck, T.A., and J.R. Snider. undated (1988)EnviroPlus Consulting. 1995EnviroPlus Consulting. 1994Foreman, L. (pers. comm.)Fridell, R.A. 1995Fridell, R.A., and J.A. Shelby. 1996Fridell, R.A., and M.P. Coffeen. undated (1993)Fridell, R.A., J.R. Snider, K.M. Comella, and L.D. Lentsch. 1995Fridell, R.A., M.P. Coffeen, and R. Radant. 1995Goodlett, G., and P. Woodman 2003Goodlett, G., M. Walker, and P. Woodman. 1997Goodlett, G., P. Woodman, M. Walker, and S. Hart. 1996Haley, R., and M. Boyles (pers. comm.)K. Berry (pers. comm.)K. Phillips (pers. comm.)Longshore, K.M. 2003Medica, P.A. 1992Minden, R.L., and S.M. Keller. 1981Nickolai, J.L., and R.A. Fridell. 1998P. Medica (pers. comm.)Rourke, J.W., C. Hillier, J. Merriam, and T.A. Duck. undated (1993)Turner, F.B., and K.H. Berry. 1985USFWS, Ventura Office Annual Permit ReportsWoodman, P. 1997

DTRPAC Report page 51
4.2.2 Trends Range-wide (East and West)
Permanent study plots that have been sampled for an extended period, from which datawere used in the original Recovery Plan, and can be divided into those in the eastern andwestern part of the desert tortoise range (Table 4.4), as was done in the original RecoveryPlan. When the 1994 Recovery Plan was written, there were documented populationdeclines in the Western Mojave and this downward trend appears unabated (Fig. 4.6). Inaddition, there is now a guarded concern for populations in the East Mojave (in California),particularly due to a single recent data point at the Goffs site (Fig. 4.6). This concern hashighlighted the need for more data to assess the importance of data points that could eitherbe outliers or could be indicators of new trends. In these areas, desert tortoises appear to beaffected by various combinations of threats or the cumulative effects of many threats.
Table 4.4 Study plots from which data were used to assess trends in population size in the originalRecovery Plan.
Eastern WesternChemehuevi Valley Desert Tortoise Natural Area (Interior)Chuckwalla Bench Desert Tortoise Natural Area (Visitors Center)Chuckwalla Valley Fremont ValleyIvanpah Valley Fremont PeakUpper Ward Valley Johnson ValleyChristmas Tree Kramer MountainsCoyote Springs Lucerne ValleyGold Butte Stoddard ValleyPiute ValleySheep MountainTrout Mountain

DTRPAC Report page 52
Fig. 4.6 Trends in relative population densities for desert tortoises in the eastern and westernpermanent study plot sites.
4.2.3 Trend Analyses by Recovery Unit
The DTRPAC analyzed for trends in tortoise population densities at a finer spatial scalethan just the eastern and western portions of the listed range (as was done in the RecoveryPlan). It is important to recognize that analyzing permanent study plots individually islargely meaningless except to learn about processes only on the plot (generally not valuablefor conservation planning). Thus, analyzing permanent study plots cannot give insight intopopulation trends occurring within larger management areas (Manly 1992, MacDonald andErickson 1994, Underwood 1997) unless the plots are randomly placed within the area forwhich generalization is needed. Nevertheless, for our analyses, study plots were treated asthough they were random samples of regions. Because the permanent study plots actuallywere not randomly placed (Berry 1984), this somewhat limits the extent to which it is

DTRPAC Report page 53
possible to generalize from analyses (Manly 1992). Regardless of the limitations toanalyses from these plots (the only data available), the data from the plots were analyzed ina way that reduced bias as much as possible. The geographic areas that we examinedincluded the Recovery Units specified in the original Recovery Plan (Fig. 4.7), and theDistinct Population Segments (Fig. 4.14) suggested by the DTRPAC (see Section 3). Foreach Recovery Unit and DPS, we constructed a weighted general linear model with onecontinuous and one categorical variable (results below). Estimates of the populationdensities of adult tortoises (carapace lengths > 208 mm) were the response variable, andtime (years) and the study plot were predictor variables. The model was weighted by theinverse of the half-width of the upper confidence limit relative to the magnitude of thedensity estimate. This weighting caused more precise density estimates to have greaterinfluence on the model than those with poor precision. Repeated measures analysis ofvariance was also considered for these analyses, however the data from study plots werecollected in different years and for differing numbers of years, which made this type ofanalysis untenable. The graphs of adult tortoise density for each Recovery Unit andDistinct Population Segment given below are bivariate plots of the raw density estimatesand their confidence limits and not the results of analyses on the data.
Some of the Recovery Units, or proposed Distinct Population Segments, did not havesufficient study plots within them to permit analysis, or had too few study plots to provideenough power to produce conclusive analyses. For example, the Upper Virgin Riverrecovery unit and proposed DPS contained only one plot (City Creek), for which we haddensity estimates for only 1988 and 1994. Thus, no analyses were conducted for thisRecovery Unit/DPS. In addition, the Eastern Colorado Recovery Unit and the NorthernColorado Recovery Unit each contained only two plots, and results for analyses from thissmall sample lack power and ability to generalize. The Western Mojave Recovery Unitcontained the same set of permanent study plots as the proposed Western Mojave DistinctPopulation Segment, and therefore new analyses were not necessary for the DPS.

DTRPAC Report page 54
Fig. 4.7 Active (green tortoise symbols) and discontinued (orange triangles) permanent study plotsgrouped within the 1994 Recovery Units.
Upper Virgin River Recovery Unit (and DPS)
There was only one PSP represented in the Upper Virgin River recovery unit (City Creek;Fig. 4.7), and therefore no analysis was generated for this recovery unit. The densityestimates for this site are given in Fig. 4.8.
The Upper Virgin River DPS contains the same permanent study plot (City Creek) as therecovery unit (Fig. 4.7). No analysis was conducted for this DPS and Recovery Unit.

DTRPAC Report page 55
Fig. 4.8 Plot of adult densities overtime for the City Creek permanentstudy plot located within the UpperVirgin River Recovery Unit. Errorbars are 95% confidence intervalsfor the density estimate.
Northeastern Mojave Recovery Unit
The Northeastern Mojave Recovery Unit contained the Beaver Dam Slope (exclosure),Beaver Dam Slope, Coyote Springs, Gold Butte, Littlefield, Mormon Mesa, Overton, RiverMountain, Sheep Mountain, Trout Canyon, Virgin Slope, and Woodbury Hardy permanentstudy plots (Fig. 4.7).
The overall analysis was significant (F12,14 = 8.1, P = 0.0002), which was entirely due to theeffect of site (F11,14 = 8.7, P = 0.0002). There was no significant statistical trend in adultdensity over time (F1,14 =0.008, P = 0.93; Fig 4.9).
Fig. 4.9 Plot of adult densitiesover time for the study plotslocated within the NortheasternMojave Recovery Unit. Error barsare 95% confidence intervals forthe density estimate.

DTRPAC Report page 56
Eastern Mojave Recovery Unit
The Eastern Mojave Recovery Unit contains the Christmas Tree, Goffs, Ivanpah, ShadowValley, and Piute Valley permanent study plots (Fig. 4.7).
The overall analysis for the Eastern Mojave Recovery Unit was significant (F5,11 = 10.3, P =0.0007). This result was entirely due to the significance of the site effect (F4,11 = 11.7, P =0.0006). There was no significant effect of year in the model, indicating that there was notrend in adult density estimates over time (F1,11 = 0.2, P = 0.65; Fig. 4.10).
Fig. 4.10 Plot of adult densitiesover time for the study plotslocated within the Eastern MojaveRecovery Unit. Error bars are 95%confidence intervals for the densityestimate.
Northern Colorado Recovery Unit
The Northern Colorado Recovery Unit contained two permanent study plots, Chemehueviand Ward Valley (Fig. 4.7). This limits how generalizable the results from this analysis canbe and again highlights one of the weaknesses of using data from permanent study plots todiscern long-term trends for management areas.
The overall model for the Northern Colorado Recovery Unit was significant (F2,7 = 23.29, P= 0.0008), and the effect of site was significant (F1,7 = 39.6, P = 0.0004). There was nosignificant effect of year, indicating no statistical trend of adult tortoise density over time(F1,7 = 1.3, P = 0.3; Fig. 4.11).

DTRPAC Report page 57
Fig 4.11 Plot of adult densitiesover time for the PSPs locatedwithin the Northern ColoradoRecovery Unit. Error bars are 95%confidence intervals for thedensity estimate.
Eastern Colorado Recovery Unit
The Eastern Colorado Recovery Unit contained two permanent study plots, ChuckwallaBench and Chuckwalla Valley (Fig. 4.7). As in the Northern Colorado Recovery Unitanalysis, this limits how generalizable the results from this analysis can be and highlightsone of the weaknesses of using data from permanent study plots to discern long-term trendsfor management areas, whether they are Recovery Units or Distinct Population Segments.
The overall model for the Eastern Colorado Recovery Unit was significant (F2,6 = 21.0, P =0.002), with significant effectsof both site (F1,6 = 19.18, P =0.005) and year (F1,6 = 20.24, P= 0.004; Fig. 4.12). Thisindicated that there was astatistical decline in adultdensities over time, whichappears to be due to the effectof Chuckwalla Bench.
Fig. 4.12 Plot of adult densitiesover time for the PSPs locatedwithin the Eastern ColoradoRecovery Unit. Error bars are 95%confidence intervals for the densityestimate.

DTRPAC Report page 58
Western Mojave Recovery Unit (and DPS)
The Western Mojave Recovery Unit included the DTNA Interior, DTNA InterpretiveCenter, Fremont Peak, Fremont Valley, Johnson Valley, Kramer Hills, Lucerne Valley, andStoddard Valley Permanent Study Plots (Fig. 4.7).
The overall analysis was significant (F8,25 = 7.2, P < 0.0001), and the year effect yielded asignificantly negative trend in adult density estimates over time (F1,25 = 20.52, P = 0.0001(Fig. 4.13). There was also a significant contribution of site to the model (F7,25 = 4.46, P =0.003). This analysis indicates that, taken together, tortoise densities on the permanentstudy plots located within the Western Mojave Recovery Unit are declining, as wassuggested in the Recovery Plan (Recovery Plan, Appendix C, page C10, Figure C5). Thispattern suggests that recovery actions implemented since the Plan have not resulted in thereversal of this declining trend.
The study plots included in the proposed Western Mojave Distinct Population Segment(Fig. 4.14) are the same as those in the Western Mojave Recovery Unit (Fig. 4.7).
Fig. 4.13 Plot of adultdensities over time for thepermanent study plotslocated within the WesternMojave Recovery Unit.Error bars are 95%confidence intervals forthe density estimate.

DTRPAC Report page 59
4.2.4 Trend Analyses by Distinct Population Segment
Fig. 4.14 Active (green tortoise symbols) and discontinued (orange triangles) study plots groupedby Distinct Population Segment.
Lower Virgin River DPS
The Lower Virgin River Distinct Population Segment contains the Beaver Dam Slope(Exclosure), Beaver Dam Slope, Coyote Springs, Gold Butte, Littlefield, Mormon Mesa,Overton, River Mountain, Virgin Slope, and Woodbury Hardy permanent study plots (Fig.4.14).

DTRPAC Report page 60
The overall analysis was not significant (F5,6 = 3.7, P = 0.07). Indicating that there was noeffect of site, and importantly there was no significant trend in adult tortoise density overtime (F1,6 = 0.29, P = 0.61; Fig. 4.15).
Fig. 4.15 Plot of adult densities over timefor the Lower Virgin River DistinctPopulation Segment. Error bars are 95%confidence intervals for the densityestimate.
Eastern Mojave and ColoradoDPS
The Eastern Mojave andColorado DPS contains theChemehuevi, Christmas Tree,Chuckwalla Bench, ChuckwallaValley, Goffs, Piute Valley,Ward Valley permanent studyplots (Fig. 4.14).
The overall analysis wassignificant (F7,20 = 11.89, P <0.0001), which was entirely dueto the effect of site (F6,20 =13.46, P < 0.0001). There wasno significant trend in densityestimates over time (F1,20 = 2.22,P = 0.15; Fig 4.16).
Fig. 4.16 Plot of adult densities over time for the EasternMojave and Colorado Distinct Population Segment. Errorbars are 95% confidence intervals for the density estimate.

DTRPAC Report page 61
Northeastern Mojave DPS
The Northeastern Mojave Distinct Population Segment contains the Ivanpah, ShadowValley, Sheep Mountain, and Trout Canyon permanent study plots (Fig. 4.14).
The overall analysis was significant (F4,9 = 26.52, P < 0.0001), which was entirely due tothe effect of site (F3,9 = 35.35, P < 0.0001). There was no trend in adult densities as afunction of time (F1,9 = 0.06, P = 0.82; Fig. 4.17).
Fig. 4.17 Plot of adult densitiesover time for the NortheasternMojave Distinct PopulationSegment. Error bars are 95%confidence intervals for thedensity estimate.
4.2.5 Summary of Trend Analyses
From the trend analyses a few key conclusions can be drawn. First, the downward trend inadult tortoise densities in the Western Mojave clearly dominates the analyses, whetherconsidered by dividing the listed range into eastern and western sections (Fig 4.6), oranalyzed at the level of the Recovery Unit/DPS (Fig 4.14). There were several RecoveryUnits that contained too few permanent study plots to allow meaningful analyses and somethat could not be analyzed. This speaks to the inadequacy of the historical placement of thepermanent study plots in light of the current needs of range-wide monitoring. One caveat tothe weighting procedure should be pointed out, however. Low point estimates with highvariance are often obtained when few animals are captured or recaptured, so real tortoisedeclines may have had little effect on some models. For example, in the NortheasternMojave Recovery Unit (or Lower Virgin River DPS) plot surveys on the Beaver DamSlope Exclosure in 2000 and the Virgin Slope in 2003 produced too few live tortoises toeven produce a population estimate that could be included in the analyses presented here.

DTRPAC Report page 62
This, combined with the fact that many more carcasses were found than in prior surveys,suggests that recent declines have occurred on those plots.Second, the variation in density estimates using study plots does not appear to be less thanthe variation from line distance sampling. Thus, it is unlikely that plot analyses would havesufficient power to detect the subtle trends that are assumed to be associated with recoveryof desert tortoise populations (see Monitoring section).
Finally, the resolution of the analyses that can be conducted with data from permanentstudy plots is currently limited due to the relatively few plots established, the lack ofrandom placement of existing plots, and the fact that plots were not established to testhypotheses concerning recovery. Newer research and monitoring using spatial analysesrequires the more extensive transect sampling promoted by USFWS since 2001. However,a robust monitoring program requires exploring novel analyses, particularly those that canbe conducted with existing data (or with little modification of current monitoring methods).New methods could become increasingly important as new hypotheses-driven research andmonitoring is required for recovery.
4.3 Spatial Analyses
We conducted several GIS and spatial analyses to explore spatial variation within tortoisepopulations at different scales on the landscape and in different management units. Spatialanalyses were based upon transect data generated for distance sampling and for surveys fortotal corrected sign (TCS), (see tortoise transect history below). The analyses that weconducted provide both qualitative and quantitative conclusions about the spatial nature oftortoises relative to carcasses, and of the relative presence and absence (viz., failure todetect) of tortoises in DWMAs.
Specific analyses included:
1) An Observation Rates analysis, which compared distance sampling transects in whichlive tortoises were observed relative to the number of transects in which only carcasseswere observed.
2) A Presence/Failure to detect analysis to examine the recent spatial distribution of thepresence of live tortoises and carcasses using transect data from surveys of total correctedsign (TCS).
3) Two Conditional Probability of Live Encounter analyses consisting of twoapproaches with the same goal. These analyses were used to estimate the probability that anobservation was a living tortoise as a function of location within the Western Mojave DPSusing Line Distance Sampling (LDS) data from 2001.
4) Kernel analyses, which are quantitative analyses in which the distributions of livetortoises and carcasses were smoothed to qualitatively search for areas where distributionsof live tortoises and carcasses do not overlap. These non-overlapping areas may indicateareas that have experienced recent die offs or expansions of populations.

DTRPAC Report page 63
5) Nearest Neighbor Clustering, which is a quantitative search for statistical clusters oflive animals and carcasses. Analyses included searching the degree of overlap (orseparation) of these clusters.
Each of these analyses carries unique limitations concerning the extent to which transectdata can be used. For example, Nearest Neighbor Hierarchical Clustering requires that thedata be spatially random or regularly distributed. Thus, cluster analysis was restricted tousing only LDS data from 2001. Table 4.5 lists data used in our spatial analyses.
These analyses are neither intended to be an exhaustive exploration of all spatial analysistechniques suitable for TCS and LDS data, nor are they an exhaustive attempt to analyze allpossible data and/or regions. Instead, our objective is to investigate alternative, andprimarily novel, spatial analysis techniques that should be explored further by thesubsequent recovery team. There are very likely more types of spatial analyses that couldbe explored and perhaps better spatial analyses that are more appropriate given the differentsources of data that we had available. If a future recovery team is formed, we recommendthat all of the data available to them, and future monitoring efforts be explored to the fullestextent possible, as the detection of trends alone (given current sampling precision, seeSection 6) seems at this time untenable.
Table 4.5 Summary of data, year, and region used for each analysis. TCS = total corrected signsurveys; LDS = line distance sampling.
Analysis Transect Data Years RegionPresence/Failure to Detect TCS, LDS All years West MojaveObservation Rates LDS 2001-2003 Range-wide (excluding Upper
Virgin River)Kernel LDS 2001 Range-wideCluster LDS 2001 West MojaveConditional Probability of BeingAlive: Re-sampling
LDS 2001 West Mojave
Conditional Probability of BeingAlive: Logistics Regression
LDS 2001 West Mojave
4.3.1 History of Desert Tortoise Transects
Total Corrected Sign Transects
There have been several transect methods used to estimate the relative presence oftortoises, especially in the Western Mojave. Prior to, and later in support of, the draft WestMojave Plan (BLM et al. 2003), many transects were surveyed with the goal of measuringtortoise sign. These data typically are referred to as total corrected sign (TCS). Historically,estimates of relative tortoise density have been estimated from the “corrected” sign oftortoises. This correction was based upon comparison of sign counts from areas ofunknown density and areas with both sign counts and estimated density.

DTRPAC Report page 64
Transect surveys for TCS transects were conducted in 1998, 1999, and 2001 by the Bureauof Land Management West Mojave Planning team in support of development of the draftWest Mojave Plan (WMP) habitat conservation plan and the California DesertConservation Area Plan amendment (BLM et al.2003). The transect method was developedby Berry and Nicholson (1984) to determine relative tortoise densities. However, the WestMojave Plan planning team restricted the use of the data for various reasons to depictrelative “patterns of occurrence” for tortoises (BLM et al. 2003). The transects are typicallywalked in the Autumn, to allow for greater amounts of tortoise sign (i.e., scat and burrows)to accumulate during the activity season. In addition to observations of scat and burrows,observations of live tortoises and carcasses were also recorded.
For the purposes of analyses conducted herein only the raw sign data were used. In otherwords, data were not “corrected”, and no density estimates were derived from the data.
Distance Sampling Transects
In February 1995 during a workshop on tortoise monitoring in Reno, Nevada (sponsored bythe Biological Resources Research Center at the University of Nevada, Reno), tortoisebiologists, statisticians, and monitoring experts reviewed previous methods used to monitortortoise populations and possible methods to use in the future. At this workshop, themethod of “Distance Sampling” (Buckland et al. 1993) was introduced as a way to mitigatethe problems of the permanent study plots. At a second meeting in Laughlin, Nevada, inOctober 1998, the Management Oversight Group (MOG) proclaimed Distance Sampling tobe the method that would be used on public lands for estimating density of desert tortoisepopulations. In June 1999, the MOG endorsed the use of Distance Sampling using program“Distance” as the method to be employed in range-wide sampling of desert tortoisepopulations. However, the appropriateness of the technique for sampling desert tortoises(especially in areas with low population densities) was, and remains, contentious (seeSection 6).
In January 2001 a monitoring workshop was held in Las Vegas, Nevada, to explain thesampling techniques that would be used in 2001 to conduct the first years effort of LineDistance Sampling range wide. This meeting was attended both by agency and contractorpersonnel. A handbook was prepared by the Desert Tortoise Coordinator and provided inMarch 2001 to serve as the manual for conducting the distance sampling in 2001. In Marchof 2001, two training workshops were conducted. Approximately 40 people attended eachof the two four-day workshops. These training workshops provided practice for conductingthe Distance Sampling technique by using styrofoam tortoise models (styrotorts) placed innatural habitats near Jean, Nevada. This technique had been used as part of an earlierdemonstration workshop conducted in October 1998 (Anderson et. al. 2001). Finally, thetortoise transects were sampled range-wide beginning in 2001 by Chambers Group; KivaBiological Consultants; the Mojave National Preserve; the University of Nevada, Reno;and the Utah Division of Wildlife Resources.

DTRPAC Report page 65
The Utah Department of Wildlife Resources instituted a monitoring program similar to thatof the rest of the listed range of tortoises (using transects to monitor tortoises and thedistance technique to estimate densities of tortoise populations) at the Red Cliffs DesertReserve within the Upper Virgin River Recovery Unit (McLuckie et al. 2002). A pilotstudy was initiated in 1997, and reserve-wide monitoring was initiated in 1998.
For most of the listed range (excluding the Upper Virgin River Recovery Unit) LDStransects (Buckland et al. 2001) were conducted for the years 2001-2003 by the USFWS insupport of the range-wide sampling of tortoises within DWMAs. Transects were conductedin the spring, corresponding to periods of high tortoise activity. Data from these transectscan be used to calculate density estimates at several scales (e.g., for each DWMA orRecovery Unit; Anderson et al. 2001). Transects for 2001 were randomly selected from a400m grid within each DWMA with the following exclusions: areas greater than 4,200 ft inelevation, slopes 30%, permanent water bodies, playas, major roads, private land, andrestricted areas within military reservations.
Density estimates for the 2001 distance sampling for the West Mojave indicateapproximate densities of 7.3 tortoises/km2 (95% CI = 5 – 10) for the Fremont-KramerDWMA and 9.6 tortoises/km2 (95% CI = 7 – 13) for the Ord-Rodman DWMA (Medicapers. comm.). These numbers are relatively comparable to those given for permanent studyplots near the same two DWMAs (DTNA Interior for 2002 = 2 tortoises/km2 (95% CI = 1-4), Fremont Valley for 2001 = 5 tortoises/km2 (95% CI = 2-9) (Berry pers. comm.).However, the sampling design for monitoring for most of the range (excluding the UpperVirgin River Recovery Unit) using transects was flawed in such a way that samples fromsubsequent years (2002 and 2003) cannot be considered representative of the DWMAs as awhole. Therefore, density estimates for 2002 and 2003 were not part of our analyses. The“flaws” in data collected in 2002 and 2003 reflect weaknesses in the system ofconstructively adapting monitoring each year to increase efficacy. In particular, severalprocesses contributed to problems in 2002 and 2003. The lack of certainty in year-to-yearfunding of range wide monitoring contributed to an atmosphere of last-minute adjustmentsto monitoring methods. Adjustments to field techniques often emphasized logistics insteadof needs for solid scientific design and statistical validity. Only as part of the DTRPACprocess did we learn that adjustments in monitoring methods to improve logistics actuallynullify the statistical validity of spatial analyses from those data. This experience revealsthe pressing need for a consistent, high-level, scientific advisory capability as part of rangewide monitoring overseen by USFWS.
The data provided by distance sampling transects sampled in 2001 and the TCS transectsfrom other years provide a capacious source of information for spatial analyses. Forexample, we found that the spatial data from both the relative sign and distance samplingtransects could be used to understand better the information regarding the declining densityestimates of tortoises as provided by the permanent study plots, especially in the WestMojave.

DTRPAC Report page 66
4.3.2 Observation Rates(distance sampling transects; range-wide, excluding Upper Virgin River; 2001-2003).
The objective of this analysis was to ascertain the percentage of transects in which livetortoises were observed in comparison to the number of transects on which only carcasseswere observed. Spatial randomness was not required for this analysis, so the data fromdistance sampling transects for 2001 through 2003 were used (Table 4.6). Although datafrom corrected sign transects also contain observations of live and dead tortoises, thedifference in sampling period relative to distance sampling transects (Autumn for signtransects and spring for distance sampling transects) disproportionately biases against liveobservations compared to those observed on the distance sampling transects, which couldskew the live/carcass ratios. For this reason we limited our analysis to LDS data only.
The percentage of transects with observations of live tortoises and those with observationsof carcasses are presented in Table 4.6. Note that high/low percentages should not beconfused with high/low numbers of live tortoises or carcasses. For example, 29% of thetransects in Fremont-Kramer in 2001-2003 had live tortoises and 67% of transects hadcarcasses (Table 4.6).
We also calculated the ratio of carcasses to live tortoises for the same areas (Table 4.6, Fig.4.18). A low ratio (i.e. close to 1) does not mean that there are a low number of carcasses; itinstead means that there were approximately equal numbers of carcasses and live tortoises.There was a continuum of ratios ranging from 1.08 for the Pinto to 3.67 for Fenner (Table4.6).
Table 4.6 Percentages of live animals and dead animals found on LDS transects. The third columnis the ratio of the percent of dead animals encountered to the percent of live animals encountered.
DWMA % Live %Dead Ratio Dead/LiveBeaver Dam Slope 5 6 1.25Chemehuevi 41 70 1.71Chuckwalla 24 46 1.94Chocolate Mountains 45 68 1.51DTNA 41 59 1.51Fenner 20 74 3.67Gold Butte 8 15 1.88Fremont-Kramer 29 67 2.29Ivanpah 16 46 2.87Joshua Tree 23 33 1.40Mormon Mesa 21 34 1.58Ord-Rodman 46 56 1.22Pinto Mountains 32 34 1.08Piute-Eldorado 15 48 3.23Superior-Cronese 29 46 1.60

DTRPAC Report page 67
The transects revealed patterns of discrepancy between observations of live tortoises andobservations of carcasses. This analysis is based upon the premise that tortoise populationswith equal numbers of live animals and carcasses are in a better state than those withdisproportionately larger carcass numbers. It is worth noting that carcasses are purposelyremoved from active permanent study plots in California. In this case, the small analysisarea and presence of two active study plots at the DTNA (one sampled in 1997 and 2002and the other in 2002 only) could contribute to the low ratio of carcasses to live tortoises.
Fig. 4.18 The ratio of carcasses to live tortoises for DWMAs.

DTRPAC Report page 68
4.3.3 Presence/Failure to Detect(total corrected sign and distance sampling transects, Western Mojave, all years).
This analysis graphically assesses the recent spatial distribution of live tortoises andcarcasses, but is not a statistical analysis of this distribution. Although burrows have beenshown to be significantly correlated with live tortoises (BLM et al. 2003), we restricted ouranalysis of presence or “failure to detect” tortoises on transects with observations of livetortoises or scat. We used the presence of scat as an indication of live tortoises in a givenarea when live tortoises were not actually observed. This method assumes that where thereis scat, there must have been a tortoise (recognizing that scat can be moved by wind, water,or other animals) within a relatively short time frame (assuming scat degradation rates of 1-2 yrs).
This analysis was restricted to the Western Mojave for two reasons. First, the DTRPAChad access to spatially referenced distance sampling data for the West Mojave, but not forother areas. Second, though the DTRPAC had access to distance sampling data throughoutthe entire listed range of the desert tortoise, an analysis of distance transects alone wouldnot have been comparable to the combined transect data for the West Mojave due to thedisparity in their sampling periods.
All transects were assigned to one square mile analysis grids. Each grid cell was assigned adifferent color based on the composition of the observations of tortoises, scat, and carcassesfound within the grids (Fig. 4.19).
The presence/”failure to detect" analysis illustrates patterns of 1) tortoise or scat presence,2) tortoise or scat and carcass presence, 3) carcasses only, and 4) failure to detect eithertortoises or scat or carcasses. Areas containing tortoises included the DTNA, the southernportions of Fremont-Kramer, south and east Superior-Cronese, and most areas of Ord-Rodman (Fig. 4.19). Large sections of Superior-Cronese have not been recently sampled(as near as we can determine). It is likely that many of these areas have been sampled byother research and/or compliance projects, however data from these areas were notavailable for analysis by the committee. Maintenance of a master desert tortoise locationdatabase would enhance the ability to track areas of tortoise and carcass occurrence.

DTRPAC Report page 69
Fig. 4.19 Presence/”Failure to Detect” tortoises and carcasses for combined distance sampling(2001-2003) and total corrected sign (1998, 1999, and 2001) transects. Dark green areas are thosein which a tortoise and/or scat were present. Light green areas are those in which a tortoise and/orscat and carcasses were present. Red areas indicate only carcasses were present. White areasindicate no tortoises, scat, or carcasses were found. Light tan areas indicate no distance samplingor total corrected sign transects were conducted.

DTRPAC Report page 70
4.3.4 Conditional Probability of Live Encounter(distance sampling transects, Western Mojave, 2001).
Resampling
For this analysis the Western Mojave was divided into a grid consisting of 18 cells. Usingthe 2001 LDS data, the proportion of tortoises that were alive (i.e., live tortoises/[live +dead tortoises]) was then calculated for each cell. A test statistic was then derived for eachcell, which consisted of the observed proportion of tortoises that were alive in each cellminus the proportion calculated from all cells combined (0.284).
The test statistics for each of the 18 cells (Table 4.7) were tested for significance using arandomization method. To produce a randomized set of data the 609 transects wererandomly reallocated to the 18 cells. This was done 10,000 times. The p-value for thestatistic from the ith cell was then the proportion of times that the randomized sets of datagave a value as far or further from zero than the observed test statistic. In addition, a 19thstatistic was calculated, which consisted of the maximum of the absolute values of thestatistics for the individual cells. This was then used to calculate an overall test ofdifferences between the cells and for all of the data.
As shown in Table 4.7, there are significant results for cells 6, 7, 12, and 16, and for themaximum statistic. There is also a nearly significant result for cell 15. It is morecompelling to view the data graphically. Distinct areas, as defined by groupings of pointswith the same color with lower (red) or higher probabilities (green) of live encounters areclearly identifiable in Fig. 4.20.
Table 4.7 Observed ratios of live to dead tortoises. The P values indicate bins of transects in whichthe ratios were different from that expected at random. The sign of the observed value indicates thedirection of the difference.
Bin Observed Value P-value Bin Observed Value P-value1 0.08 0.45 10 0.09 0.092 -0.13 0.24 11 0.01 0.853 0.10 0.47 12 -0.14 0.044 0.06 0.30 13 -0.06 0.565 0.10 0.47 14 0.05 0.436 -0.28 0.002 15 -0.21 0.077 0.29 0.008 16 0.52 0.0018 0.03 0.75 17 0.05 0.549 0.05 0.54 18 0.22 0.09
Max 0.52 0.004

DTRPAC Report page 71
Fig. 4.20 Results from the resampling analysis - Areas depicted in red are points in bins 6 and 12,which had lower than average probabilities of live encounters; green points are bins 7 and 16,which had higher proportions of live animals. Points in all other bins are blue in color.
Logistic Regression
Another analysis was possible based upon logistic regression. The regression calculates theprobability of a tortoise being live at a distance E km east and N km north from easting414493 and northing 3825771 and is given by
P(E,N) =exp(ß0 + ß 1E + ß 2N + ß 3E.N + ß 4E2 + ß 5N
2)/{1 + exp(ß 0 + ß 1E + ß 2N + ß 3E.N + ß 4E2 + ß 5N
2)}.
Data for this analysis were restricted to transects on which both live and/or dead tortoiseswere observed. Each of these transects then provided one observation on the number of

DTRPAC Report page 72
tortoises that were live in a sample of n tortoises. It is possible that higher order polynomialterms are needed in the equation to describe better the spatial changes in the probability ofa tortoise being live. This was not investigated.
The following analysis of deviance shows that the model accounts for a significant amountof the variation in the data (Tables 4.8 and 4.9). The mean deviance is much larger thanone, indicating that part of the variation in the data is not properly accounted for. Thisconfirms that it would be worth investigating adding higher order polynomial terms into theequation. A kriging surface mapping the conditional probability of being alive in 2001 arepresented in Fig. 4.21.
This analysis asks the question, if a tortoise is found on a transect, what is the probabilitythat it is a live tortoise? The region in the northern portion of the Fremont-Kramer DWMAand the northwestern portion of the Superior-Cronese DWMA had noticeably lowerprobabilities of encountering a live tortoise relative to other portions of the DWMAs.
Table 4.8 Statistical table for the logistic regression analysis.
df Meandeviance
Deviance Devianceratio
Approx chipr.
Regression 5 47.8 9.56 9.56 <.001Residual 300 820.5 2.74
Total 305 868.3 2.85
Table 4.9 The estimated coefficients for the logistic regression model.
Estimate s.e. t(*) t pr.Constant 1.966 0.63300 3.11 0.002E -0.02214 0.00506 -4.37 <.001N -0.02654 0.00979 -2.71 0.007EN 0.0000791 0.0000251 3.15 0.002E2 0.0000480 0.0000133 3.61 <.001N2 0.0000348 0.0000427 0.82 0.414

DTRPAC Report page 73
Fig. 4.21 Results from the logistic regression analysis. Cooler colors indicate higher probabilitiesof encountering a live tortoise, and warmer colors indicate a lower probability.
4.3.5 Kernel Analyses(distance sampling transects, range-wide, 2001).
The analyses presented above are useful for comparisons among DWMAs, but do notindicate where within an individual DWMA one would be more likely to find live tortoises.The kernel, cluster, and conditional probability of being-alive analyses presented belowhowever, do indicate where within a DWMA one would expect to find live tortoises. Thistype of within-DWMA spatial analysis requires that the sample transects be significantlyspatially random or regularly distributed. As such (for reasons given above), only the 2001LDS data were used.

DTRPAC Report page 74
This analysis used adaptive kernels (frequently used for home range analyses) to smooththe distributions of the observations of live tortoises and carcasses on the distance samplingtransects to look for lack of overlap in regions of these two smoothed distributions. Datawere separated into groups of adjacent DWMAs that had similar numbers of transects perarea. Observations from these groups were separated into two datasets, one for liveobservations and one for carcass observations. Kernel analyses were conducted for both thelive tortoises and carcasses for each of the groupings. The kernels were created using theAnimal Movement Extension (v 2.04b, Hooge and Eichenlaub 2001) for ArcView 3.2(ESRI, Redlands, CA). The smoothing factor (H) was reduced to a value below that of thedefault to constrain the kernels to areas that were close to the boundaries of the sampledareas. These smoothing factors were taken to be the same for the carcass and live kernelsfor each area. Separate kernel analyses were conducted for the following areas which aregenerally denoted by the DWMAs included therein: 1) Upper Virgin River (Fig. 4.22); 2)Beaver Dam Slope/Mormon Mesa/Gold Butte-Pakoon (Fig. 4.23); 3) Coyote Springs (Fig.4.24); 4) Piute-Eldorado Valley (Fig. 4.25); 5) Chuckwalla (Fig. 4.26); 6) JoshuaTree/Pinto Mountain (Fig. 4.27); 7) Chemehuevi (Fig. 4.28); 8) Ivanpah (Fig 4.29); andFremont-Kramer/Superior-Cronese, and Ord-Rodman (Fig. 4.30).
The kernel analyses revealed several areas in which the kernel estimations for live tortoisesand carcasses did not overlap. The pattern of non-overlapping kernels that is of greatestconcern are those in which there were large areas where the kernels encompassed carcassesbut not live animals. These regions represent areas within DWMAs where there were likelyrecent die-offs or declines in tortoise populations. This pattern occurred in half of the areasfor which kernel analyses were conducted (Figures 4.24, 4.25, 4.29, 4.30). It should benoted that a few of these areas had relatively few transects (Fig. 4.25, 4.29), and that thedata underlying all of these results come from only one year of sampling (2001).
Kernel analyses for the Upper Virgin River (Fig. 4.22), Chemehuevi (Fig. 4.28), JoshuaTree/Pinto Mountain (Fig. 4.27), and Chuckwalla (Fig. 4.26) DWMAs had distributions oflive and dead animals that were more like what we expect to occur in “normal” tortoisepopulations, in that carcasses occurred in the same areas as live animals and not inextensive areas absent of live animals.

DTRPAC Report page 75
Fig. 4.22 Kernel analysis for the Upper Virgin River DWMA. The 95% kernel for live animalsis indicated by the green polygon; the 95% kernel for carcasses is indicated by the red outlinedpolygon. Transects that were sampled for which no tortoises (live or dead) were found areindicated by the letter X on the map.

DTRPAC Report page 76
Fig. 4.23 Kernel analysis for the Beaver Dam Slope / Mormon Mesa / Gold Butte-PakoonDWMAs. The 95% kernel for live animals is indicated by the green polygon; the 95% kernelfor carcasses is indicated by the red outlined polygon. Transects that were sampled for whichno tortoises (live or dead) were found are indicated by the letter X on the map.

DTRPAC Report page 77
Fig. 4.24 Kernel analysis for the Coyote Springs Valley DWMA. The 95% kernel for live animalsis indicated by the green polygon; the 95% kernel for carcasses is indicated by the red outlinedpolygon. Transects that were sampled for which no tortoises (live or dead) were found areindicated by the letter X on the map.
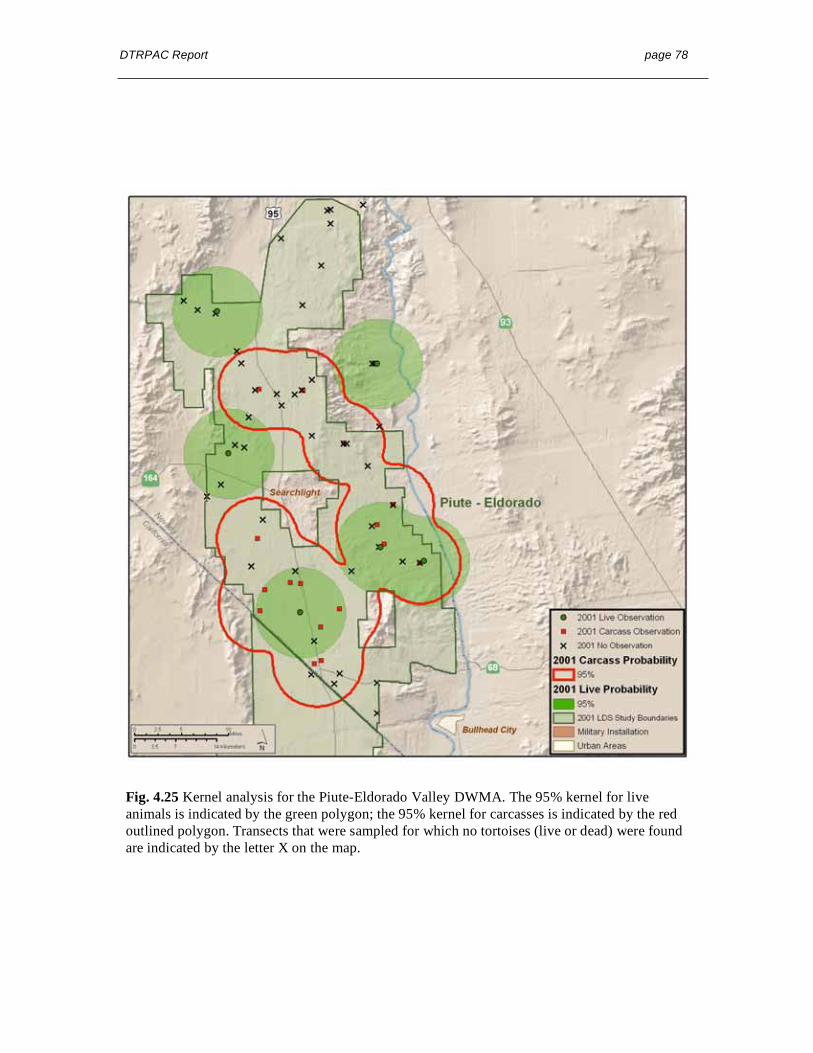
DTRPAC Report page 78
Fig. 4.25 Kernel analysis for the Piute-Eldorado Valley DWMA. The 95% kernel for liveanimals is indicated by the green polygon; the 95% kernel for carcasses is indicated by the redoutlined polygon. Transects that were sampled for which no tortoises (live or dead) were foundare indicated by the letter X on the map.

DTRPAC Report page 79
Fig. 4.26 Kernel analysis for the Chuckwalla DWMA. The 95% kernel for live animals isindicated by the green polygon; the 95% kernel for carcasses is indicated by the red outlinedpolygon. Transects that were sampled for which no tortoises (live or dead) were found areindicated by the letter X on the map.

DTRPAC Report page 80
Fig. 4.27 Kernel analysis for the Pinto Mountain and Joshua Tree DWMAs. The 95% kernelfor live animals is indicated by the green polygon; the 95% kernel for carcasses is indicatedby the red outlined polygon. Transects that were sampled for which no tortoises (live or dead)were found are indicated by the letter X on the map.

DTRPAC Report page 81
Fig. 4.28 Kernel analysis for the Chemehuevi DWMA The 95% kernel for live animals isindicated by the green polygon; the 95% kernel for carcasses is indicated by the red outlinedpolygon. Transects that were sampled for which no tortoises (live or dead) were found areindicated by the letter X on the map.

DTRPAC Report page 82
Fig. 4.29 Kernel analysis for the Ivanpah DWMA. The 95% kernel for live animals isindicated by the green polygon; the 95% kernel for carcasses is indicated by the red outlinedpolygon. Transects that were sampled for which no tortoises (live or dead) were found areindicated by the letter X on the map.

DTRPAC Report page 83
Fig. 4.30 Kernel analyses for Fremont-Kramer / Superior-Cronese, and Ord-Rodman DWMAs.The 95% kernel for live animals is indicated by the green polygon; the 95% kernel forcarcasses is indicated by the red outlined polygon. Transects that were sampled for which notortoises (live or dead) were found are indicated by the letter X on the map.

DTRPAC Report page 84
4.3.6 Nearest Neighbor Clustering(distance sampling transects, Western Mojave, 2001).
Nearest Neighbor Hierarchical Clustering analysis was used to identify clusters of livetortoises and carcasses within the Western Mojave. These analyses were performed usingCrimeStat II (Levine 2002). Spatial randomness of distance sampling data (2001-2003) andtotal corrected sign data (1998, 1999, and 2001) was tested. The tests included analysis ofeach year, all years, and both. All analyses were using the ArcView extension AnimalMovement (Hooge and Eichenlaub 2001). The results of these tests confirmed that distancesampling transects in 2001 were randomly distributed. However, all other years and allcombinations of years and methods were statistically spatially clustered. Thus, only datafrom 2001 were analyzed. As with the kernel analyses, where one finds live animals onewould expect to find carcasses at some level, although the draft West Mojave Plan (BLM etal. 2003, Appendix L) reported that carcass counts were not correlated with transect livetortoises counts. However, our analyses were conducted for presence and absence and notfor densities. Where one finds carcasses and no live animals there is cause for concern,suggesting recent die-offs in these areas.
The Nearest Neighbor Hierarchical Spatial Clustering routine used by CrimeStat is aconstant-distance clustering routine that groups points together on the basis of spatialproximity (Levine 2002). The threshold distance (i.e., the confidence interval around arandom expected distance of a pair of points) was set to 0.95 (i.e., fewer then 95% of thepairs could be expected to be as close or closer by chance). Only pairs of points that arecloser together than this threshold distance are grouped together as clusters. The minimumnumber of points required to create a cluster was set to 5. The size of the ellipse around thecluster was set to one standard deviation, which would cover about 65% of the points.
The Cluster analysis revealed numerous patterns of statistically significant live and carcassclusters, and these clusters did not overlap in several areas. These include; central Fremont-Kramer, western Superior-Cronese, and numerous areas within the Western Mojave (Fig.4.31).

DTRPAC Report page 85
Fig. 4.31 Nearest Neighbour Hierarchical Cluster analysis for the Western Mojave. Greenareas are clusters of living tortoises; red outlines are clusters of carcasses.

DTRPAC Report page 86
4.4 Implications of Population and Spatial Analyses
The spatial analyses provided in this report are examples of the kinds of analyses thatshould be considered by a possible future recovery team and by the science advisors to theUSFWS. We recommend that similar analyses be conducted for the rest of the listed range.We also recommend analyses with additional years of data when suitable data becomeavailable. Time and data limitations have prevented the DTRPAC from completing allpossible analyses for this report.
The Western Mojave (Recovery Unit/DPS) has experienced marked population declinesover time (Fig 4.6). This was indicated in the original Recovery Plan and continues today.Spatial analyses of the West Mojave show areas with increased probabilities ofencountering dead rather than live animals (Fig. 4.18, 4.19, 4.20, and 4.21), areas wherekernel estimates for carcasses exist in the absence of live animals (Fig. 4.31), and extensiveregions where there are clusters of carcasses where there are no clusters of live animals(Fig. 4.31). Collectively, these analyses point generally toward the same areas within theWest Mojave, namely the northern portion of the Fremont-Kramer DWMA and thenorthwestern part of the Superior–Cronese DWMA. Together, these independent analyses,based on different combinations of data, all suggest the same conclusion. The managementstrategy and implementation of recommended management actions over the last decade inWest Mojave Recovery Unit have not slowed the decline of tortoise populations, andtortoise numbers are plummeting. Indeed the Draft West Mojave Plan (WMP) points outproblems within the same areas highlighted in our analysis. For example, despitehistorically high densities of tortoises (BLM et al. 2003, map 3-7) within some portions ofthe West Mojave Recovery Unit, analyses in the West Mojave Plan indicate recent die offs(BLM et al. 2003, map 3-12) and higher-than-average sign counts (BLM 2003, map 3-8) inthe same regions as presented by our independent analyses of the data.
Data are not currently available (i.e., they either do not exist or are not easily accessible)with the same detail for most of the range of desert tortoises. Nevertheless, it is possible tocompile and digitally catalog corrected sign data for other recovery units within the listedrange, but not without considerable time and money. We had additional historical data forpermanent study plots and recent data from distance sampling surveys for these regions,and they were similarly analyzed but not reported. Kernel analyses of DWMAs withinother Recovery Units and Distinct Population Segments also show areas of non-overlapping carcass and live animal distributions (e.g., Fig. 4.24, 4.25, 4.29 and 4.30) andthis signals reason for concern for these areas. Ivanpah (Fig. 4.29) and Piute–EldoradoValley (Fig. 4.25) contained study plots that were analyzed in the East Mojave RecoveryUnit analysis (Fig. 4.6). While there was no overall statistical trend in adult density overtime, the 2000 survey at Goffs and the 2002 survey at Shadow Valley indicate lowdensities of adult tortoises relative to earlier years. Unfortunately there are no data in thelatter years for all five study plots within this recovery unit, and therefore, while there is nostatistical trend in adult densities, we cannot conclude that tortoises have not experiencedrecent declines in this area. The probability of finding a carcass on a distance samplingtransect was considerably higher for Ivanpah, Chemehuevi, Fenner, and Piute-Eldorado

DTRPAC Report page 87
which make up the Eastern Mojave Recovery Unit and portions of the Northeastern Mojaveand Eastern Mojave/Colorado Desert DPSs (Table 4.6).
The kernel analysis for the Piute-Eldorado Valley (Fig 4.25) indicated large areas wherethere were carcasses, but no live animals were found. For this entire area in 2001, therewere 166 km of transects walked, and a total of six live and 15 dead tortoises were found,resulting in a live encounter rate of 0.04 tortoises per km for this area. This encounter ratewas among the lowest for that year for any of the areas sampled in the listed range.Analyses of the study plots for the Eastern Mojave Recovery Unit (Fig. 4.6) and the EastMojave and Colorado DPS (Fig. 4.16) do not indicate significantly declining densities ofadult tortoises prior to 1997. The kernel analysis for the Ivanpah DWMA also indicateslarge areas where only carcasses were found and smaller areas where live animals occurred(Fig. 4.29). Analyses of the study plots for the Lower Virgin River DPS (Fig. 4.19) and theEastern Mojave Recovery Unit (Fig. 4.6) do not indicate significant declines in adultdensity over time (although note the apparent declines on the Beaver Dam Slope Exclosureand Virgin Slope plots noted in Section 4.2.5).
The Coyote Springs Valley DWMA is included in the Lower Virgin River DPS plotanalysis. While the kernel analysis for this region showed areas where the distributions ofcarcasses and living tortoises do not overlap (Fig. 4.24), densities of adult tortoises for theregion do not show a statistical trend over time (Fig. 4.6). Thus, while there may be a localdie-off occurring in the northern portion of this DWMA, this does not appear to influencethe overall trend in the region as interpreted by study plot data. However, as stated above,the data for permanent study plots for this region were discontinued after 1996. Thus, ifthere have been recent declines in numbers, they are not reflected in our analyses of studyplots. Nevertheless, we did not see large regions of non-overlapping carcass and livetortoise kernels in the regions adjacent to the Coyote Springs Valley DWMA (Fig. 4.24).The probability of finding either a live tortoise or a carcass was relatively very low forBeaver Dam Slope and Gold-Butte Pakoon and moderately low for Mormon Mesa/CoyoteSprings Valley (Table 4.6) all within the Lower Virgin River DPS.
The Eastern Colorado Recovery Unit contained only two study plots, and analyses of adultdensities over time indicate that there may be declines in this area (Fig. 4.12). Frominspection of the density data, it appears that this is likely due to declines in adult densityfor the Chuckwalla Bench plot, but not the other plot (Fig. 4.12). The kernel analysis of thisarea shows that the distributions of the living tortoises and carcasses overlap for most of theregion sampled by LDS (Fig. 4.26). The Chuckwalla Bench study plot is outside of thedistance sampling study area, and this creates a problem in evaluating what may beoccurring in that area of the DWMA. However, the few transects walked in that portion ofthe DWMA yielded no observations of live or dead tortoises. This illustrates our concernfor drawing conclusions from areas represented by too few study plots and leaves us withguarded concern for this region. The percentage of transects with live animals wasrelatively high for most DWMAs within the Eastern Colorado Recovery Unit (Table 4.6).In addition, the ratio of carcasses to live animals was low within this recovery unit relativeto others (Fig 4.18).

DTRPAC Report page 88
Desert tortoise populations defy definition in terms of population dynamics even after 30years of data from a wide variety of studies. In particular, the existing paradigm and theoriginal Recovery Plan treated desert tortoise population dynamics and planned forrecovery as individual populations. However, the temporal dynamics revealed in existingdata and theory, and the clear indication that populations of tortoises respond remarkablyslowly, suggest that this original paradigm needs re-evaluation. Specifically, it is notknown if desert tortoises have evolved to exist in single large populations or inmetapopulations. The prescriptions for recovery in the Plan were for individual populationsand assumed that preserving large blocks of habitat and managing threats in that habitatwould be principally all that would be necessary to recover the species. However, thatoriginal paradigm, and the prescriptions made within that paradigm, may be wrong anddangerously misleading and ineffective. Consider, for example, that existing data haverevealed population crashes occurring asynchronously across the range. There are reportsthat some populations, which have crashed previously, have subsequently increased inpopulation density. Additionally, everywhere where populations have been dense, thosepopulations have crashed. This suggests that density-dependent mortality occurs in deserttortoise populations, and that population dynamics may be asynchronous.
These characteristics indicate that tortoises may exist in a classic metapopulation (Hanski,1999, Levins and Culver 1971, Levins et al. 1984), and this should portend profoundlydifferent prescriptions for recovery. In particular, if desert tortoises have historicallyexisted in metapopulations, then connections among habitat patches are a necessary part ofconservation prescriptions. Additionally, habitat suitable for tortoises, but without tortoises,should be regarded as equally necessary for recovery. Assessing the state of ametapopulation (including the long-term persistence of the species) will be entirelydifferent and needs to be the subject of future research and consultation. Long-termpersistence cannot be determined from tortoise density or tortoise numbers alone, butassessment must include the complexities of metapopulation dynamics and the habitatcharacteristics that promote metapopulation dynamics (habitat connectivity throughinefficient corridors (i.e., partial connectivity), asynchrony of subpopulation dynamics,several separate habitat patches, and others). Some of the characteristics of propermetapopulation function may already have been obviated by proliferation of highways, andhabitat fragmentation due to satellite urbanization. Thus, management may requireartificially facilitating metapopulation processes such as movement among patches. Insofaras having the correct paradigm is central to recovery success, this is a critical area requiringattention by science consultants to the USFWS.
Plot and Spatial Analysis Recommendations
1. There were several recovery units and proposed DPSs that contained too fewpermanent study plots to be analyzed either with any power, or at all. If studyplot sampling is to continue, it would be better if there were enough study plotsto represent the different scales of management areas. As a study plot is in itselfonly a sample, and not representative of an entire area, it would be beneficial tohave several plots within each area upon which future analyses are to beconducted, for example a DPS, or even for DWMAs within DPSs.

DTRPAC Report page 89
2. If permanent study plots are to be continued (see, for example,recommendations in Section 3), then there should be some agreement amongthe surveying agencies to share the data for the greater good of the tortoisespecies. Permanent study plots played a key role in this committee'sinterpretation of the current status of tortoise populations, but it is possible thatsome of the conclusions reached as a result of our analyses could be differenthad additional years of data been available. However, the trend from theWestern Mojave is a solid conclusion that cannot be disputed.
3. We found the exploration of new analyses, especially those that can beconducted with existing data or with little modification of current monitoringmethods, to be extremely valuable toward understanding the status of tortoisepopulations and the inadequacies of current monitoring. These types of analysesshould be part of any future reporting on status and trends of desert tortoise tothe MOG, DMG, and/or Congress. These kinds of analyses should be preparedby a body like the recommended Desert Tortoise Recovery Office discussed inSection 7.3 of this report, so that regular advice can provide a means towardsimproved monitoring.
4. The paradigms of population/metapopulation dynamics need to be re-evaluated.This may require explicit experimental research to dissect the driving ecosystemprocesses important to long-term persistence of desert tortoise populations ormetapopulations.
4.5 Status and Trends of Habitat and Environmental Setting for TortoisePopulations
An efficacious monitoring program should be multidimensional, including monitoring ofpopulations, monitoring the extent and condition of habitat, and monitoring threats totortoises. Monitoring habitats and threats has not previously been part of the protocols formonitoring the desert tortoise, so analyses of past efforts is not possible. However, it ispossible retrospectively to provide examples of how such analyses can be conducted. Wepresent the examples below as “case studies.”
4.5.1 Road Case Study
Habitat monitoring considers variables related to the physical environment of the deserttortoise. These variables can include natural processes, such as climate and weather, andanthropogenic threats, such as presence of roads, livestock grazing, urbanization, etc. Inthis case study, we explore the temporal distribution of routes (i.e., roads) inventoriedbetween the mid 1980s and 2001 and the co-occurrence of above average vehicle impactareas with higher density TCS and die-off regions as presented by the West Mojave Plan(BLM et al. 2003).

DTRPAC Report page 90
Roads are conduits by which humans come into contact with tortoises. Hence,understanding the relationship between the presence of roads and tortoise populationdynamics may be important to formulating desert tortoise recovery strategies. The originalRecovery Plan recommended: 1) prohibiting vehicles from driving off roads; 2) restrictingproliferation of new roads; 3) closing vehicle access to all but designated routes; and 4)implementing emergency closures of unpaved roads and routes as needed to reduce humanaccess and disturbances in areas where human-caused mortality may have caused negativepopulation trends. The plan also specifically highlighted the need to halt unauthorized ORVuse in the Fremont-Kramer DWMA (USFWS 1994, Table 4.3).
The comparisons made in this case study use the best data available to the DTRPAC.However, we are aware that both road and tortoise data are imperfect, thus we identifypossible scenarios resulting from these imperfections and geographic regions within theWestern Mojave that yield contradictory relationships between the presence of roads andtortoise sign.
The following data were used in this case study: 1985-87 (Fig. 4.32) and 2001 routes (Fig.4.33) provided by the BLM. Above average vehicle impact areas, areas identified as higherthen average sign counts, and areas with recent die-offs (Fig 4.34) were taken from theWest Mojave Plan. In the following section, inventory and any of its variants, is used torepresent routes (i.e., roads) without dealing with official designation (i.e., open, closed,undetermined, etc.). Different methods were used by the BLM to inventory routes between1985-87 and 2001. In particular, Global Positioning System (GPS) and GeographicInformation Systems (GIS) were used for locating and mapping roads in 2001 but not in1985-87. Thus, the 2001 inventory is likely to be more detailed and more accurate than theinitial 1985-87 inventory. Despite this discrepancy, the data used for this case studyrepresent the best available data, data for which management and policy decisions havebeen made, and data for which management and policy decisions are being made currently(e.g., WMP and West Mojave Route Designation).
The 2001 inventory of roads (Fig. 4.33) indicates that a higher density of roads currentlyexists within DWMAs in the West Mojave than was documented in 1985-87 and also thatmore roads are currently documented than were documented in 1985-87 (Fig. 4.34). Oneexplanation for the increase in road density in the Western Mojave is that the number ofroads increased during this period. Based on the increased human population in the westernMojave during this time, an actual increase in roads is a plausible and likely explanation forthe increase in inventoried roads. This is especially likely considering the popularity ofvehicle-based recreation in the desert leading to the legal and illegal creation of single andtwo-track routes. However, an important alternative explanation exists. It is plausible andlikely that at least some of the recently mapped roads are historic rather than newly created,especially considering the effectiveness of GPS-based mapping and increased survey effortin recent years. This alternative hypothesis is important because arithmetically it is possiblethat the rate of discovery of established roads (better technology and greater effort)exceeded the rate of road closures (management action) and resulted in more apparentroads. It is possible that the question of recent road creation could be resolved by analyzingconsistently collected data such as satellite and aerial surveys that documented the presence

DTRPAC Report page 91
or absence of roads in the Western Mojave from 1987-2001.The DTRPAC encouragesmanagement agencies to consider performing this analysis.
The tortoise population dynamics information for the western Mojave also has caveats. Inparticular, the “higher density TCS areas” may have used burrow counts as well assightings of live tortoises and tortoise scats. Hence, it is possible that higher than averageTCS may be inflated relative to other surveys techniques. This is an example of thedifficulties that arise when data are inconsistently collected, named, and reported.
The number of inventoried routes increased significantly between 1985-87 and 2001 (Fig.4.32 and 4.33). The spatial location of open routes between 1985-87 and 2001 has changedsignificantly (Fig 4.35 and 4.36). The red lines in Fig. 4.35 represent 2001 officiallydesignated open routes that were not similarly designated as such in 1985-87. In somecases these routes may have existed in 1985-87 but failed to be inventoried, or ifinventoried they were not designated as open. The blue lines in Fig. 4.36 represent 1985-87officially designated open routes that were not officially designated as open in 2001. Insome cases these routes may no longer exist, they exist but were not inventoried in 2001, orthey may still exist but were not officially designated as open in 2001.
We identified 6 regions within the western Mojave roads case study that each indicate adifferent potential relationship between roads, higher then average TCS densities, andtortoise die-off regions (Fig. 4.34). We identify tortoise die-off regions within and outsidevehicle use areas (Fig. 4.34, regions A and B, respectively); higher then average TCSdensities within and outside of vehicular areas (Fig 4.34, regions C and D, respectively);areas simultaneously with high die-off, high TCS, and vehicle use (Fig. 4.34, region E);and areas with simultaneous high die-off, high TCS, and no vehicle use (Fig. 4.34, regionF). A superficial explanation for these results is that vehicle use is unrelated to higher thanaverage density TCS and/or die-off regions. This interpretation is incongruous with otherindications that tortoise mortality is linked to human encounters via roads and wouldrequire a reinterpretation of other studies. Alternatively, there are many kinds of vehicleuse and some uses are relatively innocuous to tortoises whereas other uses are deleterious.It is also possible that the data in this comparison lack sufficient resolution to detect thereal and complex relationships between TCS, carcasses, roads, and vehicle use.
Road Case-Study Recommendations
1. Management agencies should compare historic satellite and aerial surveys tobetter document changes in road density.
2. Despite ambiguities in the current case study, a similar approach could beemployed using rigorously collected data to reveal real and importantrelationships between tortoise population dynamics and presence of roads orother aspects of, or impacts to, desert tortoise habitat.

DTRPAC Report page 92
Fig. 4.32 Routes in the Western Mojave DWMAs in 1985-87. Blue routes were designated as open,brown as either closed, limited, undetermined, or non-route. Large roadless areas such as southwestOrd-Rodman, and the most southwestern portion of Fremont-Kramer were not without roads in1985-87, but were instead not inventoried. On the other hand, the DTNA was designated by theBLM as an Area of Critical Environmental Concern and fenced in the late 1970’s, thus creating aroadless area.

DTRPAC Report page 93
Fig. 4.33 Routes in the Western Mojave DWMAs in 2001. Orange routes were designated asopen, brown as either closed, limited, or non-BLM owned routes. The most southwestern portionof Fremont-Kramer remains un-inventoried as does portions of northern Fremont-Kramer,excluding the DTNA.

DTRPAC Report page 94
Fig. 4.34 Distribution of above average vehicle based impacts areas, higher then average TCS andrecent die-off regions as reported by the West Mojave Plan (BLM et al 2003). Letters are explainedin the text.
A)
B)
D)F)
C)
E)

DTRPAC Report page 95
Fig. 4.35 Comparison of 1985-87 and 2001 designated open BLM routes. The red routesrepresent 2001 routes not formally designated as open in 1985-87. The lack of designation asopen in 1985-87 could be a result of the fact that the route was inventoried in 1985-87 but notdesignated as open, not inventoried in 1985-87 but existing, or not existing in 1985-87.

DTRPAC Report page 96
Fig. 4.36 Comparison of 2001 and 1985-87 designated open BLM routes. The blue routesrepresent 1985-87 routes not formally designated as open in 2001. The lack of designation asopen in 2001 could be the result of the fact that the route was inventoried in 2001 but notdesignated as open, not inventoried in 2001 but existing, or not existing in 2001.

DTRPAC Report page 97
4.5.2 Patterns of Precipitation Case Study
It is important to assess the natural variation in the physical environment as well as theanthropogenically-altered environments. Drought has been hypothesized potentially to causepopulation declines in desert tortoise populations. To assess the extent to which there havebeen trends in precipitation, we obtained data on precipitation from all known weatherstations in the Mojave. These data were parsed into cumulative rain that would affectproduction of spring annual plants (precipitation within November to April) and rainresulting from summer monsoonal thundershowers (precipitation within May to October).These data were assembled for three locations in the Mojave (Table 4.10) and averages foreach region and for each season were plotted in Fig. 4.37. Clearly, the regions have differentpatterns of rainfall, as the West Mojave has almost all of its rainfall in the winter season.Also, clearly, there is no long-term trend in rainfall amounts or in patterns of droughtduration. The variability of precipitation from year-to-year is very large, and the onlyapparent conclusion one can draw from the data is that the amount of precipitation and theoccurrence of drought are not especially predictable measures for any place in the Mojave.Thus, the absence of a clear pattern suggests that precipitation alone (i.e., not in concert withother stressors) cannot account for downward trends in population sizes in the Mojave.
Table 4.10 Weather stations in the Mojave Desert used in analysis of precipitation (Fig. 4.37).
Northeast-Sonoran East Group West GroupBEAVER DAM BOULDER CITY ADELANTO
BULLHEAD CITY DESERT NATL WL RANGE APPLE VALLEY
BUNKERVILLE DUNN SIDING BARSTOW
CALLVILLE BAY KYLE CANYON RANGER STN CANTIL
DAVIS DAM LAS VEGAS MCCARRAN INTL AP CHINA LAKE NAF
ECHO BAY MITCHELL CAVERNS EL MIRAGE
KINGMAN MOUNTAIN PASS HESPERIA
LAKE HAVASU NORTH LAS VEGAS INYOKERN
LAUGHLIN RED ROCK CANYON ST PK LUCERNE VALLEY 1 WSW
LITTLEFIELD 1 NE SEARCHLIGHT MOJAVE
LOGANDALE SUNRISE MANOR LAS VEGAS RANDSBURG
LYTLE RANCH SHOSHONE TRONA
MESQUITE VICTORVILLE PUMP PLANT
NEEDLES
OVERTON
PARKER RESERVOIR
PIERCE FERRY 17 SSW
ST GEORGE
TEMPLE BAR
TRUXTON CANYON
VALLEY OF FIRE ST PK
WIKIEUP
WILLOW BEACH
YUCCA 1 NNE

DTRPAC Report page 98
Fig. 4.37 Seasonal rainfall in the Mojave Desert, 1930-2000.

DTRPAC Report page 99
Patterns of Precipitation Case Study Recommendations
This type of analysis should be conducted for other specific threats to desert tortoisepopulations, as well as ecological variables that may also influence tortoise populationstatus (e.g., rainfall, Fig. 4.37). Such analyses will provide managers and scientists with acomprehensive database of the current environmental setting under which tortoise recoveryis taking place and will provide the basis for future hypothesis-based monitoring of tortoisepopulations relative to threat mitigation and environmental change.
4.5.3 Disease Case Study
Because disease has been such a prevalent issue throughout the range of the desert tortoise,it seems appropriate to consider it in some depth here, as an aspect of the status of thespecies’ environmental setting. The Recovery Plan mentions two diseases specifically,shell dyskeratosis (section I.B.3) and upper respiratory tract disease (sections I.B.3 andII.D.3.b.1, appendix D.IV.C). Other potentially important diseases not mentionedspecifically include herpesvirus (THV) (Pettan-Brewer et al. 1996), iridovirus (Westhouseet al. 1996), and fungus (Homer et al. 1998, Rose et al. 2001) infections. Diseases ingeneral are mentioned or implied for topics such as sources of mortality (USFWS 1994,Section II.D.b.2) and translocation (USFWS 1994, Appendix B.6).
Shell dyskeratosis is not uncommon in both the desert tortoise and the gopher tortoise. Thedisease may be related to nutrient deficiency or to toxins (Jacobson et al. 1994, Homer etal. 1998, Christopher et al. 2003; E.R. Jacobson, pers. comm.). A direct connectionbetween shell dyskeratosis and population decline in tortoises has not been established. Acorrelation between the presence of shell dyskeratosis and a die-off of individuals has beenreported for a site in California (Berry 1997), yet numerous other threats (Boarmann 2002)are also present at that site. In addition, no correlation exists between frequency of shelldyskeratosis and population declines in the Sonoran Desert (Arizona Game and FishDepartment, unpublished data).
Little was known about the relationship of Mycoplasma to tortoise disease when theRecovery Plan was developed. Likewise, the potential relevance to the desert tortoise ofstudies of Mycoplasma in the gopher tortoise was little appreciated when the Recovery Planwas developed. Upper respiratory tract disease (URTD) now is confirmed to be the resultof infection by Mycoplasma agassizii in both the desert tortoise and gopher tortoise (Brownet al. 1994, 1996). Furthermore, another, closely related, species of Mycoplasma, M.cheloniae, has been isolated from tortoises, and two more species of mycoplasma areknown from tortoises, but not as yet isolated (Brown et al. 2002; M.B. Brown, pers.comm.). Important studies of respiratory mycoplasmal infection in tortoises published since1994 include Jacobson et al. (1995), Berry (1997), Epperson (1997), Lederle et al. (1997),McLaughlin (1997), Schumacher et al. (1997, 1999), Smith et al. (1998), Brown et al.(1999), and Diemer-Berish et al. (2000). A direct cause/effect relationship betweenrespiratory mycoplasmal infection and population decline in tortoises has not beenestablished, although a provocative correlation between the presence of URTD and die-offs

DTRPAC Report page 100
of individuals of both the desert tortoise and the gopher tortoise has been documented atsome locations (Jacobson et al. 1995, Berry 1997, Rabatsky and Blihovde 2002, Seigel etal. 2003; K.H. Berry, pers. comm.; J.E. Diemer-Berish, pers. comm.).
Mycoplasma agassizii is easily transmitted horizontally by direct contact between hostindividuals (McLaughlin 1997, Brown et al. 2002). Although other Mycoplasma are knownto be transmitted vertically from host mother to offspring and via fomite, such modes oftransmission have not been demonstrated for M. agassizii (Brown et al. 2002). Because M.agassizii is so easily transmitted horizontally, isolating infected individuals is anappropriate means to control spread. Isolation of infected individuals is only a part of thegeneral strategy for control of an infectious disease, which should include diagnosis,quarantine, culling or segregation, physical separation, sentinels, and long-term monitoring(M.B. Brown, pers. comm.). How much time, effort, and funds are put into implementingthis strategy for a particular disease depends, in large part, on the perceived risk to the host:the greater the perceived risk, the larger the commitment. For example, although theviruses that can cause another upper respiratory tract infection, the “common cold” inhumans, are extremely contagious, virtually no control strategy for the pathogens has beenimplemented, because the perceived risk is low, despite the fact that individuals sometimesdevelop secondary infections and occasionally succumb to the – largely indirect – effects ofthe viruses. Assessing risk is particularly difficult in situations, such as those surroundingboth the desert tortoise and the gopher tortoise, in which many of the relevant facts thatbear on the assessment simply are uncertain or unknown. We return to assessing risk later.
What is known and what is not known?
A great deal has been learned about the relationship of Mycoplasma to tortoise disease,mostly since the Recovery Plan was developed. It is certain (Brown et al. 2002) that:
• Mycoplasma agassizii (strains PS6 and 723) is a cause of URTD
• The pathology of mycoplasmosis involves hyperplastic and dysplastic lesions of theupper respiratory tract
• Clinical signs of URTD vary in onset, duration, and severity
• Mycoplasmosis has a chronic phase and may be clinically silent (subclinical) inadult tortoises
• Infection with M. agassizii elicits specific antibody responses that can be detectedby ELISA
• The current ELISA may not be able to detect exposure of all tortoises tomycoplasmas other than M. agassizii, although some cross-reactions do occur
• The antibody responses to M. agassizii are detectable by ELISA beginning eightweeks after experimental infection
• Under experimental conditions, gopher tortoises become ill quicker after repeatedexposure to M. agassizii

DTRPAC Report page 101
• Colonization of the upper respiratory tract with M. agassizii may be detected byculture and PCR, but assay sensitivity is not as high as the ELISA
• Mycoplasmosis is a horizontally transmissible disease
Note, first, that the important information that we know with certainty relates entirely toindividual tortoises and not to populations. We return to current understanding at the levelof the population later. Secondly, important uncertainties and unknowns remain even at thelevel of individual tortoises. For example, it is probable, but not clearly established (Brownet al. 2002) that:
• Pathogenic and nonpathogenic tortoise mycoplasmas exist
• There is variation among strains of Mycoplasma agassizii in their ability to causeURTD
• Other species of Mycoplasma (such as M. cheloniae) also can cause URTD
• Specific antibodies against M. agassizii may not confer protective immunity
• Mycoplasma may be transmitted by some forms of indirect contact
• Mycoplasma may not persist in burrows of infected tortoises
Many of the uncertainties and unknowns at the level of individual tortoises warrantincreased attention (Brown et al. 2002; M.B. Brown, pers. comm.; E.R. Jacobsen, pers.comm.). In particular, more information is needed about: vertical transmission of tortoisepathogens (on-going studies are examining vertical transmission of both M. agassizii andTHV), tortoise immunobiology (need information on reagents and functional assays,normal versus abnormal values, and the cellular immune system), tortoise pathophysiologyand hemosiderosis, modes of transmission of tortoise pathogens other than M. agassizii,and relative importance of tortoise pathogens (need information on the virulence of speciesand strains).
Although accruing information about the effects of URTD and other diseases onindividuals is an important undertaking, sound management decisions about speciesrecovery require accruing information about the effects of diseases on populations.Unfortunately, virtually nothing still is known about the demographic consequences, eitherdirect or indirect, of URTD. It is suspected that respiratory mycoplasmal infection canaffect desert tortoise and gopher tortoise life history traits (survival, fecundity, migration)directly and, therefore, affect population dynamics directly (Brown et al. 2002; M.B.Brown, pers. comm.), but establishing such a connection, if it indeed does exist, requires amore concerted effort than has been made to date. This cause-and-effect relationship hastwo linkages: Disease Individual Population. A suitable research plan, therefore,would need to be designed first to establish that disease affects the life history traits ofindividuals, and second, to establish that the changes in life history traits of individualscumulatively affect population dynamics. Although some tortoises with respiratorymycoplasmal infection clearly have died with what appear to be abnormal deaths (Jacobsonet al. 1995, Berry 1997, Rabatsky and Blihovde 2002, Seigel et al. 2003; K.H. Berry, pers.

DTRPAC Report page 102
comm.; J.E. Diemer-Berish, pers. comm.), other tortoises with the infection have livedwhat appear to be normal lives for extended periods (e.g., at sites at which seropositiveindividuals occur, yet at which no substantial declines in population size can bedocumented; McCoy et al. in review). Unfortunately, the nature of the research to date hasbeen such that cases of the absence of population decline, in the face of respiratorymycoplasmal infection or of subsequent recovery from URTD, have not been wellreported. Neither have the fates of random samples of ill – defined broadly – and healthyindividuals from the same populations been mapped, as far as we can tell. The connectionbetween the disease and survival of individuals, therefore, remains inferential, and whetheror not disease is an important source of mortality (section II.D.3.b.2) remains largelyunknown. Declines in the fecundity of tortoises with acute respiratory mycoplasmalinfection have occurred, but the best available evidence indicates that they eventuallyrecover (Schumacher et al. 1999; D.C. Rostal, pers. comm.). The connection between thedisease and fecundity of individuals, therefore, remains problematic. No studies to datehave explored the potential connection between disease and migration of individuals.Tortoises with respiratory mycoplasmal infection may display abnormal physiologicalresponses, such as increased water loss, or behavioral responses, such as reduction inappetite, reluctance to leave burrows, and irregular basking and burrowing, however, whichcould influence movement patterns (Brown et al. 2002; M.B. Brown, pers. comm.; E.R.Jacobson, pers. comm.).
It seems clear that the dearth of information on the linkage between disease and life historytraits of individuals would reduce the linkage between changes in life history traits ofindividuals brought about by disease and resulting population dynamics largely tospeculation. The best-published attempt to relate tortoise demography to disease was byBerry (1997). She presented convincing evidence that desert tortoise population densitieshad declined substantially at two sites (but see the discussion of permanent study plots andmeasurement of population densities presented elsewhere). Some individuals at one of thesites were seropositive and/or clinically ill with URTD, and some individuals at the othersite exhibited varying degrees of shell dyskeratosis. She concluded (p. 94) that “between1988 and 1992 the declines of adults [at the site with seropositive and/or clinically illindividuals] are clearly attributable to URTD caused by M. agassizii.” She is more reservedin her conclusion about the second case (p. 95): “the population decline appears to belinked to the appearance of shell lesions on the tortoises.” The evidence that she presentsfor the cause-and-effect relationship between tortoise population decline and disease in thefirst case is: (1) prior to 1988, before the appearance of acute URTD, few individuals everwere observed with overt signs of illness or in a dying state; (2) individuals displayingclinical signs of URTD were distributed throughout the site and in adjacent areas; and (3)of 27 individuals in a health profile research program, fitted with radio transmitters, 6 diedand 11 disappeared between 1989 and 1992. We suggest that this evidence supports a moreconservative conclusion, one that is nearer the conclusion that Berry (1997) reached for theother site: the population decline appears to be linked to the appearance of URTD in thetortoises. Note that this conclusion still is immensely important and demonstrates that, atpresent, disease threats deserve consideration on par with other threats.

DTRPAC Report page 103
Risk from disease threats
It appears that URTD is a complex, multi-factorial disease, interacting in somecircumstances with other stressors to affect tortoises (Brown et al. 2002; M.B. Brown, pers.comm.). Hypothesized factors contributing to mycoplasmal transmission and URTDdisease severity include different critical thresholds of exposure among tortoisepopulations; difference in virulence among microbial species and strains; prior exposure,which probably limits the ability to control disease severity; variable clinical expression,both temporally and spatially; differences in sex ratios, age structures, and behaviorsamong tortoise populations; exacerbating factors, such as drought; and tortoise nutritionalstatus (M.B. Brown, pers. comm.).
At present, the accumulating evidence about URTD is a mass of seeming contradictions.No data indicate that URTD is moving through Mojave Desert tortoise populations in awavelike pattern typical of mycoplasmal spread (E.R. Jacobson, pers. comm.); yet, failureto identify the pattern may have resulted from inadequate serological sample sizes,inadequate spread of sampling effort throughout the range of the desert tortoise, or other,similar, problems (E.R. Jacobson, pers. comm.; see Diemer-Berish et al. 2000, McCoy andMushinsky in review). Tortoises in the genus Gopherus may have maintained a long-termcoexistence with the pathogens causing URTD (E.R. Jacobsen, pers. comm.; McCoy andMushinsky in review); yet, in some places, such as Ft. Irwin, tortoises seem to have beenisolated from at least Mycoplasma agassizii (E.R. Jacobson pers. comm.; see McCoy andMushinsky in review), and, in many ways, respiratory mycoplasmal infection in tortoisesresembles a new interaction between host and pathogen (D. Thawley, pers. comm.). Ingeneral, respiratory mycoplasmal infections have high morbidity but low mortality (Brownet al. 2002); yet, in some places, severe population declines have been hypothesized to belinked to URTD caused by M. agassizii (e.g., Berry 1997).
These seeming contradictions reinforce the emerging picture of URTD as a complex, multi-factorial disease. First, as we have seen, demonstrating the two important cause-and-effectrelationships Disease Individual Population is not easy, and the difficulty iscompounded by inadequate sample sizes and inadequate experimental design. Second, thepotential effects of URTD, either for individuals or for populations, are inextricablyintertwined with potential effects by numerous other threats, and teasing out individualeffects, when several factors co-vary, is a difficult analytic problem. Third, changingecological conditions, whether connected with human activities (e.g., habitat degeneration,McCoy et al. in review) or not (e.g., malnutrition, Jacobson 1994, Oftedahl et al. 2002);drought, Berry et al. 2002), may stress individuals and result in more severe clinicalexpression of URTD (Brown et al. 2002). Fourth, mycoplasmal infections often are densitydependent (e.g., Hochachka and Dhont 2000), and URTD is seen mostly in relatively densepopulations (M.B. Brown, pers. comm.), suggesting that some threshold density of tortoisesmay need to be reached before the infection becomes severe. Fifth, even if the mycoplasmalspecies responsible for URTD have maintained a long-term relationship with tortoises inthe genus Gopherus, the pathogens appear to evolve rapidly into novel strains (Brown et al.2002), suggesting that demographically important pathogenic relationship may occur at thesub-specific level.

DTRPAC Report page 104
The complexity of the disease threat facing the desert tortoise, coupled with the uncertaintysurrounding many of the key issues, and the fact that the tortoise is faced with many otherthreats, suggests that a conservative approach toward disease as a threat be adopted at thistime. Although the evidence suggests that disease, especially URTD, could be an importantforce shaping the demography of desert tortoise populations, the evidence neitherdemonstrates that disease is a potent force, nor that it is the most important force, nor that itacts independently of others forces. A more balanced, adaptive, and focused approach todealing with URTD is appropriate at this time, perhaps one modeled on therecommendations of McCoy and Mushinsky (in review) for dealing with the disease in thegopher tortoise. Such a balanced approach would take into account the risks, and associatedcosts, involved not only of transmitting Mycoplasma agassizii among tortoise populations,but also of transmitting it within populations or to other species. It would deal with themanagement practice of translocation and of dooming demographically valuableindividuals to euthanasia simply because they are suspected of harboring the pathogen. Itwould deal with underestimating the importance of other pathogens (such as herpesvirus,THV) and of diverting attention and resources away from managing, acquiring, andrestoring habitat. For example, if Mycoplasma agassizii has a long-term relationship withits tortoise host, then addressing the risks involving habitat loss, fragmentation, anddegeneration is crucial for permitting recovery from URTD. Die-offs are likely to haveoccurred historically, and populations have obviously recovered. Under current conditions,large populations in good habitat likely could recover again, but small populations orpopulations in poorly managed habitat may be in serious danger of extinction. A moreadaptive approach would take into account the evolution of knowledge about M. agassiziiand URTD. Advances in knowledge may necessitate reevaluation of the risks facing thetortoise. For example, if strains of M. agassizii are variable in virulence, as evidence nowsuggests (Brown et al. 2002), then careful isolation of high-virulence strains on the onehand, and relaxation of the moratorium on translocation of the low-virulence strains on theother hand, may be warranted and wise. A more focused approach would take into accountthe ultimate goals of any actions taken against URTD. Different goals may dictate differentweightings of the risks facing the gopher tortoise. For example, if the ultimate goal is forpopulations to be self-sustaining in the face of environmental pressures, including disease,then actions requiring persistent veterinary intervention may counter indicated anddangerous.
The complexity of the disease threat facing the desert tortoise, coupled with the uncertaintysurrounding many of the key issues and the fact that the tortoise is faced with many otherthreats, suggests that the disease threat will not be understood without bringing to bear allof the tools of modern epidemiology, particularly ecological epidemiology. Classicalepidemiology primarily is concerned with the statistical relationship between diseaseagents, both infectious and non-infectious, while ecological epidemiology is concernedwith the ecological interactions between populations of hosts and parasites (Swinton 1999).Epidemiologists are aware of the importance of the sociodemographic (classicalepidemiology) or the ecological (ecological epidemiology) setting influencing the coursethat a disease takes in a population, and they are equipped with the statistical tools

DTRPAC Report page 105
necessary to deal with diseases resulting from a variety of confounded and interdependentfactors and to establish causal chains.
Disease Case-Study Recommendations
An immediate need exists to develop scientifically-based recommendations formanagement of healthy and ill -- defined broadly – wild tortoises so as to minimize the riskto both individuals and populations of uninfected tortoises (Brown et al. 2002), and byextension, risks both to individuals and populations of infected tortoises. The focus here ison the two recovery actions recommended in the Recovery Plan most relevant to diseasethreats in light of this need (see below). These two recommendations still are sound, butsuffer from almost complete lack of implementation in the past decade. Here we also listadditional recovery actions, which should be seen as simple extensions of the originalactions based on new knowledge available today.
a. Initiate epidemiological studies of URTD and other diseases (section II.D.3.b.1)
• Refocus the general approach to research on disease, treating it as part of a networkof threats to tortoise populations, which, because of negative and positive feedbackloops to other threats, cannot be addressed effectively without reference to thethreats network (see section 5.1.1).
• Develop multi-disciplinary, long-term research agendas to understand the networkof threats (a possible model, developed for studying URTD in the gopher tortoise, isin Section 7.3).
• Develop tools to study disease which are not so expensive that they preclude neededresources to research the interactive effects of disease with other threats.
• Develop more knowledge about the ecogeography of genetics of disease and hostsas a way to develop recommendations for translocation programs cognizant of thepotential harm that can come from lack of information about mismatches betweenvirulence of genetic strains of pathogens with different strains of host.
• Include epidemiologists and population biologists in developing the research agendas.
b. Research sources of mortality, and their representation of the total mortality, includinghuman, natural predation, diminishment of required resources, etc. (section II.D.3.b.2)
• Add health assessments to the information gathered in ecological studies andmonitoring, perhaps using an existing protocol (Berry and Christopher 2001).
• Develop clear standards for determining whether individuals in a population arehealthy or not and whether they have been stressed or not.
• Continue current serological surveys for M. agassizii, adding screening for THV.Develop surveys for other Mycoplasma species as assays become available.

DTRPAC Report page 106
• Continue necropsies (the sample currently includes 74 individuals according to E.R.Jacobson). Develop a rationale for these necropsies in relation to the potential forinformation from them to affect new knowledge and management.
• Continue developing, improving, and extending diagnostic tests. This includesdeveloping less expensive and more field-portable testing.
• Continue developing stress tests that are applicable to wild tortoises (e.g.,adrenocorticotropin hormone (ACTH), phytohemagglutinen (PHA), and sheep redblood cell (SRBC) challenge experiments, to examine adrenal gland response, T-cell response, and B-cell response, respectively; P. Kahn, pers. comm.).
• Inform researchers about both the qualities and the shortcomings of diagnostic tests(see Brown et al. 2002); for example, clinical signs of URTD may be non-specificor specific host responses to agents other than mycoplasmas; seropositive (ELISA)individuals may display no overt clinical signs of URTD; and that ELISA aloneoften is not sufficient, largely because they indicate only past exposure and notnecessarily current infection.
• Inform researchers about the value of different diagnostic tests in addressingdifferent goals (see Brown et al. 2002); for example, different tests are appropriatefor health assessment of an individual tortoise, for a population survey, for longterm population monitoring, and for investigation of a mortality event.
• Ensure that all important information is made accessible to researchers.
• Ensure that the expedient course of killing seropositive, but otherwise healthy,individuals is kept to a minimum.
A caveat to these recommendations is in order. Many modern epidemiologists do not thinkthat epidemiology itself should be concerned with the delivery of services or withimplementation of policy (e.g., Savitz et al. 1999). Regardless of whether or not one agreeswith this viewpoint – which reflects a similar viewpoint common in conservation biology – itpoints to a separation between the scientifically-based accumulation of knowledge and theultimate use of knowledge. The recommendations made here are for improving the sciencesurrounding disease as a threat for the desert tortoise and may not necessarily provide an easytransition to management strategies. Designing management strategies for a complex diseasethreat, particularly one in which the factors contributing to the complexity may themselves bethreats – which is an unusual situation – is a daunting task; however, the response to thisdaunting task must not be to ignore the complexity in the name of expediency.

DTRPAC Report page 107
“SScciieennccee iiss aa wwaayy ooff tthhiinnkkiinngg mmuucchh mmoorree tthhaann aa bbooddyy ooff kknnoowwlleeddggee.. IIttssggooaall iiss ttoo ffiinndd oouutt hhooww tthhee wwoorrlldd wwoorrkkss......”
Carl Sagan, Broca’s Brain: Reflections on the Romance of Science. (1979)

DTRPAC Report page 108
5. Linking Impacts, Habitat, and Demography to Recovery
The committee found that desert tortoises face a vast array of threats and that these threatsinteract with one another in highly complex ways that vary from place to place within thehistoric range of the desert tortoise. In fact, examples of species facing a single major threatare unusual among listed species. The complex nature of many threats is likely to makethem difficult to both document and address in recovery plans. In addition to understandingcomplex ecological systems, mitigating threats often requires understanding and addressinginterrelated social and economic factors, thus creating additional challenges in assigningtasks for species’ recovery (Lawler et al. 2002). The DTRPAC does not identify any simpleand universal prescription for restoring and protecting desert tortoises across their range.Rather, the committee presents a threats matrix – a topology of the complexity of threatsfacing desert tortoises currently. The committee recognizes the importance of the on-the-ground knowledge that land managers will bring to developing management responses tothreats. The committee urges management actions that recognize and account for theknowledge that land managers will bring to the table and that also account for the truecomplexity of formulating management actions for populations that face multiple,simultaneous, interacting threats.
Desert tortoise recovery is fundamentally a demographic process. That is to say thatrecovery activities center on tortoise populations, particularly population size and whetheror not they are increasing, decreasing, or stable. The fundamental recovery goal is fortortoise populations to have sufficient size and stability to ensure their continued existence.Tortoise populations increase, decrease, or remain stable largely because of the net effectsof several important demographic factors: birth rate (natality), survivorship (recruitmentinto the breeding population), fecundity, and death rate (mortality). A population growthindex called “lambda” summarizes the cumulative effects of these demographic factors.
Lambda describes if and how quickly populations are changing. A population that isincreasing has a lambda greater than 1. For example, a lambda of 2 would indicate that thepopulation is doubling in size each generation (32 years for desert tortoises; Turner et al.1987). A population that is declining has a lambda that is less than 1. For example, alambda of 0.5 means that the population is diminishing by half each generation. A stablepopulation has a lambda of 1, i.e., the population is replenishing itself each generation.
Most recovery actions for threatened and endangered species are designed to stabilizepopulation size (lambda at 1.0 based on dynamics across several generations) wherepopulation size is sufficient to safeguard against extinction. If population size is smallenough to threaten extinction, the recovery goal is to increase population size (lamba > 1.0)until the population is sufficiently large to ensure persistence. Then the population can bemanaged for a long-term lambda of 1. Population increase can be achieved through actionsthat increase natality, increase recruitment, increase fecundity, decrease mortality, or somecombination of these. Because the management actions taken depend in part upon thefactors responsible for population declines, it is important to know what forces are causingpopulation declines or are preventing small populations from rebounding to stablepopulation sizes. Forces influencing population dynamics were addressed in Appendix D of

DTRPAC Report page 109
The Recovery Plan (USFWS 1994), by listing each identifiable force and presentingevidence that it is indeed a threat to population well being.
5.1 Cumulative, Interactive, and Synergistic Impacts of Multiple Threats
One of the most insidious problems preventing desert tortoise recovery is that tortoisepopulations face multiple threats. To grasp the complexity of threats facing desert tortoises, itis helpful to consider two important ways that these threats act:
Individual populations face a suite of threats simultaneously.This means that ameliorating a prominent threat does not mean that the population hasbecome secure. Another threat may replace, or “compensate” for, the threat that has beenremoved. Adding further complexity, each population may face its own suite of threats.
Threats can interact with one another.The action of one threat can influence the degree to which another threat is expressed.Because threats are simultaneous, the degree to which a particular threat is expressed is partlya function of other active threats. The interaction of threats need not be simply additive. Theycan be synergistic. In other words, the combined application of two or more threats maycause an overall effect that is greater than the sum of each threat individually.
Our task was to determine if new information would change the original Recovery Team’s(USFWS 1994) evaluation of threats to desert tortoise populations. For this analysis, wemade use of a recent objective analysis of evidence pertaining to threats to desert tortoisepopulations (Boarman 2002) plus testimony of expert witnesses and knowledge of committeemembers. The Recovery Plan identified a large number of important threats to tortoisepopulations. Although some new information has been generated since then, we see littleneed to change the Recovery Team’s treatment of most individual threats. However, theoriginal Plan did not fully appreciate the complexity of interactions of individual threats witheach other and the insidious nature of the synergism that can occur among threats. Inparticular, the original Recovery Plan did not emphasize the degree to which one mortalityfactor can deleteriously compensate for another mortality factor when the first one has beenmitigated through management actions. For example, the original Plan did not illustrateclearly that adult tortoises may die from an alternative mortality factor, such as vandalism,after being protected from another important mortality factor, such as being crushed by cars,in an environment of multiple anthropogenic threats.
Some new information exists on the extent of threat posed by some specific activities. Forexample, feral and unleashed domestic dogs are now thought by many to pose an importantthreat to tortoises in some parts of the Mojave (Bjurlin and Bissonette 2001), but this issuewas barely recognized in1994. Recent studies have shown that native vegetation biomassand other elements of the Mojave Desert ecosystem were higher in areas protected fromgrazing and OHV activities, while non-native grass biomass was greater outside theprotected area (Brooks 1995, 1999). Another study found greater plant cover and deserttortoise abundance in an unused plot compared to an OHV-used plot (Bury and

DTRPAC Report page 110
Luckenbach 2002). Lovich and Bainbridge (1999) reviewed effects of OHVs on desertecosystems, as well as other anthropogenic effects. Translocation was portrayed as a likelythreat to populations in 1994, but recent research has shown how it may be an importantelement in recovery programs (Field 1999, Nussear et al. 2000, Nussear 2004). Moredetails are now available on disease (see Section 4.5.2 and many studies listed in Boarman2002), raven predation (Boarman 2003), fires (e.g., Brooks and Esque 2002), invasiveweeds (e.g., D’Antonio and Vitousek. 1992, Brooks 2000, Brooks and Esque 2002),military activities (e.g., Krzysik 1998, Berry et al. 2000), and livestock grazing (e.g., Avery1997, 1998). A little more has been learned since 1994 about a number of other threats totortoise populations including illegal collecting (Berry et al. 1996), kit fox predation(Bjurlin and Bissonette 2001), handling (Averill-Murray 2002b), release of captives (Fieldet al. 2000, Johnson et al. 2002), roads (Fig. 4.32, von Seckendorff Hoff and Marlow2002), and noise (Bowles et al. 1999). Most importantly, however, virtually nothing isknown about the demographic impacts of any of the threats on tortoise populations or therelative contributions each threat makes to tortoise mortality. This dearth of knowledge isnot surprising given the difficulty of estimating desert tortoise population sizes (seeChapter 4). We caution that the individual threat approach taken by the Recovery Plan(USFWS 1994) may have resulted in managers placing too much emphasis on political andpractical trade offs involved in controlling individual threats; we believe tortoise recoverydepends on emphasis being placed on managing multiple threats because of the interactive,synergistic, and cumulative effects of multiple threats.
We recommend a significant modification to the Recovery Plan’s perspective on threats bystrongly emphasizing the importance of cumulative, interactive, and synergistic threats todesert tortoise populations throughout the Mojave. We emphasize that multiple threatsappear to act simultaneously to suppress tortoise populations at any given place in thedesert. Simultaneous multiple threats represent an insidious threat to desert tortoisepopulations by diminishing the benefits of carrying out important management actionsdesigned to relieve stress on tortoise populations. For example, overgrazing may suppresstortoise populations by reducing the availability of important forage plants (Avery andNeibergs 1997). However, tortoises that are “saved” by grazing reductions may be lostanyway due to shooting by public land users or crushing by vehicles driven on desert roads.Hence, even though grazing reduction was appropriate and necessary, it was not sufficientbecause saved tortoises were now available to be lost through the compensatory threat(called “compensatory mortality”).
Multiple threats can also act synergistically. By synergism we mean that the deleteriouseffects of a given threat are substantially magnified when another threat is simultaneouslyacting. In other words, the cumulative threat effect is greater than the sum of the individualthreats. One example of synergy between threats is raven predation and road mortality.While some tortoises are killed by ravens and others are crushed by vehicles on roads, thepresence of tortoise (and other) carcasses on roads enhances the survival and reproductionof ravens which are then available to prey upon tortoises (Boarman 2003). Anotherpossible important synergism is the suspected link between disease and nutrition or diseaseand drought (Brown et al 2002, M. B. Brown pers. comm., Duda et al. 1999). In thisscenario, well-nourished tortoises may not necessarily die from URTD, but succumb whenunder nutritional stress. Nutritional stress, in turn, may occur in areas such as OHV open

DTRPAC Report page 111
areas where forage availability has been significantly reduced. Multiple threats and theirsynergistic interactions may make it extremely difficult to identify and implementmanagement actions that will most efficiently lead to recovery.
Whereas the most obvious threats directly result in tortoise mortality (e.g., road mortalityand poaching), the cumulative, interactive, and synergistic impacts of multiple threats isoften manifested through indirect impacts that reduce survivorship and fecundity. Habitatdegradation and the resulting reduced nutrition are two of those indirect impacts. Habitatdegradation takes many forms, and often the occurrence of one form of degradation iscorrelated with the occurrence of other forms. Three kinds of habitat degradation arecentrally important to tortoise conservation and tortoise population decline: habitatfragmentation, habitat loss, and habitat degeneration. Fragmentation refers to the parsing ofhabitat into separate segments. This is a spatial phenomenon, but does not refer to habitatloss per se. For example, a fence or road that forms a barrier to tortoise movement divides atortoise population into two units without significant habitat loss. Habitat fragmentation isan issue of scale and has been shown to cause population declines in other reptiles (Fisheret al. 2002).
Habitat loss refers to the destruction or conversion of previously suitable habitat into aform that is no longer suitable to tortoises. For example, urbanization leads to habitat lossfor desert tortoises. Animals with large home ranges, such as the desert tortoise, typicallyare sensitive to habitat fragmentation and habitat loss. Both lead to population decline.Among the deleterious effects of habitat fragmentation are reduced movement and geneflow among breeding populations. Fragmenting a population increases the likelihood oflocal population extinction from a range of demographic and catastrophic events (Opdam1988, Hanski and Gilpin 1991). Habitat loss does not necessarily fragment a population,but habitat loss invariably leads to population decline due to net loss of space and resourcesavailable to tortoises.
Lastly, habitat can degenerate, meaning its value for desert tortoise survival andreproduction is reduced, even if the habitat is not fragmented or destroyed. Reduced habitatquality can be a particularly insidious problem for wildlife managers because it can bedifficult to recognize that seemingly suitable habitat is actually deficient in some importantway. Habitat fragmentation, loss, and degeneration are all occurring throughout the MojaveDesert, but particularly in the western Mojave. Unfortunately, habitat protection has notbeen effectively implemented in many areas within the tortoise’s historic range (e.g., seeSection 4.1).
Nutrition is important to desert tortoise population biology because of the role it plays ingrowth, health, and fecundity. The availability of adequate nutrition to tortoises in theMojave ecosystem is naturally variable in response to annual variation in precipitation,temperature, soil moisture, and plant community responses. Some years are forage rich andothers forage poor, which in turn causes for annual differences in fecundity andsurvivorship. This is an example of a natural interaction between abiotic factors (weather)and biotic factors (native plant community) influencing tortoise populations through theindirect pathway of nutrition (see Fig. 5.1, Turner et al. 1984, Peterson 1994, Peterson1996a, Peterson 1996b). However, anthropogenic factors introduce a suite of factors that

DTRPAC Report page 112
ultimately bear on tortoise nutrition through more complex synergistic effects. Forexample, the replacement of native forbs and grasses by introduced weeds may change theplant community response to precipitation and the nutritional value of the forage produced.Additionally, exotic plants change fire cycles, fugitive dust, the biological availability ofwater, and perhaps, tortoise movement. The demographic consequences of tortoisenutritional ecology may prove to be difficult to monitor directly, however the threatsnetwork described below may suggest proxy factors that can reasonably be monitored andmanaged.
Focusing on individual threats has resulted in little positive change for desert tortoisepopulations. The individual threats approach has not contributed to a general recovery ofthe desert tortoise for several reasons. For example, the individual threats approachgenerally does not account for compensatory mortality in which one mortality factor takestortoises that were “saved” from another mortality factor. A particularly troublesomeconsequence of using the individual threats approach is a problem we term “elevating theexpedient to the important.” A simple listing of individual threats may prompt managers toattend first to those threats they view as most tractable, in light of available resources andpolitical exigencies, but managing those threats may not necessarily produce the bestresults. For example, raven depredation of tortoises appears to be an important problem andraven control is a straightforward management action that can be quickly and easilyimplemented. However, raven control may not be the highest priority management actionfor every tortoise population. Finally, focusing on individual threats suffers from Leibig’sLaw of the Minimum (Berryman 1993). By focusing on and removing only the one or twothreats considered the most important, no response may be realized because the next mostimportant threat becomes the limiting factor for population recovery (Leibig’s Law). Thus,we believe the most effective management will be based on recognizing the importance ofaddressing the multiplicity of threats impacting specific populations.
5.1.1 Threats Network
We illustrate the truly complex relationships among the array of threats to tortoisepopulations with a three-tiered conceptual model (Fig. 5.1). The model characterizes biotic,abiotic, and anthropogenic factors in a network of threats to tortoise populations. Overall,the network illustrates the interaction of biotic, abiotic, and human land-use factors incausing tortoise population decline. Major land-use categories appear in the top tier of thenetwork. The second tier represents activities or threats that are indirectly linked to tortoisemortality and fecundity. The third tier represents mortality factors that lead directly totortoise population decline. The model focuses on anthropogenic features that lead totortoise population decline because these factors are central to developing effectiverecovery strategies. We do not illustrate tortoise population increases in the network, butwe recognize that ameliorating the deleterious effects represented in the model may openthe way for desert tortoise population increases through increased longevity and fecundity.It is important to note that this network model represents a hypothesis that needs regularreevaluation and modification.

DTRPAC Report page 113
Fig. 5.1 Network of threats demonstrating the interconnectedness between multiple humanactivities that interact to prevent recovery of tortoise populations. Tier 1 includes the major land usepatterns that facilitate various activities (Tier 2) that impact tortoise populations through a suite ofmortality factors (Tier 3).
The threats network demonstrates that many human activities can have negative effects ontortoise populations through many pathways. Taking management actions that break onepathway, even though the pathway is real, may not be adequate to prevent the mortalityfactor from continuing to diminish a tortoise population. This is because alternativepathways exist to “compensate” by removing animals that were otherwise “saved” by amanagement action as with “compensatory mortality,” discussed above. Compensatorymortality is not the only way that multiple pathways make developing recovery actions

DTRPAC Report page 114
difficult. Tortoise populations can also experience “indispensable mortality,” resulting fromtortoise life history traits that are not under human control. In tortoises, reducing theinfluence of a mortality factor on younger age classes, for example, may not result in acommensurate increase in overall population size because high mortality among older,highly fecund individuals is the true constraint on the population. For example,“headstarting” of hatchling sea turtles is not particularly effective in reducing populationdecline, relative to protection of reproductive females (Frazer 1993), because of the veryhigh mortality rates of intermediate-age individuals. Indispensable mortality accounts forwhy reducing raven predation alone likely will not result in significant increases in tortoisepopulation size.
Anthropogenic food provides a good example of how network analysis gives insight intothe importance of recognizing alternative pathways before planning recovery actions.Figure 5.2 is a portion of the complete network (Fig. 5.1) and shows direct and indirectways that human activities generate anthropogenic foods for predators that eat deserttortoises. Ranching, agriculture, and urbanization are probably the biggest direct land usesthat provide food to ravens, coyotes, and feral dogs. Other land uses generate foods lessdirectly through associated activities illustrated in Tier 2 of the network. Activities thatgenerate food subsidies to tortoise predators include motorized and non-motorizedrecreational activities, railroads, and landfills. Taking a single threat approach, eliminatingrailroads as a source of food, may indeed reduce the amount of food available to ravens,but there are still many other compensatory sources of food the ravens could switch to: andno measurable reduction in juvenile mortality may be realized. As a further illustration, thepresence of people facilitates raven presence and their likely predation on tortoises in otherways, such as water, nesting structures, roosting sites, and nesting materials. So, even if allanthropogenic sources of food were eliminated, human activities may still facilitatepredation on tortoises by ravens. A multiple threats approach to tortoise recovery wouldevaluate the relative contributions each source makes to the availability of food. With theassistance of statistical analyses such as Path Analysis (Petraitis et al. 1996, Smith et al.1997, Wootton 1994) or Structural Equation Modeling (Maruyama 1997), sources can thenbe prioritized and the most important ones eliminated to maximize the positive benefit totortoise populations.

DTRPAC Report page 115
Fig. 5.2 A section from the Threats Network from Fig. 5.1 that shows how multiple land uses andhuman activities provide food subsidies to predators on tortoises, thereby increasing mortality.
The network also illustrates a vortex of feedback loops in which mortality mechanismsfrom both natural and human impacts can reinforce one another. In particular, some factorsaffect age distribution through increased mortality of older individuals, which in turnaffects population recruitment through the reduced fecundity of young individuals, whichthen makes the population more susceptible to threats that affect younger, smallerindividuals. In other words, not only do impacts from threats cause a population decline,but a population may also lose much of its ability to rebound from the population decline.Lastly, an inability to rebound can be exacerbated when impacts differentially affectbreeding female or juvenile segments of a population. Several demographic models

DTRPAC Report page 116
indicate that tortoises require very high juvenile survivorship and recruitment into thebreeding population to recover diminished tortoise populations (Congdon et al. 1993, Doaket al. 1994, USFWS 1994). The vortex of deleterious feedbacks among multiple threatsrepresents a grave threat to tortoise recovery.
There are several important caveats relative to using the threats network to formulaterecovery strategies. First, the effects of some of the threats may have time lags that makethe effects hard to discern early. Second, tortoise populations and habitats may respond tothreats emanating from areas outside of DWMAs or other areas designated for managementaction. Third, cumulative or indirect effects caused by modification of ecosystems, mayoccur. Fourth, threats may have different effects in different areas. Fifth, the magnitude ofvarious threats may depend upon the initial condition of the landscape and its changesthrough time. Sixth, the degree of threat by any one factor almost certainly changes indifferent combinations of interacting threats. Finally, the value of a management strategydepends on the particular problem being addressed. In other words, the threats matrixprovides a general topology of the complex issue of threats. However, management actionsto recover or protect individual tortoise populations likely will have to be custom designedfor those populations and be based on the suite of threats and their interactive effects facingthat population. We do not identify any simple and universal prescription for restoring andprotecting desert tortoises across their range.
To illustrate how the threats network can be interpreted, we provide three simplifiedexamples. First, following a relatively simple thread, we see that four major elements areassociated with utility corridors (Fig. 5.3): construction, physical structures (e.g., powertowers, pump houses, etc.), people (e.g., involved in maintenance operations), and unpavedroads. Each one of those elements affects tortoises through various mechanisms. Forexample, physical structures cause loss of habitat and facilitate mortality from predation byproviding nesting habitat for ravens (Boarman and Heinrich 1999). This example shows arelatively straightforward connection between utility corridors and tortoise populationdeclines.

DTRPAC Report page 117
Fig. 5.3 A section from the threats network from Fig. 5.1 showing just the primary activitiesassociated with utility corridors. The causes of tortoise mortality associated with physical structuresare also shown.
Unpaved roads represent another contributor to threats associated with utility corridorsfurther illustrating a much more complex web of connections. On the face of it unpavedroads have relatively few direct impacts on tortoise population. The crushing of tortoises,habitat loss, and air pollution (not illustrated) associated with unpaved roads do not appearto be the major causes of tortoise decline (Fig. 5.4). However, there are a host of importantindirect impacts of unpaved roads that may be very important factors in tortoise decline,some of which are illustrated in Fig. 5.5). For example, unpaved roads, specifically thevehicles and the people they transport, cause fires (USFWS 1994, Brooks pers. comm.),which in turn kill tortoises and alter native and non-native vegetation (Brooks and Esque2002). Roads facilitate the spread of non-native plants (Brooks and Esque 2002, Gelbardand Belnap 2003), which may in turn suppress growth of some native species (Brooks2000). Unpaved roads also generate fugitive dust (Gillette and Adams 1983), whichreduces productivity of plants (Sharifi et al. 1997) and may release contaminants (Formanet al. 2003). Roads facilitate non-motorized and motorized (OHV/ORVs) recreation, whichcan directly, and indirectly, impact tortoise demography (not illustrated in Fig. 5.5)(Boarman 2002). Finally, unpaved roads provide access to people, which can facilitate a

DTRPAC Report page 118
large number of activities that may harm tortoises (e.g., vandalism, removals, release ofdiseased captives, habitat destruction, dumping of garbage and toxic chemicals, crushingburrows and animals, release of pet dogs that may become feral, etc.) (Boarman 2002).Hence, when viewed within the threats matrix, unpaved roads within desert tortoise habitatmay be a key factor associated with tortoise decline.
Fig. 5.4 A subsection of the Threats Network shown in Fig. 5.1 that illustrates the mortality factorsdirectly associated with unpaved roads used for maintenance of utilities.

DTRPAC Report page 119
Fig. 5.5 A much more complex web showing the interconnectedness among many activitiesassociated with utilities and their impacts on tortoise populations.
Threats Recommendations
The threats network represents a working hypothesis of how various factors impact tortoisepopulations, singly or interactively (as cumulative, synergistic, or interactive effects),whether biotic, abiotic, or anthropogenic. We encourage managers to think aboutmanagement in terms of suites of threats. Our model first posits that many threats affectingdesert tortoises include multiple factors or various aspects of individual factors. Forexample, “livestock grazing” includes both horses and burros. Second, not all possibleimpacts, or mechanisms of mortality, are depicted in the model (e.g., minor sources of

DTRPAC Report page 120
mortality such as ant predation of eggs are not included). Third, all possible linkagesimportant to describing interacting threats may not be included in this model. Theconnections we chose to include are only those with a more apparent probability ofoccurring (i.e., with strong empirical or theoretical support) and that likely do not occuronly rarely (e.g., meteor falling on a burrow or a tortoise finding, swallowing, and beinginjured by a balloon). Finally, each linkage is illustrated as equi-probable and equallyimportant; focused research and modeling should reveal relative strengths of the variouslinkages.
An appropriate application for the model is to identify nodes that have many linkages(incoming and outgoing). Factors represented by these nodes may be key factors that meritfocused and priority management action. The next step is to take an hypothesis-drivenapproach to determine what management actions will have the greatest effects on tortoisepopulations. If a future recovery team is formed, we see them using this model to makeinitial recommendations about priorities for management action.
We offer the following recommendations for changes to the Recovery Plan:
• Place a greater emphasis on the interactive, synergistic, and cumulative effects ofthe multiple threats that occur at any given space and time.
• Research and management should, through a hypothesis-based approach, focus firston those sets of actions and threats that contribute to a greater number of mortalitymechanisms (i.e., involve more linkages in Fig. 5.1) or that affect size structure orfecundity.
• The relative strengths of hypothesized connections between threats and mortalityshould also be assessed (some individual linkages may be more important thanmultiple linkages from other individual threats). This assessment should be basedon data from research designed specifically to elucidate relationships betweenthreats and mortality.
• Data from the previous two recommendations should be combined into aclassification system that characterizes threat by spatial extent, frequency,predictability, and intensity.
• Develop and use innovative methods, including GIS and other types of visualizationtechnologies, to visualize and display the temporal and spatial complexities ofindividual and interactive threats.

DTRPAC Report page 121
“TThhee aaiimmss ooff sscciieennttiiff iicc tthhoouugghhtt aarree ttoo sseeee tthhee ggeenneerraall iinn tthhee ppaarrttiiccuullaarraanndd tthhee eetteerrnnaall iinn tthhee ttrraannssiittoorryy..”
Alfred North Whitehead, in A Dictionary of Scientific Quotations by Alan L. Mackay . (1991)

DTRPAC Report page 122
6. Monitoring, Evaluating, and Delisting
The 1994 Recovery Plan (p. 3) identified the most serious problem facing the remainingdesert tortoise populations in the Mojave region as
the cumulative load of human and disease-related mortality accompanied byhabitat destruction, degradation, and fragmentation.
As a result, the Recovery Plan recommends a list of recovery actions for each DWMA, andmany individual actions have been implemented (GAO 2002; but see Section 4.1). Many ofthese actions appear to have been selected due largely to their ease of implementation,rather than their effectiveness in improving tortoise status. Furthermore, an uncoordinatedapproach with a suite of management treatments and hit-or-miss assessment ofeffectiveness is rarely effective for species recovery. Specific diagnosis is needed to revealthe magnitude of how different factors (or combinations of factors) are affecting a species’decline, and that diagnosis should guide priorities for the treatments (Caughley and Gunn1996).
Recovery of threatened and endangered species must often be initiated with incompletebiological knowledge and in the face of multifaceted and intractable ecological, political,economic, and social challenges. Thus, it is difficult to predict with confidence the outcomeof proposed management actions. Monitoring the subsequent response of the species tomanagement is therefore essential (Campbell et al. 2002). The Recovery Plan specificallyrecommended the establishment of “experimental management zones” within DWMAs, inwhich certain otherwise prohibited activities would be allowed to occur in an experimentalcontext. These zones would allow scientists and managers to determine the effectiveness ofdifferent management actions. Unfortunately, experimental management zones have notbeen created, and a primary criticism of desert tortoise recovery efforts to date has been thelack of necessary analyses assessing the effectiveness of specific recovery actions (GAO2002).
The importance of data-based decision making is already recognized by the USFWS(Crouse et al. 2002). For example, the USFWS and NMFS habitat conservation planning(HCP) handbook identifies the need for syntheses of relevant biological data and specificmethods for determining anticipated levels of incidental take when describing the impactsof the project covered by a given HCP (USFWS and NMFS 1996). Additionally, USFWSspecifically recommends adaptive management (see Section 7.2) to adjust to uncertaintydue to gaps in scientific information regarding the biological requirements of the species. Itis important to allow for changes in mitigation strategies (or other recovery actions) thatmay be necessary to reach the long-term goals or biological objectives of conservation orother land management plans. Monitoring is essential in an adaptive management program,and it should be designed to ensure proper data collection and scientific analyses. Theresults of scientific monitoring analyses represent the basis for adjusting managementstrategies and can lead to more efficient recovery of a species, both in terms of time andmoney, because recovery actions that are closely monitored can be modified to ensure the

DTRPAC Report page 123
desired results (Campbell et al. 2002). The need for hypothesis-driven experiments toassess the efficacy of management actions should not be under-emphasized in a revisedrecovery plan. Other than by coincidence, the effectiveness of recovery efforts depends onthe accuracy with which the reasons for decline have been determined (see Section 5), andfurthermore, we cannot know for sure without an experimental design that an action andany success were causally related (Caughley and Gunn 1996).
6.1 Strategies of Desert Tortoise Monitoring
6.1.1 Historical Background for Desert Tortoise Monitoring
The keystone-delisting criterion in the Recovery Plan for Mojave Desert tortoises is: “Asdetermined by a scientifically credible monitoring plan, the population within a recoveryunit must exhibit a statistically significant upward trend or remain stationary for at least 25years (one desert tortoise generation)” (Fig. 6.1). This criterion was promoted by theoriginal Desert Tortoise Recovery Team instead of a more common criterion specifying atarget population size required for delisting (at the time when the desert tortoise was listedby USFWS, there was a downward trend in population size). The other four delistingcriteria for desert tortoise relate to conservation actions required after an upward trend hasbeen achieved.
Fig. 6.1 Idealized populationtrends before recovery planningimplemented, as a result ofimplementing recoveryplanning, and after delisting.
Historically, monitoring has centered on the tortoises themselves and not on monitoringtheir environments or threats. For example, the Desert Tortoise Recovery Plan, AppendixA, (USFWS 1994) outlined the need to determine regional densities of desert tortoises todetermine if population sizes remain stable, increasing, or declining. Originally, deserttortoise populations were monitored using strip transects (Berry 1979) or plots (Berry1984). Both of these approaches have provided data on local desert tortoise densities withvarying degrees of accuracy and precision, yet neither of these approaches were designedto provide regional density estimates.
Modern monitoring requires going beyond simple tracking of population densities andexpanding to document changes in three elements of importance to recovery:

DTRPAC Report page 124
1. size of populationsa. population size includes measures of population densityb. aerial extent of population
2. habitat of the species3. threats to populations
6.1.2 Scope and Purpose of Modern Monitoring
The purposes for monitoring are manifold. For example, monitoring is necessary to assessthe efficacy of management actions and can alert managers to catastrophic changes inpopulation size, habitat loss, proliferation of threats, etc. Success must be assessed bycomparing it to goals set in advance. Goals and management actions may evolve withadditional knowledge, thus effective monitoring is carried out within an “adaptivemanagement” framework (see Section 7.2).
All monitoring should be hypothesis driven or designed to meet management objectives.There should be clearly defined questions and purposes, such as detection of trend orchanges in abundance of desert tortoise over time. Note that monitoring for populationtrend detection should be based on the hypothesis that the population is changing at somerate, whether that is specified as 0% change (i.e., stable population) or some positive ornegative rate, and therefore estimation methods must be sensitive enough to detect thedesired trend with reasonable probability (power). Monitoring should never be conducted“to do monitoring” just for the sake of monitoring.
Monitoring data and analyses will be the basis for delisting. Although populationpersistence is the ultimate goal of recovery, the current monitoring program is onedimensional, in that monitoring is only done for densities of tortoises and thus will neverinform management to its full potential. We recommend that monitoring should be amultidimensional program, including monitoring of tortoises, but also monitoring theextent and condition of habitat and monitoring impacts to tortoises, as well. Each of thesedimensions, in turn, involves multiple scales: individual, population, and species for thetortoise dimension; micro-scale, macro-scale, and landscape scale for the habitatdimension; low, moderate, and high for the impact dimension (Fig. 6.2). The goals of aneffective desert tortoise monitoring program minimally should include:
1. Monitoring to assess recovery status of the desert tortoise2. Monitoring in an adaptive management framework3. Monitoring that is multi-dimensional4. Monitoring that is multi-scaled.

DTRPAC Report page 125
Fig. 6.2 Dimensions of elements important to recovery, and therefore, needing monitoring.
The types of questions that could be asked of a multi-dimensional, multi-scaled, recovery-focused, and adaptive management-integrated monitoring program include, for example:
1. Are there enough tortoises in the DPS for the population to be self-sustaining?
2. Is the criterion of a 50% probability of persistence for 500 years the best criterionto define recovery?
3. Is the condition of the habitat within a recovery unit improving or getting worse?
4. Is the effective area of tortoise habitat contained within the DPS region beingreduced?
5. Are threats to tortoises increasing or decreasing in the DPS region?
The ability to successfully manage tortoises, habitat, or impacts, and the importance ofmanaging tortoises within an adaptive framework, increases as one moves across each axis

DTRPAC Report page 126
of Fig. 6.2. As one moves from the light to dark shades, it becomes increasingly moredifficult to manage along particular dimensions, and it becomes more important to managewithin an adaptive framework. Monitoring should be targeted more towards the darkerareas of the graph, as that information tends to be the most important for assessing recoverystatus. On the other hand, research should not neglect other areas of the box. Whereverpossible, research should focus on topics that inform management needs or directly supportmonitoring to assess the recovery status of the desert tortoise.
6.1.2 Categories of Monitoring
Four categories of monitoring have been recognized in study of relationships of wildlifepopulations, habitat, and threats (e.g., Independent Scientific Advisory Board 2003, NMFS2002).
Implementation Monitoring is monitoring of task completion in a specific project (e.g.,miles of habitat fenced, miles of roads decommissioned, completion of reports, etc.).Implementation monitoring results must be presented for projects and need to be clearlydocumented and synthesized (see Section 4.1). However, sound science requires thatproject results also be measured in terms of benefits to desert tortoises and habitat.
Tier 1 status and trend monitoring obtains repeated measurements on indicator variablesover a period of time, with a view to quantifying trends or abrupt changes over time. Forexample, availability of water in a habitat improvement project might be measured inAugust every third year for a 21-year period. This can be a low level of monitoring onindividual project sites or on a large area. For example, aerial photography or data layers ina GIS could be used for long-term trend monitoring of riparian or other terrestrial habitatover time. In general, Tier 1 monitoring does not establish cause and effect relationships(i.e., is not a “true” research experiment) and does not provide statistical inductiveinferences to larger areas or time periods. It is not necessarily expensive or time consuming.However, Tier 1 mapping or trend monitoring on similar projects replicated over time andspace can provide compelling evidence for general conclusions. Also, aerial photography ordata layers in a GIS yield a census of the study area, thus eliminating the need for spatialsampling and classical statistical analysis at the scale studied.
Tier 2 statistical monitoring provides statistical inferences to parameters in the study areaas measured by certain data collection protocols (e.g., distance sampling for density ofdesert tortoises). These inferences apply to areas larger than the sampled sites and to timeperiods not studied. The inferences require both probabilistic selection of study sites andrepeated visits over time. Individual proposals can support larger Tier 2 statisticalmonitoring projects by using the same field methods and methods to select study sites thatcontribute information to Tier 2 statistical monitoring. Tier 2 statistical monitoring will berequired for estimation of parameters such as number of desert tortoises of reproductive agein an area, juvenile production, acres of noxious weed present, etc.
Tier 3 research (effectiveness) monitoring is for those projects or groups of projectswhose objectives include establishment of mechanistic links between management actions

DTRPAC Report page 127
and population responses of the desert tortoise or its habitat condition. Tier 3 researchmonitoring requires the use of experimental designs incorporating “treatments” and“controls” randomly assigned to study sites. Generally, the results of Tier 3 researchmonitoring qualify for publication in the refereed scientific literature. Examples of Tier 3monitoring would include: 1) projects to evaluate the effects of different levels of predatorcontrol on survival of juvenile desert tortoises, with study areas selected randomly forreference and treatment; 2) projects to evaluate the survival rates of adult desert tortoises inareas treated by different management actions; and 3) projects to evaluate the effectivenessof various land restoration or management techniques.
Tier 3 research and monitoring is that tier most necessary to be hypothesis-based. Forexample, hypothesis-based monitoring could be used to determine the effects ofmanagement actions such as highway fencing or removing grazing. Presence/absence datacan be used to identify areas that could be targeted for repatriation or other researchprojects needed for assessing the efficacy of management (e.g., MacKenzie et al. 2002).For example, data on presence and absence of tortoises collected as part of a project toestimate population density of desert tortoises were used in a kernel analysis of distributionof the desert tortoise in the Western Mojave (Section 4.3). This analysis revealed areas inwhich tortoises were found formerly and now are largely absent. A similar kernel analysisof carcasses showed that the same geographic area had a wider distribution of carcassesthan live animals. Thus, kernel analyses of presence and absence of live desert tortoises andcarcasses show an example of where the distribution of desert tortoises was not maintainedin parts of designated DWMAs and USFWS critical habitat. Specifically, in an area thatwas formerly in the range of desert tortoises, there appears to be no remaining population(Fig. 6.3). A GIS analysis of this extirpation illustrates that the consequence of this loss isgreater than just the loss of the individual tortoises. For example, the Desert TortoiseNatural Area (DTNA) has become a fragment of habitat separated from the rest of theDWMA to which it belongs. The same damaging results have occurred in Eldorado Valley,Nevada. Time required for Tier 3 research monitoring may be relatively short (e.g.,predator abundance following different control procedures) or long term depending on theresponse time (e.g., response of vegetation to burning treatments).

DTRPAC Report page 128
Fig. 6.3 Kernel analysis of presence data for living desert tortoises (green polygons) andcarcasses (red outlines.
6.2 Monitoring Desert Tortoises
6.2.1 Monitoring Desert Tortoise Populations
Tier 1 and 2 status and trend monitoring must have clear objectives for currentmanagement agencies, but should also provide information on status, trend, and changeover relatively large regions and long periods of time. Ideally, the methods will remainuseful for a minimum of 25-50 years. For example, the 2001 distance sampling for deserttortoise abundance provides Tier 2 monitoring allowing statistical inferences to be made tolarge areas of habitat of the desert tortoise. Assessing trends in population numbers isnecessary to assess the efficacy of management actions or to determine when delisting iswarranted. Additionally, trends must be discernable regardless of variation in periodicestimates of population size (whether that variation is caused by actual variation inpopulation numbers or errors in estimates of population size). With little variation in data,statistically determining a population trend is a simple task (Fig. 6.4). However, large

DTRPAC Report page 129
variance in population density estimates for desert tortoises can make determining a trendvery difficult. The life history characters of desert tortoises make discerning populationtrends difficult over a short time (e.g., 25 years; see Fig. 6.4). This type of problem stemsfrom a particular life history typical of desert tortoise (Kareiva and Klepetka1994) and hasbeen previously demonstrated for bald eagle populations (Hatfield et al. 1996).
Fig.6.4 Simulated population growth at a 2%growth rate with (a) a 10% coefficient ofvariation around the trend and (b) a 40%coefficient of variation around the same trend.
Originally, desert tortoise populations were monitored using total corrected sign transects(Berry 1979) or plots (Berry 1984). Both of these approaches have provided data on localdesert tortoise densities with varying degrees of accuracy and precision, yet neither of theseapproaches were designed to provide regional density estimates. As a result, range-widedistance sampling has recently been implemented to provide regional density estimates.However, modern population monitoring also requires going beyond simple tracking ofpopulation densities and should also include documenting changes in the aerial extent ofpopulations.
Long-Term Study Plots
Permanent study plots (see Section 4), and the data gleaned from them, were extremelyvaluable in identifying the original problems with tortoise populations declining. Similarly,they remain important because of their historic data. However, there are also manyproblems with using permanent plots to determine population trends:

DTRPAC Report page 130
Plots cover a small percentage (0.2%) of tortoise critical habitat, though plots areseparated far enough that tortoises from one plot cannot move to another.Plots are neither randomly placed in critical habitat, nor are they placed to addresshypotheses concerning threats or management actions (e.g., highway fencing,removing grazing, allowing fragmentation due to urbanization, etc.).Replication of plots within years is inadequate for comparison.Sample sizes of survey years are largely inadequate to yield enough statisticalpower to perform a regression of trends in any particular plot. High variability inpoint estimates within years contributes to the problem of detecting subtle upwardor downward trends.Several plots were abandoned early in the process because they had low tortoisecounts. This creates a bias for analysis of trends.Data from plots violate assumptions in mark-recapture techniques when applied toall size classes, and detectability of tortoises was not evaluated as part of theanalyses.The spacing of plots is different in different places, and the spacing may notproduce needed sensitivity to detect changes at different landscape scales.
Continued monitoring of permanent study plots may still be of value for other reasons,however. Consideration may need to be given to abandon sampling plots that do notaddress specific research or management issues other than “just because a particular plothas been surveyed for a long time.”
o Long-term capture/recapture data from plots has tremendous potential for looking atmechanisms of trends and asking size-class survivorship questions.
o In management or threat-related, hypothesis-based surveys, if data were parsed outfrom individual grids within plots, more power would exist to determine whichthreats or management activities are most important.
Distance Transect Sampling
Distance Sampling is a method of enumerating population density from data collectedalong transects. The method requires that measuring the perpendicular distance from thetransect line to all tortoises sited (Anderson and Burnham 1996). Calculating animaldensity by distance sampling requires mathematical adjustments to account for the extent towhich a population can be sampled. For example, one has to know the probability thattortoises on the transect line are available to be detected (active or visible in burrows) andthe actual detection rate (termed g0 and often assumed to be 100% in distance sampling).Additionally, one has to measure detectability of tortoises which are some distance awayfrom the immediate transect line, (termed Pa in distance sampling) which is the probabilitythat animals can be seen by the person walking a transect (Anderson et al. 2001).
The further a tortoise is located from the transect line, the more difficult it is to see. Indistance sampling, the perpendicular distance from the transect to the animals can be usedto estimate Pa by assessing proportion of tortoises seen as a function of distance from thetransect. The proportion of observed tortoises is then adjusted assuming the proportion of

DTRPAC Report page 131
tortoises on the transect line is 100%. The statistical approach to calculating Pa requires asample size of about 60 – 80 observations to obtain a well-formed frequency distribution ofobservations in relation to distance from the transect line (Buckland et al. 2001). This is therecommended standard, but, in fact, as few as 15 observations have been used in analysesby the USFWS. In good years, a person must walk more than 400 km to see 60 tortoises inmost of the listed range, and in some years, it is necessary to walk more than 1000 km tofind 60 tortoises (Medica, pers. comm.). The relatively high densities found in the UpperVirgin River Recovery Unit result in much higher encounter rates for that region, and thusthe density estimates from that area have greater precision.
Mathematical and statistical research on properties of distance sampling has shown thepooling of data from multiple teams is robust to different abilities of teams to detect deserttortoises, so long as all teams have 100% probability of detection of available animals onthe transect line. If desired, allowing for team differences with distance sampling isstraightforward, although not with current versions of the program Distance. For example,double sampling with independent observers and logistic regression can be used to adjustfor different abilities of teams and other characteristics of desert tortoises such as: tortoisesfound walking in the open and tortoises found in burrows (e.g., see Manly et al. 1996 forthe use of this method in surveys of polar bear). This method can potentially be used toadjust for sources of error including the tacit assumption that tortoises in burrows have thesame availability and detectability as tortoises found walking in the open.
Some adjustment factors are also difficult to estimate. For example, the availability oftortoises on the transect line changes among sites, at different times of the day, at differentseasons, and among years (Fig. 6.5). The probability of detection of available tortoises onthe line may vary from one team to another. However, data from across the entireCalifornia and Nevada portion of the range are currently lumped to calculate correctionfactors for density estimates of tortoises for the entire Mojave range, exclusive of the UpperVirgin River (the Utah Division of Wildlife Resources has been estimating tortoise densityindependently of other recovery units since 1997). Tortoise activity is calculated using asmall number of focal tortoises, which are monitored to find the proportion of animals thatare active.

DTRPAC Report page 132
Fig. 6.5 Tortoise activitymeasured over a three yearperiod at Bird Spring Valley,NV. Tortoise activity isexpressed as the proportionof animals active for eachhour during each week ofthe year and ranges from 0to 1. The gray areasrepresent times for whichtortoise activity was notsampled. Warmer colorsindicate high proportions ofanimals active, and coolercolors indicate feweranimals active.
Although tortoise densities should be easy to calculate using distance sampling (becausetortoises are diurnal, tortoises are found in open habitat, and their activity is linked todrought severity index), it is not always the case that tortoises are easy to enumerate.Tortoise positions that are cited while sampling include burrow (visible), deep (not visible),open, under vegetation, hidden, tortoise in the open but near burrow. For each recovery unitthe percent activity of focal animals (n = 5-18) is measured. The mean of observationsduring when transects are surveyed is calculated. Unfortunately, the software used tocalculate tortoise densities (Program Distance) currently allows the use of only one value ofg0, and this is a serious limitation to the analyses. New software or data collection methods(e.g., double sampling with independent observers) need to be developed allowing thoseworking with desert tortoises to account for all the variables affecting tortoise activity anddetectability.

DTRPAC Report page 133
Power Analysis - A power analysis was performed to estimate the ability to detect trends inpopulation size (Link and Hatfield 1990, Hatfield et al. 1996) in relation to differentreasonable annual percent population growth rates (e.g., those given in the Recovery Plan,and in Doak et al. 1994), with ranges in error generally encompassing those currentlyencountered using distance sampling in the Mojave Desert (Nussear 2004). For an entirelyreasonable gentle growth rate (1%), the coefficient of variation would have to be muchlower (i.e., 12 %) than current technologies are producing (9.5 to 56.2%, average = 20%) inorder to detect a trend statistically, based on current population sizes. Currently, thoseworking on distance sampling are trying to reduce variance in estimates of Pa and g0, but itmay be impossible to reduce variance enough to be able to detect subtle trends typical ofthe natural growth rates of tortoise populations. Therefore, transect methods minimallyrequire modifications to increase the precision of population estimates to the point wherethey may be useful for analyses needed for delisting. The detection of steeper trends, suchas those of tortoise populations in the West Mojave, is currently possible with the level ofvariation achieved using distance sampling.
Various scientists are working on modifications to the way data are collected and exploringand evaluating new approaches to analyzing data. These modifications include the lengthand shape of the transects, the number of technicians working on the transects, the mannerin which the data are collected, the configuration of random start locations for the transects,the areas included/excluded for sampling, etc. Each of these approaches needs to beevaluated in terms of the potential to discern subtle changes in population size.Modifications have been suggested based on the tradeoffs between the precision of datapoints and the number of data points.
There is some doubt that precision of estimates from distance sampling is being evaluatedcorrectly. The sampling unit is the transect, and the “sample size” is the number oftransects in a particular study area, not the number of desert tortoises observed. Programdistance should be used to obtain Pa. Then, given g0 and an independent estimate of theproportion of individuals missed on the transect lines, call this proportion Pt, theabundance on a given transect is ni/(Pa*g0*Pt*Area Searched), where ni is the number ofdesert tortoises seen on “the transect” and Area Searched in the denominator is adjustedfor length and width of transect. Data might be pooled to estimate the factors: (Pa*g0*Pt),but the variance of the survey should be computed based on the values of ni/(Pa*g0*Pt)from each transect. Finally, this process should be bootstrapped to bring in the variationdue to estimation of the components of (Pa*g0*Pt). Pooling the data and running it throughprogram distance one time will give a model-based estimate of variance that does notreflect variation from transect to transect. Clearly, population enumeration via distancesampling needs refinement and evaluation, including evaluating the efficacy of theapproach all together. This refinement can best be accomplished by establishing ascience-savvy monitoring committee who can evaluate and direct change in approaches tomonitoring methods and approaches.

DTRPAC Report page 134
6.2.2 Monitoring Individual Desert Tortoises
Comprehensive monitoring programs allow biologists and managers to understand thedynamics of a species fully. If applied toward desert tortoises, this type of program wouldinclude asking different questions on many different scales, ranging from the level of thepopulation to the individual level. This section discusses aspects of individual deserttortoise monitoring.
Condition indices
Examining changes and variation in the body condition of individuals may also provideanother method for modeling and mapping habitat condition. It could be useful to develop abody condition index for individual desert tortoises that included more information aboutthe health of the individual than do current indices. A condition index might lead biologiststo mechanisms contributing to population dynamics. For example, snakes show strongcorrelations between body condition and reproductive fitness (C. Peterson, pers. comm.;but see Wallis et al. (1999) for contrasting results with regard to desert tortoisereproductive output).
Measuring the condition of individuals need not be separate from monitoring populationsize. A condition index may provide evidence for mechanisms behind changes inpopulation size. For example, a measure of condition could potentially link the risk ofmortality to individual covariates. That risk could help contrast between a stable anddeclining population. Using a more formalized monitoring structure allows some pressureto be taken off of requiring high precision of density monitoring (i.e., densitymeasurements are not relied upon to answer all questions about a population). Each scalethat is monitored should have different objectives and a coordinated effort for addressingeach objective. For example, following individuals (“sentinels”) could be used to determineextent of certain threats, but not to answer exhaustive questions.
Behavior
We also explored information about population viability contained in the behavior ofindividuals. Understanding desert tortoise behavior can be very important to developingmeans to achieve recovery. The actions of living tortoises within their habitats contribute tosurvival, growth, reproduction, and ultimately to population persistence.
Tortoise behavior, as it relates to recovery, consists of the cumulative actions carried out byindividual desert tortoises. The goal is to recognize critical and generalizable behavioralpatterns among desert tortoises. This comes from the study of individual animals undernatural and experimental conditions.
The behavior of individual desert tortoises is the result of complex interactions among sixfactors. Behavior should be analyzed in the context of the interplay of these six effects.

DTRPAC Report page 135
1. Genetic Make-up - Individuals are endowed with a unique genotype that will result infuture individualized responses. More importantly, natural selection and drift canresult in genetically-derived behavioral differences among populations (e.g.,burrowing in soil versus using caves in rocks).
2. Developmental Conditions - Developmental conditions can strongly influencegenetic expression and subsequent behavior. For example, maternally-derivednutrients and hormones, as well as environmental contaminants within the egg,influence neonate performance.
3. Physiological Traits - The ability and manner by which a tortoise responds toenvironmental conditions, and exposure to disease, is a function of its physiologicalcapabilities. Because physiological limits and capabilities themselves are determinedby genes, development, age, sex, and past physiological events, behavioral responsesof tortoises to prevailing conditions may not be predictable without detailedinvestigation (Zimmerman et al. 1994). Furthermore, as the demography of thepopulation shifts or as the habitat is transformed, mean physiological responsesacross a population may shift.
4. Morphological Traits - Genetic make-up, development, and past physiological eventsdetermine morphological characteristics. Morphology and behavior are deeplyintertwined. Morphology biomechanically limits what behaviors can be performed(e.g., foraging performance, vagility, crossing barriers, etc.).
5. Environmental Conditions - Generally, an animal will exhibit only a subset of itstotal behavioral repertoire. Behaviors often are cued by prevailing environmentalconditions. Humans are introducing inordinate new cues into the Mojave ecosystem(e.g., intentionally placed barrier fences along highways and changes of vegetationdue to invasions of exotic weed species).
6. Cumulative Individual Experiences - With time, an animal accumulates a set ofindividual experiences that can strongly influence its behavioral response to astimulus. For these kinds of flexible behavioral responses, older individuals will tendto express successful behavioral responses (natural selection). Although counter-intuitive, net behavioral responses within a population can be a function ofdemography even after controlling for differences in 1-5. If tortoise lifespan hasbeen shortened due to human-caused mortality, tortoises that once contributed mostto reproduction (mature and experienced individuals) may now be lost on a regularbasis.
Most behaviors of primary conservation and recovery importance are poorly understood orunknown at this time. Because the recovery of the desert tortoise is intrinsically ademographic problem, it is valuable to take a demographic approach to tortoise behavior.Doing so illustrates the central role of behavior in the recovery of the desert tortoise andidentifies significant gaps in knowledge of important tortoise behavior.

DTRPAC Report page 136
Behavior of Embryos and Neonates
Post-hatch performance of young birds and turtles is linked to egg quality, which in turn islinked to adult female physiology and the time of egg formation. Egg size (Roosenburg andKelley 1996), nutrient endowment to the yolk, and the endowment of maternally derivedsteroids (Pilz et al. 2003, Sockman and Schwabl 2000) affect the behavior and performanceof neonates following hatch. Variation in neonate tortoise performance and its relationshipto maternal quality are unknown.
This seemingly obscure issue is linked to tortoise conservation and recovery in twoimportant ways. Adult females that face poor quality foraging habitat likely will producefewer or lower quality eggs. Secondly, if prevailing mortality patterns act to remove matureand experienced (i.e., high quality) females, egg quality and quantity likely will decline.
Post-hatch movement and habitat selection of neonate tortoises appears to be largelyunknown but likely is very critical to population dynamics. The Mojave environment isheterogeneous. It is plausible that only a small subset of the general environment isadequate for the survival and growth of neonate tortoises, so these special habitats becomeextremely important to conservation and recovery even though they may represent a smallpercentage of available habitat. Do neonate tortoises go on a “random walk?” Are theyfollowing cues to important habitat? Are they moving independently of one another?
A corollary to this issue is nest-site selection by breeding females. Adaptively, one mightpredict that females will select nest sites close to suitable neonate habitat if such habitat isavailable and females have knowledge of it. Are females limited in nest-site selection?Possible limits might be: inexperience (older may do better), territoriality, loss of qualitynest sites, barriers to movement to preferred sites.
Behavior of Juveniles
Desert tortoises have a long juvenile period. Prolonged juvenile periods in birds andmammals frequently are attributed to the need for learning as well as for time needed togrow to breeding size. Desert tortoises grow and reach sexual maturity faster when fed high-nutrition diets (Christopher et al. 1998), and gopher tortoises do the same in high-nutritionhabitats (Mushinsky et al. 1994). Apparently, little thought has been given to the possibilitythat the juvenile period in tortoises has important functions other than a prolonged effort toacquire the nutrients to grow to some predetermined breeding size (Wilson et al. 1999).
Certainly, juvenile tortoises engage in a suite of behaviors central to future populationdynamics. Most importantly:
Movement - The degree to which juvenile tortoises move through their environment iscritically important because of its link to three crucial phenomena.
A) Juvenile dispersal - Dispersal determines gene-flow, the “connectedness” ofpopulations, and the genetic signal which we attempt to decipher in evaluating

DTRPAC Report page 137
populations. Without significantly better understanding of juvenile dispersal,informed recovery planning will be severely hampered.
B) Disease transmission - It is likely that juveniles move more than adults in theprocess of finding a place to settle. It also is likely that juveniles encountermore tortoises in this process than do settled adults. Hence, juveniles movingthrough the environment and interacting (agonistically?) with other tortoisescould be a central mechanism for disease transmission. We cannot verify ordiscount this plausible scenario without measuring juvenile movement.
C) Information gathering - The juvenile period can be an important period ofinformation gathering. Presumably, juveniles learn locations of food, water,shelter, potential mates, and other critical information during the juvenileperiod. If juveniles necessarily wander during this period of their lives, thentheir vulnerability due to wandering may remain high regardless of apparentenvironmental conditions.
Foraging and seeking shelter to promote growth - Nutrition, water, and thermal needsdiffer for juveniles relative to adults. Do juveniles have special habitat needs relatedto this growth phase of their life? Are these habitat needs being met?
Gender differences in juvenile behavior - Little to nothing is known here.
Behavior of Adults
Considerably more is known about adult behavior, although it remains insufficient for well-informed conservation planning. Key issues are:
Disease by behavior interplay - Disease regularly causes behavioral changes in animals(listlessness and other forms of morbidity, etc.). If disease changes behavior anddetection during surveys, then surveys may fail to provide accurate information.
Mating system - Effective population size and genetic signatures can be influenced bymating system. Mating systems can create differential vulnerability of the sexes duringmovements. Encounters with vehicles, barriers, or humans might be influenced bymating systems. Disease transmission might be affected by searching for mates andcourtship.
Sperm storage – With sperm storage, following insemination adult females becometemporarily independent of males for reproduction. This independence lasts for theduration of effective storage. Furthermore, if males are polygynous, then adult malesurvival becomes relatively less important than female survival.
Breeding dispersal – Especially, do females return to nest areas? Are some females“sinks” by returning to traditional sites that actually fail?
Circannual rhythm – Circannual rhythm can affect detectability, interacting with goodfood years.

DTRPAC Report page 138
6.3 Habitat monitoring
When threats to habitat exist, it may be as important to monitor habitat as it is to monitorthe focal species. In this context, a bias toward monitoring of focal species is particularlyundesirable, because problems with habitat loss that have immediate consequences aredeprived of attention and resources (Campbell et al. 2002).
Remote Sensing for Tier 1 monitoring of status and trends - Aerial photography, digitalairborne data, and satellite data are all possible remote sensing technologies that could beused to monitor habitat (M. Cablk, pers. comm. 2003). Remote sensing will not work wellunless habitat monitoring experts work within the decision-making process. Types ofhabitat features that could be measured using remote sensing include vegetationassociation, slope, elevation, micro-conditions, elevation limits, geomorphology, andurban/agricultural land, etc. Once tortoise experts have determined which features areimportant to measure, the spatial, spectral, and temporal resolution of those features mustbe determined. This approach makes it more likely to capture the essence of habitat andhow best to measure it. Change detection analysis would be used to determine seasonal orannual differences.
Habitat Modeling - New techniques have also been developed in environmental and habitatmapping/modeling (C. Peterson, pers. comm. 2003). These approaches determine keyfeatures and assess those features along an environmental gradient. This has been done wellfor some species using simple habitat variables like temperature and moisture. Analysis toolsinclude estimation of probability of occurrence or abundance of desert tortoises by multipleregression on habitat variables. In addition, resource selection functions for habitat use canbe estimated by contrasting GIS or “on the ground” data between transects with and withoutdetection of desert tortoises (Manly et al. 2002).
Monitoring Recommendations
• A coordinated, integrated, collaborative, range-wide monitoring program is needed.This program must be comprehensive and multi-scaled in its approach. The elementsof the program should include the aerial extent of population, density of populationswithin aerial extent, qualitative and quantitative gain/loss of habitat, quantitative trendsfor threats, and possibly a condition index of individuals as an indicator of thepopulation status.
• There should be a science team formed to advise USFWS and land managers on howto make, and keep, the monitoring efforts scientifically credible and to help adaptivelymanage monitoring efforts to be as efficacious as possible. This team should also helpin the prioritization of monitoring efforts. To be most useful, study design and datacollection protocols for Tier 1 and 2 monitoring should be standardized.
• The monitoring program should include an outside panel of experts to evaluate andrecommend how data should be collected and analyzed. The DTRPAC and outside

DTRPAC Report page 139
experts agreed that a monitoring program is not useful unless it has a centralizedorganization, which can provide USFWS with information needed to make informeddecisions.
• A centralized monitoring program should be rigorous and formal wherein agencies,counties, and municipalities contribute to a centralized fund from which integratedmonitoring projects can be funded which adhere to consensuses on monitoringpriorities, approaches, data standards, etc. It is imperative that sufficient funding issecured to implement a scientifically rigorous monitoring program, including notonly field collection of data, but also quality control measures and data management.
• There should be a top-down organization of personnel to conduct monitoring in such away that a formalized process is followed for data collection, quality control, and dataarchival. Standardized data collection and data sharing will allow collaboration so thatmeta-analyses and analyses beyond the calculations of tortoise densities can be done.All parties who collect monitoring data should have an agreement for datasharing/pooling and documentation of metadata, as well as agreements on publicationof the data/analyses.
• All Tier 1 and 2 monitoring should be designed to meet current managementobjectives but should be general enough to monitor trend and changes over a relativelylong time period, say 50 years. All Tier 3 monitoring should be hypothesis driven. Inother words, Tier 3 research should be experiments to test pre- and post-managementactions over relatively short time periods.
• Protocols for Tier 3 research monitoring should include identification of specificstatistical and modeling procedures for analysis of data collected. There should beanticipated analysis methods for Tier 1 and 2 status and trend monitoring, but theseanalysis methods are less critical than for Tier 3 research because Tier 1 and 2monitoring data should have utility over a relatively long time period. In fact, analysismethods for Tier 1 and 2 monitoring data that will be used in, say 2025, have probablynot yet been envisioned.
• Monitoring should be promoted to detect change at different scales or levels ofintegration (Allen and Hoekstra 1992).
• Data on habitat and threats should be collected as part of tortoise density monitoring toextend the scope of density analyses and enhance the ability to develop correlation-regression models between abundance of desert tortoise, habitat, and threats. Thiswould include association of habitat and threat indicator variables (e.g., length of roadsper unit area in buffers surrounding transects) with individual transects used indistance sampling.
• There should be a workshop to bring experts on various kinds of monitoring togetherto map a plan for developing monitoring of habitat and threats. Additionally, thereshould be a summit on statistical approaches to density monitoring. This summit

DTRPAC Report page 140
should bring together statisticians and tortoise biologists to map out a plan forimproving density monitoring.
• There is value in permanent study plots only if the data are used more fully. The use ofpermanent study plots should be evaluated relative to their utility in answering specificresearch or management questions. Some established plots may have outlasted theirscientific usefulness, while others may need to be established to answer new questions(e.g., relative to threats and recovery action effectiveness or DPS differentiation).
• The value of permanent study plots is also based on the availability of raw plot data.Without the ability to pool data from all areas and projects, plot data do not justifytheir expense. It is difficult to justify the amount of money spent on data collectionfrom plots without having open access to the full data set. Inter-agency coordinationshould be imposed to acquire all necessary data for analyses.
• Continue to use transect sampling, as these data are extremely valuable. Developcustom computer software to incorporate unique needs for tortoises (includingmodeling go and Pa). Currently, it is not possible to modify the computer softwareprogram DISTANCE. Do research to find ways to reduce variance in estimates ofavailability and detectability, including variance created due to the clumpeddistribution of tortoises in the landscape. Investigate the use of bootstrapping ofindividual transect lines to evaluate a design based estimate of variance of density andabundance of desert tortoises.
• There should be continued work to modify distance sampling to get the most preciseestimates possible. This includes, for example, improving detection rates and addingenvironmental covariates in models of population density.
• There should be an attempt to determine the minimum rate of growth or declinedetectable by the most optimistic methods. This would produce an answer to thequestion, “in the best of all worlds, is there power to detect a certain level of decline orincrease?”
• Distance sampling as implemented in 2001 combined with habitat and threatsvariables measured at the same sites continues to hold great promise for long-termstatus and trend monitoring. If distance sampling is shown not to have enough powerto track population trends, then it may be necessary to redirect effort towards detectingtrends in other objects or processes, such as changes in carcass density or tracking die-offs, etc. The downside to this suggestion is that some objects or processes may have atime lag that would preclude seeing a decline in adequate time to respond with achange in management.
• Transect sampling associated with distance sampling for abundance as implemented in2001 should be refined to collect considerably more data. Additional data couldinclude habitat measures such as rainfall, vegetation, etc. as well as measures onindividual tortoises such as blood samples for assessing stress, health, genetic

DTRPAC Report page 141
distinctness, etc., and the ability to determine remotely sensed/GIS data such as lineardensity of roads in buffers surrounding transects.
• Density monitoring needs to be recognized to have several components: training fieldcrews, field collection of data using standardized data collection protocols, data qualityassessment and quality control, data archival, metadata (methods) archival, and dataanalysis and reporting. Too frequently in the past, monitoring has expended virtuallyall funds on field collection of data, and the other components that should be includedin a comprehensive monitoring program have been neglected.
• If estimates of tortoise density are determined to be too variable to be useful inassessing effectiveness of management actions, then perhaps density estimates shouldbe treated as “density indicators.” This approach should be used only after it has beendetermined that assessing density cannot be accomplished to obtain useful, precise,and accurate estimates.
• There should be an attempt to assess the extent to which data on presence and absenceof tortoises could be useful to the goals for monitoring. The method of MacKenzie etal. (2002, 2003) should be explored as a means to enhance monitoring. The methods ofManly et al. (2002) for estimation of resource selection functions should be consideredas a means of relating habitat use to measured indicators of habitat quality/quantity orthreats.
• A health, or physiological status, index needs to be developed from body conditionmeasurements of individual tortoises. The condition index of Nagy et al. (2002) maynot be sufficient by itself, because it gives no information on levels of stress, immunesystem function, etc., and little information on changes in body mass not attributableto water gain/loss (see also Hayes and Shonkweiler 2001).
• Initiate a rapid response program to investigate morbidity and mortality events, usingexisting programs (e.g., Biodefense, Foodnet) as models (i.e., develop standardoperating protocols so that when a die-off event occurs, response actions happenquickly). Develop standard diagnostic and evaluation protocols to determine the natureand severity of a disease threat. Develop appropriate management strategies forcontaining or removing a disease threat, if necessary. Develop appropriate ways ofevaluating the success of management strategies.
• Habitat and threats monitoring by remote sensing should be researched.

DTRPAC Report page 142
6.4 Delisting Criteria
As given in the Desert Tortoise Recovery Plan, five criteria must be met for delisting of thedesert tortoise (USFWS 1994).
Criterion 1
“As determined by a scientifically credible monitoring plan, the population within arecovery unit must exhibit a statistically significant upward trend or remainstationary for at least 25 years (one desert tortoise generation).”
Criterion 2
“Enough habitat must be protected within a recovery unit, or the habitat and thedesert tortoise populations must be managed intensively enough, to ensure long-termpopulation viability.”
Criterion 3
“Provisions must be made for population management in each DWMA so thatpopulation lambdas are maintained at or above 1.0 into the future.”
Criterion 4
“Regulatory mechanisms or land management commitments have been implemented thatprovide for adequate long-term protection of desert tortoises and their habitat.”
Criterion 5
“The population in the recovery unit is unlikely to need protection under the EndangeredSpecies Act in the foreseeable future. Detailed analyses of the likelihood that a populationwill remain stable or increase must be carried out before determining whether it isrecovered. (a) Fluctuations in abundance, fecundity, and survivorship; (b) movements ofdesert tortoises within the area and to or from surrounding areas; (c) changes inhabitat, including catastrophic events; (d) loss of genetic diversity; and (e) any otherthreats to the population all might be significant and should be important elements thatshould be considered in such an analysis.”
All but the first criterion deal with securing habitat into “the foreseeable future” for therecovered populations and remain mostly relevant, except for changes in wording needed toaccommodate a new first criterion. The first criterion may require replacement ormodification. The Recovery Plan called for creation of areas for intensive management oftortoise populations that were large enough (at least 1000 square miles) to permit recoveryof the populations within them after the populations had declined to minimum permissiblepopulation sizes, as determined by population viability analyses. Although this prescriptionfollowed logically from a heuristic model of what was known about population dynamicsin the desert tortoise, statistical methods now available suggest that it may be impossible tomonitor populations precisely enough to determine if the prescription was effective. Power

DTRPAC Report page 143
analysis of current monitoring approaches to estimate tortoise population densities showsthat it will be nearly impossible statistically to discern an upward or stable populationtrend, even over a 25-year time span, which is a requirement of the current criterion. Onthis basis, the first criterion needs to be modified, and the revised criterion shouldincorporate the following considerations.
• The criterion of a population remaining at least “stationary” does not work well,insofar as high variance in population estimates often makes a population’s trendingupward or downward statistically indistinguishable from its remaining “stationary.”
• The criterion of a population remaining at least stationary draws attentionexclusively to population size and excludes concern for changes in habitat andthreats, which are significant components of a well-conceived recovery andmonitoring program.
• The criterion of a population remaining at least stationary ignores multiple scales ofmeasurement, disregarding important information on population well beingavailable at the levels of the individual (e.g., physiology and behavior ofindividuals) or landscape (e.g., ecosystem processes, such as habitat fragmentationand/or degeneration), and failing to define relationships among the components of awell conceived recovery and monitoring program.
• The criterion of a population remaining at least stationary suffers statistically fromlack of power and high levels of risk from both Type I and Type II statistical errors.
• The definition of a “population” excludes the possibility of tortoise populationsacting as metapopulations.
These considerations highlight the fact that that the heuristic model of desert tortoisepopulation dynamics used by the Recovery Team essentially is obsolete. In particular, theRecovery Plan may have (a) overestimated the importance of local population dynamics,(b) underestimated the importance of metapopulation processes (a concept in its infancy in1994), and (c) greatly underestimated the time required to observe evidence of recovery.Population die-offs appear to occur commonly, and local populations seem to recover fromthose die-offs at different rates. Some local populations appear historically to haveachieved high densities and subsequently all to have suffered die-offs (this pattern has beenseen especially in the Western Mojave and in Southwestern Utah, but it also may have beenpresent in other places, such as Piute Valley, Ivanpah, Chuckwalla Valley, and FennerValley). These slowly accumulating facts suggest that the desert tortoise exists in anecological system in which metapopulation dynamics may have been historically importantto the long-term persistence. It may be the case that, for the desert tortoise, nobody has yetseen a single cycle of local population extirpation and re-colonization that may occurnaturally as a part of metapopulation dynamics. Habitat fragmentation by satelliteurbanization and high-density highways currently may be preventing naturalmetapopulation processes and, ultimately, species recovery.
DTRPAC Report page 144
The metapopulation model of recovery contrasts deeply with the heuristic model used bythe Recovery Team. If the metapopulation model accurately describes the ecology of thedesert tortoise, then it will be necessary to understand the dynamics of recovery for bothlocal populations and for entire metapopulations, within an ecosystem that is permanentlydisrupted by habitat loss, fragmentation, and degradation. In this disrupted state,metapopulations are not likely to recover without artificial enhancement of metapopulationprocesses. For example, if fragmentation ablates normal processes of recolonization oflocal populations after die-offs, then it may be necessary to “head start” recolonization oflocal populations from hatchery stocks. This, and similar, management actions were notconsidered in the original Recovery Plan. Employing the metapopulation model willrequire considerable ecological wisdom, and we recommend that the new science advisorycommittee for the USFWS assemble appropriate expertise, perhaps in a workshop, todevelop new prescriptions for management that will lead to delisting. It will be necessaryfor such a group to develop new criteria for assessing recovery of a metapopulation. Inparticular, it will be necessary to develop (1) indices of poor metapopulation function thatdo not suffer from the kinds of statistical and other inadequacies described above (perhapsindices that focus on extreme, i.e. minimum, values rather than on central tendencies); (2)monitoring schemes that are sensitive enough to reveal relatively subtle changes indemography, habitat, and threats (perhaps schemes that focus on presence/absence ofcritical size classes in a large number of small, widely spread quadrats rather than onquantitative assessment of population size in a small number of locations); and (3)management plans that compensate for ecosystem dysfunction (perhaps plans that, ofnecessity, incorporate currently controversial techniques such as head starting,translocation, and maintenance of so-called "assurance colonies").

DTRPAC Report page 145
“TTrruuee sscciieennccee tteeaacchheess,, aabboovvee aall ll ,, ttoo ddoouubbtt aanndd bbee iiggnnoorraanntt..”
Miguel de Unamuno, The Tragic Sense of Life. (1913)

DTRPAC Report page 146
7. Integrating Research and Management
The mission of the DTRPAC was to analyze the current state of research on the deserttortoise, to identify important gaps in our knowledge about the desert tortoise, and tosuggest ways in which those gaps could be filled. The results of the efforts of the DTRPACto accomplish this mission are displayed in previous chapters. Although its mission did notinclude recommendations about management directly, the DTRPAC concluded thatresearch and management are so closely intertwined that it would be remiss in notaddressing relevant management issues. Furthermore, the DTRPAC strongly suggests thatno matter how good and complete the research effort may become, it will be for naught if itdoes not become part of a well-conceived management plan. We begin by reviewing theresearch needs.
7.1 Synopsis of Recommendations
We collected the various recommendations in previous chapters, paraphrased them forclarity, and organized them topically, by Research and Monitoring, Cooperation andCoordination, Data Management, and Other Management Recommendations. The list ofthese recommendations follows (the chapter from which each need was extracted isincluded, in parentheses).
7.1.1 Research and Monitoring
• Improve understanding of genetics and the relationships between genetics and otherattributes
Genetic core units, boundaries, and gene flow need to be examined. (3)
Patterns of differences in ecological. morphological, behavioral, demographic, andhealth status of each unit needs to be determined. (3).
More about the ecogeography of genetics of pathogens and hosts must be learned (4).
• Re-evaluating the status of DPSs and the positioning of DWMAs
DWMAs within each DPS should be geographically revised to maximize theirconservation potential (3).
• Improve population sampling methods
There should be enough study plots to represent the different scales of managementareas (4). Alternatively, using 5-10 key permanent study plots as indices of change,while abandoning sampling of other plots, should be considered (6).

DTRPAC Report page 147
The data should be used more fully, and the raw plot data pooled from all areas andprojects (6).
Modify distance sampling analyses to get the most precise estimates possible,including modeling G0 and Pa (6).
If distance sampling is shown not to have enough power to track population trends,then redirection of effort towards detecting trends in other objects, processes, orindices, such as changes in carcass density or tracking die-offs, should beconsidered (6).
Determine the maximum rate of growth or decline detectable by the most optimisticmethods (6).
The method of MacKenzie et al. (2002), looking at presence/absence, should beexplored as a means to enhance monitoring (6).
Statistical tests need to include measures of power and deal with both Type I andType II statistical errors (6).
If densities are determined to be too variable to be useful in assessing effectivenessof management actions, then density estimates should be treated only as “densityindicators.” (6).
• Develop tools
Innovative methods for the visualization and display of individual and interactivespatial and temporal threats, including GIS and other types of visualizationtechnologies, should be developed and evaluated (5).
Inexpensive and more field-portable tools and diagnostic tests to study diseaseshould be developed (4).
Stress tests that are applicable to wild tortoises (e.g., adrenocorticotropin hormone(ACTH), phytohemagglutinen (PHA), and sheep red blood cell (SRBC) challengeexperiments, to examine adrenal gland response, T-cell response, and B-cellresponse, respectively), should continue to be developed (4).
Habitat monitoring by remote sensing should be developed (6).
• Improve the focus on the recovery goal
In the threats network, the relative importance or hypothesized nature of eachlinkage between impacts and mortality sources should be weighted. Research andmanagement should, through a hypothesis-based approach, focus on thoseactions/threats that are more heavily weighted (5).
Refocus the general approach to research on disease, treating it as part of a networkof threats (5).

DTRPAC Report page 148
Develop clear standards for determining whether individuals in a population arehealthy or not and whether they have been stressed or not (4).
A study of the epidemiology of URTD is badly needed. (2)
Sources of mortality, particularly their importance relative to each other, needs tobe better explored as age-specific survivorship. (2)
The impact many threats have on tortoise populations is poorly known and in needof investigation to evaluate their relative importance and develop effectivemitigations to reduce their impacts. (2)
Alternative protective measures need to be compared experimentally to help ensurethat useful methods are used. (2)
Long-term studies, that include standard life-history traits, are needed on tortoisedemography. (2)
The natural history of host-parasite associations for the major disease relationshipsshould be more deeply elucidated (3).
All monitoring should be hypothesis driven (6).
Recognize density monitoring as having several components: training field crews,field collection of data, data quality assessment and quality control, data archival,and data analysis and reporting (6).
• Improve information gathering
Health assessments should be added to the information gathered in ecologicalstudies and monitoring. A health, or physiological status, index needs to bedeveloped from bodily condition measurements of individual tortoises (6).
Current serological surveys for M. agassizzi should be continued, adding screeningfor THV and other Mycoplasma species, as assays become available (4).
Continue necropsies, if a rationale for these necropsies can be developed in relationto the potential for information from them to affect new knowledge andmanagement (4).
Data on habitat and threats should be collected as part of tortoise densitymonitoring, to extend the scope of monitoring (6).
Monitoring should be pitched to detect change at different scales or levels ofintegration (6).
• Improving information dissemination
Inform researchers about both the qualities and the shortcomings of diagnostic testsfor Mycoplasma species and URTD (4).

DTRPAC Report page 149
Inform researchers about the value of different diagnostic tests in addressingdifferent goals (4).
Explicit acknowledgment describing what data are not available should be made, toallow a more accurate assessment of uncertainty and risk in the planning process (6).
7.1.2 Coordination and Cooperation
• Improve the utility of monitoring efforts
Coordination of effort on monitoring can be improved if USFWS would ensure that allmonitoring data are reported annually as part of the federal permitting process. Thenthe USFWS could facilitate sharing data among researchers as part of the USFWSresponsibility to obtain, analyze, and distribute reports on monitoring data (4).
• Improve the focus on recovery goals
Research and management should, through a hypothesis-based approach, focus onthose actions/threats that are more heavily weighted (5).
Provide quantitative biological goals for the conservation/management plan or recoveryaction (6).
• Develop research agendas
Develop multi-disciplinary, long-term research agendas to understand the networkof threats. Include epidemiologists and population biologists in developing theresearch agendas (4).
There should be a workshop to bring experts on various kinds of monitoring andstatisticians together to map a plan for developing monitoring of habitat and threats (6).
Initiate a rapid response program to investigate morbidity and mortality events (4).
Ensure that killing seropositive, but otherwise healthy individuals, is limited (4).
There should be coordinated effort to conduct monitoring, including having aformalized process for data collection, quality control, and data archival (6).
A centralized, integrated, collaborative, range-wide monitoring program should beinitiated (6).
Recognize density monitoring as having several components: training field crews,field collection of data, data quality assessment and quality control, data archival,and data analysis and reporting (6).

DTRPAC Report page 150
• Employing “outside” expertise
Include epidemiologists and population biologists in developing the researchagendas (4).
There should be a science team to advise the USFWS on how to make and keep themonitoring efforts scientifically credible; to help adaptively manage monitoringefforts to be most efficacious; and help in prioritization of monitoring efforts (6).
There should be external peer review by an independent panel of experts that wouldperiodically review the monitoring program and the science advice given (6).
The monitoring program should include an outside panel of expert analysts toevaluate and recommend how data should be collected and used (6).
There should be a workshop to bring experts on various kinds of monitoring andstatisticians together to map a plan for developing monitoring of habitat and threats (6).
• Improve information dissemination/access
There should be imposed inter-agency coordination to acquire all necessary data foranalyses (6).
7.1.3 Data Management
• Improve information dissemination/access
Ensure that all important data exist, are accessible to researchers, and are explicitlysummarized (4).
Explicit acknowledgment describing what data are not available should be made, toallow a more accurate assessment of uncertainty and risk in the planning process (6).
Information/data should be maintained in an accessible, centralized location (6).
7.1.4 Other Management Recommendations
• Re-evaluate the status of DPSs and the positioning of DWMAs
DWMAs within each DPS should be geographically revised to maximize theirconservation potential (3).
• Improve the focus on the recovery goal
Research and management should, through a hypothesis-based approach, focus onthose actions/threats that are more heavily weighted (5).

DTRPAC Report page 151
The list of research needs suggests attention be directed to at least three management areas:adaptive management, cooperation and coordination, and data management. We discusseach of these areas successively.
7.2 Adaptive Management
Adaptive management can be defined as a flexible, iterative approach to long-termmanagement of biological resources that is directed over time by the results of ongoingmonitoring activities and other information. This means that biological managementtechniques and specific objectives are regularly evaluated in light of monitoring resultsand new information on species needs, land use, and a variety of other factors. Theseperiodic evaluations are used over time to adapt both management objectives andtechniques to better achieve overall management goals as defined by measurablebiological objectives.
Adaptive management of recovery efforts for the desert tortoise must be designed toprovide an objective, quantitative evaluation of the effectiveness of management actionsin attaining program goals (Kareiva et al. 1999). It should provide a scientifically soundapproach to provide resource managers with objective scientific data and analysis uponwhich to base management decisions as well as scientifically valid evaluation ofmanagement actions.
A critical element of any adaptive management program is the database upon whichmanagement decisions can be made. Such a database can provide a basis for evaluatingspecies, habitat, and/or threats status and trends, and it can be used to evaluatemanagement actions directed at recovery. Adaptive management requires an objectiveand scientifically-valid program for collecting data coupled with supervision of anaccessible database by a competent scientific authority.
A Desert Tortoise Recovery Office (DTRO) should be established in the USFWS tooversee collection, quality control, and archival of scientific data as well as analysis ofdata and generalization of results from data. This office should be advised by a ScienceAdvisory Committee (SAC; see Section 7.3.2) composed of credentialed scientists whohave expertise in conservation biology, statistics/experimental design, and herpetology.The DTRO would facilitate both collection and distribution of data from and to scientists,managers, and stakeholders. Additionally, this office should be in charge of data security.This office should appoint a database manager (potentially as a contract) that will be incharge of long-term maintenance of the database
7.2.1 Ingredients of Inventory, Monitoring, and Research
Inventory, monitoring, and research include six key steps, which when appropriatelylinked to decision making, will maximize the collection and integration of objective,reliable data into the decision-making process and is intended to minimize inappropriate

DTRPAC Report page 152
or unnecessary management actions.
• Identifying Explicit (Quantifiable) Scientific Goals and ObjectivesThe goals of recovery programs include targets of study at a wide variety of spatial scalesand levels of ecological complexity. For example, targets of study will range from highlyrestricted spatial scales for individual tortoises to broad spatial scales to include multipleDPSs (see section 3.0).
• Identifying Likely Threats or Combinations of ThreatsThe SAC should guide efforts to identify likely threats, or threat combinations (see Section5), for recovery. Threats, and threat combinations, will include both natural andanthropogenic phenomena including change in drought frequency, fire, toxic pollutants,flood, invasions of exotic species, poaching, disease, and so on. Identification andverification of threats, and threat combinations, will be the product of research to establishmechanistic links between environmental phenomena and threats to populations andecosystems.
• Constructing Conceptual Models Describing Crucial Ecological InteractionsThe models are important in developing an understanding of the key processes andproperties of the ecological interactions between individuals, and/or populations, and theirenvironments, and in developing understanding of how threats affect processes likeextinction. The models will be important in delimiting the boundaries of what constitutesnatural variation in population processes and the role of humans in stressing populations.Models should incorporate the latest scientific concepts and paradigms, which can keepcosts low and scientific understanding high.
• Identifying Indicators or IndicesIndicators are surrogates of population responses to threats (Simberloff 1998). Indicatorscan be demographic properties or characteristics that are easy to measure and exhibitdynamics and responses that parallel those of more difficult to measure populationproperties or processes. Indicators must be selected because they demonstrate low naturalvariability, but they respond measurably to environmental change at reasonable cost.Indicators might include population sizes and distributions, and physical and bioticvariables. Establishing indicators will require research into the correlation amongpopulation dynamics and ecosystem properties and processes.
• Developing Sampling Design to Estimate Status and Trends of Populations, Habitats,Threats, and/or IndicatorsHypothesis testing, trend analyses, model development, and statistical inference must comefrom rigorously scientific programs that should be subjected to independent scientificreview. Monitoring exercises must be statistically rigorous so that the program will havethe highest probability to detect ecologically important trends convincingly. Samplingdesign, hypothesis testing, and trend analyses are all scientific procedures that continuallybecome better as general scientific knowledge increases. Thus, rigor in this area willrequire continuous reevaluation.

DTRPAC Report page 153
• Determining Threshold Values That Will Trigger Management ChangesQuantitative levels of status and trends should be used to trigger adjustments landmanagement and policy. This is the basis for adaptive management, and it providesrecommendations for the appropriate bodies to establish dynamic policies and managementaimed at producing the desired ecological condition and the conditions required by theUSFWS.
Appropriately integrated, this systematic program can use direct measurements andsurrogate variables (indirect measures of the status of recovery) to determine the status andtrends of the focal species. The resulting data and analyses should provide insight and leadto recommendations for adaptive management. It is critical to this process and to theassurances made to the USFWS that the long-term scientific integrity of inventory,monitoring, and research be assured because of the highest standards of scientificaccountability and peer review.
Inventory, research, and monitoring are necessary and important activities for recoveryprograms. Nevertheless, the lines defining the differences and similarities betweenmonitoring and research are not sharp. Indeed, appropriate monitoring requires researchmethods to provide more than anecdotal information, and anecdotal information will beinadequate for both economy-seeking permit holders and for regulatory agencies.Additionally, where monitoring methods do not yet exist, research must be conducted todevelop efficacious means to assess the effectiveness of the recovery efforts.
7.2.2 Relationships among Inventory, Monitoring, Research, and Adaptive Management
Inventory, research, and monitoring (IRM) are necessary and important activities forcomplex, long-term, recovery efforts. The lines defining the differences and similaritiesbetween monitoring and research are not sharp. Indeed, apposite monitoring requiresresearch methods to provide anything more than anecdotal information, and anecdotalinformation will be inadequate for both economy-seeking permit holders and for regulatoryagencies. Additionally, where monitoring methods do not yet exist, research must beconducted to develop efficacious means to assess the effectiveness of the recovery plan.Thus, this section will elaborate on the definitions, roles, and importance of IRM activitiesin conservation planning.
7.2.3 Definitions
• Inventory, a to Webster’s New International Dictionary (Merriam-Webster 1986), isan itemized list of current assets; as a survey of natural resources such as a survey ofwildlife of a region.
• Monitoring, a to Webster’s New International Dictionary (Merriam-Webster 1986), isto watch, observe, or check especially for a purpose.
• Research, a to Webster’s New International Dictionary (Merriam-Webster 1986), is tosearch or to investigate exhaustively.

DTRPAC Report page 154
7.2.4 Inventory
A recovery program designed to protect sensitive populations must be based uponknowledge of the status of populations. The size and spatial distributions of populations arecritically important pieces of information upon which management prescriptions can bemade. If the status of any population is not known, then aspects of that status can beassessed through an inventory of presence and absence, that inventory should be conductedat the earliest possible time in the planning process, and periodic inventories may need tobe conducted to assess the distribution of presence.
7.2.5 Monitoring
Monitoring without a goal can result in misdirected management more than can result fromno monitoring at all. Monitoring without goals can consume valuable resources that can beused constructively in other conservation actions (such as buying more habitat), andincorrect information from improper monitoring can mislead and direct dangerousmanagement decisions. Additionally, monitoring must be conducted with adequatesampling and scientifically defensible sampling protocols so that any new data aresufficiently replicable that they can lead to conclusions with a determinable probability ofbeing correct.
There are numerous relevant goals of monitoring, and different kinds of monitoring arenecessary and important to a successful recovery plan. Nevertheless, monitoring isimportant to validate management actions, to provide better data for adaptive management,and to get advanced knowledge of unforeseen circumstances that arise in the recovery plan.Monitoring can be categorized as implementation monitoring, effectiveness monitoring,and validation monitoring (NMFS 2002). The first two of these forms of monitoring meetthe definition of monitoring, but the validation monitoring is actually a form of research(see below, Fig. 7.1).
• Implementation MonitoringImplementation monitoring provides a permanent record of what mitigation andmanagement is applied as part of the recovery plan. Implementation monitoring shouldoccur continually and it should include details about the implementation actions undertakenin mitigation of take or as management for recovery. Implementation monitoring shouldassess actions such as fencing along roads, recreation restrictions within reserves, rangeimprovements, pollution regulation, vegetation restoration, grazing management, etc.Implementation monitoring also should include “natural implementations” such asoccurrences of drought, natural fires, and invasion of exotic species.

DTRPAC Report page 155
Fig. 7.1 Relationships among the desired objectives of a recovery program, a conceptual model ofthe functional relationships among species, and monitoring activities in the adaptive management.
• Effectiveness MonitoringEffectiveness monitoring is used to record change in recovery status caused by managementactions and other important natural and anthropogenic events as well as random, year-to-year change. With sufficient data from different monitoring sites and from a series of years,analyses should be able to separate out the non-random change from a background ofrandom change. For example, analyses of data from effectiveness monitoring could assessthe efficacy of grazing restrictions on vegetation. They could estimate the impacts of naturaland anthropogenic fires. They may assess the growth in animal populations freed frommortality caused by vehicles on roads passing through semi-natural areas. Importantly,analyses from effectiveness monitoring also should assess the loss of biological resourcesdue to aggressive competition, predation, or parasitism by exotic species.
Even if all populations being recovered were monitored to assess non-random change, thatwould not be enough as a test of the efficacy of recovery actions. Other populations orprocesses within the planning area could threaten the efficacy of a recovery program evenbefore non-random change occurs in the populations. If habitats are invaded by adestructive exotic species, or a destructive change in pollution levels, or a destructive
Actual Statusand Trends
Research
ValidationMonitoring/Research
Results ofmanagement actions
AdaptiveManagement
ActionsEffectivenessMonitoring
Desired Statusand Trendsfrom Manage-ment Actions
Conceptual Model
ImplementationMonitoring

DTRPAC Report page 156
change in climate, then the existing management activities might not be adequate andmight have to be changed as part of adaptive management.
• Validation MonitoringValidation monitoring (NMFS 2002) is actually research. Its purpose is to determine if the“conceptual model” of the ecological systems of the recovery program is valid. The conceptof validation is that, if the conceptual model is correct, then correct prescriptions foradaptive management can be made. Validation monitoring/research determines the extent towhich predictions and assumptions of adaptive management are appropriate to attain thedesired objectives. Validation monitoring/research generally requires experimentation andlong-term monitoring to create a database essential to validate results from the effectivenessmonitoring. Validation can be made regardless of whether or not the conservation objectivesare met. For example, if a particular standing crop of non-woody vegetation is deemed (bythe conceptual model) to be essential to provide shade for tortoises, and if this standing cropis not achieved even after a reduction in cattle grazing, then validation monitoring/researchcould be used to determine needs for additional changes in grazing. That is, validationmonitoring/research is used to assure that benefits of management actions are not wronglyattributed to a given action or mechanism.
Adaptive management of recovery efforts requires constant assessment of the effectivenessof management actions. That assessment occurs through monitoring, and some monitoringcannot occur without research. An effective monitoring program must have all three typesof monitoring and research or else it is not possible to interpret data from the componentparts of monitoring. Specifically, the efficacy of the recovery effort requires evaluation ofthe effects of management in light of hypothesized responses to that management and tothe actual management actions. All of the different kinds of monitoring are required tomake a decision to alter current management practices to reach the desired objectives ofrecovery.
7.2.6 Research
Research is necessary for the development, and continual correction, of the conceptual modelof the recovery program. An incorrect conceptual model of recovery can lead to dangerouslyinappropriate adaptive management. Assumptions of which management actions will lead tothe desired objectives of the recovery program need to be tested. For example, suppose thatwe hypothesized a conceptual model that posits that unpaved roads result in greater mortalityof reproductive female tortoises. This hypothesis requires testing. The test would not simplyassess the number of tortoises lost due to facilitated poaching or direct mortality fromvehicles, etc. It would, additionally, assess threats to the persistence of desert tortoisepopulations given that some individual tortoises will die due to roads.
7.2.7 Adaptive Management Decision Making
Importantly, adaptive management must facilitate information transfer to decision makersand land and resource planners. The process involves five steps:

DTRPAC Report page 157
• Provide a range of possible management responses.
• Determine the potential alternative ecological outcomes associated with specificphenomena being monitored.
• Assess the probabilities associated with each possible interpretation of monitoring data.
• Identify the management decision that maximizes the overall “utility” of eachdecision and outcome (involving considerations of the costs of misinterpretations ofmonitoring data and costs of wrong decisions).
• Propose research endeavors that are likely to result in identification of managementactions which will allow species to be moved from evaluation to covered status.
7.2.8 The Circle of Status and Trends and of Monitoring
The circle of elements marked with blue arrows in Fig. 7.1 includes the major elements ofadaptive management. Generally, it is necessary to develop goals for recovery, whichgenerally will be the status and trends needed for delisting. Our understanding of theecological interactions between the species and its environment represents our “model” ofsystem. The model, then, represents what we know about the role of food resources,disease, predators, roads, etc. for population dynamics of desert tortoise. That model, andthe goals for recovery, represent the ingredients needed to prescribe management actions toachieve those goals. Management actions might include fencing roads, managing access byoff-road vehicles, habitat restoration of abandoned roads or mines, reducing theanthropogenic subsidies to ravens (e.g., garbage dumps, power lines), etc. The efficacy ofthese management actions needs to be monitored by effectiveness monitoring.Effectiveness monitoring does not assess the management actions per se, but assess theoutcomes relative to the desired status and trends. Thus, the circle in Fig. 7.1 depicts therelationship between status and trends and monitoring as discussed in the next chapters.
7.3 Cooperation and Coordination
The interaction between environmental scientists and environmental managers often hasbeen contentious, even though the ultimate goal of both groups is environmental protection(Cullen 1990; Dewberry and Pringle 1994; Shrader-Frechette and McCoy 1994a, b). Manyfactors, such as under-use of the reductionist approach by managers (Romesburg 1991),over-use of the reductionist approach by scientists (Miller 1993), perceived irrelevance ofscience to the environmental problem-solving process (Johannes 1998), and lack ofconsistency among scientists (Kaiser 2000b), may have contributed to this contentiousness.Despite the barriers between scientists and managers, which still are not easily overcome(Kaiser 2000a), cooperation between the two groups can return important dividends indealing with species recovery (Ecological Society of America 1995, Hyman and Wernstedt1995, Kleiman and Mallinson 1998, Badalamenti et al. 2000).

DTRPAC Report page 158
Cooperation among scientists in different disciplines, like cooperation between scientistsand managers, is likely to return important dividends in dealing with species recovery, yetsuch cooperation also is not easily fostered (Metzger and Zare 1999). Dealing with diseasethreats is an aspect of species recovery for which cooperative research would seem,potentially, to be particularly productive (Nicastri et al. 2001, Wallace 2001). Conservationefforts often could be improved markedly by involving wildlife health professionals (Kock1996, Deem et al. 2001), and disease control efforts often could be improved markedly byinvolving ecologists (Hoffman 2002, Wasserburg et al. 2002, Kazura and Bockarie 2003).The potential role for ecologists in dealing with disease threats is critical as we increasinglycome to appreciate the ways in which local (e.g., Ross 2002) and global (e.g., Chan et al.1999) environments influence disease transmission and prevalence, and, in turn, we cometo appreciate the role of environmental improvement in mitigating the consequences ofdisease (e.g., Woodroffe 1999).
As an example of the potential value of cooperation and coordination, consider research onURTD. Researchers consisting of experts on mycoplasmas (Mary Brown, PhD, Universityof Florida (UF); Paul Klein, PhD, UF; Lori Wendland, DVM, UF; Dan Brown, PhD, UF),gopher tortoise ecology (Earl D. McCoy, PhD, University of South Florida (USF); HenryR. Mushinsky, PhD, USF; Joan Berish, MS, Florida Fish and Wildlife ConservationCommission (FFWCC)) and population modeling (Madan Oli, PhD, UF) are workingcooperatively to fill in important gaps in our knowledge about the effects of respiratorymycoplasmal infection and URTD on the gopher tortoise. The cooperative research isfunded by the joint NIH/NSF Ecology of Infectious Diseases Program for five years. Thepremise underlying the research is that URTD is a complex, multi-factorial disease,interacting in some circumstances with other stressors to affect tortoises (Fig. 7.2).Questions that the research is addressing include: do natural and anthropogenically-inducedpopulation characteristics influence disease transmission and prevalence; does habitatquality influence disease transmission and prevalence; does the disease negativelyinfluence population demographics; and do mycoplasmas vary in virulence, and, if so, doesthe strain present influence disease transmission and prevalence?

DTRPAC Report page 159
Fig. 7.2 Relationships among factors contributing to disease important to demography of the deserttortoise.
Anthropogenic, habitat, host, and microbial factors all potentially affect the interactionbetween URTD and tortoise populations (Fig. 7.2). Anthropogenic factors includetranslocation of tortoises, surrounding urban development, fire suppression, and humanpredation. Means of studying anthropogenic factors include field surveys, fire history data,FFWCC translocation records, and current and historic aerial photographs. Habitat factorsinclude size, fragmentation, management, and rainfall. Means of studying habitat factorsare much the same as for anthropogenic factors. Host factors include size class, sex, healthstatus, and serological status. Means of studying host factors include tortoise surveys,ELISA, CBC, chemistry panels, and physical examinations. Microbial factors includevirulence, species, and strain. Means of studying microbial factors include culturing, PCR,molecular epidemiology, and infection studies.
The data derived from the studies listed above will be used to develop causal and predictivemodels of the interaction between URTD and tortoise populations. The models elucidatethe effects of URTD on population demographics (survival, reproduction, migration) andon population growth. The models also will evaluate the role of the major factors listedabove in influencing URTD transmission and prevalence.

DTRPAC Report page 160
7.3.1 Desert Tortoise Recovery Office
The DTRPAC review leads strongly to the opinion that USFWS needs to implement aDesert Tortoise Recovery Office (DTRO) made up of scientists, a recovery coordinator,GIS specialist, database specialist, and support staff (Fig. 7.3). Some part of that staff canbe outsourced to contractors, and that may be desirable. However, the USFWS has had ahistory of failure on implementing recovery, because the effort is not commensurate withthe magnitude of the task. The desert tortoise is more complex in terms of needs forrecovery than any of the widest-ranging listed species in the US, such as northern spottedowl, red-cockaded woodpecker, or grizzly bear. Thus, unless extinction is an acceptableoption, USFWS must devote more resources to recovery efforts.
The DTRO should be directly responsible for concerted range-wide recovery efforts fordesert tortoises. It would provide a focus to cause management of desert tortoises to bemore efficient and effective. The proposed DTRO would provide a centralized point ofcontact, through which research, data compilation, and monitoring activities arecoordinated, so as to maintain the highest level of knowledge about progress towardrecovery of the desert tortoise. In addition, the DTRO would focus on identifying wherenew research and management should be focused to facilitate range-wide recovery of thisspecies. The DTRO would consist of a Recovery Team leader, and a staff of specializedpersonnel charged with coordinating monitoring, research, Section 7 consultation, and HCPissues. The DTRO would also have the capability of GIS analysis of data, and data storage,compilation and synthesis, as well as public relations and staff support. As a core set ofresponsibilities, the DTRO would:
• Advise, conduct, direct, and prioritize research where appropriate
• Develop new techniques for monitoring desert tortoises, their habitat, and threats
• Recommend management actions based upon the best available science
• Standardize methods for data collection
• Develop a centralized desert tortoise data repository and management system
• Inform policy through recovery recommendations and plan reviews as directed
• Address needs of agencies, local governments, MOG, MOG/TAC, DMG and otherappropriate management organization
• Create a point of contact for stakeholders groups, agencies, NGO's, Congress, GAO,etc. to address policy information needs
7.3.2 Science Advisory Committee
The DTRO would draw upon the expertise of a Science Advisory Committee (SAC) inorder to benefit from the most current knowledge and information available. The SACwould be composed of appointed members from the USFWS, USGS-BRD, and academia,and the Desert Tortoise Coordinator (Fig. 7.3). The SAC would meet periodically to provide

DTRPAC Report page 161
scientific expertise and recommendations to the DTRO. As a core set of responsibilities, theSAC would:
• Rank importance of threats and networks of threats
• Assess the efficacy of monitoring
• Prescribe needed research
• Prioritize research-based recovery actions
• Synthesize data
• Assess progress of recovery
• Consult outside scientific experts as necessary
The SAC could be extremely valuable in addressing some of the critical research questionsstill remaining concerning the desert tortoise, particularly in the areas of spotting trends;identifying gaps in data; and understanding tortoise biology, environment, and threats.

DTRPAC Report page 162
Fig. 7.3 Relationships among offices, teams, committees, etc. functioning to produce strategiesfor recovery and implementation of the listed species.

DTRPAC Report page 163
Planning
Training
DataCollection
DataManagement
Analysis and Reporting
7.4 Data Management
Data management is crucial to producing meaningful and useful data to support deserttortoise recovery. Currently, important data from monitoring tortoise densities are widelyscattered among state and federal agencies and the scientific community. Data have beengathered, organized, and stored in a variety of ways with no common approach. Metadatamay or may not be available. Some data have been reviewed, collated, or otherwiseorganized. Other data have not. Accessibility of tortoise data to managers, scientists, andthe public is highly variable. In short, a great deal of important data (both historical andrecent data) cannot be readily used and may be at risk to being lost permanently unless thedata are compiled, organized, quality assurance/ quality control documented, stored, andmade easily accessible to authorized individuals.
7.4.1 Distribution of Monitoring Resources
Data management is centrally important to data oversight, but it must be done in thecontext of a coordinated monitoring and research program that systematically seeks toidentify needs, generate hypotheses, design studies, collect data, conduct analyses, andreport findings (i.e., scientific method). Translating the scientific method into on-the-ground monitoring and research activities requires funding to support the followingactivities: planning, training, data collection, data management, and analysis and reporting(Fig. 7.4). Size of the pie slices is not intended to represent amount of funding needed, butto represent that each slice is as equally important as any other slice.
Fig. 7.4 Kinds of activitiesassociated with monitoring.
There is a natural tendency to think that data collection is the main activity in monitoring,but monitoring data do not reach their potential without all aspects of the monitoringprocess (Fig. 7.4).

DTRPAC Report page 164
7.4.2 Data Management Plan
It is important to identify issues and potential solutions for improving the management ofdata collected for programs that monitor desert tortoise populations, threats, and habitat. Ata minimum, creation of data management plan would generally include:
Guidelines to standardize data collection models and data management basedupon scientific data collection needs
Guidelines to standardize and manage field data collection operations andmethods. The implementation of these guidelines will insure that at a minimumthe data will be evaluated for its completeness, correctness, andconformance/compliance against the method, procedures, and contractualrequirements.
A Data Quality Assurance/Quality Control Plan (that specifies requiredmanagement activities, procedures and identifies appropriate manual andautomated methodologies for post-processing and database finalization)
A Data Administration Plan (that identifies how data should be consolidated andmanaged in a central data repository and the identification of responsible parties)
7.4.3 Types and Sources of Errors
Data are prone to errors. All data collection operations for desert tortoise monitoring can,nevertheless, be designed and conducted to prevent data entry errors and to automate thedetection and correction of errors during processing. Data may exhibit numerous types oferror that may be broadly classified into the following three categories:
• Blunders –Mistakes in instrument reading, data entry, erroneous computation,careless observation and recording
• Systematic Errors –A regular error introduced by instruments, measurementconditions, or data processing techniques
• Random Errors –Resulting from accidental or unknown combinations of cause.Random errors are the most difficult to detect and correct.
By process of example from 2001-2003 LDS data, Table 7.1 outlines the types of errorsthat need to be managed in any monitoring or research data collection effort. Thedevelopment of the data management plan should include procedures of preventing,minimizing, and correcting each of these data error types.

DTRPAC Report page 165
Table 7.1 Summary of sources and types of error that have been found in Line Distance Sampling.
Error Type Error Data Tables (ATTRIBUTES) Potential Source
Positional
Accuracy
Illogical spatial locations
Example: Transect locations in the
Pacific Ocean
Corner Coordinate, Observation field crew data entry
GPS Data Error (bad
coordinate values, etc.)
Spatial
Reference
Different projections, datums, and
correction factors by area, by year, bycontractor
Example: A portion of the locations
within the database are systematicallyshifted by 100m meters in the northingand 200m in the easting
(EASTING, NORTHING,
LATITUDE, LONGITUDE)
GPS Setup (Incorrect
Datum, IncorrectProjection)
Coordinate conversion
(error in transforming rawfield data duringprocessing to unify into a
common database)
Attribute
Accuracy
Incorrect data values
Example: Incorrect time of observation
All tables and fields PenDragon scripts
field crew data entry
incorrect PDA Time
Completeness Missing data values
Example: No distance from the line
recorded
All tables and fields
All attributes without automated
validation
Data not validated duringdata entry
Consistency Non-standard values
Example: Live and Carcass each havethree different spellings in the database.
Technically ‘LIVE’, ‘live’, and ‘Live’ allmean "live tortoises"
Attributes are not within tolerances
(acceptable parameters)
Example: an MCL value of 10,000mm
All tables and fields Data entry
Data collection methods,contractors, and database
schema changed eachyear
Contractors/data collectors
interpret record and
process data differently
Relational
Integrity
(error in keyrelationship
among recordsacross tables)
Missing or incorrect relationship key
Example: Transect records do not have
all related (corresponding) cornercoordinate records, corner coordinate
record does not have correspondingtransect record, or relationship key isincorrect
Transect and Corner Coordinate Field crew does not create
all corner coordinate
records
Incorrect relationship key
was entered
Missing or incorrect relationship key
Example: Observation record does nothave corresponding transect record, or
observation has incorrect transectrelationship key
Transect and Observation Field crew does not create
observation
Incorrect relationship key
was entered
Data Type and
Precision
Invalid data type
Example: decimal numerical value
stored as an integer
Observation Database design is
incorrect
Data processing did notpreserve data types (e.g.,
import or conversionresulted in roundedvalues)
Lineage and
Metadata
No documentation
Example: Inaccurate or missing field
logs, table names, interim processing filenames, GIS meta-data
Study-level tracking Lack of convention
Lost or missing logs
Failure to createdocumentation

DTRPAC Report page 166
7.4.4 Errors Detection and Correction
The most effective means to achieve a quality database is to prevent errors from occurringin the first place at each level of the workflow process. Prevention will require acombination of initiatives at each stage of data management to standardize data capturemethods, to standardize the data storage model, and to standardize and automate dataprocessing and storage. The principal steps in the data processing workflow are:
• Data model and database design
• Field data collection
• QA/QC post-processing
• Compile data into a common, finalized database
References
Principles of Error Theory and Cartographic Applications; reprinted June, 1968;United States Air Force, Aeronautical Chart and Information Center.
Guidance on Environmental Data Verification and Data Validation (EPA QA/G-8);November 2002; United States Environmental Protection Agency, Office ofEnvironmental Information.
Guidance for Data Quality Assessment: Practical Methods for Data Analysis (EPAQA/G-9; QA00 UPDATE; EPA/600/R-96/084); July 2000; United StatesEnvironmental Protection Agency, Office of Environmental Information.

DTRPAC Report page 167
“SScciieennccee iiss tthhee ggrreeaatt aannttiiddoottee ttoo tthhee ppooiissoonn ooff eenntthhuussiiaassmm aannddssuuppeerrssttiittiioonn..”
Adam Smith, The Wealth of Nations. (1776)

DTRPAC Report page 168
Appendix A. DTRPAC Responses to Comments
We received one comment form and three letters in response to the DTRPAC presentationat the September 24, 2003, Desert Tortoise Management Oversight Group meeting in LasVegas. We received 12 letters with comments on the working draft of the report. Thisappendix summarizes and addresses these comments.
Many reviewers made editorial comments regarding typographical errors, clarifications,and omissions, including an Executive Summary, information on translocation and HCPs,and a more thorough discussion of delisting criteria.
We revised the report where appropriate.
Several reviewers requested that the DTRPAC’s goals and objectives be clarified in thereport.
We revised the report accordingly.
Many reviewers commented that the U.S Fish and Wildlife Service’s policy on DPSs shouldbe better incorporated into the DPS chapter and that the provisional revision of DPSsneeded better justification.
We revised the chapter to more explicitly reference and describe the USFWS’s DPSpolicy. The final report more clearly justifies the provisional DPSs according to thepolicy and identifies areas needing additional data or research to solidify or modifypotential future DPS designation. If and when recovery units or DPSs are revised,existing DWMAs should be reevaluated relative to new recovery unit/DPSboundaries.
A reviewer commented that, in the DPS chapter, discussion about life-history adaptations,which evolve over many generations, does not fit well within the context of recovery plans.
Consideration of life-history traits in evaluating potential DPSs does not imply thatDPS designation should anticipate evolution of new traits. Rather, differing life-history traits between potential DPSs indicate a level of adaptation that has alreadyoccurred and which contributes to the “significance” criterion of DPS designation.Therefore, this discussion is appropriate to the chapter.
Some reviewers commented that the literature-review chapter added little to the assessmentand should be moved to an appendix and that the topic of translocation should be includedin the discussion.
We were charged to review scientific information since the 1994 Recovery Planwas published. This chapter provides an overview of areas of research that havebeen conducted, as well as gaps relative to the 1994 Recovery Plan’srecommendations. As such, we have retained the chapter in the report and haveadded specific information on translocation.
Many reviewers commented that the analysis and discussion of desert tortoise status andtrends was not clear or was flawed in statistical methodology, included omissions in

DTRPAC Report page 169
figures and specific analyses, and should include discussion on how to improve datacollection and analysis methods.
This section of the report has been greatly revised to address issues raised by thereviewers. Statistical methods in both the draft and final reports were reviewed bytwo outside statisticians.
Some reviewers questioned whether a recommendation that the Western Mojave RecoveryUnit of the tortoise should be uplisted to endangered status was within the scope of theDTRPAC’s charge.
We agree that such a recommendation was not within the committee’s charge andhave revised the report to simply emphasize that the current data indicate that deserttortoises in the Western Mojave Desert are continuing to decline. It is the USFWS’sresponsibility to determine whether these data are sufficient to change the listingstatus of the species within this recovery unit/DPS.
Some reviewers questioned whether all available data were used or pointed out severaltimes where the DTRPAC failed to incorporate available data such as that in theWest Mojave Plan, numerous Biological Opinions, and other formal or informaldocuments.
We assessed important information that could be addressed given time constraintsplaced on the committee and invited groups to provide specific studies or data thatbear on the assessment. If other specific reports were overlooked in this assessment,we ask that they be provided to USFWS so that a possible future recovery team canincorporate that information into the actual revision of the Recovery Plan. Weregret the omission of West Mojave Plan data in the draft report. Whereappropriate, much of these data and analyses have been included in the final report.
Many reviewers questioned the accuracy of or methods behind the figures and tablessummarizing desert tortoise threats and Recovery Plan implementation. Some reviewerscommented that particular recovery actions were not reflected in the implementation table(Table 4.3 in the working draft) as having been implemented. Others questioned whethersome actions recorded in the table as having been at least partially implemented haveactually been implemented in a meaningful way. Most were unsatisfied with the simplifiedrepresentation of actions having “no implementation” or “at least partialimplementation.”
We summarized Recovery Plan implementation as of 2002 based on informationprovided by the relevant management agencies. It was impossible to quantify thedegree of implementation, given the nature of the information provided. We revisedthis section to clarify the sources of information used, but more importantly weemphasize recommendations to better document and quantify implementation ofrecovery actions in the future, rather than drawing final conclusions about specificlevels of implementation based on incomplete and inadequate data.
Many reviewers commented that the road case study was a flawed comparison betweenearly route designations and more recent route inventories.

DTRPAC Report page 170
The road case study was revised to address concerns over comparisons across years.A more detailed explanation was provided on methods used to collect the data and afull exploration of the consequences of the differences was discussed. Additionalinformation provided by the West Mojave was included in the analysis.
A reviewer requested that historic (pre-1970s) land management information be comparedto tortoise population data and subsequently commented that the report did not address, orotherwise determine, the efficacy of recovery actions implemented to date. Anothercomment noted that tortoise populations have continued to decline after grazing had beeneliminated on most of the Mojave National Preserve and that no scientific basis has beengiven for vegetation thresholds for removing cattle.
We are unaware of any pre-1970 data on tortoise population trends, though we areaware of some of the threats that were on the landscape at that time. Both theworking draft and the final report repeatedly state that research needed to determinethe effectiveness of recovery actions has not been conducted to date. The reportspecifically recommends that research and monitoring on threats and managementeffectiveness be implemented in the future. However, threat effects may not alwaysbe connected in space and time, and a fundamental challenge in evaluatingresponses to management is overcoming the extended time scales required fortortoise demographic processes to result in measurable population changes.
We received comments indicating that significant data on URTD since 1994 must bereviewed and incorporated into the revised recovery plan and should guidemanagement/recovery actions set forth in the plan, including the simple steps of halting thespread, determining the cause of, and developing a cure for the disease.
We reviewed all desert tortoise disease studies, discussed the topic in detail, andprovided specific recommendations to the USFWS and a possible subsequentRecovery Team in the report. It is important to note that even though URTD hasbeen associated with tortoise population declines, the precise relationship betweenthe disease and demographic effects is poorly known; tortoises have likelymaintained a long-term coexistence with mycoplasmas; mycoplasmal infections arenot typically associated with high mortality in other species (in fact, low-virulencestrains may actually be beneficial to tortoise populations); and a cure or treatmentfor URTD in the wild is impossible at the population level. Management actions fordesert tortoise populations in the face of disease must not be conducted outside thecontext of other threats. In this way, the condition of tortoise populations can beimproved so that they can endure disease outbreaks.
A reviewer commented that the DTRPAC should acknowledge the lack of a disease strategyand recommend that the formal recovery team consider all strategies for dealing withdisease.
The report covers a variety of strategies and makes some much more specificrecommendations than were previously available.
A reviewer commented that disease case study de-emphasizes disease relative to otherthreats, including OHVs, toward which the draft report reflects a strong bias, and that the

DTRPAC Report page 171
draft report ignores correlations between disease incidence and tortoise population die-offs, leading to a misguided recovery effort.
The report clearly states that disease deserves attention on par with other importantthreats, especially given the observed correlations. We believe the report shows nobias against disease or any other threat. Nonetheless, there is overwhelmingevidence that OHV activities of the nature that occurs within open areas causesgreat damage to tortoise habitat. There is considerably less showing what level ofdamage is caused by lighter activities that are mostly constrained to designatedroutes. This information is included in Boarman (2002), which is cited by thereport, and its conclusions are not dependent on an assumption of a strong impact ofgrazing or OHV activities.
A reviewer commented that the draft report suggests that epidemiology is an academicexercise only and that it has no place in directing wildlife management policy. Thereviewer further commented that a statement in the draft report (that improvements in thescience surrounding disease as a threat to desert tortoises may not necessarily provide aneasy transition to management strategies) implies that more funding should be spent onresearch but not on on-the-ground management.
The reviewer misinterprets the report on this subject. The report simply states thatmany epidemiologists and conservation biologists believe that their role asscientists is to maintain objectivity in providing scientific information by distancingthemselves from the application of that information in policy decisions. The reportgoes on to say that designing effective management strategies will be a dauntingtask that should consider all the complexities of the disease threat, not a task thatshould be ignored in favor of additional research for research’s sake.
Several reviewers commented that the draft report’s discussion of cumulative andsynergistic threats to desert tortoises, and the associated threats network figure, has notbeen proven, is a “copout,” misdirects attention from disease, is otherwise too theoretical,or should have been replaced by a prioritized list of mortality factors and recoverymeasures.
The rationale for “synergistic causes of desert tortoise declines” is described indetail in the report and should not be interpreted as misdirecting attention fromdisease or any other specific threat. We agree that a multiple threats, “death of athousand cuts,” perspective is unsatisfying and difficult to accept. Unfortunately,we firmly believe that this is the situation we are forced to deal with. There aremany things affecting tortoise populations, their relative impacts are extremely hardto assess, and the populations are not at all likely to respond significantly if onlyone threat is dealt with. We agree with commentors that little data currently exist todocument specific interactions between threat factors, including relative magnitudesof effects, and we include important recommendations to correct this deficiency.With regard to a specific comment on potential interactions between tortoisenutrition and disease, we note that nutrition has well documented effects on growth,health, and fecundity of wildlife, including desert tortoises. We agree that data donot currently exist to document population-level effects of nutrition on disease andpopulation declines, and recommend that such studies be conducted.
DTRPAC Report page 172
A reviewer commented that there has not been an attempt to correlate air pollution fromthe Los Angeles Basin and the southern San Joaquin Valley, and potential associated heavymetal toxicants, with desert tortoise declines.
The links between air pollution and disease or tortoise health have been largelyunexplored. It is unknown if the levels of heavy metals found in tortoise tissuesrepresent toxic levels, nor if the spatial patterns are consistent with air pollutionbeing the source. Furthermore, there is essentially nothing that desert managers cando about air pollution, which mostly derives from the Los Angeles Basin.
A reviewer commented that “new information” with respect to feral dogs applies only toTwentynine Palms Marine Corps Base.
The only published data we know of is from Twentynine Palms, at the interfacebetween urban/rural and wild areas. There are observations by several biologists ofdogs causing mortality in other areas, in both the Mojave and Sonoran deserts,including areas with a low density of human residences. These observations havenot been quantified. We feel the evidence is sufficient to justify a need toimplement actions to reduce dog predation in urban/rural – wildland interfaces likethe area around the southern edge of Twentynine Palms. More work is required tofurther understand the threat.
We received a comment disputing the role of habitat fragmentation in tortoise declines oras a threat to tortoise populations.
Habitat fragmentation is an issue of scale and has been shown to cause populationdeclines in other reptiles (Fisher et al. 2002). Animals with large home ranges, suchas the desert tortoise, appear to be affected seriously by habitat fragmentation/loss,and habitat protection has not been effectively implemented in many areas withinthe tortoise’s range. Fragmentation can cause reduced movement and gene flowamong breeding populations. It does not directly cause mortality, however there aredocumented indirect effects, such as introduced exotic plants and increasedmortality on roads. von Seckendorff Hoff and Marlow (2002) demonstrated areduction in tortoise sign with proximity to roads and a relationship between thisreduction and the traffic level. Roads create linear “sinks” fragmenting tortoisepopulations. While it is intuitive that restricted genetic interchange caused by thisfragmentation may have long-term population consequences, we agree that studieshave not yet been conducted to determine the nature of those consequences. Section5 describes the need for studies evaluating the relative importance and interactionsof these effects.
Some reviewers noted geographic differences in particular threats or recommended that aregional assessment of threats be conducted, especially relative to the evolutionary historyof the tortoise and populations at the margins of the current range. Another reviewer notedthat available GIS data layers were not used in the analysis, other than in the road casestudy.
The report explicitly discusses threats in a general, non spatially-explicit context.We recognize the importance of the spatial differences in threats for the desert

DTRPAC Report page 173
tortoise and include this issue as a caveat to the threats network. However, we deferto the Recovery Team to more specifically address regional threats and mitigationunder the guidance of recommendations provided in the report. The evolutionaryhistory of the desert tortoise and the geologic history of the Mojave Desert havelittle bearing on the relevance of managing the tortoise under the current ESA.Desert tortoise adaptations (or exaptations sensu Morafka and Berry (2002)) ) domake them suitable for desert living, even at the margins of their current range.Populations at the edge of the species’ range can be different and important in manyways. We underscore our recommendation that the spatial component of threats andthreat mitigation be taken into account and that management actions be monitoredin a hypothesis-based approach to determine the effectiveness of the action.
The GIS data of which we are aware and had readily available are primarily fromthe West Mojave plan, and other sources will be invaluable in identifying specificareas where certain threats are likely to exist. Even though a comprehensiveanalysis of region-by-region threats was beyond the scope of our task, werecommend that, if a future recovery team is formed, they undertake such anexercise within the context of multiple threats in a network for each region.
A reviewer commented that more necropsies need to be performed on dead tortoises eachyear to better determine the cause of tortoise mortality.
We agree more work on causes of death (including, but not limited to necropsies)are critically needed to test and refine the hypothesis of multiple interacting threats.This recommendation is made in the report.
A reviewer commented that the draft report lacks an analysis of predation and predatorcontrol.
The report and Boarman (2003) include discussions of what is known aboutpredation. We agree that additional research is needed on predation and predatorcontrol (and its effectiveness in tortoise recovery). This recommendation is made inthe report.
A reviewer commented that the current difficulty in detecting trends in tortoise populationssuggests that the original decision to list the desert tortoise as Threatened under the ESAhad inadequate scientific support.
Subtle population trends are difficult to detect for most desert tortoise populationswith current methods. However, as the report states, dramatic population declinessuch as those observed before and since the listing of the tortoise are easy to detect.The GAO’s independent review of the listing decision found that the decision wasappropriate.
Several reviewers responded to a statement in the draft report that “all monitoring shouldbe hypothesis driven” by suggesting that this excluded basic monitoring to detectpopulation trends in the absence of an experimental study.
We continue to emphasize that monitoring needs to be conducted in anexperimental framework to determine the effectiveness of recovery actions,

DTRPAC Report page 174
however we have clarified the report to indicate that population trend-detectionmonitoring is still appropriate as long as estimation methodologies are sensitiveenough to detect the desired trend (e.g., reject a null hypothesis that the populationis decreasing at a particular rate).
Several reviewers commented on the difficulty of distance sampling to detect trends intortoise populations and that the method is a waste of time and should be abandoned orthat the report should better identify ways to improve the method.
The report documents several supplemental analyses that make the distance-sampling effort valuable, besides estimating tortoise density. We have revised thereport to provide a more complete review of the method as it has been implementedfor desert tortoises to date. The report also includes several recommendations forfuture research in improving the method for estimating density, as well as additionalinformation that could be gained from the effort.
Some reviewers questioned statements in the report that suggested that some permanentstudy plots should be abandoned.
We recognize, and the report documents, value in permanent study plot data.However, given limited resources and a list of documented problems associatedwith the permanent study plots, the report recommends that plots that do not serveto answer specific research or management questions be discontinued.
A reviewer commented that an observation in the draft report (that the current monitoringprogram has expended virtually all funds on field collection of data and little on qualitycontrol or data management) ignores the reality that funding is limited and that in realitythe choice comes down to collecting as much data as possible or collecting insufficientdata and managing them expensively.
We recognize the need to obtain sufficient funding and emphasize efforts to do soin the report. However, the utility of data collected under any funding level isseverely compromised if sufficient effort is not also directed to quality control anddata management. Collecting “sufficient” data and managing them poorly is just asmuch a waste of money as collecting insufficient data and managing themexpensively, because resources are not available to determine whether the datacollected really are “sufficient.”
One comment suggested that revision of the Recovery Plan carefully consider and analyzethe importance of soils and ecological site descriptions to delineate desert tortoise habitat.
We agree that a scientifically sound analysis should be conducted to determinewhich factors negatively impact populations of the desert tortoise. The reportprovides recommendations to accomplish this task, including recommendations forhabitat monitoring at different scales. A possible future recovery team shouldconsider soils and other ecological aspects of tortoise habitat in this monitoringeffort.

DTRPAC Report page 175
We received a comment suggesting that data on tortoise reproduction and disease be usedto reevaluate the 1.0 lambda originally calculated in the 1994 Recovery Plan to determinea more accurate recovery goal.
As noted in the report, most recovery actions for threatened and endangered speciesare designed to stabilize population size (lambda at 1.0 across generations) wherepopulation size is sufficient to safeguard against extinction and to increasepopulation size (lamba > 1.0) where population size is small enough to threatenextinction. By definition, lambas < 1.0 result in continued population decline. Whilewe make no specific recommendations regarding modifying recovery criteria toreflect increased population lambas, we defer to a possible future Recovery Team tomake a final determination. Nevertheless, we agree that disease and other relevantfactors must be evaluated relative to population growth rates.
Many reviewers commented on the lack of discussion on headstarting and translocation aspotential recovery tools for the tortoise.
The final report now includes a section on this topic.
Several reviewers provided comments pertaining to topics such as public outreach, theneed for an implementation schedule and costs of implementation, the need to reviewexisting DWMAs, and prioritization of research.
These comments are outside the scope of the DTRPAC’s charge and have beenreferred to the USFWS to be addressed by a subsequent Recovery Team, if one isnecessary.

DTRPAC Report page 176
“LLeett sscciieennccee nneeiitthheerr bbee aa ccrroowwnn ttoo ppuutt pprroouuddllyy oonn yyoouurr hheeaadd nnoorr aann aaxxeettoo cchhoopp wwoooodd..”
Talmud

DTRPAC Report page 177
Appendix B. DTRPAC Meeting minutes
Desert Tortoise Recovery Plan Assessment Committee MeetingFriday, April 11, 2003 9:30am – 5:00pmCalifornia Academy of Sciences, Goethe Room
Greeting and charge to the committee
Bob Williams, Field Supervisor of the Nevada Field Station of the Fish and Wildlife Service(USFWS), presented the Desert Tortoise Recovery Plan Assessment Committee (DTRPAC) with acharge to use the best available scientific information to review the 1994 Recovery Plan.
After this review, the team will provide a report with recommendations as to where the 1994 planshould be revised (if necessary) and provide any new relevant data useful to prepare the revision.These recommendations will be reviewed by Management Oversight Group (MOG), the ClarkCounty MSHCP, the Washington County MSHCP, and the Desert Management Group (DMG).After the DTRPAC has submitted their report, USFWS will form a recovery team to draft a newrecovery plan. Therefore, this assessment is a first and important step to determine revisions andfuture direction of desert tortoise recovery.
USFWS will act as an interface between the team and the public. The need for stakeholderinvolvement in this process was highlighted. DMG representatives attended the DTRPAC meetinglargely to reflect the interests of stakeholder groups in the process. They may attend future meetingsto represent stakeholders participation and to facilitate an environment of openness and objectivity.
It was noted that this assessment committee is not a recovery team. This assessment is only the firstpart of two-step process. The team will be working as peer reviewers of the 1994 Recovery Plan inlight of contemporary knowledge. The second step in the recovery plan revision process will be toassemble a recovery team consisting of scientists, managers, and stakeholders who will complete arevision of the plan.
A two-page summary of the current process will be provided on the on DMG website which willinclude the DTRPAC mission, scheduling of future meetings, briefings, and biographies ofcommittee members.
Process of evaluation
A suggestion was made that there should be at the minimum, four or five more DTRPAC two-daymeetings before a draft report deadline in November. The next deadline will be for a completedreport to be delivered to the MOG by January for review. This committee does not include all theexpertise that will be needed to complete this assessment. Therefore, ad hoc experts will be asked tobrief the committee on topics where additional scientific expertise would be valuable.
Open meetings
All future DTRPAC meetings should be open to representatives of interested stakeholders whowould like to observe. It was stated that by inviting representative stakeholders (one or twoindividuals) to observe and comment in their allotted time, they would then be able to conveyDTRPAC proceedings to constituents. USFWS will invite stakeholders to future meetings, and

DTRPAC Report page 178
provide minutes from each meeting through the DMG website. Meeting agendas, including invitedspeakers for each meeting will be announced in advance.
One opportunity for public involvement will be an open call for requests for additional topics to becovered at DTRPAC meetings. A preliminary list of what the team plans to include in theassessment will be provided. If there is a good scientific basis, these additional topics will beincluded at the appropriate time during discussions.
Invitations to stakeholder scientists
If a stakeholder feels as though the team has missed information, they are invited to provide ascientist to present their issue as a briefing to the team. DTRPAC meetings will be topic oriented,so the scientist will be speaking about the specified topic of the meeting, and (s)he must bringreferences to publications that can be distributed to the team members prior to the meeting.
Periodic briefings to DMG and MOG
Briefings of the DTRPAC progress to the MOG, Clark County, Washington County, and the DMGwill be completely open to the public.
Location of meetings
To provide convenience for local team participants, meetings will be sited in different locations.Possible locations include Las Vegas, Palm Springs, Reno, and San Francisco again. Depending onthe discussion topics, field trips may be required.
Advanced materials for each topic
Materials for each meeting will be available via email, on a website, and in print for meetingparticipants. Materials for each meeting will be determined at the previous meeting.
Writing assignments
At the end of each topic discussion, different sections of the report will have to be written. Teammembers will alternate between writing and reviewing sections.
Discussion of proposed six segments of assessment (tentative list)
Following a discussion on the process of future DTRPAC meetings, the team began discussing andprioritizing, the tentative list of six proposed segments of the recovery plan assessment. Thispreliminary list, which will be subject to change following public comment and further teamdiscussion, is attached at the end of the minutes.
1. Delisting criteriaDelisting criteria are found on the first page of recovery plan, and are goals that are critical to therecovery of the desert tortoise. A discussion of these criteria has three parts:
a) Are the current Recovery Units biologically correct?b) Is the relationship between Recovery Units and delisting criteria appropriate?c) Are delisting criteria able to be implemented and sufficient?

DTRPAC Report page 179
It was suggested that the Recovery Units of the 1994 plan should be revisited and modernized inlight of the current USFWS definition of a distinct population segments (DPS). Currently, therecovery plan acknowledges six recovery units based upon genetic, morphological, behavioral,ecological, and geographic differences. Using the USFWS DPS definition, boundaries should berevisited, along with the number of DPSs, which may change with new data and DPS definitioncriteria.
The clarification was provided that the Mojave desert tortoise was listed range wide, before theUSFWS definition of DPS was established. Therefore, the USFWS currently can only delist theentire Mojave population. Legally, it is not possible to delist recovery units. DPSs are usuallydefined in the listing action, which would allow delisting by DPS. If the team finds, in accordancewith contemporary USFWS policy, that distinct population segments need to be individually listedand there is adequate evidence that this is warranted, then the DTRPAC should attempt to provideinformation on redefining segment boundaries, characterize what data are missing for DPSdesignation, and how many specific DPSs are justified. If the species warrants DPS listings, theteam should provide as much information as possible to the future Recovery Team as they makechanges to the Recovery Plan.
Meeting participants concurred that the team should review current literature and current recoveryunits and give basis for change in boundary and number of units. If the team comes to consensus thatthe tortoise populations should be distinguished as DPSs, then there should be a recommendation onhow many units should be designated. There was also a suggestion that the team should operate underthe (potentially “null”) hypothesis that there is only one large population. The preponderance ofevidence will have to prove that the populations have fundamental differences in life historystrategies with conservation consequences, if they are considered the same. It was noted that theassessment committee also must consider the consequences of not breaking down tortoisepopulations into DPSs, if it will be a downfall, and why.
Different threats, niches, habitat, behavior, morphology, genetics, and ecology are possiblecharacteristics defining DPSs. As a result, different management strategies may be necessary foreach DPS. The USFWS policy lists the following as DPS criteria: discreteness, significance, andconservation relevant to listing factors. The committee must evaluate all these criteria.
What information is needed for this topic?
Genetics and morphology data
ACTION: Dr. Morafka will take the lead on this issue and compile and distribute relevant literatureon DPSs. The DTRPAC will discuss differences in definitions between the Recovery Plan andcurrent definitions in the literature, and look at extent of where DPS boundaries need to bereconsidered.
Demographic status – Committee members should identify information gaps. The committeewould like any data that suggests why populations are declining in certain areas, and resultsfrom any new demographic studies that occurred after the 1994 Recovery Plan.
o Types of data needed (mean as well as within and between site variances):size distributionplot densitiessex ratioshealth statusfecundity data/reproduction

DTRPAC Report page 180
o How much?All the data from as many populations as possible is needed, so that team canevaluate data, and recommendations can be based on best data available.The DTRPAC is also interested in evidence of decline and from study plots,including information on placement of plots, number of visits, droughtconditions during each year of study, and evidence of mortality includingshells.
o End product:The team would like a map of total tortoise distribution with indicators ofpopulation status (arrows up/down/stable), and the evidence that led to eachjudgment.
ACTION: Mr. Medica will be the lead on determining what status information is available, andcompiling permit reports from USFWS offices. Mr. Murray will provide study plot informationfrom Arizona, which will be scanned in electronically by Dr. Heaton.
NOTE: All electronic information should be sent to Ken Nussear (UNR). Dr. Heaton will aid in thecollection of electronic data and scanning.
ACTION: Dr. Heaton will gather total live/carcass data, burrow data, lumped sign data, linedistances sampling data, and encounter rates, and will incorporate them into a map; This type ofmap may be helpful with area occupied by tortoises (presence/absence) and threats.
Briefings:The DTRPAC will require a briefing on all topics related to DPS units. Dr. Morafka willcollaborate with others to provide a briefing on distinctness. Other possible invited speakers wouldbe Taylor Edwards, Dr. Kristin Berry, and Dr. Dave Germano.
The briefing on demographic status should include status across the Mojave population’s range. Dr.Berry will be asked by Dr. Lovich and USFWS to provide a complete review of California studyplots, particularly those that have had long-term monitoring, and any new studies. Mr. Medica willprovide equivalent information for Nevada. Mr. Murray will report on Arizona and Utah.
ACTION: Dr. Tracy will draft guidelines for what is needed by those giving briefs. He will thenemail the draft to entire team for comments.
The following items need to be discussed and integrated before the DTRPAC can make anyrecommendations regarding distinct population segments.
Genetic, morphological, and biological differences among populationsRange wide demographic status of tortoise populations and threatsDetermine the extent to which the results from the assessment differ from 1994 recoveryplan
As a result of the extensive amount of information needed to discuss DPSs, and the amount of timeto prepare data, these topics will be broken up over several meetings.
2. ThreatsThe topic of threats to tortoise populations includes three components: definition of threats, status,and monitoring. Mojave populations of the desert tortoise population appear to be in a delicatebalance. This may cause difficulty in ranking threats, especially when any number of combinationsof threats may be the culprit of population declines. The following are viewed as threats to the

DTRPAC Report page 181
desert tortoise: ravens, vehicle access, feral dogs, and grazing. The DTRPAC will discuss thesethreats separately, the interrelation of threats and groups of cumulative threats, as well as any newthreats. Currently, there is a controversy over whether disease should be considered a threat or ismanifested as an “exacerbating condition”, not a cause – or precipitant - of population declines. Asa result, disease will be considered separately from threats.
Disease updateThe DTRPAC would like an update on ELISA testing and would like to discuss the followingquestions.
Is disease natural or an invasive?If natural and largely existing in a chronic state, what exacerbates it into an acute state?If an animal is tested, where is it located? (wild vs. pet populations)
Regional Status on a by-threat basisDr. Bill Boarman and Dr. Heaton will be asked to provide a brief on missing information in themost current threats document and where are threats located.
West Nile Virus question and impactDr. Delehanty will assemble a short report on changes in the West Nile Virus and the possiblethreats to ravens in the Mojave Desert.
3. Monitoring:USFWS has identified (a) species populations, (b) habitat changes, and (c) threats as monitoringpriorities. Monitoring issues will be covered during appropriate topic discussions.
HabitatNew information on habitat has become available since the 1994 recovery plan. The DTRPACwould like a clear picture of how tortoise habitat has changed. This would include information onthe impacts of fire on tortoise habitat with the disappearance of shrubs. Estimations of habitat losswould also be helpful. Utah State University and the Desert Research Institute collaborated on adata set that provided estimations of development from 1980, 1990, and future projections. Thisdata set may provide good regional indications by providing population information layered on topof urbanization.
4. Remaining items to be coveredHabitat Conservation Plans (HCPs) – The team should be assigned to review that section ofrecovery plan and determine if it is on target. Members would like an update section onwhich HCPs are on the ground and the status of tortoise management.Research needs and priorities/delisting criteria
Scheduling of future meetings:
(15% of each meeting will be devoted to planning the next meeting.)
Meeting 1:May 15-16, Palm Springs, CA
Day 1:o First session on distinct population segment issues: biology, genetics, and
morphologyo No invited speakers for day 1

DTRPAC Report page 182
Day 2:o Disease and associated topics (euthanasia, ELISA testing, and other management
issues)o Due to a conflict with a major microbiology conference, it is not possible to be
briefed on disease at the next meeting. Thus, Dr. Boarman will brief us on threats.o Prepare for monitoring of threats portion of Meeting 3
Meeting 2:June 9-10, San Francisco, CA
Both days will be spent on the regional status and monitoring of threats. THE DTPRAC will ask thequestion, “Does the original recovery plan adequately cover these issues and is there newinformation that would change views?” Due to the microbiology conference conflict, we will inviteM. Brown, D. Brown, D. Rostal, and J. Heaton to present a briefing at this meeting instead of thePalm Springs meeting.
Meeting 3:July 31-Aug 1, Tucson, AZ
This meeting will focus on the demographic status of tortoise populations and habitat. Dr. KristinBerry, Phil Medica, and Roy Murray will be asked to present demography data for CA, NV, AZ,and NM. A discussion of monitoring will begin at this meeting.
Meeting participants at April Meeting
Roy Averill-Murray, Arizona Game and FishDave Delehanty, Idaho State UniversityJill Heaton, University of RedlandsJeff Lovich, USGS/BRDEarl McCoy, University of South FloridaPhil Medica, USFWSDave Morafka, California Academy of SciencesKen Nussear, University of Nevada, RenoDick Tracy, University of Nevada, RenoBob Williams, USFWSJohn Hamill, DMGBridgette Hagerty, UNRClarence Everly, DMG
For Reference:
Possible areas of discussion1. Delisting criteria (do we need changes from those prescribed in the DTRP?)/ need to list by
“Distinct Population Segment” (DPS)?/ different criteria for different DPSs? This topic is listedfirst because, even though the 1994 recovery plan suggested treating each recovery unitseparately, the USFWS has not pursued legally treating each recovery unit separately. Insofar asdifferences among recovery units have become greater with time (some populations havingdeclined to disastrous levels while others could be stable), and insofar as this is a topic that mightrequire USFWS action before the recovery plan is revised, we need to discuss this topic.
2. Habitat conservation planning including critical habitat designation, threats, and delistingcriteria. This allows us to address the different needs in different recovery units.

DTRPAC Report page 183
3. Updates on regional status of (a) population threats, (b) threats, (c) habitats. This forms thebasis for most other topics.
4. Monitoring of (a) tortoises, (b) threats to tortoise populations, and (c) changes in status ofhabitats. The prescriptions for monitoring in the 1994 recovery plan were sometimes naïve inlight of today’s knowledge. This is a terrifically important, and sometimes controversial, topic.
5. Details of specific threats and their mitigations with special attention to interactions amongindividual threats. This deals with the very controversial topics of the basis for listing andrecovery.
6. Research needs and priorities in the next decade. Assessment of research proposed in 1994DTRP and what is needed next. Most of what was recommended in 1994 has not beenimplemented. We need to reassess old and new prescriptions for science and research.

DTRPAC Report page 184
Desert Tortoise Recovery Plan Assessment Committee MeetingFriday, May 15-16, 2003Wyndham Hotel, Palm Springs, CA
Announcements and Introductions
Bob Williams (USFWS) spoke about changes made in stakeholder involvement after the April 11th
meeting. In order to implement the recovery plan consistent with the GAO report, the U.S. Fish andWildlife Service (FWS) is working on a Memorandum of Understanding (MOU) amongDepartment of Interior agencies and the states. A memo to the Management Oversight Group(MOG) and Desert Management Group (DMG) outlined a two-layer structure for stakeholderinvolvement in this process. The first layer consists of state and federal agencies, which wouldnominate representatives to observe the scientific expert panel. The second layer consists ofrepresentative stakeholders. This structure will be used to develop an open process for thosecollecting information and will aid in data gathering. The membership of the Desert TortoiseRecovery Plan Assessment Committee (DTRPAC) will not change.
Presentation on distinct population segments issues (biology, genetics, morphology), led by Dr.David Morafka
A synopsis was given of how distinct population segments (DPSs) are incorporated into the 1994recovery plan, as well as the language of the 1996 USFWS DPS policy. The terms DPS and ESU(evolutionary significant unit) were synonymous at the time the 1994 recovery plan was written.These were equated as a recovery unit in the 1994 plan, and all terms were used interchangeably.The USFWS has developed a legal definition for the DPS. The DPS designation is based on threecriteria, and the term is to be used “sparingly” and only when warranted. The three criteria are: 1)discreteness, 2) significance (if criteria 1 is met, and 3) conservation status in relation to the Act’sstandards for listing.
The term “sparingly” is only discussed in terms of listing, not delisting. Therefore, if the DTRAPCrecommends that the species warrants DPS designations, then implementation of delisting eachsegment may be possible. The other alternative would require relisting the desert tortoise, makingredefining using DPS units more difficult. By writing delisting criteria in the recovery plan usingUSFWS DPS criteria, the DTRPAC could accomplish the same goals and with less difficulty.There are many examples where this is already occurring, such with the gray wolf. The USFWSrecommendation to the DTRPAC is to make recommendations based on science. The USFWS willuse those recommendations for appropriate actions.
The DTRPAC has three tasks in relation to identifying DPSs: 1) make the best recommendationwith current available information for the number of DPS units (if any) and the boundaries of thoseunits, 2) determine gaps in information, and 3) produce a new protocol for how future recoveryteams and assessment committees should handle DPS designations. In all discussions, the DTRPACshould be trying to reject the null hypothesis that there is no difference among units and should theterm DPS “sparingly”.
A summary was provided of current information on the status of ESU/DPS (see Pennock andDimmick 1997). Previous genetic work on the desert tortoise has used mitochondrial DNA andallozyme markers. Currently, there is no uniform command for geneticists to perform tortoisestudies using equivalent sample sizes, genetic markers, or study areas. As a result, uniform

DTRPAC Report page 185
sampling has not occurred range-wide for the Mojave population. Data are incomplete and haveinherent biases resulting from low scientific rigor.
To designate a DPS, all three elements must be considered and satisfied in some way, but notnecessarily equally.
1) Discreteness: Genetics is a conservative place to start to look for evidence of populationdifferences. Morphology may be different across the Mojave population, but can be subjectto dietary and other environmental influences, as well as genetics. Behavioral differencesare similar to morphological differences in that it may not be solely a function of genetics.
2) Significance: The term significance can be taken very broadly, and unusual circumstancesand ecological niches may be critical to DPS designations. Peripheral populations maywarrant protection because of its distinct ecosystem; however, one must also take intoaccount the probability of persistence.
Discussion on distinct population segments (DPS)
Currently the recovery plan designates six recovery units: Upper Virgin River, NortheasternMojave, Eastern Mojave, Northern Colorado, Eastern Colorado, and Western Mojave.
There was discussion concerning the table below and how the terms in the table relate back to DPScriteria. The table was constructed using published and available evidence.
Table summarizing the criteria used to define Distinctive Population Segments. The criteria areranked as poor or negative evidence (—), absent or ambiguous evidence (0), positive evidence (+),or highest priority. The data are taken from The Desert Tortoise (Mojave Population) RecoveryPlan (Plan) (1994) and Britten et al. (1997). Possible changes to the table are highlighted in red.Initially the Conservation Need/Status columns were represented by one column, which notes thatthere is positive evidence for greatest need for conservation relative to the status of the unit.
DPS Discreteness(I)
EcologicalSignificance (II) (bemore specific)
GeographicalSignificance(II)
GeneticSignificance(II)
ConservationNeed (III)
ConservationStatus/existingregulatorymechanisms(III) (threats,etc)
Northern Colorado — 0 + ? 0Eastern Colorado — + + — ++Upper Virgin River + + + + ++Eastern Mojave 0 0 0 — +NortheasternMojave
0 — + 0/+1 +
Western Mojave 0 + + — ++1 Significant genetic units are embedded within the DPS.
There was a discussion about additions to the table, including discreteness being separated into itscomponent parts (behavior, morphology, ecology) and using the new DPS hypotheses based ongenetics by adding a North Las Vegas unit. The conservation status column should includeconsideration of threats, which are important for determining the status (threatened/endangered) ofeach DPS.

DTRPAC Report page 186
The USFWS DPS Policy determines the order of discussion for designating DPSs. First the unitmust be discrete. Once discreteness is determined, than significance must be, followed byconservation status. The DTRPAC came to consensus to use genetics used as first cut fordetermining DPS units, followed by the incorporation of other factors including morphology,ecology, and behavior.
Maps showing the current situation and proposed changes were used to aid in the discussion. Asuggestion for the DTRPAC to provide more detailed recommendations for the boundaries for DPSunits, etc. was given because of the ability to use current GIS technology.
The DTRPAC must resolve 1) if there is a legitimate basis for DPSs in the Mojave population, 2) iffour conservative units are well-justified, 3) what data, in addition to genetics, are needed to makeDPS designations, and 4) how can interested scientists improve on status quo.
The DTRPAC suggested that the Upper Virgin River unit is well justified because it hasdiscreteness in genetics, behavior, morphology, and habitat. In addition, the WesternMojave/Eastern Colorado units are distinct from the other units. The Northeastern Mojave unitrequires resolution and revision. Finally, the Northern Colorado unit has poor justification to bedesignated different from the Western Mojave.
In Southern Nevada, there is a wealth of local amphibian populations due to historical watercomplexity that has only recently been simplified. This suggests that it is a good place to look fordesert tortoise distinctness. Britten et al. (1997) highlights complexity in S. Nevada, but not in auniform way. Since the recovery plan there have been studies that present information on thedivision of recovery units in the Mojave population. Britten et al. (1997) use shell morphology,allozyme data, mtDNA data at a fine resolution and designate Amargosa, Piute, North Las Vegas,and South Las Vegas as separate areas. Lamb (1994) suggests that there are genetically distinctpopulations in NV (North Las Vegas/South Las Vegas), and in the northern part of the tortoiserange.
A suggestion was made to designate Coyote Springs/Mormon Mesa/ Gold Butte (North Las Vegas)as one DPS. Further genetics are needed to define the Gold Butte area. There would be another unit,South Las Vegas, and perhaps more than one (Piute Valley, Ivanpah, Amargosa). Historic land datavaguely supports this idea, but it is not an overarching cause. These DPS designations would be aworking hypothesis. In order to provide more support for this hypothesis, it will be necessary toexpand on Britten et al. (1997) and incorporate land formation data.
Allozyme and mtDNA data suggest that most of California is strikingly homogeneous for manywarm desert species. This may suggest that there was an over subdivision of recovery units in CA.The Colorado Desert has quite different vegetation from Western Mojave (Vasak 1984); however,there is little genetic difference. The differences could be local environmental adaptations todifferent environments, such as differences in rainfall.
Some members of the committee continue to stress that threats are paramount to recovery.Although the DTRPAC has no problem with determining distinctness among the population, somemembers caution against excessively fine scale phylogenies.
The DTRPAC came to an initial consensus on DPS designations, based on genetics using thecurrent available data. These DPS hypotheses are subject to revision with new genetic, ecological,behavioral data. The genetic discreteness hypothesis is that there are four DPS units: Upper Virgin

DTRPAC Report page 187
River, North Las Vegas, Western Mojave/Colorado Desert/Piute Valley (subject to revision), andAmargosa/Eastern Mojave (Ivanpah).
Limitations and Deficits in DPS designations:1) Program of uniform sampling (20-25 samples per local populations using all genetic markers,including microsatellite information range wide)2) Behavioral: a) burrow/microhabitat selection b) hibernacula3) Ontogentic series characterizing morphological differences4) Standardized morphological analysis5) Behavioral differences among populations that affect gene flow6) Geographically describe problematic areas (Southern Nevada, Colorado divisions)
Position paper recommendations:1.Add a geneticist to the full Recovery Team to revise the 1994 plan.2. Genetic core units need to be assessed using both nuclear and mitochondrial genes (Berry et al.,2002).3. The genetic boundaries and gene flow between units needs to be critically examined.4. Once these data are available, ecological, morphological and behavioral attributes can beassigned to each of these genetic units.5. Finally, CHUs within each DPS should be geographically revised delineated to maximize theirconservation potential in consultation with local resource administrators.
The initial DPS hypotheses do not include ecological differences and boundaries. A suggestion wasmade to study behavior that is essential to gene flow, thus connecting genetics and behavior.Information would include fecundity, clutch frequency and size, mating system, sperm storage,connectivity, barrier crossing, and dispersal patterns for juveniles and adults. Another suggestionwas that the DTRPAC should specify the need for or give specific objective ways to determine if abehavior or morphology is different among DPS units. This would requite targeted research.
ACTION: Dr. Morafka will revise the position paper in light of today’s discussion, as well as addrecommendations for future groups revising DPS units. Dr. McCoy will write an addition to thepaper discussing problems with objectivity and the research necessary to overcome thesedifficulties. Dr. Delehanty will write an addition discussing the conservation biology point of view.
Briefing on threats to Mojave desert tortoise population, Dr. Bill Boarman
The DTRPAC will examine if there are significant changes that need to be made in a subsequentrecovery plan in relation to threats. This possibly includes justification for the list of threats in the1994 recovery plan, and suggesting data collection that would allow for the prioritization of threats.The 1994 recovery plan does not show the complexity of threats or potential interactions amongthreats.
Dr. Boarman was charged to evaluate all current knowledge on threats to desert tortoises for theWest Mojave Planning Team. His 2002 report includes a literature search, an evaluation of sources,and a discussion on threats to desert tortoises. Ranking of threats and spatial/temporal informationis not included in the report. Some sources used to support threats were weak (based on lack ofdata). Since 1994, more data have become available, which should be identified in the DTRPACreport.

DTRPAC Report page 188
Discussion of threats:
DTRPAC’s report should recommend that the recovery team use Dr. Boarman’s 2002 literaturereview and Dr. Heaton’s work to update the recovery plan. For example, appendix D could berevised using Dr. Boarman’s literature review.
Dr. Boarman highlighted new or increasing threats. The 1994 Recovery Plan may haveunderestimated the threat of feral dogs to desert tortoises. As a result of less space between desertfragments, there are regional changes in canids as a threat. Anecdotal information suggests anincrease in feral dog populations, corresponding with an increase in human disturbance. Fire is alsoan increasing threat. The spatial and temporal distribution of fire should be examined, as roads maybe causing the increase.
In addition, Dr. Boarman noted threats that have diminished since the 1994 Recovery Plan. Directimpacts of livestock grazing have been eliminated due to action, except in certain areas in the WestMojave. Collecting by humans may no longer be a widespread population threat. Law enforcementdata would be helpful to determine if collection is a localized problem. There is a need to compilepoaching information to refine extent of the threat.
The major inadequacy of the original plan was lack of discussion on synergies and interactionsamong threats. Instead a list of threats was provided. One of the substantial overall threats is thehuman access or road access to the desert. This threat incorporates components of the exotics, fire,poaching, and ORV threats. The reduction of cumulative effects as supposed to individual threatswould be more effective. Cumulative threats were not emphasized in the 1994 recovery plan.Quantifying threat interactions experimentally will be the most difficult, expensive, and valuable.Designating research areas for science (experiments) to occur and recommending experimentationthat has management payoff should be a priority.
A suggestion was made to use modeling of threats and their effects on tortoise population. Acurrent update of the model could be made using current available data (i.e. new raven predationdata). The model could be used to evaluate relative effects of threats compared to each other (i.e.sensitivity analysis) in certain areas of the Mojave. Probability maps, predicting threats in certainareas of the desert in conjunction with modeling effects on tortoise populations would help assesspotential for problems. In addition, an updated graph of roads vs. tortoise deaths showing ananalysis on a spatial and temporal scale (roads, fires, exotics) to compare to other non-humancaused threats. In order to rank threats, some form of commonality is needed. The DTRPAC shouldhighlight overarching problems and what needs to be done on a more localized basis.
ACTION: Dr. Tracy and Dr. McCoy will work on a modeling effort to assess the effects of ravenson tortoise populations.
ACTION: NDEP historical data has not been available on line. Clarence Everly has been taskedwith providing DTRPAC with data that has been previously unavailable (aerial photos).
ACTION: The desert is a place of life that has vital components (desert blooms, seasonality) easilydamaged by human contact. Desertification of the desert can wipe out species that are typicallydescribed as “desert species.” Dr. Morafka will write a paragraph explaining desert complexity.

DTRPAC Report page 189
Preparation for future DTRPAC meetings
June 9-10 Meeting in San Francisco, CA:June 9 – Disease
Invited guests: Dr. Mary Brown, Dr. Dave Rostal, Dr. Elliot JacobsonJune 10 – Wrap up threats; Presentation on threats by Dr. Heaton
Dr. Elliot Jacobson will be invited to speak about interaction between URTD and herpes virus. Theworkbook from the Disease workshop should be available for distribution at this meeting. Thedisease discussion could be one day, and the team should have focused questions that deal with therecovery plan. The DTRPAC should focus on issues not discussed in the 1994 recovery plan suchas new diseases (e.g. herpes), alternative hypotheses of sources, synergisms, and types of stresses.In order to write a report about the 1994 recovery plan with respect to new information on disease,the DTRPAC will ask penetrating questions to the invited speakers.
ACTION: Dr. Morafka will contact Dr. Jacobson about attending the June meeting.
A suggestion was made to invite an outside epidemiologist to interact with Mycoplasm experts inthe tortoise field. DTRPAC would like to determine data are necessary to make further progress inthe tortoise disease. The epidemiologist will hopefully be able to determine if the current pattern ofoutbreak and latency been documented elsewhere. In addition, the epidemiologist will be asked toobjectively evaluate current Mycoplasm hypotheses, which would launch into later discussion.
ACTION: Dr. Tracy will find an outside epidemiologist to attend the disease portion of themeeting. Dr. McCoy will send Dr. Tracy a list of references for epidemiologists.
There was concern raised about ability to cover all threats, including a comparative analysis andpotential other threats. However, identified threats are already included in the 1994 Plan.Cumulative effects and interactions among threats are lacking. A suggestion was made to identifythreats and how they affect life history strategies.A Threats table should include basic information, management, monitoring, and mitigation, in orderto provide as much information as possible for the next recovery team.
ACTION: Dr. Heaton will put together a first draft of a threats matrix that will accompany the DPStable with respect to former recovery units (and/or new DPS).Dr. Heaton is also working on a spatial population status map.
July 31-Aug 1 Meeting: This meeting has been moved to Truckee, CA.July 31 – Demography/Population statusAug 1 – Threats wrap up
ACTION: Dr. Tracy will invite Dr. Dan Brown to give briefing on disease phylogeny in theafternoon July 31 or morning Aug 1.
There should be a gap analysis of demography data, as well as a discussion of ties between tortoisedeclines and threats status
ACTION: Roy Murray has all materials for UT and AZ. Data in spreadsheet format will be givento Ken Nussear and Dr. Heaton by May 23.

DTRPAC Report page 190
September 4-5 Meeting in Monterey, CA:Topics to be discussed:
Monitoring / Begin delisting criteria
ACTION: Dr. Morafka will call Asilomar about accommodations. The Double Tree or CasaMunras Inn are other choices for accommodations. The Monterey Aquarium is another choice for ameeting place.
October 2-3 in Tuscon, AZ:
Topics to be discussed:Finish delisting criteriaResearch NeedsConservation Planning
Invite: Mary Cablk (DRI)
ACTION: Dr. Heaton will invite Mary Cablk. The Desert Research Institute has range-widechange detection analysis data. Mary will give a presentation on hyperspectral data.
The issue of tortoise habitat will be covered during the conservation planning discussion. Asuggestion was made to review critical habitat designations and determine if they are properlydesignated. This could be determined by performing a comparative analysis of demographic data incritical habitat vs. outside critical habitat. Reserve design could also be revisited in a similarmanner. Management actions of other species that would affect tortoises will also be covered inconservation planning.
ACTION: Roy Murray will call about meeting accommodations at Tumamac Hill or the USGSroom at the University of AZ. Bridgette will call the Inn Suites.
November 6-7 in Las Vegas, NV:Grand Wrap Up and final DPS designation discussion
Revisit discussion of DPS and desert tortoise threats
By changing the number of DPS units, the number of needed management reserves may change. Itis important to ensure that there is continuity in protection throughout the listed range, despitewhere boundaries are changed.
An argument was made for breaking up Western Mojave based on other factors besides geneticfactors. There is a special conglomeration of threats in the West Mojave, as well as ecologicaldifferences in the Colorado Desert (i.e. major climatic difference, 116 degrees longitude is asegregation point based on meteorological data in the Mojave). There is also corresponding data ondesert flora and rainfall from Mojave botanists. A good reference for this is the June Lathrup (ed.)book on California Deserts.
ACTION: Dr. Heaton will put together maps for each situation to show further delineation of DPSunits after genetics using ecological (climate) and behavioral factors. Tortoise habitat willEXCLUDE everything above a certain elevation (5, 000 ft) to better show the available habitat, drylakebeds, urban areas, and highways.

DTRPAC Report page 191
Determination of writing assignments:
The DTRPAC began to assign sections of the final report by identifying products that would resultfor DTRPAC meetings. A rough draft of a Table of Contents is attached at the end of thisdocument. There was a discussion on what topics should be included in the report and in whatorder. Additionally, products were discussed from the past meeting and this meeting. The sectionon research needs should be a portion of each of the writing assignments for each section, not onesection at the end of the report. An introduction to the report will include a scientific overview ofwhat is known about the desert tortoise comparing prior to the 1994 Plan to present, showingsignificant advances in the state of general knowledge. DTRPAC products will include an updatedGIS range map for Desert Tortoise and a comprehensive bibliographic reference for all deserttortoise literature, including references published since the 1994 Plan.
ACTION: Dr. Lovich will produce a rough draft of an introduction and distribute to the DTRPACfor review.
Meeting participants:Roy Averill-Murray, Arizona Game and FishDave Delehanty, Idaho State UniversityJill Heaton, University of RedlandsJeff Lovich, USGS/BRDEarl McCoy, University of South FloridaDave Morafka, California Academy of SciencesKen Nussear, University of Nevada, RenoDick Tracy, University of Nevada, RenoBob Williams, USFWSBridgette Hagerty, University of Nevada, RenoBecky Jones, CA Dept of Fish and GameClarence Everly, DMG

DTRPAC Report page 192
Desert Tortoise Recovery Plan Assessment Committee MeetingJune 9-10, 2003Redwood Room, California Academy of Sciences, San Francisco, CA
Discussion on tortoise disease with panel of guest speakers, Dr. Mary Brown, Dr. ElliottJacobson, Dr. David Rostal, and Dr. David Thawley
The following questions were asked of guest speakers prior to the meeting:1) What is the existing research and what future research is needed bearing on the alternative
hypotheses concerning URTD? The alternative hypotheses are 1) Mycoplasmosis is a noveldisease to natural populations of desert tortoise, or 2) Mycoplasma has persisted in wildpopulations of desert tortoise for a long time, occasionally breaking to acute status with somemortality.
2) What existing research/future research bears on whether populations of desert tortoise (notindividuals) are negatively affected by URTD?
3) What research has been done and needs to be done to understand what stressors will causechronically affected populations to become acute?
4) What existing research/future research bears on the effects of different strains of Mycoplasmaon clinical outbreaks v. environmental stressors?
5) What management actions do the literature and your scientific opinion recommend to controlthe spread of URTD, and to recover affected populations?
Dr. Elliot Jacobson gave a presentation on disease studies in the desert tortoise. At the time of theoriginal recovery plan, very little was known about Mycoplasma in relation to tortoise disease. Twosections of the 1994 recovery plan apply to disease: 3.b.1 Initiate epidemiologic studies and 3.b.2Research sources of mortality. Little attention has been paid to epidemiologic studies since therecovery plan was written.
There is no data to support the idea that Upper Respiratory Tract Disease (URTD) is movingthrough the populations of the Mojave desert tortoise. From the information available, it wouldseem that Mycoplasma has been in coexistence with the desert tortoise for extended periods of time;however, there may have been subsequent changes in the strains infecting tortoises. Evolutionarily,Mycoplasma can coevolve with their hosts. Current data only point to an association between deathof tortoises and URTD.
Mycoplasma agassizii is isolated in the upper respiratory track, which is unusual with Mycoplasmainfections. Dr. Jacobson is interested in looking at the energetics of disease in the desert tortoise.Studies of water balance in sick tortoises appear to be critical to understanding the relationshipbetween disease and environmental stress.
Shell dyskeratosis is the only other disorder mentioned in the recovery plan. This disorder, whichmay be related to toxins, causes lesions that affect the formation of keratin.
The following are on going projects related to desert tortoise disease: 1) necropsies of ill and dyingtortoises (recommended in original Recovery Plan), 2) serologic survey of desert tortoises forexposure to Mycoplasma and Herpesvirus (THV) (prevalence of disease in captive tortoises), and 3)transmission of Herpesvirus and Mycoplasma through the egg of desert tortoises.

DTRPAC Report page 193
Dr. Jacobson gave some examples of tortoise disease, including hepatic and renal disease, andHerpesvirus. Herpesvirus may be a significant problem; however, there is no data on howHerpesvirus is affecting wild populations.
Future studies on tortoise disease will include: 1) transmission of THV, 2) developing immunologicmarkers for heath assessment, 3) examination of tissues by PCR for retroviruses and otherpathogens, and 4) understanding the pathophysiology of hemosiderosis.
The need for epidemiologic studies was highlighted, however, to perform the appropriate studies,appropriate questions are needed. For example, is disease spreading across the Mojave? AlthoughELISA positive animals did increase across the Mojave desert, this may be an artifact of sampling.URTD is seen mostly in dense populations and may be drought associated. Another question wouldbe is URTD an ultimate cause of tortoise mortality.
There was a question of how information on tortoise disease will relate into management actions,considering this is a sparsely distributed wild population. It was noted that human interventionmight only be a short-term fix. Over the long-term, human actions may not necessarily help thespecies. The difference between protecting populations and protecting individuals was noted. Theresponse was that there is conservation value in containing the disease in particular areas which areprotected. By setting up ways to limit disease transmission, this will aid in translocation studies bylimiting exposure. Interim actions are necessary to create artificial source and sink populationscannot sustain themselves alone due to habitat fragmentation and other threats. Source and sinkpopulations could be related to elevation, and subsequently to rainfall.
There is a population of tortoises in Ft. Irwin which does not show antibodies for the disease. Thissuggests that it could be possible that Mycoplasma may be novel for the desert tortoise or that thepopulation has cleared the disease. An alternative explanation is that the sample sizes could be toosmall or the test could not be detecting the strain that may exist in that population. There was asuggestion that URTD has all the characteristics of agents entering a population that have nevercome across a particular organism (non-resistant population). This may be a case of a verysignificant genetic change in the Mycoplasma in recent times.
Dr. Mary Brown presented the need for a global perspective on tortoise disease. There aremultifactor causes of morbidity and mortality events and disease is only one factor that contributesto mortality. Understanding how disease interacts with stress, drought, and nutrition is critical.There is a need for a rapid response program to investigate morbidity and mortality events. Thereare other response programs (Biodefense and Foodnet) which we can use as models.
Components of rapid response could include:
1) Standard operating protocols in place (permits, etc.) so that when an event happens, theresponse actions occur immediately.
2) Diagnostic and evaluation protocols designed to determine the nature of the threat3) Appropriate management strategies for containment or removal of threat4) Plans for monitoring the success of the action
This potential management action was not specified in the original recovery plan. If there is adisease outbreak in a protected area, this is a possible way to introduce controls to preventspreading to conspecifics. Examples of possible actions are setting up a quarantine zone orremoving actively shedding animals. These animals could be held for observation and possibly

DTRPAC Report page 194
reintroduced in the long term. Using modeling as a tool also may be helpful for studying differentoutbreak scenarios. There is a need for interdisciplinary solutions to disease. In the future, modelscould be applied to use and test validity of predictive models, provide framework for managementdecisions, and use real outbreaks to provide a benchmark for efficacy of containment models.
Strategies for the control of infection diseases include:
DiagnosisQuarantineCulling or segregationPhysical separation/barrierUse of sentinel animalsInvestigate the periphery of outbreakLong-term monitoring – choose populations that will provide the most information, notsolely disease monitoring (habitat, etc)
Hypothesized factors contributing to URTD disease transmission and severity:
Critical threshold of exposure (differs among populations)Microbial virulenceMicrobial infections dose and lesion dose (wide variety of virulence)Prior exposure (limited ability to control disease severity)Clinical expression of diseaseGender, age, and behavior (individual behavior may affect)Exacerbating factors – nutrition, drought, etc.Nutritional status
Although there is no definitive proof, the following are the potential population effects of URTD(long-term monitoring is needed):
Multifactorial diseaseDirectly Affects demographics and viabilityMay impact Survival and reproductionMay affect Physiology/behavior
There are two Mycoplasma that have been isolated from wild tortoises:Mycoplasma agassizii – confirmed etiologic role in URTDMycoplasma cheloniae – isolated; some strains may be pathogenicTwo additional Mycoplasma not yet isolated
A cluster of closely related species may cause URTD, which is consistent with respiratory diseasein poultry and small ruminants. This causes a diagnostic dilemma because the ELISA test may notcross react with all strains; clusters may vary regionally, and may vary in virulence. To understanddifferences in virulence among strains, new work is being done with virulence infection studies.
1) Identification of virulence genes and development of virulence profiles2) Critical prognostic information and management decisions – identify gene products and
develop prognosis checks, which may be an early detector for populations in trouble
It is important to understand specific virulence factors so that scientists can:

DTRPAC Report page 195
Predict disease severity and at risk populationsDetermine specific antigens occurring when “bad” Mycoplasma are presentMonitor changes over time
o Mutationso Changes in microbe present due to new introductions
Currently there are major gaps in knowledge including:
Tortoise immunobiology – reagents and functional assays, normal vs. abnormal values,cellular immune systemInfectious agents – different strains/speciesDiagnostics testingLong term effects in wild populations
These gaps lead to directions for future research:
Development of genetic profile for virulenceInteractions with other agentsRapid response
Dr. David Rostal gave a presentation on URTD and reproduction in the desert tortoise.Reproduction studies occurred in 1991-1993 with a follow up in 2000-2001. Dramatic declines inreproduction were seen in acute animals; however, reproduction recovered in animals showingclinical signs of URTD over time. Animals showing acute symptoms were more likely to showsymptoms in the follow up. These animals were not nesting, and therefore, were not functioning asa reproductive part of the population. In the follow up, a majority of sick individuals began toreproduce in a manner like ELISA negative animals. There was no difference in clutch size and nodifference in hatchling size between formerly sick and always well animals. The ability toreproduce seems to recover in infected tortoises.
Some observations from gopher tortoises at Ft. Stewart may provide insight for the desert tortoise.Reproduction, clutch size, and hatchling success were not affected by a five-year drought; however,multiple droughts can have a cumulative effect. Habitat is the most important component to tortoisehealth. There is a low probability that Mycoplasma can be vertically transmitted; however theantibody is passed from mother to offspring. Preliminary studies support this, but more data areneeded. Moreover, outbreaks followed the introduction of animals into research groups, butindividuals not introduced into groups did not show signs, suggesting that social stress can causeclinical signs.
Stress, density, and nutrition affect wild populations with varying levels of ELISA positive(possibly different strains with different virulence). This may lead to an outbreak or not, withclinical (no reproduction) and subclincal (reproduction recovers) phases. It is important todetermine the causes of outbreaks and to look further at the interaction between drought anddisease.
The discussion on disease pointed towards not ranking threats, but focusing on cumulative andinteractive effects. Perhaps disease has always existed, however, it may be important to show that,possibly as a result of other threats, disease has become a problem. Long-term monitoring isnecessary to answer some specific questions, determine specific management actions, and monitortheir effectiveness.

DTRPAC Report page 196
A veterinary epidemiologist gave perspectives on tortoise disease from the epidemiologist’s pointof view:
Determine the relevance of the questions concerning disease to the survival of the deserttortoise over the long term.Place equivalent effort into answering what are the factors contributing to the decline intortoise numbers.There are challenges due to the nature of the host and the pathogen in this case
o Widely spread host, which makes it difficult to get epidemiological datao Ranking causes of death
Ask how will the disease affect low density, long-lived species?Determine how Mycoplasma behaves in a population of desert tortoiseBe wary of modeling too quickly with too little information, and be sure to use post hocevaluation of models; possibly use modeling to assess knowledge base.Pick representatives sites as examples, and design studies that collaborates between thosestudying individuals and epidemiology
The following are possible changes in prescriptions for research that were not made in the originalrecovery plan:
The USFWS should be proactive in providing leadership using multi-disciplinary/multi-year efforts. Long-term research agendas and improve implementation are needed.Use the study of healthy tortoises as a control to determine what is abnormal may havevalue, but killing healthy animals should be kept at a minimum.
The following are possible changes in prescriptions for management actions that were not made inthe original recovery plan:
There should be a slight rearrangement in organization of the approach towards disease,and threats in general. No longer a list of threats but an integrated approach (totality).There are currently no standards for determining if a population is healthy or not andwhether individuals were stressed or not. Is it possible to develop them?
o Rapid response protocolso Integrating management and research; use a global perspectiveo Monitor health of populations in all DWMAs
Briefing on the Disease Workshop
Highlights were given from November 2002 workshop on desert tortoise health and disease. Thedisease workshop report will include lists of what we know, what we don’t know, and what wesuspect for topics including, health, nutrition, general, URTD, and herpes. The report also includesresearch priorities and management actions. The document still needs several iterations, includingaddition of citations under the “what we know” section.
Determination of writing assignments
A discussion of DPS units continued from previous discussions in the prior meeting. A mapshowing four genetic units was discussed. Further ecological evidence is needed for dividing WestMojave from Colorado.

DTRPAC Report page 197
Presentation on desert tortoise threats, Dr. Jill Heaton
The following five steps could be used begin to address threats and to set the stage for thecomplexity of threat interactions:
1. Identify a list threats (* already complete)2. Visualize complexity of threats (GIS, etc) (**critical)3. Develop ways to describe and characterize threats and threat interactions (possible
research priorities for long-term monitoring)4. Methods for prediction of threat spatial interactions5. Application of methods for description and prediction of past present future threats
The potential starting point to handle the issue of description and characterization of threats(monitoring, mitigating) could be the questionnaire used to evaluate recovery plans (EcologicalApplications on Recovery plans). The questionnaire would need to modify not to single outindividual threats. There are serious difficulties with this approach due to questionnaire design. Inaddition, it will be difficult to obtain quantitative data from the questionnaire. This questionnaire isalready approved from USFWS and can be used as a framework to characterize threats anddifferences in threats based on ages, but we are cautious about this approach.
Dr. Heaton developed GIS maps for threats and recovery actions recommended for each DWMA inthe 1994 Recovery Plan. The maps show where recovery actions are being implemented, werepartially implemented or have not been implemented. The data sources were the “Summary ofDesert Tortoise Recovery Actions” for each recovery unit. The documents describe agencymanagement actions occurring since the 1994 Recovery Plan recommendations. These documentswere a good starting point; however, there are many more management actions, which were notdiscussed. The maps, which highlight DWMA and recovery units, could be sent to agencies toaddress inconsistencies between implementation and recommendations.
Within California unit there are different management units (planning areas), which implementactions in different ways and each unit has different strengths and weaknesses. Future maps couldseparate out management units. There was a discussion of grazing allotments and the difficultpolitical climate in CA. There is only one grazing allotment (Gene Dry Lake) in NV which is not ina DWMA. The discussion pointed out inconsistencies between map data and actual managementpractices. There are similar problems with feral equids data. There was a recommendation madedevelop a different questionnaire and to break up maps by planning area, agency, and geographiclocations.
There appears to be discrepancies between the Recovery Plan and the DWMA documents. Themonitoring health of populations may have only been suggested for Fenner Valley. There will be acheck to determine if this was recommended or if there are discrepancies.
Maps showing tortoise habitat voids (>5,000 ft elevation and dry lake beds) and road density incritical habitat were presented to the group. A suggestion was made to weigh by road usage. Anadjacent map showing road density in areas surrounding critical habitat will be helpful.
A data sources inventory (determine data sources) and assessment (geographic area and specifics)will be necessary to visualize the complexity of threats, particularly in the Western Mojave. Datasources are listed below.

DTRPAC Report page 198
Air quality - types of available data from AQ monitoring stations (arsenic, barium, copper,lead, SO2, CO2 counts for 2000)Mining – all mines, not just those currently in use. Further assessment needed (potentialsources of toxicants and dust)Urban areasToxic release sitesRoadsRailroadsOHV/DOD areasLandfills and disposal sitesUSGS dust trapsCA cattle grazing
It is possible to layer threats and determine the number of threats (perturbations) per pixel. This hasbeen done previously for sage grouse. In addition, layers showing tortoise distribution and densityestimates would be useful. This would lead to the possibility of making flow charts, showingchanges over time.
ACTION: Dr. Delehanty will try and track down the literature related to layering threats for thesage grouse.
It was noted that there might be a danger in illustrating the high number of threats to tortoises. Whenlarge sacrifices produce little noticeable improvements, its leads to feelings that eliminating onethreat can’t make any difference. Some threats are more easily eliminated than others, despite thesmaller benefit to tortoises. Threats are not just scientific but also political and social. By targetingparticular demographic groups with working towards elimination of particular threats (i.e. dogs inurban areas, target folks in urban areas), tackling threats may be more manageable. Presentinginformation on threats (flow charts) in a visual way will be very helpful. The group came toconsensus that excluding use of habitat will make the most difference for tortoise populations andthat the elimination of many threats as best possible is more important than eliminating one threatcompletely.
In addition to a source of threats data inventory, specific data are needed for modeling efforts.
Weather stationsDry lake bedsElevationWind patternsOther important items: geomorphology, vegetation, etc.
Future work and data acquisition: Work is currently being done on developing fragmentationindices. Data are needed for grazing allotments and planning areas from NV.
ACTION: Dr. Heaton will work with Lewis Wallenmeyer (Clark County) to acquire necessarydata from Nevada.
Dr. Heaton also gave a presentation on a decision support system for desert tortoise knowledgebeing developed at the University of Redlands. The goals of the project are to create system to tracktortoise knowledge and a forum for scientific consensus building. This will be done using anintegrated modeling tool known as an Ecosystem Management Decision Support (EMDS). Thistool provides the ability to evaluate missing data, rank confidence in data sources, and bridge gapsin knowledge. Dr. Heaton explained how the knowledge base is constructed without using what

DTRPAC Report page 199
data is available. Data will then be linked to the different components. It is possible to have a mapfor each node in the knowledge base, which would show, for example, suitable vs. non-suitablehabitat. The system can combines habitat and threats models. The stacking of threats interactivelycould be a way to visualize threat complexity.
The system allows evaluation based on criteria such as conservation priority, feasibility, habitatsuitability, and management area condition. Users can perform sensitivity analyses and trade-offanalyses, as well as, weight the importance of certain criteria. Development of this system will bean iterative process and must be adaptive. There was a suggestion that both population-based andindividual-based models would be useful for different analyses. There was also a suggestion tomake the process self-correcting, based on data already in the model. This would involve neuralnetworking.
Responses to draft text and maps: Dr. Heaton would like reaction and direction on the threatssection text. In addition, she would like to know if there are there other data sources to fill in thegaps to the data inventory. Dr. Heaton would like thoughts on threat prioritization (five-ten corethreats, spatially associated with points on the ground) to perform overlay analysis. There was asuggestion to focus on threats that seem independent (i.e. fire, roads, water, human populationdensity, exotics), but may be influencing each other and the final result.
Suggestions for the Threats Section included:
Provide a map showing a buffer around urban areas that shows less associated threats as youmove farther from the center.Give examples in report of the types of threats analysis and highlight what is missing toanalyze fully the interaction/complexity of threats.Give an example using a smaller geographic area, and provide a visual analysis of allthreats.Provide as much scientific analysis as possible.Hypothesize on the characterization of individual threats and the interactions among threats.This will be the set up for future experimentation and monitoring to test hypotheses.Highlight issues of spatial and temporal importance
Determine writing assignments and an update
Information is accumulating concerning recommendations that the team will make for a revisedrecovery plan. There was a suggestion to arrange a framework for the end product and beginsending around iterations via email. The Distinct Population Segments (DPS) section is comingtogether well; however, the components that extend beyond genetics still needs to be fleshed out. Asuggestion was made to propose a hypothesis for further dividing certain suggested DPS unitsbased on ecological components, such as rainfall. By providing an hypothesis and listing pros andcons, this may prevent vital gaps from being lost in the future. Some ecological/behavioraldifferences may lead to divergence on different evolutionary tracts over time.
ACTION ITEMS:
1) UNR will make three separate databases containing the recovery actions in the DWMAdocument, Appendix F of the recovery plan, and pgs 45-60 of the recovery plan. Then makecomparisons to determine if there are inconsistencies.

DTRPAC Report page 200
2) Roy Averill-Murray will review Dr. Heaton’s translation of the recovery action documents foreach recovery unit into maps. (Using these categories: no implementation, partialimplementation, ongoing implementation, no data)
3) For 20 recommended actions not answered in the “Summary of Recovery Actions” documents(listed below), Roy Averill-Murray and Phil Medica will determine if there is data concerningimplementation and put together a database.
Distribution and density surveys Eliminate unauthorized bombingsHealth of populations - Law EnforcementLandfill Management Install RR culverts
Stop mining Evaluate Raven useInstall Road Culverts Restore habitatInstall Urban Barriers Monitor health of populations
Remove surface chemicals Establish visitor centerEstablish research natural area Install RR tortoise fencing
DWMA management area AdministrationEstablish breeding programs Install aquaduct barrier
4) Dr. Heaton will continue writing the Threats section text and working on GIS maps.5) Dr. Lovich will review Dr. Heaton’s Threats section. [Tracy will assume this responsibility]6) Bridgette Hagerty and Ken Nussear will continue to work on population data and will send the
final products to Dr. Heaton.7) Dr. Tracy will compose the first iteration of a framework for a final product and send this
around via email.
Preparation for July DTRPAC meeting
Summary size/age class and density data are accumulated for NV, AZ, UT, and CA pre-1991.There was discussion on collapsing from 7 size classes to 4 size classes. This will be done to allowcomparison of all data; however, all uncollapsed data will also be archived.The question was raised, “Is there a null hypothesis for what a size/age class distribution shouldlook like?” There is a size class distribution hypothesis in the 1994 recovery plan.
There are three levels of data to review for the July meetings:Capture/recapture dataDensity estimates (>180 and all)Size class distribution – tortoises observed (presented in histograms)
Meeting participants:C. Richard Tracy, UNRKen Nussear, UNRJill Heaton, U. RedlandsEarl McCoy, USFDavid Morafka, Cal. Academy of SciencesDavid Delehanty, ISUPhil Medica, USFWS
Roy Averill-Murray, AFGMary Brown, UFElliott Jacobson, UFDavid Thawley, UNRDavid Rostal, GSULewis Wallenmeyer, Clark County, NVBridgette Hagerty, UNR

DTRPAC Report page 201
Desert Tortoise Recovery Plan Assessment Committee MeetingJuly 31 – August 1, 2003North Tahoe Conference CenterKings Beach, CA
Announcements: The West Mojave Plan is currently out for review. Comments are welcome andare due by September 18th. There is also a contract out for a pathologist, as an outcome of thedisease workshop.
Presentations on tortoise population status in CA, NV, UT, and AZ
Arizona and Utah data – Roy Averill-Murray, AFGDAnn McLuckie presented size class data from Arizona and Utah plots. Lincoln Peterson
density estimates were presented, where available. All plots are 1 sq.mile in area and are surveyedfor an effort of 60 person days, in two successive 30-day sweeps. During the first 30-day sweep,tortoises are marked, and tortoises are recaptured during the second. In some cases, more than oneperson worked a particular plot, thus lowering the amount of days necessary to complete 60 persondays worth of effort. Consistently, there were 45 days where one person work alone surveying aplot. There may have been a 15-day period where a second person is working. The 60-person dayeffort was held constant.
The graphs provided showed the number of live animals captured on each plot per year.Where data on sex were not given or if tortoises were not sexed due to lack of reliability, tortoisenumbers were split in half for this exercise. Murray also provided data on the percent dead at eachplot. Percent dead was number of carcasses removed from the plot divided by the number of livetortoises found plus the number dead. Tortoise carcasses are being removed during every surveyyear. In AZ, all plots will show survey technique improvements in mid-90s, thus improving thenumber of tortoises found.
Notes associated with general plot data:There is an assumption that the number of tortoises entering the plot is equal to the numberleaving the plot. In addition, there is a higher likelihood that tortoises around the peripherywill move off the plot than those in the center. Tortoises appear to have anchored homeranges, so large moves seem unlikely.Juveniles and subadults in the West Mojave show great deal of movement prior toreproduction (Boarman and Morafka, pers. comm.).If there have been changes in impacts (management, recreation, etc.) over time, they areimportant to note for all plots.Occasionally desert tortoises have been known to die in burrows.There was a suggestion to provide a rangewide estimate of growth rate, which would thenbe broken down by areas of the Mojave.The dead counts and the size class of dead tortoises may vary in reliability depending onthe experience of the crew. Preservation of the carcass, shell, scutes, etc. depends heavilyon how the tortoise died and where the carcass is left (in moist vegetation or not). (Berry,pers comm.).It is important to remember that some plots may be sinks while others are sources. Thus,one cannot assume every plot should expect good numbers of tortoises.In the future, it would be helpful to include plot workers in data spreadsheets.

DTRPAC Report page 202
Beaver Dam Slope (BDS) Exclosure (AZ): The BDS Exclosure plot is less than 1 sq. mile, closerto 500 acres, and is located on the AZ/UT border. Caliche caves are found throughout this plot,which may reduce the ability to detect tortoises. This site was surveyed in 1989, 1996, and 2001.This site is scheduled to be surveyed in 2005, however, the survey could be done in spring 2004,funding permitting.
Littlefield (AZ): This plot was surveyed in 1987, 1993, 1998, and 2002.
Pakoon Basin (AZ): This plot is located south of the Virgin Mountains, and was only surveyed in1991.
Virgin Slope (AZ): This plot was surveyed in 1992, 1997, and 2003.
Summary of Arizona data: Plot data from Arizona suggests that there is enough evidence to beconcerned about tortoise populations, however, there is no conclusive evidence of decline. Moredata are necessary.
Beaver Dam Slope (UT). The BDS site was surveyed once in 1991.
City Creek (UT): This plot was surveyed in 1988 and 1994. Line distance sampling has been themethod used more recently in this area, and has shown constant density estimates.
Woodbury – Hardy (UT): This plot was surveyed in 1981, 1986, 1992, and 1998. This plot islocated in the northern edge of the tortoises range. A male biased sex ratio may be the result of pre-breeding dispersal movement in males.
Nevada data – Phil Medica, USFWS
Phil Medica presented size class data from Nevada plots. Lincoln Peterson densityestimates were presented, where available. Data for dead tortoise counts were not included in thepresentation. All plots were surveyed with 60-day person effort. Most of the surveys were donewith two people for a 15-day capture period and a 15-day recapture period. All surveys occurredbetween early April and May. Where appropriate, tortoise density estimates were provided. After1995, there were no plots sampled in Nevada, except at Lake Mead.
Christmas Tree Pass (NV): This plot was surveyed in 1985, 1991, and 1994. The plot is locatedbetween a highway and a power line with a moderate level of disturbance. Population estimates atthis plot are fairly stable for the years surveyed.
Piute Valley (NV): This plot was surveyed in 1979, 1983, 1989, and 1994. In 1987 there wereproblems with the survey. The entire plot was not worked, the time of year was incorrect, and therewere problems with data collection. For these reasons the 1987 data set was not used. Confidencelimits for population estimates for years surveyed overlap, suggesting that the population has notdecreased significantly.
Coyote Springs (NV): This plot approaches the northern edge of the desert tortoises range, locatedin Lincoln County. The plot was surveyed in 1986, 1992, and 1995.

DTRPAC Report page 203
Sand Hollow (NV): This plot is the most northern plot in the NV tortoise’s range, located inLincoln county. The plot does not contain good tortoise habitat for burrow construction. The site iseast of highway 93 and west of I-15. No density estimates were provided due to low tortoise counts.
Mormon Mesa (NV): This plot contains a caliche underpan and is located 4 miles west of I-15.The plot was surveyed in 1989 and 1994, and data show no significant differences in densityestimates.
Gold Butte (NV): This plot is located in a remote area, southeast of Mesquite near the Lake MeadNational Recreation Area. This plot was surveyed in 1986, 1990, and 1994. Density estimates forthis plot were stable.
Trout Canyon (NV): This plot is located west of Las Vegas and is three miles north of a newhighway. The plot was surveyed in 1987 and 1992.
Sheep Mountain (NV): This plot is located south of Las Vegas and east of I-15. The plot wassurveyed in 1979, 1984, 1992, and 1995.
Last Chance (NV): This plot was surveyed once in 1980.
Lake Mead National Recreation Area (NRA): Two plots (Grapevine and Cottonwood) weresurveyed extensively in this area. Several plots were sampled sparsely since 1995.
Grapevine Canyon (NV): This plot was surveyed for population estimate data from 1992-1995.These data are useful for making year-to-year comparisons. After these surveys were done, animalswere fitted with transmitters and followed to determine survivorship. The plots were notsystematically sampled. The data from this study were published in the June or July issue of theJournal of Herpetology. This plot is located northwest of Laughlin, Nevada and is not comparableto other plots.
Cottonwood (NV): This plot was sampled similarly to Grapevine from 1992 to 1994 for populationestimates.
River Mountain (NV): This plot was sampled from 1995 – 2002.
Summary of Nevada data: Until 1994 there was no statistical variation from survey year to surveyyear, although mortality was observed. Populations in Nevada plots appear to be stable. Althoughthere is not enough data to warrant concern, follow up data for plots in recent years would bevaluable.
California data – Dr. Kristin Berry, USGS
Dr. Berry initially presented preliminary results from a tortoise color study that may affectDTRPAC’s discussion of distinct population segments. Since 1992, color data for shells and limbswere taken, using the Munsell soil color chart. Initial results show statistically significantdifferences among all age classes and among larger tortoises from different regions. Juveniles alsoshow statistical differences between West and East Mojave. Regional color differences seem toreflect original recovery units. In addition, soil color is always lighter than tortoises, and juvenilesappear to have more variety than adults. There is a possibility that color differences have a geneticcomponent if the influence of diet, etc. is eliminated.

DTRPAC Report page 204
Status and trends in CA
Dr. Berry provided some history on the choice of long-term permanent plots. In the early1970s, plots with tortoise counts that too low to perform demography/trends studies wereeliminated. Study sites were chosen after mountainous areas, pinyon/juniper areas, and other poordesert habitat were eliminated. Sites were chosen in all valleys in California that contained tortoisehabitat. The plots were located in critical habitat and represent five of the six recovery units. Theseplots were not only used for demography data collection, but also for tortoise health profiles. Alldata shown were from 60-day effort surveys per 1 sq. mile during which time population data wascollected. All shell and skeletal remains were collected for analysis including time since death, size,sex, relative age, and cause of death. In addition, scat from predators was analyzed. Changes indisturbance, such as increases in use, in plots were also assessed. In addition to demographysurveys and health profiles, necropsies of ill, dying, recently dead tortoises were conducted andNOAA precipitation data were analyzed to determine if there is a relationship between droughtconditions and die offs.
West Mojave
Fremont Valley (CA): This plot was surveyed in 1981, 1987, 1991 and 2001. Major threats nearthis plot include domestic dogs, recreational vehicles, a major road, ravens, and invasive species.
Desert Tortoise Natural Area (DTNA) Interior (CA): This plot was sampled in 1979, 1982,1988, 1992, 1996, and 2002. The plot has an increase in shrub cover and less evidence of invasivespecies; however, outside degradation has increased.
DTNA Interpretive Center (CA): This site was surveyed in 1979, 1985, 1989, 1993, 1997, and2002. This site has shown an increase in development that is evident throughout California.Tortoises at this plot have elevated levels of mercury in their livers (Jacobson et al 1991).
Kramer Hills (CA): This plot was surveyed in 1980, 1982, 1987, 1991, and 1995.
Summary of West Mojave region: With the exception of Kramer Hills, all plots in the West Mojaveshow a terrific downward trend.
Southern Mojave
Stoddard Valley (CA): This plot was sampled in 1981, 1987, and 1991; however, there was doubtraised that the data is reliable.
Lucern Valley (CA): This plot was surveyed in 1980, 1986, 1990, and 1994.
Johnson Valley (CA): This plot was surveyed in 1980, 1986, 1990, and 1994.
Northeast and East Mojave region
Shadow Valley (CA): This is a remotely located plot that is cattle grazing intensive. This plot wassurveyed in 1978, 1988, 1992, and 2002.
Ivanpah Valley (CA): This plot is located in the Mojave National Preserve. This plot was surveyedin 1979, 1986, 1990, 1994, and 2002.

DTRPAC Report page 205
Goffs (CA): This plot is located in the Mojave National Preserve; however, there is still evidenceof cattle grazing. The plot was surveyed in 1980, 1983, 1984, 1985, 1986, 1990, 1994, and 2000.Data from the 2000 survey are located in a published report. Management issues at Goffs include,road kills, the addition of more railroad tracks, disease, and invasive plant species such as theMoroccan Mustard.
Summary of the Northeast and East Mojave region: All plots in this region show a recentdownward trajectory.
North Colorado
Ward Valley (CA): This plot is long and narrow and located along an elevation gradient. It wassurveyed in 1980, 1987, 1991, 1995, and 2002.
Chemehuevi Valley (CA): This is a 1.8 sq. mile plot that was surveyed in 1979, 1982, 1988, 1992,and 1999. Crude assignments of causes of death were given to shell and skeletal remains. Causeswere mammalian predation (high number of coyotes), combination vehicle/mammalian predation,vehicles, avian predation, disease, and unknown. A high number of deaths were associated withroads. An estimation of Brassica tournefortii density suggests that higher densities are located nearedge of road, but the species had penetrated to at least 1 mile into the plot.
Eastern Colorado Desert
Chuckwalla Bench (CA): This plot was surveyed in 1979, 1982, 1988, 1990, 1992, and 1996.Initially, this plot had the largest reported density of tortoises (225 torts/km) of all CA plotssurveyed. Density estimates were published in the New York Turtle and Tortoise SocietyProceedings.
Summary on the North and East Colorado Desert: These plots generally showed downwardtrends.
Summary on CA threats: Direct sources of tortoise mortality are raven predation, vandalism,poaching, road deaths, and canine predation. Examples of these sources of mortality occur atLucerne Valley, DTNA, Fremont Valley, and Goffs. Indirect sources of tortoise mortality includehabitat fragmentation, unauthorized ORV use, increased human access, and invasive plants. Mostimportantly, current inability to measure cumulative impacts to desert habitat is a serious threat.
Comments on CA presentation:A discussion about the differences and similarities between Piute Valley (NV) and Chemehuevi(CA) followed the presentation on California data. Difference in nutrition available at sites, as wellas, between year variations may cause differences in rebounding from a large die off. A questionwas raised that if there is a healthy source population, can a tortoise population that experiences atdie off, rebound more quickly?
Currently, there is a working hypothesis that ground disturbance (e.g. road construction) is causingfree-floating toxicants to be blown onto plants, etc. This is one mechanism for finding highconcentrations of toxicants in tortoises.

DTRPAC Report page 206
The DTRPAC will recognize that CA post-1996 data exists, and will continue with work withsources on how to characterize this information. New data can be handled by using dialogue andannotation so that the team can provide recommendations.
Friday, August 1
A comment was made that although plot information is critical to analysis, it is difficult to use asingle plot to make inferences about an entire DPS unit. Scrutiny of individual plot information isimportant to determine how useful it will be to make inferences. The following question was posed,“How should plot information be combined to do statistical analysis of trends in each DPS?” Asuggestion was made to use regression analysis to look at all plots in a particular area over time andin order to make an inference about each DPS unit.
There was further discussion on how to use information on possible declines in the Eastern Mojavein order to make recommendations in the report. A suggestion was made to use Goffs (CA) andPiute (NV) as an example to describe the volatility of the data and explain reservations on what plotdata suggest.
Reservations were expressed about reporting numeric declines in any area using only densityestimates from all size classes combined. Discussion of what is occurring in each large scale DPAarea is critically important to make recommendations. A suggestion was made to use the followingverbage: with available data there is no downward trend, however, a scientist gave the opinion thatthere are samples showing lower numbers in certain plots which raises concern.
In order to clearly determine trends, there needs to be a change in infrastructure. Data collectionshould be programmatic. There is current difficulty with the disjointed nature of scientific datacollection under USFWS permitting.
Several suggestions were made on how to discuss the topic status in the final DTRPAC report, andin what units should be used. Suggestions are listed below:
Use original recovery units.Use preliminary DPS designations.Use data with all possible hypotheses for different DPS unitsRevisit concepts of DPS units in light of status data presented earlier.
Update on previous writing assignments
Dr. Morafka gave an update on the Distinct Population Segments (DPS) section.To designate a DPS, evidence must be given to show distinctness, ecological and behavioralsignificance, and conservation status. Evidence for distinctness should be recognized as theprerequisite. In addition, these designations will be used sparingly, as stated by Congress. TheUSFWS definition is less strict than those in current schools of scientific thought. Genetic evidenceshould be used as an eyewitness. However, if genetic evidence is not clear, morphology can be usedas a possible clue that genetic differences may be present. Health status (disease) may also be usedas a lower tier criterion to make a population distinct. Therefore, threats can be used to designatemanagement areas, and may result in better management recommendations, and thus recovery ofthe species.
The second criterion is significance, both ecological and behavioral, which also has two tiers. First,different life history strategies may suggest that two populations may be on two different

DTRPAC Report page 207
evolutionary trajectories. Demographics beyond life history strategies, such as responses to disease,weather, and environmental factors that over time may affect life histories, can be used.
The third criterion is conservation status. This should be used a justification in addition tosignificance. A population may be considered significant to the conservation of a species if aninternational boundary is crossed, if there is threat of disease, or if a population sustains gene flowby serving as a bridge between other DPS units.
Britten et al. (1997) does not provide definitive evidence to designate DPS units, however, theirdata is the best available and therefore, can be used as a justification for a recommendation for DPSunits. Using Britten et al. data, Nevada would be divided into two units (North of Las Vegas andSouth of Las Vegas). Therefore, 4 DPS units are designated as a genetic starting point (UpperVirgin, North Las Vegas, South Las Vegas, and Western Mojave).
A suggestion was made to make further divisions using hierarchical justifications. For example,differences in pre-adult predation or differences in summer flora (Western Mojave) may qualify asjustification. In addition, different management needs in the far West Mojave, if they can be relatedto tortoise biology, could also be used as justification.
Although there is no genetic evidence to separate the far West Mojave from the Colorado andEastern Mojave, shape coupled with a progenetic or habitat component, or reproductive differencesmay send a population off on another evolutionary trajectory.
The following status models were suggested to perform statistical analysis on plot data:Original recovery unitsGenetic DPSThird alternative that takes into account all possibilities, resulting in five units: East LasVegas, West Las Vegas, Upper Virgin, East Mojave - Colorado, West Mojave
Description of statistical analysis:Used normalized data using highest value recorded and strike plot variable.Run scale to see blanks (gaps in data)
How can line distance sampling data be used to determine status?Presence/absenceShow the drawbacks of plots to pinpoint trendsSupport or not for trends in plots
o If plots do not show full range of variability, then line distance can point out ifplots are in poor tortoise populations to use as representative areas.
Density dependent effectso Grid analysis (1 sq. mi for example)o First tally each grid unit; then randomly grab units.
Compare plots that were dropped in the early 70s using current LDS data.To determine if LDS data provide further information on status, a regression analysis willbe performed on LDS density estimates after G0 data is added to 2003.
Summary of Line Distance SamplingPhil Medica presented a summary on line distance sampling (LDS) for 2001 – 2003. Transects were400 m on a side and in the shape of a bow tie or figure 8. Random point criteria were used once thefollowing criteria were used. Transects included critical habitat, < 1250 m elevation, < 30% slope,and excluded private land and non-habitat areas (e.g. playas). Density estimates using LSD appear

DTRPAC Report page 208
to underestimate tortoise density compared to plot density estimates. A suggestion was made toattempt to increase the area that could be sampled by increasing slope. Poor resolution of dataavailable may give an inaccurate slope calculation. Possible area able to be sampled decreasedmainly by changing to bowtie shape transects that could not overlap.
Total corrected sign (TSC) data: Further discussion of TCS data will occur at the DTRPACmeeting that covers monitoring.
Threats in relation to population status
There was a discussion concerning the relation of threats in relation to downward trends. Is theoccurrence of threats and population declines synchronous? Or are differences in management alsoresponsible? Many threats have a temporal component that must be included in the analysis. In theWest Mojave, where there have been precipitous declines, there are no unique threats, exceptperhaps poaching for food. However, there are increased threats of raven predation, humanpredation, habitat fragmentation, canine predation, releasing of sick pets, air pollution, and grounddisturbing activities (roads, tanks, more legal and illegal OHV, open areas). Dr. Heaton broughtforth data sets that may show some of these threats numerically. A suggestion was made to comparethreats in areas where populations that are stable to those in declining areas. There are availabledata that would be useful for region wide comparisons.
Determine writing assignments and action items
ACTION: Dr. Boarman will provide a set of demography data for a highway 158 plot in the WestMojave to Dr. Heaton and Ken Nussear.ACTION: Ken Nussear will run statistical analysis of plot data using different DPS models.ACTION: Dave Delehanty will perform a regression analysis on LDS density estimates after G0
data is added to 2003 data.ACTION: Rich Inman will deliver G0 data for 2003.ACTION: Dr. Boarman will send around draft writing on total corrected sign data for review.ACTION: Dr. Heaton will produce a map with long-term plots and then with random plots todetermine if long-term plots are representative of a region.ACTION: Dr. Heaton and Dr. Boarman will produce a threats indexACTION: Dr. Heaton and Phil Medica will provide references that give history of tortoisesampling methods.
Writing Assignments:Current draft of DPS section – Dr. Tracy will review the draft by Dr. Morafka and Dr.McCoyAppreciation of Desert – Dr. Morafka is working on a draft of this sectionIntroduction to the report: Dr. Tracy and Dr. Morafka will write a draft of this sectionPopulation Status Section: Dr. Tracy will write a draft of this section.
Preparation for September 4-5 DTRPAC meeting (MONITORING in the broad sense andDelisting Criteria)
Meeting schedule:o Delisting criteria will be introduced on the morning of Sept. 4o Monitoring of threats and habitat will be discussed in the afternoon of Sept. 4
(Guests: Mary Cable, landscape level theoretician, Dr. White)

DTRPAC Report page 209
o Monitoring tortoise populations will be discussed in the morning of Sept. 5.(Speakers: Stephen Corn, Dr. Tracy, Dr. Boarman)
o Return to delisting criteria in the afternoon of Sept. 5o The DPS discussion will be revisited to incorporate new analyses.
To be discussed at the September meeting:o Efficacy of current methods for monitoring tortoiseso Are plots valuable indicators?o How to evaluate trends in reference to the animals (relative vs. absolute)
Focused list of questions to pose to guests (not in any particular order)o Preamble: To instill a complete monitoring scheme, there are several components: 1)
monitoring for focal animal, either true density estimate or indicators of trends, 2)monitoring of habitat, and 3) monitoring of threats (improving or worsening).
o How is it possible to know if we are satisfying the given delisting criteria?o What other delisting criteria could work instead of 25-year upward or stable trend?o What are cost effective mechanisms that people are using to monitor vast expanses of
habitat?o What are the different types of approaches to monitor habitat? Please provide a cost-
benefit analysis as well as the need for technical know-how? Are experts required forparticular approaches?
o What features of the environment should be monitored? (i.e What variables canfeasibly be looked at over time?)
o If you were hired as an outside consultant, and you were asked to design a scheme todetermine if habitat has changed over time, what would you do?
o How can statistical power issues be dealt with? How can habitat be measured withenough power to perform an analysis?
o If a certain amount of habitat is being converted for use, how can that be measured?Remaining habitat may or may not be good tortoise habitat. How can you distinguishbetween the two?
o What needs to be known about tortoise biology to design habitat monitoring? (i.e.movement, life history strategies etc.)
o Is it feasible to track individual threats as well as measure cumulative threats? Howcan you recognize a threat?
Invitations for speakers (two days):o Steve Corn: Line distance samplingo Mary Cable: change detection from remote sensingo Outside evaluation (non-tortoise) – possibly Gary White or Jim Sedingero Protocols for threats and habitat monitoring (in a general sense - theoretical) - Chuck
Peterson (Idaho State)o Threats monitoring - Fran James or Michael Reed
Meeting participants:
C. Richard Tracy, UNRBridgette Hagerty, UNREarl McCoy, USFDavid Morafka, Cal AcademyPhil Medica, USFWSRoy Averill-Murray, AFGBob Williams, USFWSKristin Berry, USGSBecky Jones, CFG
Karen Phillips, USGSJohn Hamill, DOIClarence Everly, DODBill Boarman, USGSDave Delehanty, UIKen Nussear, UNRJill Heaton, U. RedlandsRich Inman, RedlandsLewis Wallenmeyer, Clark County

DTRPAC Report page 210
Desert Tortoise Recovery Plan Assessment Committee MeetingSeptember 4 - 5, 2003Casa Munras Garden HotelMonterey, CA
Announcements: The Management Oversight Group is having a meeting on Wednesday,September 24 (10am – 3pm) at the Sun Coast in Las Vegas, NV to receive an update on DTRPACprogress.
Presentation on Multi-dimensional monitoring of desert tortoise: what are the goals andproblems associated with monitoring?
Dr. Tracy presented information on the current status of multi-dimensional monitoring for thedesert tortoise. The keystone delisting criterion is to demonstrate a statistically significant upwardtrend in the size of desert tortoise Mojave population over a period of 25 years. This criterion wasused instead of a more common criterion specifying a target population size for delisting (At thetime when the desert tortoise was listed by USFWS, there was a downward trend in populationsize). The other four delisting criteria for desert tortoise relate to conservation initiatives after anupward trend has been demonstrated.
Modern monitoring requires documenting changes in three elements: 1) size of populations(including density and aerial extent of population), 2) habitat of the species, and 3) threats to thepopulation. In addition, some monitoring should be hypothesis-based. For example, hypothesis-based monitoring could be used to determine the effects of management actions such as highwayfencing or removing grazing. Using presence/absence data, we could identify areas which could betargeted for repatriation experiments or other research needed for assessing the efficacy ofmanagement.
Using the data from transects conducted for distance sampling, a Kernel analysis was performed topredict the presence and absence of live animals and carcasses within DWMAs and recovery units.In some areas that were formerly in the range of desert tortoise, there appears to be no discernablepopulations. For example, the Desert Tortoise Natural Area (DTNA) has become a fragment ofhabitat that no longer appears to represent adequate tortoise habitat. The same result obtains inEldorado Valley of Nevada.
Monitoring trends
With little variation in data, statistically determining population growth is a simple task. However,variance in population density estimates for desert tortoise makes determining a trend very difficult(or impossible). Life history characters make seeing trends difficult over a short time. This type ofproblem has been previously demonstrated for bald eagle populations.
Sites for permanent monitoring plots were initiated to study the biology of individual tortoisesincluding population ecology questions. When the 1994 recovery plan was written, there werepopulation declines in the Western Mojave. This downward trend still continues. There is now anew concern for populations in the East Mojave, particularly due to a single data point at the Goffssite. This concern has highlighted the need for more data. In these areas, tortoises appear to beaffected by various combinations of cumulative threats, not one particular threat.

DTRPAC Report page 211
There are many problems with using permanent plots to determine population trends:Plots cover a small percentage of tortoise habitat, though plots are separated far enough thattortoises from one plot cannot move to another.Plots are not randomly placed in critical habitat.Replication of plots within years in inadequate for comparison.Sample sizes of census years are largely inadequate to yield enough statistical power toperform a regression of trends in any particular plot.Several plots were abandoned early in the process because they had low tortoise counts.Data from plots violate assumptions in mark-recapture techniques and detectability oftortoises was not evaluated as part of the analyses.
Transect Methods for Density Estimates
During a 1995 workshop on tortoise monitoring in Reno, tortoise biologists, statisticians, andmonitoring experts reviewed previous methods used to monitor tortoise populations and possiblemethods to use in the future. From this workshop, a decision was made to use distance samplingtechniques to monitor tortoise populations, although the efficacy of the technique for the specieswas debated. Distance sampling requires measuring the distance perpendicular to a transect to eachtortoise in order to calculate the detectability of animals.
Typical density calculations are multiplied by two factors, Pa and G0. Pa is the probability thattortoises can be seen by the person walking a transect (detectability). G0 is the probability thattortoises are active and able to be sampled (either on the ground surface or visible in a burrow).Tortoises that are located farther from the transect line are more difficult to see. All data arenormalized under the assumption that all tortoises on the transect line are seen. The rule of thumbused is that a sample size of 60 tortoises is large enough to estimate detectability. In better years, aperson must walk more than 400 km to see 60 tortoises. More than 1 field crew contributes to thetransect data from each site, as a result of the long distances necessary to find 60 tortoises. In somecircumstances (temporally or spatially), distances exceeding 1000 km are necessary to find 60tortoises.
More recently, measurements of each team’s ability to detect tortoises have allowed us toenumerate the role of the team for Pa. Two sizes of styrofoam tortoises used to train crews. Eachtortoise is numbered and the distance to each tortoise found is measured. Currently, only onedensity of tortoises (410 tortoises per 1 km2) is used. These tests have shown that distance samplingis inaccurate because crews appear unable to see tortoises on the line. This violates a criticalassumption of distance sampling as a method. Furthermore, data from different crews are fusedtogether to produce transects producing 60 tortoises. The detectability estimate resulting from thosedata are irretrievably incorrect as they bias Pa to the better crews in ways that cannot be corrected.
G0 changes among sites, during the day, throughout the season, and among years. However, datafrom the entire range are currently lumped to calculate a single G0 to estimate densities of tortoisesfor the entire range. G0 is calculated using a number of focal tortoises that are monitored to find theamount of time they are active. Another possible source of error is that tortoises that can be seen intheir burrow are counted the same as tortoises found walking in the open to make one G0 estimate.
Power analysis of distance sampling
A power analysis was performed to detect trends in population size as a function of annual percentpopulation growth rate. For a gentle growth rate, the coefficient of variation would have to be much

DTRPAC Report page 212
lower to detect a trend statistically. A reasonable optimistic population growth rate for tortoiseswould be 3/10 % growth per year. Currently, those working on distance sampling are trying toreduce variance in Pa and G0, but it may be impossible to reduce variance enough to be able todetect an upward trend. It was noted that no time lag due to age structure was included in theanalysis, which may make detection even more difficult. Therefore, transect methods requiremodifications to increase precision of population estimates to the point where they can be useful foranalyses needed for delisting.
With knowledge of what is being done to monitor tortoise populations, there was a suggestion formulti-dimensional monitoring program. This would include monitoring the efficacy of ourmanagement actions, changes in habitat, and changes in threats with time, in addition to estimatingtortoise density adequately.
Further discussion of distance sampling
Steve Corn (USGS) presented additional information on the distance sampling (DS) methodcurrently being used to estimate tortoise densities. Methods for distance sampling are as follows: Apair of field workers (leader and follower) make three passes over 100m segments. The firstobserver makes a first pass holding a measuring tape. Then, a second observer follows behind alongthe centerline. A third pass involves the observers moving in a zigzag pattern.
In 2003, the goal for DS was to walk 4 km per day along transects that bent back upon themselvesin a bow tie configuration, and do this in 3-5 hrs. Using the composite detection function fromProgram Distance produced comparable results among years. Transect criteria changed between2001 and 2002. The buffers used were different and the bow-tie configuration vs. straight linetransects restricted number of areas available to be used as random samples. As a result, there was alack of re-randomization among years because the probability of reselecting areas among years wasmuch higher. The restrictions on randomly choosing a transect included: sites had to be below 4200ft elevation, less than 30 % (2001) and 30 degree slope (2002), not on playas, not on private land,not on any roads in the GIS data set (buffered 25 m on either side), and in 2002 a 25 m buffer wasplaced on all criteria for exclusion. For 2004, no buffers will be used, dirt roads will not beexcluded, and slope exclusions will be much steeper.
There was a suggestion that re-randomization is not always useful in reducing variation. Onesuggestion was to select random sites for sampling initially, and then continue to use the same sitesannually. Another suggestion was to use a mixture of re-randomizing and revisiting sites to look attemporal differences.There was a discussion on the number of data points vs. the precision of data points and theresulting power to determine trends. A suggestion was made that there is the possibility of findingthe optimal pooling. This would be a balance between the number of points to use, power ofanalysis, and variation in data. However, Nussear and Tracy reported that pooling invariablyreduced power as the balance of reducing variance was offset by a reduction in degrees of freedom.
Although tortoise densities should be easy to calculate using DS methods because of the propertiesof tortoises (i.e., tortoises are diurnal, they are found in open habitat, and their activity is linked todrought severity index) it is not always the case that tortoises are easy to enumerate. Tortoisepositions that are cited while sampling are burrow (visible), deep (not visible), open, undervegetation, hidden, tortoise in the open but near burrow. For each recovery unit focal animals (5-18) are repeatedly measured. The mean of observations during when observations are being taken iscalculated.

DTRPAC Report page 213
Unfortunately, Program Distance currently only takes one G0 measurement, and this is a seriouslimitation. If a satisfactory model for G0 were developed, this would eliminate the need for focalanimals and it would require different software. A suggestion was made to use a weighted orharmonic average if G0 estimates are lumped. Currently there is a developing effort to model G0 (byBRRC and U. of Redlands) and this may be more accurate than measuring focal animals.
A serious bias of inability to detect tortoises on the transect line does exist, but this failure can beestimated in relation to effort. One way would be to use the removal factor from the secondobserver as a correction factor. A suggestion was made to change the DS technique and remove thethird pass from the methods. There would be one pass with a leader and a follower would providedata for a correction factor. By not doing the zigzag pass, burrow detection may be lost.
Someone suggested creating a combined estimator of G0. For example use burrow density,probability of burrow occupation, and tortoise sightings to model the probability of activity.
A suggestion was made that human behavior affects the detection rate of Styrofoam tortoises.Detection of styrotorts may be different from live tortoises because they are sedentary and may becamouflaged by differences in habitat.
A proposal was made that transects should be run a different way. In particular, a team would walkuntil a tortoise was found, and then a density estimate could be made for each transect using Pafrom the training classes. Currently transects are a fixed length (whether tortoises found or not) andmany transects produce no tortoises. Each transect would be done the same way so that variancewould still exist, but not be ignored as is currently. This would be a logistical problem becausesometimes great distances are required to find one tortoise.
A rebuttal to this proposal was that the focus was on bias, and to detect trend bias is not crucial. Thesuggestion was to use training as a covariate in analysis. Fuse data within teams and then adjust forteam variation with each team Pa. If only 1 pass were done per transect, more transects could bedone per team.
Long-term Study Plots
Argument for stopping the use permanent plots for population estimation:o Choice of plots was not hypothesis driven and not random.o There is a mixed bag for temporal spacing of plot sampling, and possibly not enough
sensitivity to detect changes
Argument to retain permanent plots to use for population estimation:o Long- term capture/recapture data from plots has the tremendous potential for looking
mechanisms of trends and asking size-class survivorship questions.o A suggestion was made for gridding plots and parsing out data from individual grids for
analysis. There would be more power to determine which threats are causing. The raw datawould be necessary for this type of analysis
A time-trend analysis of plot data was done by Nussear to determine if plots show trends over time.Different DPS scenarios that have been discussed were used. After controlling for site and lookingfor a year affect, trends were only noticeable in the West Mojave using the current recovery unitscenario, the genetic hypothesis scenario, and the genetic and ecological scenarios.
Status of current monitoring for desert tortoises

DTRPAC Report page 214
Experiments to test pre and post management actions have not been done. There was an eight-yearstudy on the effect of road management, which found that fencing did decrease the occurrence oftortoise road kill along highways. However, there are many actions, both active and non-intervention, that need to be assessed.
Some habitat and threats data are available to extend the scope of current analysis. Althoughtemporal differences in vegetation data may cause trouble, those data are collected in the same yearof tortoise data.
Advice and observations about population monitoring (density) from invited experts
• There is value in a top-down organization to monitoring to have a formalized process for datacollection. Standardized data collection and data sharing allows collaboration so that meta-analyses can be done. All parties involved should have an agreement for data sharing/pooling.There should be external peer review by an independent panel of experts that is hired to analyzeand error check data. This type of process is being used with the CA spotted owl.
• There is value in permanent study plots if you can use the data more fully. However this value isbased on the availability of raw plot data.
• Without the ability to pool data from all areas, plot data are not useful. It is difficult to justifyamount of money spent on data collection from plots without having open access to the fulldata set.
• There was a suggestion to force inter-agency coordination to acquire all necessary data foranalyses.
• Work on modifications to DS to get most precise estimates possible. This includes usingdifferent detection rates and different groups of covariates in models of population density.
• Determine the maximum growth or decline potential for which there is enough power to detectthe trend. Given the best of all worlds, is there power to detect a certain level of decline?
• Perhaps try the % area occupied method discussed in MacKenzie et al. 2002.
• Use a suite of methods to detect change at different scales.
• One possibility is to choose five or so key permanent plots to sample annually and abandon thesampling of all other plots.
• Assuming DS cannot be done well enough (lack of power) to track an increase, put effort intodetecting decrease by tracking carcass and track die-offs for management purposes. Thedownside to this suggestion is that by the time a decline may be noticed, it may be too late.
Points on which there was consensus for population monitoring
o Continue to model and analyze what the maximum likely growth rate of the population isand that given the variance in data; there is enough power to detect it. The same applies to adownward trend. All possibilities have not been exhausted. There is need to determine howsubtle of a decline can be distinguished past zero. In essence, what is the minimum target

DTRPAC Report page 215
resolution we think is important to aim for to achieve power? Based on natural variation,when should there be an alarm?
o If density cannot be measured, determine what methods can be used to detect an alternativemeasure, such as population contractions, food availability, or increasing or decreasingthreats.
o Need a central repository for data and a formalized process for collaboration of datacollection. This includes sharing costs among agencies, having a means to certify theefficacy of data, providing a means by which all can access data, and that there be a meansby which USFWS can depend upon multiple approaches to data analysis so that they arealways aware of the status and trends of tortoise populations.
Habitat monitoring
Remote sensing and the Desert Tortoise
Mary Cablk (DRI) presented information on using remote sensing to monitor changes in habitat andthreats. Aerial photography, digital airborne data, and satellite data are all possible technologies tofill the remote sensing components of monitoring habitat. Mary described the data requirementsnecessary for remote sensing, as well as the necessary components for each type of technology.Mary emphasized the need for habitat monitoring experts to be working in the decision makingprocess. The types of habitat features that could be measured using remote sensing includevegetation association, slope, elevation, micro-conditions, elevation limits, geomorphology, andurban/agricultural land. Once tortoise experts have determined the features that are important tomeasure, the features must be linked to data and the spatial, spectral, and temporal resolutionshould be determined. Using these steps, it would be more likely to capture what habitat really isand how to best measure it. Change detection and analysis would be used to determine seasonal orannual differences. Once habitat monitoring is established, links can be made between habitat andtortoise biology.
Habitat monitoring for Snake River Plain reptiles and Yellowstone Amphibians
Dr. Chuck Peterson presented new techniques in environmental mapping/modeling and habitatmodeling/ mapping. If key features can be identified, there is a possibility to model habitat. To lookat an environmental gradient, students in Dr. Peterson’s lab used important environmentalcharacteristics (e.g. temperature and moisture) to examine an environmental gradient usingprobability monitoring logistic regression, or a combination of both.
Another possible method for modeling and mapping habitat is to examine changes and variation inthe body condition of individuals. This could be a possible strategy for desert tortoise monitoring.Additionally, one can study the changes in occurrence, as well as temporal changes in spatialdistribution.
A comprehensive monitoring program allows biologists and managers to understand the dynamicsof a species fully. This type of program would include asking different questions on many differentscales, including the level of individual using an index of condition and the populations level.Measuring the condition of individuals is not separate from monitoring population size. A conditionindex may provide evidence for mechanisms behind changes in population size. For example, ameasure of condition could potentially link the risk of mortality to individual covariates. That risk

DTRPAC Report page 216
could help contrast between a stable and declining population. Using a more formalized monitoringstructures allows some pressure to be taken off density monitoring (i.e. density measurements arenot relied upon to answer all questions about a population). Each scale would have differentobjectives and a coordinated effort for addressing each. For example, following individuals(“sentinels”) could be used to determine extent of certain threats, but not to answer exhaustivequestions.
Friday, September 5
Continued discussion on population status from the August DTRPAC meeting
Ken Nussear presented an analysis on population density using data from permanent study plotswithin habitat and in protected areas. There is a noticeable loss of tortoises within West Mojave.The aerial extent of habitat is changing as a result of a range wide loss of habitat. The DTRPAC isaiming towards a statement of concern over entire range, but heightened concern in West Mojave.This may lead to a change in listing from threatened to endangered in some areas due to dramaticdensity declines and loss of habitat. The recommendations still require additional steps, such ascontinued discussion of DPS designations.
Summary of monitoring discussion
With respect to density, there needs to be a more assertive attempt to develop a centralizedprogram, which would include using an outside panel of analysts with expertise to determine howdata should be collected and used. There was an explicit agreement that a density assessment is notuseful if it is not a centralized program that provides USFWS with all the information needed tomake informed decision. The program should be rigorous and formal, possibly having agenciescontribute to one sum of money that would be distributed after there is consensus on monitoring,data standards, etc. Lack of coordination is currently a limiting factor; however, it will be difficultto have everyone agree if DPS designations are agreed upon. There was a suggestion to havecommunal funding be designated by DPS, but data collection be standardized.
ACTION ITEM: Ask Barry Noon for documentation on the structure of the Californiaspotted owl data collection program and other collaborative efforts. This information willhelp the DTRPAC to make a recommendation based on the documented successes ofanother program. List successes of this type of collaborative program and how the successtranslated into the recovery of the species. Provide examples of benefits of the collaborativeeffort for the agencies, scientists, and species.
There has been a lack of implementation of the 1994 Recovery Plan and a collaborative programmay remedy that problem. There was a suggestion that the DTRPAC’s goal should be an outline foran integrative, collaborative, rangewide program (i.e. comprehensive multi-scale approach to amonitoring program, including the aerial extent of population, density of populations within aerialextent, qualitative and quantitative gain/loss habitat, quantitative direction of threats, and acondition index of individuals as an indicator of the population).
Dr. Sedinger advised the team to refine distance sampling and continue collecting data using thesame technique (e.g., other potentially important information could be taken as part of the protocolsby technicians conducting distance sampling transects). Currently, observers are not monitoringrainfall, vegetation, etc. Habitat monitoring was not described in the 1994 Recovery Plan.
DTRPAC Report page 217
There was a suggestion for DTRPAC to assess current monitoring techniques, and makerecommendations on how to improve current monitoring, including the use of new techniques andapproaches as well as monitoring more different things.
A suggestion was made to regard density estimates as a “density indicator” instead of working toimprove distance sampling to improve the accuracy density estimates which may have limitations.By calibrating technicians using styrotorts to calculate detectability, Pa could be modeled, and thefocus could focus on improvements in monitoring.
There was a discussion on the potential goals of the multi-scale monitoring program. The followingwas a possible list of goals:o Monitor to accumulate indicators of ability to delisto Monitor to inform adaptive management (failure/success)o Monitor the success of management actions (i.e. hypothesis-based monitoring)
Approach monitoring in a hierarchical fashion
There was a question about the usefulness of developing a bodily condition index for individualdesert tortoises. A condition index might help biologists to mechanism contributing to populationdynamics. In snakes, there is a correlation for body condition and reproductive fitness.
ACTION ITEM: Bridgette Hagerty will work with Dr. Peterson to provide references onexamples of measuring body condition.
What are the possible goals for monitoring?
6. To have viable wild populations distributed in each DPS (protect natural processes) and topreserve the diversity (genetic, ecological, behavioral, morphological) of the Mojavepopulation
a. Are there enough tortoises necessary to be self-sustaining currently?b. Is 50% for 500 years the best way to reach this goal? Do we use the existing PVA or
make a more definitive statement?c. Increase tortoise populations in each DPS to reasonable levels to avoid an Allee effect.
Tortoise was listed because of downward trends due to threats, not as a result of lowpopulation numbers.
7. Determine why tortoise populations are threatened.a. Loss of quality and or quantity of habitatb. Direct threats creating mortality
8. Measure the success or failure of management actions
There was a discussion on no-net-loss or fragmentation of habitat. If you increase new breedingpopulations that are isolated, that is technically increasing fragmentation, though it can be perceivedas a good thing. Would no net loss of individuals or habitat be enough in each DPS? Currently, thiswould not be considered enough to delist a DPS.
Is it necessary to generate a new hypothesis because the old delisting criteria are unable to bemeasured? The original prescription was to have a 1,000 square mile reserve protected and have atleast 10 tortoises per square mile within that reserve. If populations dropped below these numbers,there was a dangerous probability of an Allee effect and a resulting extinction vortex.

DTRPAC Report page 218
Discussion of the original delisting criteria
The recovery objective is the recovery and delisting of Mojave population of desert tortoise. Toconsider the population recovered, all criteria must be met.
Criterion 1. As determined by a scientifically credible monitoring plan, the population within arecovery unit must exhibit a statistically significant upward trend or remain stationary for atleast 25 years (one desert tortoise generation).
Possible changes to this criterion
o The terminology remain stationary does not work well for most of the DPS.o The criterion needs refinement because wording only refers to population size and not to
habitat and threats.o Include (a) monitoring of habitat, (b) threats, (c) aerial extent
o Revise Appendix Ao Consider multiple scales (population, landscape, individual content)
o Provide examples. These are the types of things to consider (e.g. body conditionindex)
o Presence/absence of individuals in critical habitat (ability to determine suitability ofhabitat; spatial framework)
o Define relationships between componentso Include power and statistical analysis (evaluate the probability of both type 1 and
type 2 errors)o Include language such as a “High powered test that fails to detect decline, or a statistical
test that detects an increase.” In those areas having lower densities, it will be easier to seean increase statistically. Areas with very low densities will require intense management toincrease population size and should produce a noticeable increase.
o Use experimental management to test management actions.
Criterion 2. Enough habitat must be protected within a recovery unit, or the habitat and thedesert tortoise populations must be managed intensively enough, to ensure long-termpopulation viability.
o Perhaps there are more ways to use available data.
Criterion 3. Provisions must be made for population management at each DWMA so thatpopulation lambdas are maintained at or above 1.0 into the future.
o Long-term population management is needed
Criterion 4. Regulatory mechanisms or land management commitments have beenimplemented that provide for adequate long-term protection of desert tortoises and their habitat
Criterion 5. The population in the recovery unit is unlikely to need protection under theEndangered Species Act in the foreseeable future. Detailed analyses of the likelihood that apopulation will remain stable or increase must be carried out before determining whether it isrecovered. (a) fluctuations in abundance, fecundity, and survivorship; (b) movements of deserttortoises within the area and to or from surrounding areas; (c) changes in habitat, includingcatastrophic events; (d) loss of genetic diversity; and (e) any other threats to the populationwhich might be significant.
o Wording in this criterion needs to be revised.

DTRPAC Report page 219
Possible changes to Delisting criteria:
o Make recommendations to have specific criteria for each DPSo Have headings for criteria (i.e. MANAGEMENT)o Perhaps use a different criterion for density (e.g., not trends in population size)
Recommendations for monitoring
o Change DISTANCE software to incorporate differences in G0 – this might require writingour own software
o Continue to use transects sampling as these data are extremely valuableo Data collection for habitat monitoring should occur simultaneously with population
monitoring or in parallel.o Condition measurements of individual tortoises need to be developed. The condition index
of Nagy is not considered to be reliable insofar as that index can be biased by amount ofwater in the bladder which can amount to nearly 50% of body mass.
o Assess the extent to which presence/absence data could be useful to the goals formonitoring.
o Perform research to reduce variation in different types of population estimates fromtransect data (may or may not be distance sampling).
o Have tortoise trackers perform ground truthing of habitat variables, if remote sensing isused in monitoring.
o Habitat monitoring should measure rainfall, vegetation, etc.o Assemble a workshop to discuss habitat monitoring (experts on tortoise habitat, image
analysts, GIS analysts, ground truthing)o Threat monitoring needs to be hypothesis driven to measure success of management
actions.
Comments from stakeholder visitors
There was a comment concerning future scenarios of cultural changes that will be occurring intortoise habitat over the next 25 years. This should be considered when designing reserves andmanaging DWMAs. Changes include increase in the human population and climate change.
There was a concern expressed that using buffers around features in the environment as criteria forselecting points for distance sampling transects reduces the amount of information that could becollected (e.g. effects of roads).
Preparation for the October 2-3 meeting in Tucson, AZ
October 2
DPS designation wrap up, (morning session)There will be a discussion to finalize recommendations for DPS designations.
ACTION ITEM: Dr. McCoy, Dr. Morafka, Dr. Delehanty, and Dr. Tracy will provideappropriate references for discussion prior to the meeting.

DTRPAC Report page 220
Research needs, (afternoon session)This has been discussed at previous meetings. The team will revisit areas of lack of knowledge andmake a new list of research for the next five years.
ACTION ITEM: Each team member should come with suggestions for new researchneeds or emphasis on old research needs that have not been done (i.e. gaps in knowledge).
ACTION ITEM: Dr. Boarman will do an analysis of what kinds of research have beendone since the recovery plan using desert tortoise council symposia and publications.
October 3
Conservation planning, (morning session)Representatives who are familiar different conservation plans (Larry Foreman, Lewis Wallenmeyer,Ray Bransfield, Ann McLuckie, Becky Jones) will be invited to discuss the status ofimplementation of the recovery plan (pg 55). They will be asked to report on the number ofmanagement issues that have been addressed in each conservation plan.Dr. Heaton will present what management actions have been done so far for each management unit,using the spreadsheet put together by Roy Averill-Murray. Inconsistencies in the wording of therecovery plan for management actions will be addressed. Revisit to make recommendations on howto deal with this problem of diverting attention to one threat.
Managers will have time to react to what the team has discovered thus far.
John Hamill will make a presentation on the DMG recovery proposal.
ACTION ITEM: DTRPAC should read the conservation-planning section of the recoveryplan and be prepared to make recommendations for plan (adaptive management).
Preparation for DTRPAC presentation to the MOG on September 24th
A task described for the DTRPAC was to update the Desert Management Group and theManagement Oversight Group on the process and progress of the committee. There will be ameeting of the MOG for this specific purpose on Wednesday, September 24 from 10am to 3pm inthe Sun Coast Casino in Las Vegas, NV. In addition, there will be a presentation on the Diseaseworkshop. There will be a presentation on how members of the DTRPAC were chosen and how isthe team approaching the assessment. All stakeholders are invited and will be asked to bringinformation and will be permitted to ask questions. There was also a suggestion to havepresentations from stakeholders that have been regular observers of the meetings to provide adifferent perspective to the group.
The script:
Dr.Tracy: Introduction, Overview, and Summary of DPS discussion
Dr. Heaton: Importance of spatially explicit modeling in the process up to this point. How GIShas been used in committee processes and how it can be used in future recovery efforts (e.g.looking at threats in a quantitative way)
Dr. Boarman: Threats overview

DTRPAC Report page 221
Averill-Murray: Involvement by a state agency (UT/AZ involvement) and the importance ofprocess to states represented, importance of data sharing and standardized data collection
Tracy, Medica, and Nussear – Data collection, historical data, and analyses being done to usehistorical data (plots, distance sampling, total corrected sign), Improvements in distancesampling
Meeting participants
C. Richard Tracy, UNREarl McCoy, USFPhil Medica, USFWSRoy Averill-Murray, AFGBob Williams, USFWSKen Nussear, UNRBill Boarman, USGSDave Delehanty, UIJill Heaton, U. RedlandsBridgette Hagerty, UNRRich Inman, U. RedlandsJohn Hamill, DOIClarence Everly, DOD
Jim Sedinger, UNRSteve Corn, USGSBarry Noon, CSUChuck Peterson, ISUJ. Michael Reed, Tufts U.Mary Cablk, DRILewis Wallenmeyer, Clark CountyJohn Willoughby, BLMRon Marlow, UNRAnn McLuckie, Utah DOWBecky Jones, CFGBryan Manley, representing Quad StateCoalitionRay Bransfield, USFWS

DTRPAC Report page 222
Desert Tortoise Recovery Plan Assessment Committee MeetingOctober 2-3, 2003Inn Suites HotelTucson, AZ
Thursday, October 2
Briefly discuss outcome of September 24th MOG meeting
Bob Williams (USFWS) provided some feedback on the DTRPAC presentation at the ManagementOversight Committee on Wednesday, September 24th. The following were presentations given byDTRPAC members:
Dr. Tracy introduced the DTRPAC process, including team members, expert guests, andmeeting topics.Roy Averill-Murray discussed the importance to state agencies in the process and theimportance of data sharing.Dr. Boarman explained the DTRPAC approach to threats and emphasized interactivethreats.Dr. Heaton highlighted the use of new technologies and its importance to the DTRPACprocess.Phil Medica presented distance sampling data and methods.Ken Nussear provided some preliminary results, including downward trends in the WesternMojave, using new analyses. Ken highlighted the team’s effort to use all available dataincluding plot data and distance sampling data in new ways to make recommendations.
After the presentations, the DTRPAC members present formed a panel to answer any questions.Stakeholders and agency representatives offered both compliments and constructive criticism to theDTPRAC process and preliminary results. A summary of the presentations given at the MOGmeeting will be made available on line.
Dr. Heaton gave an overview of the analyses that were presented at the MOG meeting. A kernelanalysis was rerun using a combination of total corrected sign (TCS) and distance sampling (DS)data (1998-2003) to better represent areas where it is known that there are live animals. With bothdata sets, there is a suggestion that the DTNA is no longer attached to the remainder of theFremont-Kramer DWMA. This area is void of evidence of tortoises, but does contain carcasses. Ifthis small area of DTNA has been fragmented, it poses conservation biology concerns. Theseresults are dependent on the size of the areas used for the analysis. Using smaller sampling areas forthe analysis makes the results more conservative. In addition, a cluster analysis was done using thesame combined data sets. The results suggest that there is a problem where there only appears to beclusters of carcasses, but not live animal clusters.
A question was raised about how to include cumulative and synergistic effects in the writing of arecovery. There was a suggestion that there should be a focus on practical considerations. TheDTRPAC should make recommendations that translate expertise and data into possible prioritiesfor management actions. For example, although there are many connected threats, roads are a threatthat is associated with many other threats. If the DTPRAC were to identify correlative effects, theycould create groupings of effects that would work as a whole. A goal of the DTPRAC should be toidentify isolated and correlated threats. One possible mechanism for doing this would be a risk
DTRPAC Report page 223
analysis using best available information. The result would be a correlation matrix or network. Thecorrelation matrix could be used to support recommendations for management actions.
Unfortunately it is difficult to difficult to control one threat experimentally and come up with a datathat tests multiple threats occurring simultaneously. However, it might be possible to introducehealthy headstarted animals in experiments in areas were there no longer appears to be tortoises.
If the DTRPAC can provide a framework for how threats are interrelated, including recovery unitspecific arrays of most probable threats and most probable interaction arrays, the new recoveryteam can determine the most worthy hypotheses to test. Although there may not be homogeneitywithin DPS units, it may be possible to use experimental management units to test hypotheses.There was a note to reemphasize hypothesis testing in DTRPAC recommendations.
There was a discussion about what is meant by “control access.” Although it is outside the scope ofthe DTPAC to provide all the features of a definition for this term, there is a need to be precise sothat the new recovery team will have enough information.
Revisit DPS designations
A draft manuscript describing the DTRPAC DPS recommendations (written by Morafka, Murphy,McCoy and Tracy) was distributed to the DTRPAC for review. The take home message of thedocument is that the most supportable way to delineate DPS unit is the use of genetic information.In order to make designations based on ecological differences, etc. more concrete information isrequired. In the case of the Mojave population of the desert tortoise, the genetic model alonesuggests that the Upper Virgin River is justifiably different as a DPS. The West Mojave isgenetically similar to the Eastern and Northern Colorado units. Using mtDNA, Britten et al (1997)suggests that the Northeastern Recovery unit should be split between North and South of LasVegas. Nuclear DNA was not used in the analysis, so further resolution is necessary. However,there is enough information to recommend a first separation of the Recovery Unit. The genetic DPShypothesis includes four units: Upper Virgin River, West Mojave, North Las Vegas, and South LasVegas. Further delineation of the West Mojave DPS is warranted based on ecological information(e.g. differences in rainfall east and west of the Baker sink, and in threats). This information may beenough to justify the West Mojave to be separated from the Eastern and Northern Colorado unit.Currently, there is not enough information to distinguish between the Northern and EasternColorado Units.
Discussion to finalize recommendations for DPS designations
The possible environmental correlates to justify DPS designations have the least justification;therefore, more information from the literature is necessary. For example, direct life historycharacteristics and environmental correlates have been demonstrated for similar herbivorous desertspecies (chuckwalla). There is literature that suggests tortoises have differences in body growth eastand west of the Baker sink. Differences in reproduction in east vs. west, which can be correlated torainfall, have also been demonstrated, though this data has not been published and there may be asimilar problem with acquiring access to the necessary data. Work by Turner and Henen suggestthat clutch size declines in drought years. Therefore, there is a current working hypothesis to splitthe West Mojave from Eastern and Northern Colorado using geographical discreteness east andwest of the Baker sink. Currently, there is not enough information or justification to separate theEastern and Northern Colorado into two DPS units. The genetic similarity in the West Mojave,Northern Colorado and Eastern Colorado possibly suggests that these populations were a relativelyrecent extension of the desert tortoise range.

DTRPAC Report page 224
A question was raised regarding the affect of humans moving tortoises on genetic variation. Thishas occurred on a very short time scale and with a small number of individuals, so the effect isprobably minimal.
Discuss listing status recommendations for DPSs
As a result of the data analyses that have been done during the DTRPAC process, the DTRPAC isconsidering elevating the West Mojave DPS to endangered status.
What is the difference between threatened and endangered status?Endangered status
Makes jeopardy decisions possibleChanges public opinionNo 4D rule, which concerns exemptions on takeTakes 30 days longer to get a permit
The West Mojave desert tortoise DPS has all the elements of an endangered species (five criteria insection 4 of the ESA):
Loss of habitatOver utilization for commercial, recreational, scientific, or educational purposesDisease or predationThe inadequacy of existing regulatory mechanismsOther natural or manmade factors
Bob Williams suggested using the example of the delisting of the Columbian white-tailed deer as away to proceed with the desert tortoise.
Discuss required management actions and monitoring for each DPS
What are the management issues associated with individual DPS units?DPS units have cross-state boundaries.In the proposed South Las Vegas DPS, there would be only one DWMA in IvanpahValley/Shadow Valley. This DWMA is approximately 1000 mi2. There would be noDWMA in Nevada.
What should be measured and what should the criteria be for each DPS?
The following were suggestions of what should be measured and what criteria should be used foreach DPS:
Biologists must address population growth because ESA protection is ultimately ademographic issue. If researchers can monitor reproduction, mortality, age class structurein plots within each DPS, tentative answers for population growth can be realized in thelong-term. If the desert tortoise is a cycling species, there may only be an average value forpopulation growth over a long period of time.Measure response to mitigation in threats and habitatImprove upon power in analyses

DTRPAC Report page 225
A discussion on original delisting criteria was revisited. In order to detect an upward or stationarytrend, researchers will monitor changes in habitat and threats. Monitoring should also provideevidence of the efficacy of management actions in relation to threats and habitat. If individualcondition cannot be linked to demographic population parameters, then the data do not provideevidence of recovery. Additionally, the population may still be declining, but condition may not beable to predict the downward trend. By sampling at multiple scales, it would be possible to see aseries of indications of recovery after different amounts of time. The quantitative criterion forhabitat protection is long-term population viability.
Repatriation may be a valid consideration in certain DPS units. Currently there is a proposal forrepatriation as an experiment to determine mechanisms for population decline. The design usesadults and juveniles as a diagnostics for determining the effects of threats.
ACTION: Dr. Heaton will provide a copy of Dr. Morafka’s repatriation proposal to help in writingthe report.
What differences should there be in monitoring for each DPS?
There was a suggestion to add plots to certain DPS units where there are not enough points. Thereshould also be changes in the sampling rotation so that representative plots from each DPS aresampled annually. There were noted reservations about continuing to use permanent study plots forthe same purpose as distance sampling, although plots provide other information in addition todensity estimates. However, it was also noted that if each type of monitoring has a different flaw,then there is value in using both methods. It was suggested that the DTRPAC should providerecommendations for types of monitoring to use if there is unlimited funds, and if there are limitedfunds.
What are the required management actions for multiple, synergistic, and cumulative threats?
The DTRPAC should recommend that the next recovery team build a management prescription perDPS. The DTRPAC should plot the strategy, not provide individual recommendations.
Review of research prescribed in 1994 recovery plan and what has been published in theliterature
Dr. Boarman provided a review of the research recommendations in the 1994 recovery plan as wellas the type of research that has been presented at Desert Tortoise Council Symposia, Internationalsymposia, and in Chelonian Conservation and Biology.
The following were the general research recommendations in the recovery plan:Density – a recommendation to collect baseline data on density and distributions and to testthe replicability and accuracy of density estimate methods
o Dr. Boarman noted a disproportionate number of baseline monitoring studiesDemography – a recommendation to produce a model for epidemiology and populationstructure (demographic and genetic).
o Dr. Boarman noted that there were more papers on population structure (genetic) orbroad geographic patterns with morphology
o There were no papers comparing mortality and epidemiology.

DTRPAC Report page 226
Impacts – a recommendation to perform long term studies to determine demographicimpacts of grazing, road density, barriers, human-use levels, restoration, augmentation, andtranslocation.
o Dr. Boarman noted that there were more papers on translocation and grazing.o Other papers focused on fire, roads, and OHV. Most papers only provided
inferential and correlational data.Protective measures – a recommendation to determine the effectiveness of DWMAs.
o Dr. Boarman cited the study comparing populations within and outside the DTNA.A study also determined the effectiveness of fencing.
Climate and Plants – a recommendation to study the spatial variability in climate andvegetation productivity, and how that affects demography.
o Typically these studies are not tortoise literature, so a fair assessment has not beenmade.
Nutritional ecology – a recommendation to study nutritional ecology and how it affectssurvivorship.
o Dr. Boarman noted that papers focused on tortoise diet and its effect on physiology.Reproductive physiology
o There have been studies on clutch size and temperature dependent sexdetermination.
The following were non-recovery plan topics that have been studied since 1994:Disease and health – mostly status, etiology and pathology, not affects on demographyHabitat and fire – weeds and fire ecologyPopulation and behavior – juvenile movements and home rangeHabitat characteristics – burrow characteristics, hibernation (mostly juvenile)Methodology – ELISA methods for disease, putting transmitters on tortoises
The following are successes in terms of what has been covered that was recommended in therecovery plan:
Physiology, nutrition, and reproduction – 24%Density and status – 13%Impacts - 10%Topics not listed in the plan (disease - 17%, and fire ecology – 8%)
The following are failures in terms of the recovery plan:EpidemiologyMortality (underestimated) and no relative proportions of causes of mortalityImpacts including roads, barriers, human-use, restoration, augmentation
These downfalls can be explained by failures of management and lack of publishing.
The following are research needs to be addressed in the future:Demography – age-specific survivorship (juveniles) and age-specific fecundityEpidemiologyImpacts – particularly road densitiesEffectiveness of actions - signal of failure of management agencies
NOTE: There was a suggestion to evaluate the effects of road density by looking at the clusteringof live and dead animals and its correlation to road density. This analysis could be finished by theend of the year.
DTRPAC Report page 227
Discuss gaps in research (on a per DWMA basis)
The following is an evaluation of research in terms of answering questions important to the species:
3.a. Baseline data on tortoise density both inside and outside DWMAs –Comments: The term baseline was used because the intention was for comparisons to be
made inside and outside of DWMAs. The term baseline is no longer appropriate. In addition, thewording should be changed managed and non-managed areas. Differences between these areasshould be assessed with hypothesis driven testing.
3.b. Develop a comprehensive model of desert tortoise demography in the Mojave regionand within each DWMAComments: This research need has not been fulfilled due to failures of technology and the lack
of necessary data. This model should be broken down into manageable component parts. Forexample, each component would be a different size/age class. This need should also include aspatial and temporal natural change component. This research need emphasizes the need for datasharing, appropriate statistical consultation, and accountability.
3.b.2. Research of sources of mortality and their representation of the total mortality,and including human natural predation, diminishment of required resources
3.b.2a.Initiate epidemiological studies of URTD and other studies
3.b.3 Research recruitment and survivorship of younger age classesComments: Researchers should focus on understanding population structure, including the
spatial scale of both genetic and demographic processes. In addition, studies should be done todetermine the extent to which DWMAs and recovery units to conform to natural populationsubdivisions.
Additional comments on the organization of 3.b.:Research sources of mortality (including disease), fecundity, survivorship, recruitment,migration for a demographic model
o Include Recruitment and mortality by stageo Include fecundity for whole systemo Suggestions to use the Lefkowich modelo Incorporate differences between age, stage, and sizeo Include possible differences between individual DPS unitso Suggestion to include density in the model?
3.c Long term research on impacts of grazing, road density, barriers, human use levels,restoration, augmentation, and translocation.Comments: This particular research need should be separated into positive and negative
impacts (i.e. threats and effectiveness of protective measures). Therefore, restoration, augmentation,and translocation should be moved to 3.d. There was a suggestion to produce a new list of impactsto study based on the correlated clusters of threats. These research needs should also include aspatial and temporal component. Impacts should not be tested only comparatively (e.g. grazing/non-grazing). Research should also separate the effectiveness of a DWMA and the effectiveness ofindividual management actions. This is particularly important because management is notconsistent within or across DWMAs.
3.d Assess the effectiveness of protective measures in reducing anthropogenic impacts

DTRPAC Report page 228
3.e Collect data on spatial variability of climate and productivity of vegetationComments: The spatial component of this research need should spread to other
recommendations. There was a suggestion of include the impacts of global climate change in thisrecommendation. Another suggestion was to improve the wording of this section by including withand without threats. Modeling should be included in this section as well. This research need doesnot stand alone, and should be used for appropriate modeling and assessing threats in theappropriate contexts.
3.f Long-term research on the nutritional and physiological ecology of various age-sizeclassesComments: A good amount of research has been done in response to this research need.
However, there should be an attempt to link this research to threats.
3.g Conduct research on reproductive behavior and physiology, focusing on requisites forsuccessful reproduction
Comments: This research need should also be discussed in the context of understandingthreats.
ACTION – Dr. Tracy will develop a conceptual demographic model using ideas conveyed duringthis meeting.
What are the recommended additions to the research needs list?
1. Development of new technologies that will be important to studying tortoises in the futureRepair of technology challenged areas and improve survey techniques
o Harmonic radaro Hyperspectral imagingo Remote sensing and GIS
2. Threats to habitat and tortoises (i.e. invasion of weeds, etc.):Include integration of impacts of the threat to habitat and to tortoisesSeparate for direct and indirect threats
3. Habitat monitoring:Habitat modeling technology (including needed data) is a possibility to support research inhabitat monitoring over the long term.Provide specific ways to understand the mechanisms behind why tortoises exhibit changesin aerial extent.Provide a list of what is necessary to monitor habitat.
ACTION – Ken Nussear will draft the characteristics for habitat monitoring.
4. Target further delineation of DPS unitsBehaviorGenetics (nuclear DNA)

DTRPAC Report page 229
Friday, October 3
Presentation on the beginning of a correlation threat matrix
The DTRPAC used a rough draft of a correlation threat matrix, which was presented by Dr.Boarman and Dr. Heaton, as an exercise to tally how often different threats occur. Withoutstatistics, it is still possible to assign correlations between threats per DPS unit. The DTRPACshould be able to make recommendations on how to use this matrix per DPS. There was asuggestion to also include environmental stressors (uncontrollable environmental effects) to thematrix.
This matrix was presented in a flow chart format. The following is an example of how to follow theflow chart:Direct effects (crush, predation (ravens, coyotes, feral dogs), human removal, burning)anthropogenic effects that may cause these (construction, landfills, roads, non-motorized, grazing,mining). Note: These anthropogenic effects are in no particular order of importance.
The DTRPAC discussed the difference between direct and indirect effects. A suggestion was madeto instead look at the factors and changes harms tortoises (mortality, malnutrition, lowerreproductive fitness). There was a suggestion to collapse factors that have similar effects. Anothersuggestion was to give each effect an individual box (e.g. landfill). By counting the number ofarrows coming from each box, and the thickness or length of arrows (to emphasize magnitude ofthe effect), the strength and magnitude of correlation could be graphically represented. Othersuggestions included proposing a hypothesized mechanism to better support arguments, to showcorrelations in terms of the harm effect and spatial differences (geographically specific), and toinclude a hierarchical component that would show the outcomes for the population at the bottom ofthe diagram.
Time constraints may hinder the ability of the team to produce an entire matrix, however, the teamshould be able to put together a protocol on how to do this process for each DPS. This matrixshould focus on population, rather than individual effects. There was a suggestion to use brokenarrows when effects of a possible threat are unknown and where hypothesis driven experimentsneed to be done at the population level.One member noted the importance of recognizing that if direct effects are removed, indirect effectshave not necessarily been removed in space and time.
This type of diagram will emphasize the concept of addressing multiple threats simultaneously.These network diagrams will help tease out synergistic, cumulative effects of threats. In additionthe network should address within habitat effects (mortality and fecundity) and the effects of losinghabitat (absolute aerial extent). Providing a combination of this network and a list of threats foreach DPS to accompany the rhetoric of the report will fortify the DTRPAC’s argument for the“death of several cuts.”
ACTION – Dr. Boarman, Dr. Heaton, and Dr. Delehanty will continue to work on this network toinclude as a recommendation in the final report.
Research needs that resulted from this exercise:All threats need to be addressed at the population level. All explanations for this should include acommon sense scenario. For example, the Texas tortoise lives in a higher productivity area andreaches age of reproduction earlier. Therefore, the number of individual deaths can be high, and thepopulation will rebound more easily. However, the desert tortoise does not have these same life

DTRPAC Report page 230
history and habitat characteristics. As a result, the same amount of individual mortality may behaving a much more noticeable effect.
Presentations on conservation planning in CA, NV, AZ, and UT
Clark County Multi-Species Habitat Conservation Plan (MSHCP):
Ron Marlow presented on the Clark County MSHCP. In general, habitat conservation plans(HCPs), authorized under Section 10 of the ESA, allow parties to avoid prohibitions on take underSection 9 of the ESA. For the most part, HCPs are carried out on a small scale, and are concernedwith private parties. Clark County’s plan proposes to mitigate take on private land by managingpublic lands. The land was broken down into levels of management intensity. Intensively managedareas could be enhanced via payment to federal land managers to improve prospects of tortoisehabitat. For example, one action taken by Clark County was to purchase grazing permits, resultingin the elimination of most grazing. In addition, certain highways that were identified as threats totortoises were fenced as an MSHCP requirement.
In Clark County, take of desert tortoises occurs on private and public land. Funding forconservation is both federal and non-federal. The MSHCP has a broad base public support andrequires science-based adaptive management. This HCP has been viewed as an experiment todetermine if this type of process results in implementation of the recovery plan. In addition, theMSHCP is a test for land managers to determine if independent science and stakeholders can bothbe involved in the decision making process.
Requirements for Clark County in the HCP:Permit conservation actions – public information and education; tortoise pick up andholding; rehabilitation and enhancement of habitat; construction tortoise barriers;translocation; science based adaptive management
Requirements for research (tortoise only) – translocation, survivorship, density, and stress.
Law enforcement - ACEC protection and management, predator control, conservationeasement management, development of site conservation management plans
A question was posed as to whether the recovery plan should address efficacy of HCPs. Asuggestion was made to document advantages and disadvantages of how HCPs are beingimplemented in terms of the recovery plan.
A DTRPAC member asked how adaptive management has been working for the Clark CountyMSHCP. The process of adaptive management has just barely begun. Management is occurring onan action-by-action basis, and there is reluctance and resistance for cooperation between federalmangers and Clark County.
Washington County HCP
Ann McLuckie presented on the Washington County HCP. The county obtained an incidental takepermit in 1996 for over 1,000 animals and over 40,0000 known and potential tortoise habitat. TheRed Cliff reserve (60,000 acres) includes 38,000 acres of tortoise habitat. The reserve is dividedinto 4 different zones, which several contain human use levels, and a translocation site. The reserveis close to urbanized areas and is divided by a highway.

DTRPAC Report page 231
Reserve management:
Within the Red Cliff reserve, the following management actions have been taken:Grazing permits have been retiredHabitat acquisitionMajority of areas have been fenced (tortoise fencing, people-proof/dog-proof, range fenceto prevent OHVs)Public use plan has been designed (trails, signs, human use monitoring program)Multi-agency law enforcement to eliminate illegal OHV use, reduce vandalism, and reduceillegal collection.EducationTranslocation (Zone 4) - a short term study of the efficacy of translocation found it to be agood management toolPopulation monitoring – density and long term trends using distance sampling transects, inaddition to population structure, sex ratios, and survivorship estimates
The Washington County HCP has an adequate funding mechanism, a broad base of players, anda reserve design based on biology. However, the reserve currently faces multiple threatsincluding, drought, utility development and maintenance, habitat degradation and trailproliferation, and no forum for science-based adaptive management. As a result, concernsinclude, 1) the role of the technical committee is not well defined, 2) additionalpressure/impacts created on the other species and habitat outside the reserve, and 3) generalchallenges of managing an urban reserve.
California Conservation Plans
Ray Bransfield presented on three large planning efforts led by the BLM: 1) North and East Mojave2) North and East Colorado, and 3) West Mojave. The following chart summarizes the majorinformation on each plan.
North and East Mojave North and EastColorado
West Mojave
Status Records of decision Record of Decision EISLitigation Complaints filed Complaints filed ?DWMA Designated (BLM DWMAs
are not a 1000 mi^2)Designated Proposed
Vehicles Access Dual sport events are allowed in DWMAs – seasonal and only on roadsNo speed events in DWMAsRoute designation is complete and proposed in the Western MojaveTravel will be open in certain washesIn CA vehicles can travel 50 ft. from the center line to park, camp
Land Status Mostly federal Mostly federal 50% private(introduces level ofcomplexity)
Land fills Not allowed in DWMAsAgriculture Not allowed in DWMAsMilitary No habitat destructive military activitiesGrazing Willing seller – willing buyer close allotment (no sheep grazing)

DTRPAC Report page 232
Burros Management goal is zero burrosGuns Hunting per code and target shooting okRavens Target offending birds
Reduce and remove subsidiesEnvironmental assessment in preparationStart next springMore aggressive program in the West Mojave
Fence roads Discussion about fencing roads before projects; current FG policy is causing aslight problem
The following is additional information on the West Mojave Plan:The proposed DWMAs include almost all critical habitat.The BLM is proposing that no ground disturbance will exceed 1% within DWMAs;continual restoration of habitat will reduce the level of disturbance to 1%.General areas will also be protected for the Mojave ground squirrel, which will benefitdesert tortoises.Projects funds will be used to buy additional private land.Tortoises will not be collected prior to development; however, there will be a hot line tocollect tortoises during development actions.The West Mojave Plan is multi-species and will span several counties.
After the HCP presentations, the DTRPAC returned to the charge of the committee, which is toevaluate plan based on current knowledge of HCPs. There was a suggestion that HCPs should havean evaluative process by a science team. Additionally, hypothesis based research should be used toevaluate the successes and failures of HCP actions. The DTRPAC should highlight the need forconstant science review and make a recommendation for independent (outside) science review.Science should inform the initial decision to take a management action and then also evaluate theeffectiveness of the action. Moreover, for all large planning efforts, there should be arecommendation to build science review into the recovery plan for HCPs. In addition to sciencereview, there should be coordination among HCPs because of the large scale of these plans.Although each plan may be acceptable individually (compromises made in each), a comprehensivereview of all HCPs may reveal unsatisfactory levels of management.
Presentation on DMG recovery proposal
John Hamill presented on the Desert Management Group Proposed Recovery Action Program(RAP) and asked for a DTRPAC review of the proposal. There was concern that theimplementation of RAP may be premature before the review of the recovery plan was complete.Additionally, the DMG does not want actions to be inconsistent with the new recovery plan. Thefocus of this review is to determine if the RAP is consistent with best available scientificinformation and to ask for DTRPAC recommendations to improve the RAP.
Within CA, desert tortoise recovery is addressed by 10 plans. The geographic scope of the RAP isthe entire CA desert, and the program will be an integrated effort with the MOG.
The goal of the RAP is to reconcile compatible human uses and recovery of the desert tortoise. TheRAP is based of the principles of sound science, adaptive management, and stakeholderinvolvement. The DMG, which includes all principle land and resources management agencies, andthe Regional Executive Management Group will manage the program. These groups will sign an

DTRPAC Report page 233
MOU, work together on policy guidance, approve a work plan, and continue to engage in activecoordination.
The desert tortoise management framework will include public and stakeholder involvement in theform of NEPA compliance. The program will be based on the following basic foundation elements:1) annual work planning process to increase collaboration and be more cost effective, 2) sciencesupport to provide adaptive management standards and guidance, 3) data management, includingcentral data repository with appropriate protocols that will be coordinated with other states in therange, 4) desert tortoise monitoring, including a commitment to improve and continue distancesampling and to integrate distance sampling and study plots, and 4) education and outreach topromote individual responsibility for desert tortoise protection.
The first recovery actions that will be addressed by the RAP will be those that require interagencycoordination for effective implementation. These will include management of ravens, feral dogs,disease, head starting, and translocation. Each element will have identified areas of management.
The following were DTRPAC comments and clarifications on the CA RAP:
DTRPAC members emphasized the need for coordination both among government agencies andbetween states within the desert tortoise range.
Given the scope of the West Mojave plan, the RAP should work to provide coordinationwith range-wide plans. Additionally, USFWS should clarify how all plans shouldcoordinate.Collaboration will be necessary for head starting to avoid anecdotes dominating evaluationof successes or failures.Coordination, data sharing, regular science oversight, and scientific assessment ofeffectiveness are all key components to the success of the RAP.Focus on interagency coordination as the reason for the actions that were chosen
DTRPAC members also highlighted some possible changes for recovery actions.Specific techniques listed for monitoring should be able to be revised in the future.Disease should be studied in relation to how it will effect head starting and translocationConsultation with statisticians and expert in research design will be necessary to answerquestions for projects that have range-wide implications.Short-tem and long-term evaluation should be made explicit in all sections of the RAP.
ACTION: Dr. Heaton will present the outcome of the DTRPAC meeting at the DMG meeting onOctober 8th.
Outline of the DTRPAC report to the USFWS:
Introduction:Sections from the 1994 recovery plan that put forth a process for reviewing the plan every3-5 years (Tracy)Sections from the DTRPAC proposal on the process of recovery plan review (Tracy)The importance of turtles to ecosystems and some natural history (Morafka)The DTRPAC’s opinion of the original recovery plan and a synopsis on data collectedsince 1994 (types of data used, rate of change in publications, etc. (Boarman)Explanation of what the report is not
o Not a recovery plan,o Not a statement on political or social actions

DTRPAC Report page 234
o Not a generation of new data,o Not generated to perform new management actions)
Explanation of what the report is (a strategic overview, rather than a tactical overview)Acknowledgement of those who were invited speakers and experts (thank them as well)and non-team members who consistently came to meetings (managers, etc.), and those whoprovided data
Distinct Population Segments (changes to listings)Deemphasize old categories and emphasize new categoriesJustifications for the West Mojave including data on annual differences east and west of theBaker sink (rainfall and temperatures) (Tracy figure)Fortify West Mojave arguments with literature (Berry, Wallace, Germano, Weinstein)Maps for the old recovery units and the new recommended DPSs (Heaton)Revision of draft document by Morakfa, McCoy, and Tracy
Status and Trends (range wide assessment)Maps of all original plots, distance sampling transects, and TCS (Heaton)Analyses of plot data (Nussear)Kernel and cluster analyses – distance sampling and total corrected sign (refinement neededfor the West Mojave) (Nussear and Heaton)Table of Distance sampling estimates (Medica)Methods section about how data were acquired and cluster analyses (Heaton)Methods section on kernel and regression analyses (Nussear)History of distance sampling (Medica)History of permanent study plots (Murray)Spatial component of dataConventional status based on data and Organization of this section (Murray)
Threats and disease:Proper context of disease, modern thinking, cause and effect (McCoy)What is proper data collection on the population level for these issues? Capture differencesin effects on individuals and effects on populations (McCoy)Acknowledge tactical report that will be concurrent (Disease workshop)Multiple, interacting, and synergistic effectsNetwork diagram of threats (Boarman, Heaton, Delehanty)Distill Boarman Threats reportLead - Boarman and McCoy
Monitoring:Lead - Delehanty and TracyMultiscale monitoring approach (Peterson advice)Habitat, threats, and tortoise population monitoring
Planning and Coordination:Interface of Science and ManagementElements that should be included in HCPs and other conservation plans (Murray)
o Science based adaptive managemento Hypothesis-driven experiments to assess efficacy of management actions
Data sharing and outside scientific review (tie in information from other sections)(Delehanty)Recapture recommendations from other programs (spotted owl program) (Delehanty)

DTRPAC Report page 235
Lead – Murray
Research:Introduction to this section will be a summary of past research in relation to the recoveryplan (Boarman)Significant recommendations in the original recovery plan that have not been heeded(Boarman, Medica)Suggestion for a master plan of research – Florida example (McCoy and Morafka)Gaps in research from each section – each section writer will note research gaps for thissectionResearch needs from original recovery plan (DTRPAC checklist)Importance of interdisciplinary approaches and coordination (Morafka)
Summary of overarching recommendations:Recommendation for a new recovery teamChanges in the recovery planChange in listing of the West Mojave population (endangered status) and whyKeep a list of recommendations from each section
ACTION: Ken Nussear and Dr. Heaton will make sure that all maps will be put on the website forthe group to access while writing.
ACTION: As DTRPAC members make progress, they will email sections to all DTRPACmembers.
Preparation for possible November DTRPAC meeting and remaining tasksNovember 6-7th in Las Vegas, NV (Bob Williams will make meeting preparations.)
o Final wrap up and reviewing all writing sectionso If necessary, there will be a final DTRPAC meeting in San Francisco (Jan 12-13th).
Meeting participants:
C. Richard Tracy, UNRBridgette Hagerty, UNRKen Nussear, UNRDavid Delehanty, ISURoy Averill-Murray, AFGBill Boarman, USGSPhil Medica, USFWSJill Heaton, U. RedlandsEarl McCoy, USFAnn McLuckie, UFGRay Bransfield, USFWSDave Morafka, CA Academy of SciencesBrian Manly, representative for QUADClarence Everly, DODRon Marlow, UNRJohn Hamill, DOI

DTRPAC Report page 236
“IItt iiss tthhee ddeessiirree ffoorr eexxppllaannaattiioonnss tthhaatt iiss aatt oonnccee ssyysstteemmaattiicc aannddccoonnttrrooll llaabbllee bbyy ffaaccttuuaall eevviiddeennccee tthhaatt ggeenneerraatteess sscciieennccee;; aanndd iitt iiss tthheeoorrggaanniizzaattiioonn aanndd ccllaassssiiff iiccaattiioonn ooff kknnoowwlleeddggee oonn tthheeee bbaassiiss ooffeexxppllaannaattoorryy pprriinncciipplleess tthhaatt iiss tthhee ddiissttiinnccttiivvee ggooaall ooff tthhee sscciieenncceess..”
Ernest Nagel, The Structure of Science. (1961)

DTRPAC Report page 237
Literature Cited
Advantage Environmental Consulting. undated (1992). Desert tortoise monitoring study: VirginSlope trend plot. Report to Bureau of Land Management, Arizona Strip District, St. George, Utah.
Anderson, D.R., and K.P. Burnham. 1996. A monitoring program for the desert tortoise ColoradoCooperative Fish and Wildlife Research unit, Colorado State University, Fort Collins, CO. 15pp.
Anderson, D.R., K.P. Burnham, B.C. Lubow, L. Thomas, P.S. Corn, P.A. Medica, and R.W.Marlow. 2001. Field trials of the line distance method applied to estimation of desert tortoiseabundance. Journal of Wildlife Management 65: 583-597.
Allen, T.F.H. and T.W. Hoekstra. 1992. Toward a unified ecology. Columbia University Press,New York 384 pp.
Averill-Murray, R.C. 2002a. Reproduction of Gopherus agassizii in the Sonoran Desert, Arizona.Chelonian Conservation and Biology 4: 295-301.
Averill-Murray, R. C. 2002b. Effects on survival of desert tortoises (Gopherus agassizii) urinatingduring handling. Chelonian Conservation and Biology 4:430-435.
Averill-Murray, R.C., B.E. Martin, S.J. Bailey, and E.B. Wirt. 2002a. Activity and behavior of theSonoran desert tortoise in Arizona. Pages 135-158 in T.R. Van Devender (ed.), The Sonoran DesertTortoise: Natural History, Biology, and Conservation. Univ. Arizona, Tucson.
Averill-Murray, R.C., A.P. Woodman, and J.M. Howland. 2002b. Population ecology of theSonoran desert tortoise in Arizona. Pages 109-134 in T.R. Van Devender (ed.), The Sonoran DesertTortoise: Natural History, Biology, and Conservation. Univ. Arizona, Tucson.
Avery, H.W. 1997. Effects of cattle grazing on the desert tortoise, Gopherus agassizii: nutritionaland behavioral interactions. Proceedings: Conservation, Restoration, and Management of Tortoisesand Turtles - An International Conference, pp. 13-20.
Avery, H.W. 1998. Nutritional ecology of the desert tortoise (Gopherus agassizii) in relation tocattle grazing in the Mojave Desert. Ph.D. Dissertation, University of California, Los Angeles. 158pp.
Avery, H. A., and Neibergs, A.G. 1997. Effects of cattle grazing on the desert tortoise. Gopherusagassizii: Nutritional and behavioral interactions. In Van Abbema, J. (Ed.). Proceedings:Conservation, Restoration, and Management of Tortoises and Turtles—an InternationalConference. July 1993. Purchase, New York: New York Turtle and Tortoise Society and the WCSTurtle Recovery Program, pp. 13-20.
Avise, J.C. 2000. Phylogeography: The history and formation of species. Harvard University Press,Cambridge, Mass.
Badalamenti, F., A. A. Ramos, E. Voultsiadou et al. 2000. Cultural and socio-economic impacts ofMediterranean marine protected areas. Environmental Conservation 27: 110-125.

DTRPAC Report page 238
Bashor, A.N. undated (1991). Desert tortoise population and habitat attributes on the Pakoon Basintrend plot, Mojave County, Arizona. Report to Bureau of Land Management, Arizona Strip District,St. George, Utah.
Berry, K.H., 1974. Desert tortoise relocation project: status report for 1972. California Departmentof Transportation: 104pgs.
Berry, K.H., 1975. Desert tortoise relocation project: status report for 1973. California Departmentof Transportation: 38pgs.
Berry, K.H. 1976. Desert tortoise relocation project: status report for 1974. Division of Highways,Contract F-9353, 1-26.
Berry, K.H. 1979. State report–California. Bureau of Land Management. In: St. Amant, E. (Ed.),Desert Tortoise Council Proceedings, 1979 Symposium, Tucson, AZ. pp 83-87.
Berry, K.H. 1984. A description and comparison of field methods used in studying and censussingdesert tortoises. Appendix 2. pp 1-33. (In) K.H. Berry. (ed.) 1984. The status of the desert tortoise(Gopherus agassizii) in the United States. Report to the U.S. Fish and Wildlife Service from theDesert Tortoise Council. Order No. 11310-0083-81. March 1984.
Berry, K.H. 1986. Desert tortoise (Gopherus agassizii) relocation: implications of social behaviorand movements. Herpetologica 42: 113-125.
Berry, K.H. 1989. Report from the Desert Tortoise Natural Area and Surrounding Areas
Berry, K.H. 1990. Status of the desert tortoise in 1989: incomplete draft report, with marginalannotations for tables with 1990-1991 data sets for live tortoises. Bureau of Land Management,Riverside, CA. pp. 15-80.
Berry. K.H. 1992. Report to USFWS for scientific research permit LOA-Berry on the deserttortoise (Gopherus agassizii). Bureau of Land Management, Riverside, CA. pp. 2-3 (tables 1 and 2)
Berry. K.H. 1995. Report to Mr. Ray Bransfield, U.S. Fish and Wildlife Service, July 11, 1995. USDOI National Biological Service, Riverside, CA. (size class)
Berry, K.H. 1996. A summary of the changes in density of desert tortoise populations at thepermanent study plots in California, prepared for Ms. Molly Brady, Bureau of Land Management,October 1, 1996 (Revised). U.S. Geological Survey. Riverside, CA. pp 1-15.
Berry, K.H. 1997. Demographic consequences of disease in two desert tortoise populations inCalifornia, USA. In: Proceedings: Conservation and management of turtles and tortoises – aninternational conference, J. van Abbema (Ed.), New York Turtle and Tortoise Society, WestOrange, NJ. pp. 91-97.
Berry, K.H. 1999. Preliminary report from the 1999 Spring Survey of the Desert tortoise LongTerm Study plot in Chemehuevi Valley and Wash, CA. U.S. Geological Survey. Riverside, CA.September 30, 1999. (size class)
Berry, K.H., and M.M. Christopher. 2001. Guidelines for the field evaluation of desert tortoisehealth and disease. Journal of Wildlife Diseases 37: 427-450.

DTRPAC Report page 239
Berry, K.H., G. Goodlett, and T. Goodlett. 2000. Effects of geology and cover site choice on deserttortoise populations at the Tiefort mountains, California. The Proceedings of the Desert TortoiseCouncil 2000:5.
Berry, K.H., F.G. Hoover, and M. Walker. 1996. The effects of poaching desert tortoises in thewestern Mojave Desert: Evaluation of landscape and local impacts. The Proceedings of the DesertTortoise. Council Symposium. 1996:45.
Berry, K.H., D.J. Morafka and R.W. Murphy. 2002. Defining the desert tortoise(s): our first priorityfor a coherent conservation strategy. Chelonian Conservation and Biology 4: 249-262.
Berry, K.H., L.L. Nicholson, S. Juarez, and A.P. Woodman. 1986. Changes in the desert tortoisepopulations at four study sites in California. First draft.
Berry, K.H., and L.L. Nicholson. 1984. The distribution and density of desert tortoise populationsin California in the 1970's. Berry, K.H., The Status of the Desert Tortoise (Gopherus agassizii) inthe United States, Long Beach, CA: The Proceedings of the Desert Tortoise Council Symposium:26-60.
Berry, K.H., T. Shields, and C. Knowles. in prep. Changes in tortoise populations at the DesertTortoise Natural Area, Interpretive Center, and Fremont Peak study plots between 1970's and 1989.Bureau of Land Management, Riverside, CA.
Berry, K.H., E.K. Spangenberg, B.L. Homer, and E.R. Jacobson. 2002. Deaths of desert tortoisesfollowing periods of drought and research manipulation. Chelonian Conservation and Biology 4:436-448.
Berryman AA. 1993. Food web connectance and feedback dominance, or does everything reallydepend on everything else? Oikos 68: 183-185
Bjurlin, C.D. and J.A. Bissonette. 2001. The impact of predator communities on early life historystage survival of the desert tortoise at the Marine Corps Air Ground Combat Center, TwentyninePalms, California. U. S. Dept. of the Navy Contract N68711-97-LT-70023. UCFWRU Pub. # 00-4:1-81.
Boarman, W.I. 2002. Threats to desert tortoise populations: a critical review of the literature. U.S.Geological Survey, Western Ecological Research Center, Sacramento, CA.
Boarman, W.I. 2003. Managing a subsidized predator population: reducing common ravenpredation on desert tortoises. Environmental Management. 32:205-217.
Boarman, W.I. and B. Heinrich. 1999. The Common Raven. In A. Poole and F. Gill (eds.), TheBirds of North America, No. 476. The Birds of North America, Philadelphia, PA.
Bowles, A.E., S. Eckert, L. Starke, E. Berg, L. Wolski, and J. Matesic, Jr. 1999. Effects of flightnoise from jet aircraft and sonic booms on hearing, behavior, heart rate, and oxygen consumption ofdesert tortoise (Gopherus agassizii). AFRL-HE-WP-TR-1999-0170. Sea World Research Institute,Hubbs Marine Research Center, San Diego, CA. 131 pages.

DTRPAC Report page 240
Britten, H.B., B.R. Riddle, P.F. Brussard, R.W. Marlow and T.E. Lee, Jr. 1997. Genetic delineationof management units for the desert tortoise, Gopherus agassizii, in northeastern Mojave Desert.Copeia 1997: 523-530.
Brooks, M.L. 1995. Benefits of protective fencing to plant and rodent communities of the westernMojave Desert, California. Environmental Management 19:65-74.
Brooks, M.L. 1999. Effects of protective fencing on birds, lizards, and black-tailed hares in thewestern Mojave Desert. Environmental Management 23:387-400.
Brooks, M.L. 2000. Competition between alien annual grasses and native annual plants in theMojave Desert. American Midland Naturalist 144:92-108.
Brooks, M. L., and T.C. Esque. 2002. Alien plants and fire in desert tortoise (Gopherus agassizii)habitat of the Mojave and Colorado deserts. Chelonian Conservation and Biology 4:330-340.
Brown, D.R., I.M. Schumacher, G.S. McLaughlin, L.D. Wendland, M.B. Brown, P.A. Klein, andE.R. Jacobson. 2002. Application of diagnostic tests for mycoplasmal infections of the desert andgopher tortoises, with management recommendations. Chelonian Conservation and Biology 4: 497-507.
Brown, M.B., G.S. McLaughlin, P.A. Klein, B.C. Crenshaw, I.M. Schumacher, D.R. Brown, andE.R. Jacobson. 1996. Upper respiratory tract disease in the gopher tortoise is caused byMycoplasma agassizii. Journal of Clinical Microbiology 37: 2262-2269.
Brown, M.B., I.M. Schumacher, P.A. Klein, K. Harris, T. Correll, and E.R. Jacobson. 1994.Mycoplasma agassizii causes upper respiratory tract disease in the desert tortoise. Infection andImmunity 62: 4580-4586.
Brown, M.B., K.H. Berry, I.M. Schumacher, K.A. Nagy, M.M. Christopher, and P.A. Klein. 1999.Seroepidemiology of the upper respiratory tract disease in the desert tortoise in the western MojaveDesert of California. Journal of Wildlife Diseases 35: 716-727.
Bryan, T.R., and M.T. West. 1972. Survival of captive desert tortoises (Gopherus agassizii) afterrelease in the Mojave Desert. University of California Polytechnic, Pomona, California.
Buckland, S.T., D.R. Anderson, K.P. Burnham, and J.L. Laake. 1993. Distance Sampling:Estimating abundance of biological populations. Chapman and Hall. London. 446 pp.
Buckland, S.T., D. Anderson, K. Burnham, J.L. Laake, D.L. Borchers, and L. Thomas. 2001.Introduction to Distance Sampling: Estimating Abundance of Biological Populations. OxfordUniversity Press, Oxford.
Bureau of Land Management, County of San Bernardino, and City of Barstow. 2003. Draftenvironmental impact report and statement for the West Mojave Plan; a habitat conservation planand California Desert Conservation Area Plan amendment. Moreno Valley, San Bernardino, andBarstow, California.

DTRPAC Report page 241
Burge, B.L. 1977. Daily and seasonal behavior, and areas utilized by the desert tortoise, Gopherusagassizii, in southern Nevada. The Proceedings of the Desert Tortoise Council Symposium 1977:59-94.
Bury, R.B., and P.S. Corn. 1995. Have desert tortoises undergone a long-term decline inabundance? Wildlife Society Bulletin 23: 41-47.
Bury, R.B., and R.A. Luckenbach. 2002. Comparison of desert tortoise (Gopherus agassizii)populations in an unused and off-road vehicle area in the Mojave Desert. Chelonian Conservationand Biology 4:457-463.
Campbell, S.P., J.A. Clark, L.H. Crampton, A.D. Guerry, L.T. Hatch, P.R. Hosseini, J.J. Lawler,and R.J. O’Connor. 2002. An assessment of monitoring efforts in endangered species recoveryplans. Ecological Applications 12:674-681.
Caughley, G., and A. Gunn. 1996. Conservation Biology in Theory and Practice. BlackwellScience, Inc., Cambridge, MA. 459 pp.
Chan, N.Y., K.L. Ebi, F. Smith et al. 1999. An integrated assessment framework for climate changeand infectious diseases. Environmental Health Perspectives 107: 329-337.
Christopher, M.M., K.H. Berry, B.T. Henen, and K.A. Nagy. 2003. Clinical disease and laboratoryabnormalities in free-ranging desert tortoises in California (1990-1995). Journal of WildlifeDiseases 39: 35-56.
Christopher, T.E., B.T. Henen, E.M. Smith, M.E. Allen, F.H. Pough, and O.T. Oftedal. 1998.Reproductive output of large-for-age desert tortoises (Gopherus agassizii). The Proceedings of theDesert Tortoise Council Symposium. 104-105.
Clark, J.A., J.M. Hoekstra, P.D. Boersma, and P. Kareiva. 2002. Improving U.S. EndangeredSpecies Act recovery plans: key findings and recommendations of the SCB Recovery Plan Project.Conservation Biology 16: 1510-1519.
Cook, J.C., A.E. Weber, and G.R. Stewart. 1978. Survival of captive tortoises released inCalifornia. The Proceedings of the Desert Tortoise Council Symposium: 130-134.
Congdon, J.D., A.E. Dunham, R.C. Van Loben Sels. 1993. Delayed sexual maturity anddemographics of Blanding's turtles (Emydoidea blandingii): Implications for conservation andmanagement of long-lived organisms. Conservation Biology 7: 826-833.
Corn, P.S. 1991. Displacement of desert tortoises: Overview of a study at the apex heavy industrialuse zone, Clark County, Nevada. The Proceedings of the Desert Tortoise Council Symposium: 295-303.
Corn, P.S. 1994. Recent trends of desert tortoise populations in the Mojave Desert. U. S.Department of the Interior National Biological Survey, Washington, D. C. pp. 85-94.
Crooker, N.S. 1971. First report on the movements and survival of captive desert tortoises releasedin the Colorado Desert of California. University of California Polytechnic, Pomona, California.

DTRPAC Report page 242
Crouse, D.T., L.A. Mehrhoff, M.J. Parkin, D.R. Elam, and L.Y. Chen. 2002. Endangered speciesrecovery and the SCB study: a U.S. Fish and Wildlife Service perspective. Ecological Applications12:719-723.
Cullen, P. 1990. The turbulent boundary between water science and water management. FreshwaterBiology 24: 201-209.
D’Antonio, C.M., and P.M. Vitousek. 1992. Biological invasions by exotic grasses, the grass/firecycle, and global change. Ann. Rev. Ecol. Syst. 23: 63-87.
Deem, S.L., N.B. Karesh, and W. Weisman. 2001. Putting theory into practice: Wildlife health inconservation. Conservation Biology 15: 1224-1233.
Dewberry, T.C., and C.M. Pringle. 1994. Lotic science and conservation: Moving toward commonground. Journal of the North American Benthological Society 13: 399-404.
Dickinson, H.C., and J.E. Fa. 2000. Abundance, demographics and body condition of a translocatedpopulation of St Lucia whiptail lizards (Cnemidophorus vanzoi). Journal of Zoology 251: 187-197.
Diemer-Berish, J.E., L.D. Wendland, and C.A. Gates. 2000. Distribution and prevalence of upperrespiratory tract disease in gopher tortoises in Florida. Journal of Herpetology 34: 5-12.
Doak, D., P. Kareiva, and B. Klepetka. 1994. Modeling population viability for the desert tortoisein the western Mojave Desert. Ecological Applications 4: 446-460.
Dodd, C.K., and R.A. Seigel. 1991. Relocation, repatriation, and translocation of amphibians andreptiles - are they conservation strategies that work. Herpetologica 47: 336-350.
Duck, T.A., and E. Schipper. undated (1989). Analysis of a desert tortoise population and habitat onthe Beaver Dam Slope, Arizona. Part II. Site 45, Exclosure. Bureau of Land Management, ArizonaStrip District, St. George, Utah.
Duck, T.A., and J.R. Snider. undated (1988). Analysis of a desert tortoise population and habitat onthe Beaver Dam Slope, Arizona. Part I. Site 44, Littlefield. Bureau of Land Management, ArizonaStrip District, St. George, Utah.
Duda, J. J., A.J. Krzysik, and J.E. Freilich. 1999. Effects of drought on desert tortoise movementand activity. Journal of Wildlife Management 63: 1181-1192.
Ecological Society of America (ESA). 1995. Strengthening the use of science in achieving the goalsof the Endangered Species Act. ESA, Washington, DC.
EnviroPlus Consulting. 1994. Desert tortoise population studies at six plots in southern Nevada.Report to Nevada Division of Wildlife. Contract # 94-44. 85pp. plus appendices.
EnviroPlus Consulting. 1995. Desert tortoise population studies at plots in southern Nevada. Reportto U.S. Department of Interior, National Biological Service. Contract # 14-48-0006-95-019. 53pp.plus appendices.

DTRPAC Report page 243
Epperson, D.M. 1997. Gopher tortoise (Gopherus polyphemus) populations: activity patterns, upperrespiratory tract disease, and management on a military reservation in northeast Florida. Ph.D.Dissertation, University of Florida, Gainesville, FL.
Field, K.J. 1999. Translocation as a conservation tool applied to the desert tortoise: Effects of thepre-release availability of water. Masters of Science, University of Nevada, Reno: 61pgs.
Field, K., C.R. Tracy, P.A. Medica, R.M. Marlow, and P.S. Corn. 2000. Translocation as a tool forconservation of the desert tortoise: Can pet tortoises be repatriated? [abstract]. The Proceedings ofthe Desert Tortoise Council Symposium 2000:14.
Field, K.J., C.R. Tracy, P.A. Medica, R.W. Marlow, and P.S. Corn. 2003. Spring, fall, or winter?Success of desert tortoise translocation as affected by season of release. The Proceedings of theDesert Tortoise Council Symposium 2003.
Fisher, J., and D.B. Lindenmayer. 2000. An assessment of the published results of animalrelocations. Biological Conservation 9: 1-11.
Fisher R.N., A.V. Suarez, and T.J. Case. 2002. Spatial patterns in the abundance of the coastalhorned lizard. Conservation Biology 16: 205-215.
Forman, R.T.T., D. Sperling, J.A. Bissonette, A.P. Clevenger, C.D. Cutshall, V.H. Dale, L. Fahrig,R. France, C.R. Goldman, K. Heanua, J.A. Jones, F.J. Swanson, T. Turrentine, T.C. Winter. 2003.Road ecology: Science and solutions. Island Press: Washington, DC.
Frazer, N.B. 1993. Sea turtle conservation and halfway technology. Conservation Biology 6: 179-184.
Fridell, R.A., and J.A. Shelby. 1996. Status of the desert tortoise population on the Beaver DamSlope monitoring plot, 1991. Utah Division of Wildlife Resources Publication Number 96-12, SaltLake City, Utah.
Fridell, R.A., and M.P. Coffeen. undated (1993). Desert tortoise population on the Woodbury-Hardy monitoring plot, Beaver Dam Slope, 1986. Utah Division of Wildlife Resources PublicationNumber 93-6, Salt Lake City, Utah.
Fridell, R.A., J.R. Snider, K.M. Comella, and L.D. Lentsch. 1995. Status of the desert tortoisepopulation on the City Creek monitoring plot, Upper Virgin River Valley, 1994. Utah Division ofWildlife Resources Publication Number 95-05, Salt Lake City, Utah.
Fridell, R.A., M.P. Coffeen, and R. Radant. 1995. Status of the desert tortoise population on theCity Creek monitoring plot, Upper Virgin River Valley, 1988. Utah Division of Wildlife ResourcesPublication Number 95-04, Salt Lake City, Utah.
Fridell, R.A. 1995. Status of the desert tortoise population on the Woodbury-Hardy monitoring plot,Beaver Dam Slope, 1992. Utah Division of Wildlife Resources Publication Number 95-03, SaltLake City, Utah.
Frost, D.R., and D.M. Hillis. 1990. Species in concept and practice: Herpetological applications.Herpetologica 46: 87-104

DTRPAC Report page 244
Frost, D.R., A.G. Kluge, and D.Z. Hillis. 1992. Species in contemporary herpetology: Commentson phylogenetic inference and taxonomy. Herpetological Review 23: 46-54.
Gelbard, J.L., and J. Belnap. 2003. Roads as conduits for exotic plant invasions in a semiaridlandscape. Conservation Biology 17:420-432.
Germano, D.J. 1993. Shell morphology of North American tortoises. American Midland Naturalist129: 319-335.
Gillette, D.A., and J. Adams. 1983. Accelerated wind erosion and prediction of rates. Pp. 97-109 inWebb, R.H., and H.G. Wilshire (eds.). Environmental effects of off-road vehicles: impacts andmanagement in arid regions. Springer-Verlag, New York.
Glenn, J.L., R.C. Straight, and J.W. Sites, Jr. 1990. A plasma protein marker for population geneticstudies of the desert tortoise (Xerobates agassizii). The Great Basin Naturalist 50: 1-8.
Goodlett, G., M. Walker, and P. Woodman. 1997. Desert tortoise population survey at Virgin Slopedesert tortoise study plot, spring, 1997. Report to Arizona Game and Fish Department, Phoenix,AZ.
Goodlett, G., and P. Woodman. 2003. Desert tortoise population survey at Virgin Slope deserttortoise study plot and line distance transects on the Virgin and Beaver Dam slopes, spring, 2003.Report to Arizona Game and Fish Department, Phoenix, AZ.
Goodlett, G., P. Woodman, M. Walker, and S. Hart. 1996. Desert tortoise population survey atBeaver Dam Slope exclosure desert tortoise study plot; spring, 1996. Report to Arizona Game andFish Department, Phoenix.
Gould, S. J., and. R.C. Lewontin. 1979. The spandrels of San Marcos and the PanglossianParadigm; A critique of the adaptationist programme. Royal Society of London B 205: 581-598.
Gould, S. J., and. E.S. Vrba. 1982. Exaptation-a missing term in the science of form. Paleobiology8: 4-15.
Griffith, B., J.M. Scott, J.W. Carpenter, and C. Reed. 1989. Translocation as a species conservationtool - status and strategy. Science 245: 477-480.
Grover, M.C., and L.A. DeFalco. 1995. Desert tortoise (Gopherus agassizii): status-of knowledgeoutline with references. Gen. Tech. Rep. INT-GTR-316. Ogden, UT: U.S. Department ofAgriculture, Intermountain Research Station. 134p.
Haig, S.M., L.W. Oring, P.M. Sanzenbacher, and O.W. Taft. 2002. Space use, migratoryconnectivity, and population segregation among willets breeding in the western Great Basin.Condor 104: 620-630.
Hanski, I. 1999. Metapopulation Ecology. Oxford University Press. Oxford.
Hanski, I., and M.E. Gilpin. 1991. Metapopulation dynamics - brief-history and conceptual domain.Biological Journal of the Linnean Society 42: 3-16.

DTRPAC Report page 245
Hanski, I., and M.E. Gilpin (eds.). 1997. Metapopulation Biology: Ecology, Genetics andEvolution. Academic Press.
Hatch, L., M. Uriarte, D. fink, L. Aldrich-Wolfe, R.G. Allen, C. Webb, K. Zamudio, and A. Power.2002. Jurisdiction over endangered species’ habitat: the impacts of people and property on recoveryplanning. Ecological Applications 12:690-700.
Hatfield, J.S., W.R. Gould, B.A. Hoover, M.R. Fuller, E.L. Lindquist. 1996. Detecting trends inraptor counts: Power and Type I error rates of various statistical tests. Wildlife Society Bulletin 24:505-515.
Hayes, J.P., and J.S. Shonkweiler. 2001. Morphometric indicators of body condition: worthwhile orwishful thinking? Pgs. 8-38 in.J.R. Speakman (ed.). Of What Stuff Are Animals Made? BodyComposition Analysis in Animals: A Handbook of Non-Destructive Methods. CambridgeUniversity Press, Cambridge. 252p
Henen, B.T., C.D. Peterson, I.R. Wallis, K.H. Berry, and K.A. Nagy. 1998. Effects of climaticvariation on field metabolism and water relations of desert tortoises. Oecologia 117: 365-373.
Hereford, R. 2000. Past and future climate variation in the Mojave Desert: Surface processes andland management issues. The Proceedings of the Desert Tortoise Council Symposium.
Hochachka, W.M., and A.A. Dhondt. 2000. Density-dependent decline of host abundance resultingfrom a new infectious disease. Proceedings of the National Academy of Sciences 97: 5303-5306.
Hoekstra, J.M., J.A. Clark, W.F. Fagan, and P.D. Boersma. 2002. A comprehensive review ofEndangered Species Act recovery plans. Ecological Applications 12: 630-640.
Hoffman, T.C. 2002. The reimplementation of the Ra’ui: Coral reef management in Rarotonga,Cook Islands. Coastal Management 30: 401-418.
Homer, B.L., K.H. Berry, M.B. Brown, G. Ellis, and E.R. Jacobson. 1998. Pathology of diseases indesert tortoises from California. Journal of Wildlife Diseases 34: 508-523.
Hooge, P. N., and B. Eichenlaub. 2001. Animal movement extension to Arcview. ver 2.04b.Anchorage, AK: Alaska Science Center Biological Science Office, U.S. Geological Survey.
Hunter, J., F. Schmidt, F., and G. Jackson. 1982. Meta-Analysis: Cumulating research findingsacross studies. Sage, Beverly Hills, CA.
Hyman, J.B., and K. Wernstedt. 1995. A value-informed framework for interdisciplinary analysis:Application to recovery planning for Snake River salmon. Conservation Biology 9: 625-635.
Independent Scientific Advisory Board. 2003. A Review of Strategies for Recovering TributaryHabitat. Prepared for the Northwest Power Planning Council, the National Marine FisheriesService, and the Columbia River Basin Indian Tribes, 851 SW 6th Avenue, Suite 1100, Portland,Oregon 97204.
Jackson, C.G., J.A. Trotter, T.H. Trotter, and M.W. Trotter. 1976. Accelerated growth and earlymaturation in Gopherus agassizii (Reptilia: Testudines). Herpetologica 32: 139-145.

DTRPAC Report page 246
Jacobson, E.R. 1994. Causes of mortality and disease in tortoises: a review. Journal of Zoo andWildlife Medicine 25: 2-17.
Jacobson, E.R., M.B. Brown, I.M. Schumacher, B.R. Collins, R.K. Harris, and P.A. Klein. 1995.Mycoplasmosis and the desert tortoise (Gopherus agassizii) in Las Vegas Valley, Nevada.Chelonian Conservation and Biology 1: 279-284.
Jacobson, E.R., T.J. Wronski, I. Schumacher, C. Reggiardo, and K.H. Berry. 1994. Cutaneousdyskeratosis in free-ranging desert tortoises, Gopherus agassizii, in the Colorado Desert of southernCalifornia. Journal of Zoo and Wildlife Medicine 25: 68-81.
Jennings, R.D. 1985. Biochemical variation of the desert tortoise, Gopherus agassizii. M.S. Thesis,University of New Mexico, Albuquerque.
Johannes, R.E. 1998. The case for data-less marine resource management: Examples from tropicalnear-shore fisheries. Trends in Ecology and Evolution 13: 243-246.
Johnson, A., E. Jacobson, D. J. Morafka, F. Origgi, and L. Wendland. 2002. Prevalence of URTDin captive desert tortoises on and adjacent to Fort Irwin: potential impacts to wild populations. TheProceedings of the Desert Tortoise Council Symposium 2002.
Kaiser, J. 2000a. Bringing science to the national parks. Science 288: 34-37.
Kaiser, J. 2000b. Rift over biodiversity divides ecologists. Science 289: 1282-1283.
Kareiva, P.S., and B. Klepetka. 1994. Modeling population viability for the desert tortoise in thewestern Mojave Desert. Ecological Applications 4:446-460.
Kareiva, P.S., S. Andelman, D. Doak, B. Elderd, M. Groom, J. Hoekstra, L. Hood, F. James, J.Lamoreux, G. LeBuhn, C. McCulloch, J. Regetz, L. Savage, M. Ruckelshaus, D. Skelly, H. Wilbur,and K. Zamudio. 1999. Using science in Habitat Conservation Plans. National Center forEcological Analysis and Synthesis, Santa Barbara, CA, and American Institute of BiologicalSciences, Washington, DC. 97 pp.
Kazura, J.W., and M.J. Bockarie. 2003. Lymphatic filariasis in Papua New Guinea:Interdisciplinary research on a national health problem. Trends in Parasitology 19: 260-263.
Kleiman, D.G., and J.J.C. Mallinson. 1998. Recovery and management committees for liontamarins: Partnerships in conservation planning and implementation. Conservation Biology 12: 27-38.
Kock, M.D. 1996. Wildlife, people and development: veterinary contributions to wildlife health andresource management in Africa. Tropical Animal Health and Production 28: 68-80.
Krebs, C.J. 1994. Ecology: The Experimental Analysis of Distribution and Abundance.HarperCollins, New York.
Krzysik, A.J. 1998. Desert tortoise populations in the Mojave Desert and a half-century of militarytraining activities. Pp. 61-73 in J. Van Abbema (ed.) Proceedings: conservation, restoration, andmanagement of tortoises and turtles-an international conference. New York Turtle and TortoiseSociety, New York.

DTRPAC Report page 247
Lamb, T., J.C. Avise, J.W. Gibbons. 1989. Phylogeographic patterns in mitochondrial DNA of thedesert tortoise (Xerobates agassizii), and evolutionary relationships among North American gophertortoises. Evolution 43: 76-87.
Lamb, T., and C. Lydehard. 1994. A molecular phylogeny of the gopher tortoises, with commentson familiar relationships within the Testudinoidea. Molecular Phylogenetics and Evolution 3: 283-91.
Lamb, T., and A.M. McLuckie. 2002. Genetic differences among geographic races of the deserttortoise. Pages 67-85 in T.R. Van Devender (ed.), The Sonoran Desert Tortoise: Natural History,Biology, and Conservation. Univ. Arizona, Tucson.
Lawler, J.J., S.P. Campbell, A.D. Guerry, M.B. Kolozsvary, R.J. O’Connor, and L.C.N. Seward.2002. The scope and treatment of threats in endangered species recovery plans. EcologicalApplications 12:663-667.
Lederle, P.E., K.R. Rautenstrauch, D.L. Rakestraw, K.K. Zander, and J.L. Boone. 1997. Upperrespiratory tract disease and mycoplasmosis in desert tortoises from Nevada. Journal of WildlifeDiseases 33:759-765.
Levine, N. 2002. CrimeStat: A Spatial Statistics Program for the Analysis of Crime IncidentLocations (v 2.0). Ned Levine & Associates, Houston, TX, and the National Institute of Justice,Washington, DC.
Levins R.., and D. Culver. 1971. Regional coexistence of species and competition between rarespecies. Proceedings of the National Academy of Sciences 68:1246-1248.
Levin S.A., D. Cohen, A. Hastings. 1984. Dispersal strategies in patchy environments. TheoreticalPopulation Biology 26:165-191.
Link, W.A., and J.S. Hatfield. 1990. Power calculations and model selection for trend analysis - acomment. Ecology 71: 1217-1220.
Lohoefener, R., and L. Lohoefener. 1986. Experiments with gopher tortoise (Gopherus polyphemus) relocation in Southern Mississippi. Herpetological Review 17: 37-40.
Lovich, J.E., and D. Bainbridge. 1999. Anthropogenic degradation of the Southern California desertecosystem and prospects for natural recovery and restoration. Environmental Management 24: 309-326.
Lundquist, C.J., J.M. Dieh, E. Harvey, and L.W. Botsford. 2002. Factors affecting implementationof recovery plans. Ecological Applications 12:713-718.
MacDonald, L.L., and W.P. Erickson. 1994. Testing for bioequivalence in field studies: Has adisturbed site been adequately reclaimed? Pp 183-197 In D.J. Fletcher and B.F.J. Manly (eds.)Statistics in Ecology and Environmental Monitoring, Otago Conference Series No. 2, University ofOtago Press, Dunedin, New Zealand.

DTRPAC Report page 248
MacKenzie, D.I., J.D. Nichols, G.B. Lachman, S. Droege, J.A. Royle, and C.A. Langtimm. 2002.Estimating site occupancy rates when detection probabilities are less than one. Ecology 83: 2248-2255.
MacKenzie, D.I., J.D. Nichols, J.E. Hines, M.G. Knutson, and A.B. Franklin. 2003. Estimating siteoccupancy, colonization, and local extinction when a species is detected imperfectly. Ecology 84:2200-2207.
Manly, B.J.F. 1992. The Design and Analysis of Research Studies. Cambridge University Press,Cambridge.
Manly, B.F.J., L.L. MacDonald, D.L. Thomas, T.L. McDonald, and W.P. Erickson. 2002. ResourceSelection by Animals, 2nd edn. Kluwer Academic Publishers, Dordrecht, the Netherlands.
Manly, B.F.J., L.L. MacDonald, and G.W. Garner. 1996. Maximum likelihood estimation for thedouble-count method with independent observers. Journal of Agricultural, Biological, andEnvironmental Statistics 1:170-189.
Maruyama, G.M. 1997. Basics of structural equation modeling. Thousand Oaks, CA: Sage.
McCawley, J., and D. Sheridan. 1972. A second report on the survival and movements of the deserttortoises released in the Orocopia mountains of the Colorado desert. University of CaliforniaPolytechnic, Pomona, California.
McLaughlin, G.S. 1997. Upper respiratory disease in gopher tortoises, Gopherus polyphemus:pathology, immune responses, transmission, and implications for conservation and management.Ph.D. Dissertation, University of Florida, Gainesville, FL.
McLuckie, A.M., T. Lamb, C.R. Schwalbe, and R.D. McCord. 1999. Genetic and morphometricassessment of an unusual tortoise (Gopherus agassizii) population in the Black Mountains ofArizona. Journal of Herpetology 33: 36-44.
McLuckie, A. M., D.L. Harstad, J.W. Marr, and R.A. Fridell. 2002. Regional desert tortoisemonitoring in the Upper Virgin River Recovery Unit, Washington County, Utah. ChelonianConservation and Biology 4: 380
Medica, P.A. 1992. Desert tortoise population trends in Nevada 1990-1992. Report to Bureau ofLand Management. 10pp.
Merriam -Webster (eds.). 1983. Merriam-Webster's Collegiate Dictionary. Merriam-Webster, Inc.
Metzger, N., and R.N. Zare. 1999. Interdisciplinary research: From belief to reality. Science 283:642-643.
Miller, A. 1993. The role of analytical science in natural resource decision-making. EnvironmentalManagement 17: 563-574.
Minden, R.L., and S.M. Keller. undated (1981). Population analysis of the desert tortoise(Gopherus agassizii) on the Beaver Dam Slope, Washington County, Utah. Utah Division ofWildlife Resources Publication Number 81-14, Salt Lake City, Utah.

DTRPAC Report page 249
Morafka, D.J., and K.H. Berry. 2002. Is Gopherus agassizii a desert-adapted tortoise, or an exaptiveopportunist?: implications for tortoise conservation. Chelonian Conservation and Biology 4: 263-287.
Moritz, C. 1994. Applications of mitochondrial DNA analysis in conservation: A critical review.Molecular Ecology 3:401-11.
Moritz, C. 2002. Strategies to protect biological diversity and the evolutionary processes thatsustain it. Systematic Biology 51: 238-254.
Mushinsky, H.R., D.S. Wilson, and E.D. McCoy. 1994. Growth and sexual dimorphism ofGopherus polyphemus in central Florida: Herpetologica. 50: 119–128.
Nagy, K.A., B.T. Henen, D.B. Vyas, and I.R. Wallis. 2002. A condition index for the desert tortoise(Gopherus agassizii). Chelonian Conservation and Biology 4:425-429.
Nammack, M. 1998. National Marine Fisheries Service and the evolutionary significant unit:Implications for management of freshwater mussels. Journal of Shellfish Research 17: 1415-1418.
National Marine Fisheries Service. 2000. Conservation of Columbia Basin fish: all-H paper. U.S.Department of Commerce, National Oceanic and Atmospheric Administration, National MarineFisheries Service, in consultation with the Federal Caucus, Portland, Oregon. 3 vol.
Nicastri, E., E. Girardi, and G. Ippolito. 2001. Determinants of emerging and re-emerginginfectious diseases. Journal of Biological Regulators and Homeostatic Agents 15: 212-217.
Nickolai, J.L., and R.A. Fridell. 1998. Status of the desert tortoise population on the Woodbury-Hardy monitoring plot, Beaver Dam Slope, 1998. Utah Division of Wildlife Resources PublicationNumber 98-24, Salt Lake City, Utah.
Nussear, K.E. 2004. Mechanistic investigation of the distributional limits of the desert tortoise,Gopherus agassizii. Dissertation. University of Nevada, Reno.
Nussear, K.E., C.R. Tracy, P.A. Medica, M.B. Saethre, R.W. Marlow, and P.S. Corn. 2000.Translocation as a tool for conservation of the desert tortoise: Nevada studies. The Proceedings ofthe Desert Tortoise Council Symposium 2000:26-30.
Oftedal, O. T., S. Hillard, and D.J. Morafka. 2002. Selective spring foraging by juvenile deserttortoises (Gopherus agassizii) in the Mojave Desert: Evidence of an adaptive nutritional strategy.Chelonian Conservation and Biology.4: 341-352.
Opdam, P. 1988. Populations in fragmented landscape. In K. F. Schreiber (ed.). Connectivity inLandscape Ecology. Proceedings of the 2nd International Seminar of the International Associationfor Landscape Ecology. Geografische Arbeiten 29: 75-77.
Overton, W.C. 1971. Estimating the numbers of animals in wildlife populations. in R.H. Giles (ed.),Wildlife Management Techniques. The Wildlife Society, Washington, D.C. pp. 403-456.
Pedrono, M., and A. Sarovy. 2000. Trial release of the world's rarest tortoise Geochelone yniphorain Madagascar. Biological Conservation 95: 333-342.

DTRPAC Report page 250
Pennock, D.S., and W.W. Dimmick. 1997. Critique of the evolutionary significant unit as adefinition for “distinct population segments” under the U.S. Endangered Species Act. ConservationBiology 11: 911-619.
Peterson, C. C. 1994. Different rates and causes of high mortality in two populations of thethreatened desert tortoise, Gopherus agassizii. Biological Conservation 70: 101-8.
Peterson, C.C. 1996a. Anhomeostasis: Seasonal water and solute relations in two populations of thedesert tortoise (Gopherus agassizii) during chronic drought. Physiological Zoology 69: 1324-1358.
Peterson, C.C. 1996b. Ecological energetics of the desert tortoise (Gopherus agassizii): effects ofrainfall and drought. Ecology 77: 1831-1844.
Petraitis P.S., A.E. Dunham, P.H. Niewiarowski. 1996. Inferring multiple causality: The limitationsof path analysis. Functional Ecology 10: 421-431.
Pettan-Brewer, K.C.B., M.L. Drew, E. Ramsay, F.C. Mohr, and L.J. Lowenstine. 1996. Herpesvirusparticles associated with oral and respiratory lesions in a California desert tortoise (Gopherusagassizii). Journal of Wildlife Diseases 32: 521-526.
Pilz, K.M., H.G. Smith, M.I. Sandell, and H. Schwabl. 2003. Interfemale variation in egg yolkandrogen allocation in the European starling: do high-quality females invest more? AnimalBehavior 65:841-850.
Platenberg, R. J., and R.A. Griffiths, R. A. 1999. Translocation of slow-worms (Anguis fragilis) asa mitigation strategy: a case study from south-east England. Biological Conservation 90: 125-32.
Rabatsky, A., and B. Blihovde. 2002. Gopher tortoise die-off at Rock Springs Run State Reserve,Lake County, Florida. Florida Scientist 65: 27.
Rainboth, W.J., D.G. Booth, and F.B. Turner. 1989. Allozyme variation in Mojave populations ofthe desert tortoise. Copeia 1989: 115-123.
Redlands Institute. 2002a. Summary of Desert Tortoise Recovery Actions: Eastern ColoradoRecovery Unit. Unpublished report to Desert Managers Group, Barstow, CA. 28pp.
Redlands Institute. 2002b. Summary of Desert Tortoise Recovery Actions: Eastern MojaveRecovery Unit. Unpublished report to Desert Managers Group, Barstow, CA. 37pp.
Redlands Institute. 2002c. Summary of Desert Tortoise Recovery Actions: Northern ColoradoRecovery Unit. Unpublished report to Desert Managers Group, Barstow, CA. 21pp.
Redlands Institute. 2002d. Summary of Desert Tortoise Recovery Actions: Northern MojaveRecovery Unit. Unpublished report to Desert Managers Group, Barstow, CA. 47pp.
Redlands Institute. 2002e. Summary of Desert Tortoise Recovery Actions: Upper Virgin RiverRecovery Unit. Unpublished report to Desert Managers Group, Barstow, CA. 22pp.
Redlands Institute. 2002f. Summary of Desert Tortoise Recovery Actions: Western MojaveRecovery Unit. Unpublished report to Desert Managers Group, Barstow, CA. 65pp.

DTRPAC Report page 251
Ricklefs, R.E., and G.L. Miller. 1999. Ecology. W.H. Freeman and Company, New York.
Reinert, H.K. 1991. Translocation as a conservation strategy for amphibians and reptiles: Somecomments, concerns, and observations. Herpetologica 47: 357-363.
Romesburg, H.C. 1991. On improving the natural resources and environmental sciences. Journal ofWildlife Management 55: 744-756.
Roosenburg, W.M., and K.C. Kelley. 1996. The effect of egg size and incubation temperature ongrowth in the turtle, Malaclemys terrapin. Journal of Herpetology 30: 198-204.
Rose, F.L., J. Koke, R. Koehn, and D. Smith. 2001. Identification of the etiological agent fornecrotizing scale disease in the Texas tortoise. Journal of Wildlife Diseases 37: 223-228.
Ross, P.S. 2002. The role of immunotoxic environmental contaminants in facilitating theemergence of infectious diseases in marine mammals. Human and Ecological Risk Assessment 8:277-292.
Rourke, J.W., C. Hillier, J. Merriam, and T.A. Duck. undated (1993). Desert tortoise population onthe Littlefield study plot, 1993. Bureau of Land Management, Arizona Strip District, St. George,Utah.
Ryder, O.A. 1986. Species conservation and systematics: the dilemma of subspecies. Trends inEcology and Evolution 1: 9-10.
S.A.I.C. 1993. American Honda desert tortoise relocation project. Science ApplicationsInternational Corporation, Santa Barbara, CA.
Sall, J. 1990. Leverage plots for General Linear Hypotheses. American Statistician. 44: 308-315.
Savitz, D.A., C. Poole, and W.C. Miller. 1999. Reassessing the role of epidemiology in publichealth. American Journal of Public Health 89: 1158-1161.
Schemske, D.W., B.C. Hubbard, M.H. Ruckelshaus, C. Goodwillie, I.M. Parker, and J.G. Bishop.1994. Evaluating approaches to the conservation of rare and endangered plants. Ecology 75: 584-606.
Schumacher, I.M., D.B. Henderson, M.B. Brown, E.R. Jacobson, and P.A. Klein. 1997.Relationship between clinical signs of upper respiratory tract disease and antibodies to Mycoplasmaagassizii in desert tortoises from Nevada. Journal of Wildlife Diseases 33: 261-266.
Schumacher, I.M., D.C. Rostal, R. Yates, D.R. Brown, E.R. Jacobson, and P.A. Klein. 1999.Transfer and persistence of maternal antibodies against Mycoplasma agassizii in desert tortoise(Gopherus agassizii) hatchlings. American Journal of Veterinary Research 60: 826-831.
Seigel, R.A., R.B. Smith, and N.A. Seigel. 2003. Swine flu or 1918 pandemic? Upper respiratorytract disease and sudden mortality of gopher tortoises (Gopherus polyphemus) on a protectedhabitat in Florida. Journal of Herpetology 37: 137-144.
Sharifi, M.R., A.C. Gibson, and P.W. Rundel. 1997. Surface dust impacts on gas exchange inMojave Desert shrubs. Journal of Applied Ecology 34: 837-846.

DTRPAC Report page 252
Shrader-Frechette, K.S., and E.D. McCoy. 1994a. Ecology and environmental problem solving.Environmental Professional 16: 342-348.
Shrader-Frechette, K.S., and E.D. McCoy. 1994b. What ecology can do for environmentalmanagement. Journal of Environmental Management 41: 293-307.
Simberloff, D. 1998. Flagships, umbrellas, and keystones: is single-species management passé inthe landscape era? Biological Conservation 83: 247-257.
Smith F.A., J.H. Brown, T.J. Valone. 1997. Path analysis: A critical evaluation using long-termexperimental data. American Naturalist 149: 29-42.
Smith, R.B., R.A. Seigel, and K.R. Smith. 1998. Occurrence of upper respiratory tract disease ingopher tortoise populations in Florida and Mississippi. Journal of Herpetology 32: 426-430.
Sockman, K.W., and H. Schwabl. 2000. Yolk androgens reduce offspring survival. Proceedings ofthe Royal Society of Biological Sciences Series B 267:1451-1456.
Spidle, A.P., S.T. Kalinowski, B.A. Lubinski, D.L. Perkins, K.F. Beland, J.F. Kocik, and T.L. King.2003. Population structure of Atlantic salmon in Maine with reference to populations from AtlanticCanada. Transactions of the American Fisheries Society 132: 196-209.
Swinton, J.A. 1999. Dictionary of Epidemiology. Welcome Centre for Epidemiology of InfectiousDiseases. Cambridge University, Cambridge, UK.
Tanner, J.T. 1978. Guide to the Study of Animal Populations. University of Tennessee Press,Knoxville.
Tasse, J. 1989. Translocation as a strategy for preserving endangered species. Endangered speciesupdate 6: 6.
Tear, T.H., J.M. Scott, P.H. Hayward, and B. Griffith. 1993. Status and prospects for success of theEndangered Species Act: A look at recovery plans. Science 262: 976-977.
Turner, F.B., and K.H. Berry. 1984. Methods used in analyzing desert tortoise populations.Appendix 3 in K.H. Berry (ed.), The status of the desert tortoise (Gopherus agassizii) in the UnitedStates. Desert Tortoise Council, Long Beach, CA. Unpublished report to U.S. Fish and WildlifeService on Order No. 11310-0083-81.
Turner, F.B., and K.H. Berry. 1985. Population ecology of the desert tortoise at Goffs, California,in 1984. Ann. Rept, to Southern California Edison Co., Res. and Dev. Series Rept. 85-RD-63.Rosemead, California.
Turner, F.B., K.H. Berry, D.C. Randall, and G.C. White. 1987. Population ecology of the deserttortoise at Goffs, California, in 1983-1986. Ann. Rept, to Southern California Edison Co., Res. andDev. Series Rept. Rosemead, California. 101pp.
Turner, F.B., P. Hayden, B.L. Burge, and J.B. Robertson. 1986. Egg production by the deserttortoise (Gopherus agassizii) in California. Herpetologica 42: 93-104.

DTRPAC Report page 253
Turner, F.B., P.A. Medica, and C.L. Lyons. 1984. Reproduction and survival of the desert tortoise(Scaptochelys agassizii) in Ivanpah Valley, California. Copeia 4: 811-820.
Underwood, A.J. 1997. Experiments in Ecology. Their Logical Design and Interpretation UsingAnalysis of Variance. Cambridge University Press, Cambridge.
U.S. Court of Appeals, Ninth Circuit. 2003. National Association of Home Builders v. Norton.Opinion No. 02-15212 D.C. No. CV 00-0903 SRB.
U.S. Fish and Wildlife Service. 1990. Endangered and threatened wildlife and plants; determinationof threatened status for the Mojave population of the desert tortoise. Federal Register 55:12178-12191.
U. S. Fish and Wildlife Service. 1994. Desert tortoise (Mojave population) Recovery Plan. U.S.Fish and Wildlife Service, Portland, OR. 74 pgs plus appendices.
U.S. Fish and Wildlife Service. 1996. Policy regarding the recognition of distinct vertebratepopulation segments under the Endangered Species Act. Federal Register 61:4722-4725.
U.S. Fish and Wildlife Service. 2003. Endangered and threatened wildlife and plants; final rule toremove the Douglas County Distinct Population Segment of Columbian white-tailed deer from theFederal list of endangered and threatened wildlife. Federal Register 68:43647-43659.
U.S. Fish and Wildlife Service and National Marine Fisheries Service. 1996. Policy regarding therecognition of distinct vertebrate population segments under the Endangered Species Act. FederalRegister 61:4722-4725.
U.S. Fish and Wildlife Service and National Oceanic and Atmospheric Administration. 1994. Draftpolicy regarding the recognition of distinct vertebrate population segments under the EndangeredSpecies Act. Federal Register 59:65885-65887.
U.S. General Accounting Office. 2002. Endangered species: research strategy and long-termmonitoring needed for the Mojave desert tortoise recovery program. GAO-03-23. Washington, DC.53 pp.
Van Devender, T.R. 2002a. Natural History of the Sonoran tortoise in Arizona: life in a rock pile.pp.3-28 In: Van Devender, T.R. (ed.). The Biology of the Sonoran Desert Tortoise: Natural History,Biology, and Conservation. The University of Arizona Press and the Arizona-Sonora DesertMuseum, Tucson.
Van Devender, T. R. 2002b. Cenozoic environments and the evolution of the gopher tortoises(genus Gopherus). pp. 29-51 In Van Devender, T.R. (ed.). The Biology of the Sonoran DesertTortoise: Natural History, Biology, and Conservation The University of Arizona Press and theArizona-Sonora Desert Museum, Tucson, Arizona
Vasek, F.C. 1983. Plant succession in the Mojave Desert. Crossosoma 9: 1-23.
von Seckendorff Hoff, K., and R. W. Marlow. 2002. Impacts of vehicle road traffic on deserttortoise populations with consideration of conservation of tortoise habitat in southern Nevada.Chelonian Conservation and Biology 4: 449-456.

DTRPAC Report page 254
Walker, M., and P. Woodman. 2002. Desert tortoise population survey at Beaver Dam Slopeexclosure desert tortoise study plot; spring, 2001. Report to Arizona Game and Fish Department,Phoenix, AZ.
Wallace, R.B. 2001. Bridging epidemiology and demography – theories and themes. Annals of theNew York Academy of Sciences 954: 63-75.
Wallis, I.R., B.T. Henen, and K.A. Nagy. 1999. Egg size and annual egg production by femaledesert tortoises (Gopherus agassizii): the importance of food abundance, body size, and date of eggshelling. Journal of Herpetology 33: 394-408.
Waples, R.S. 1991. Pacific salmon, Oncorhynchus ssp., and the definition of “species” under theEndangered Species Act. Marine Fisheries Review 53: 11-22.
Wasserburg, G., Z. Abramsky, G. Anders et al. 2002. The ecology of cutaneous leishmaniasis inNizzana, Israel: Infection patterns in the reservoir host, and epidemiological implications.International Journal for Parasitology 32: 133-149.
Weinstein, M. N., and K. H. Berry. 1987. Morphometric analysis of desert tortoise populations.Report CA950-CT7-003, Bureau of Land Management, 39 pp.
Westhouse, R.K., E.R. Jacobson, R.A. Harris, K.R. Winter, and B.L. Homer. 1996. Respiratoryand pharyngo-esophageal iridovirus infection in a gopher tortoise (Gopherus polyphemus). Journalof Wildlife Diseases 32: 682-686.
Wilson, D.S., D.J. Morafka, C.R. Tracy, and K.A. Nagy. 1999. Winter activity of juvenile deserttortoises. Journal of Herpetology. 33: 496-50.
Woodbury, A.M., and R. Hardy. 1948. Studies of the desert tortoise, Gopherus agassizii.Ecological Monographs 18:146-200.
Woodman, P., P. Wood, and S. Topham. 1999. Desert tortoise population survey at Littlefielddesert tortoise study plot, spring, 1998. Report to Arizona Game and Fish Department, Phoenix,AZ.
Woodroffe, R. 1999. Managing disease threats to wildlife. Animal Conservation 2: 185-193.
Wootton, J.T. 1994. Predicting direct and indirect effects - an integrated approach usingexperiments and path analysis. Ecology 75: 151-165.
Young, R., C. Halley, and P. Woodman. 2002. Desert tortoise population survey at Littlefield deserttortoise study plot, spring, 2002. Report to Arizona Game and Fish Department, Phoenix, AZ.
Zimmerman, L.C., M.P. O’Connor, S.J. Bulova, J.R. Spotila, S.J. Kemp, and C.J. Salice. 1994.Thermal ecology of desert tortoises in the eastern Mojave Desert: Seasonal patterns of operativeand body temperatures, and microhabitat utilization. Herpetological Monographs 8: 45-59.