design evaluation tool of ship...
TRANSCRIPT

Department of Shipping and Marine Technology CHALMERS UNIVERSITY OF TECHNOLOGY Gothenburg, Sweden 2016
Design Evaluation Tool of Ship Concept Master's Thesis in Naval Architecture and Ocean Engineering
Olle Valentin & Andreas Höglund


Master’s Thesis X-16/346
Design Evaluation Tool of Ship ConceptA report describing the web-based design tool
OLLE VALENTIN
ANDREAS HOGLUND
Department of Shipping and Marine TechnologyChalmers University of Technology
Gothenburg, Sweden 2016

Design Evaluation Tool of Ship ConceptA report describing the web-based design toolOLLE VALENTINANDREAS HOGLUND
c©OLLE VALENTIN & ANDREAS HOGLUND, 2016
Master’s Thesis X-16/346Department of Shipping and Marine TechnologyChalmers University of TechnologyGothenburg, Sweden 2016
Cover: Pictures of DEToSC and Reference ships

Abstract
Conventional merchant ship design is a complex process where each part of theprocess is strongly connected to the other. In order to achieve a good design
everything needs to be put together in an understandable way. A web design toolis created and used for development of ship concept designs. With information
about the transport mission it is possible to generate a complete ship through allthe design steps with proposed hull forms, propeller concepts, main engines andget performance indicators such as fuel consumption and EEDI for the current
ship.Since a merchant ship has different loading conditions depending on the amountof cargo, and is operating in different weather conditions it is of big importance
that the design is adapted to the right conditions. The user is able to specify theservice conditions and design the propeller accordingly.
The web design tool is validated with three existing merchant vessels with goodresults. It will help naval architects to provide a quick concept at the early
design phase and can be used in education to extend students knowledge in amore substantial way about merchant ship design.
Keywords: Ship design, hull resistance, propeller design, open water efficiency,main engine selection, block coefficient, deadweight estimation, advance
coefficient, fuel consumption, design tool


Acknowledgements
This report is a part of the masters program Naval Architecture and OceanEngineering as a master thesis. It stand for 30 credits and the project is
performed together with the company ScandiNAOS AB. Deep appreciation toBengt Ramne, Youming Huang, Joakim Bomanson, Per Fagerlund at
ScandiNAOS AB for the opportunity to work with them with this project andthe help provided to achieve this result. A special thanks to Mr Ramne who has
provided us with great knowledge and extra guidance to perform this project.
Olle Valentin and Andreas Hoglund, Gothenburg 25.05.16


Contents
1 Introduction 11.1 Background . . . . . . . . . . . . . . . . . . . . . . . . . . . . . . . 11.2 Purpose . . . . . . . . . . . . . . . . . . . . . . . . . . . . . . . . . 21.3 Objective . . . . . . . . . . . . . . . . . . . . . . . . . . . . . . . . 21.4 Methodology . . . . . . . . . . . . . . . . . . . . . . . . . . . . . . 21.5 Limitations . . . . . . . . . . . . . . . . . . . . . . . . . . . . . . . 3
2 Theoretical framework 52.1 Hull shape design . . . . . . . . . . . . . . . . . . . . . . . . . . . . 5
2.1.1 Main particulars . . . . . . . . . . . . . . . . . . . . . . . . 52.1.2 Ship particulars . . . . . . . . . . . . . . . . . . . . . . . . . 72.1.3 Hull coefficients . . . . . . . . . . . . . . . . . . . . . . . . . 122.1.4 Superstructure parameters . . . . . . . . . . . . . . . . . . . 152.1.5 Added resistance due to wind and waves . . . . . . . . . . . 172.1.6 Calm water hull resistance . . . . . . . . . . . . . . . . . . . 182.1.7 Total resistance . . . . . . . . . . . . . . . . . . . . . . . . . 18
2.2 Propeller design . . . . . . . . . . . . . . . . . . . . . . . . . . . . . 192.2.1 Hull efficiency . . . . . . . . . . . . . . . . . . . . . . . . . . 202.2.2 Set service profile . . . . . . . . . . . . . . . . . . . . . . . . 242.2.3 Search propeller . . . . . . . . . . . . . . . . . . . . . . . . . 252.2.4 Propeller dimensioning results . . . . . . . . . . . . . . . . . 30
2.3 Main engine selection . . . . . . . . . . . . . . . . . . . . . . . . . . 362.3.1 Search for engine . . . . . . . . . . . . . . . . . . . . . . . . 362.3.2 Cavitation data . . . . . . . . . . . . . . . . . . . . . . . . . 382.3.3 Engine performance . . . . . . . . . . . . . . . . . . . . . . . 392.3.4 Suggested engine . . . . . . . . . . . . . . . . . . . . . . . . 39
2.4 EEDI . . . . . . . . . . . . . . . . . . . . . . . . . . . . . . . . . . . 412.4.1 Required EEDI . . . . . . . . . . . . . . . . . . . . . . . . . 412.4.2 Attained EEDI . . . . . . . . . . . . . . . . . . . . . . . . . 42
i

CONTENTS
3 Results 443.1 DEToSC (Design Evaluation Tool of Ship Concept) . . . . . . . . . 443.2 Validation of DEToSC . . . . . . . . . . . . . . . . . . . . . . . . . 44
3.2.1 Hull shape (1) . . . . . . . . . . . . . . . . . . . . . . . . . . 443.2.2 Propeller (2) . . . . . . . . . . . . . . . . . . . . . . . . . . . 463.2.3 Main Engine (3) . . . . . . . . . . . . . . . . . . . . . . . . 483.2.4 EEDI (4) . . . . . . . . . . . . . . . . . . . . . . . . . . . . 493.2.5 Overall . . . . . . . . . . . . . . . . . . . . . . . . . . . . . . 49
4 Future Work 52
5 Conclusion 54
A Appendix A - Data used for determining the influence of thesuperstructure on added resistance 58
B Appendix B - Wagening B-series 60
C Appendix C - Overview of DEToSC 63
D Appendix D - Reference ships for validation 67
E Appendix D - Beaufort Scales 74
ii
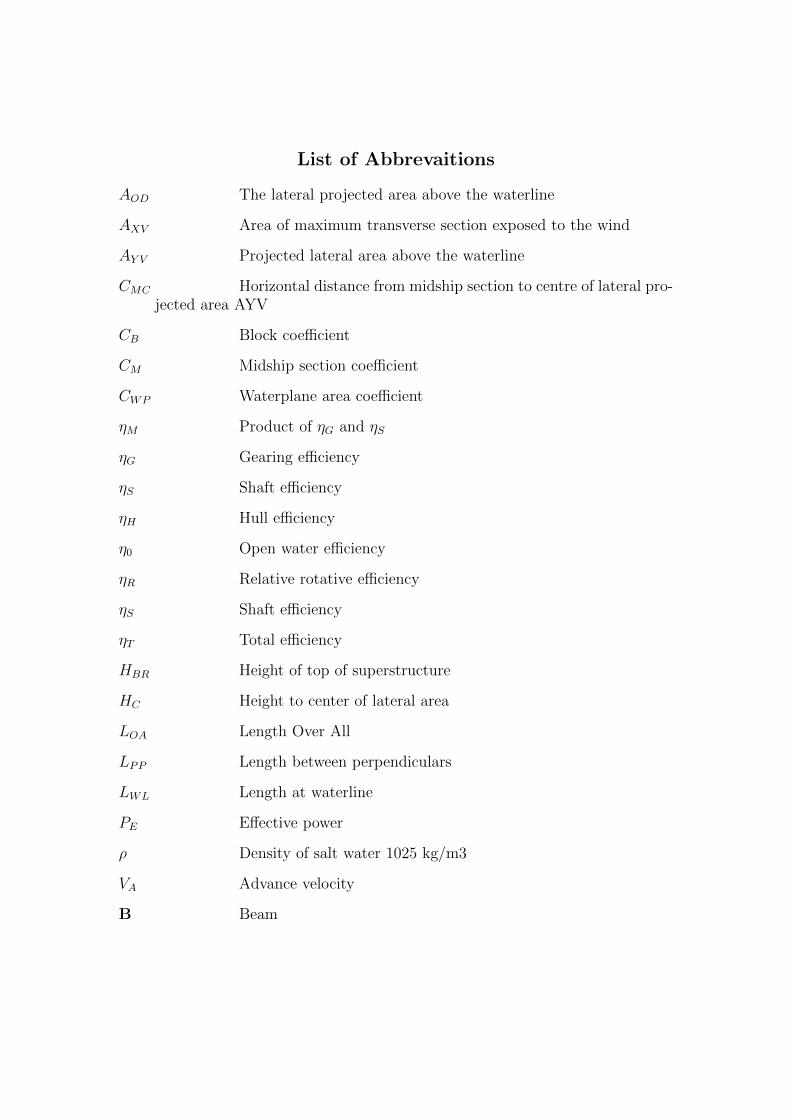
List of Abbrevaitions
AOD The lateral projected area above the waterline
AXV Area of maximum transverse section exposed to the wind
AY V Projected lateral area above the waterline
CMC Horizontal distance from midship section to centre of lateral pro-jected area AYV
CB Block coefficient
CM Midship section coefficient
CWP Waterplane area coefficient
ηM Product of ηG and ηS
ηG Gearing efficiency
ηS Shaft efficiency
ηH Hull efficiency
η0 Open water efficiency
ηR Relative rotative efficiency
ηS Shaft efficiency
ηT Total efficiency
HBR Height of top of superstructure
HC Height to center of lateral area
LOA Length Over All
LPP Length between perpendiculars
LWL Length at waterline
PE Effective power
ρ Density of salt water 1025 kg/m3
VA Advance velocity
B Beam

CPP Controllable Pitch Propeller
DWT Deadweight
D Propeller diameter
DEToSC Design Evaluation Tool of Ship Concept
EEDI Energy efficiency design index
EAR Blade area ratio
Fn Froude number
FPP Fixed Pitched Propeller
GUI Graphical User Interface
ITTC International Towing Tank Conference
J Advance coefficient
KPI Key Performance Indicators
KT Dimensionless Thrust coefficient
KQ Dimensionless Torque coefficient
LS Lightship
MCR Maximum continuous rating
n Revolutions per minute
Ps Propulsive power
P/D pitch/diameter ratio
Ro-RO Roll on and Roll of
Ro-pax Roll on and Roll of and passenger
RAR Added resistance, sum of RAA and RAW
RAA Added resistance due to wind
RAW Added resistance due to waves
RT Total resistance
SFOC Specific Fuel Oil Consumption

TD Design draft
t Thrust deduction
T Thrust
V Design speed
WC Weight of cargo
w Wake fraction


1Introduction
The section introduces the project, by describing the projects background,purpose and objective. Also the methodology and limitations are brought up
here.
1.1 Background
Merchant ship design is often a complex process where a lot of differentcompetence areas has to be merged to fully utilize the potential of designing an
effective and sustainable ship. Along the way of designing a ship there is a risk ofmissing important aspects due to the amount of participants in the design
process. In the early design phase of the project it is difficult to know what theresult will look like and what the outcome would be in terms of different keyperformance indicators (KPI). This information could be very helpful when
setting up a ship design project, where expectations and hopes are notnecessarily the same, and where calculations and budgets need to be accurate.An evaluation tool which in the early design phase can evaluate a conventionalmerchant ship from a ship’s transport requirements, is not known to exist. Shipdesigners today often use their own documents, experiences, tools, expertise etc.when taking on a ship design mission. A web based tool where all these areas can
meet, and be used by everyone to make an early evaluation of the ship issomething that could be very helpful.
For students within the field of Naval Architecture there is a need of goodresources to understand the complex processes within ship design. Since there
are a lot of different competence areas that overlap each other it is important togive a clear and transparent view of the process when designing a new ship. If
the student are given good tools and resources there is a greater chance that the
1
1.2. PURPOSE CHAPTER 1. INTRODUCTION
students even before graduation have good qualifications and understandingregarding ship design processes.
The ship design company ScandiNAOS AB have a desire to further develop theirmodel that contain certain parts and suggests that further development of thismodel should be carried out into an evaluation tool. Therefore has this been
suggested as a project for a master thesis.
1.2 Purpose
There are two important purposes when executing this project. The first is toassist ship designers around the globe to evaluate their merchant ships in an
early design phase. Hull form, propeller arrangement, engine type and outcomingkey performance indicators are aspects that will be generated and could helpthem estimating the ship outcome very early. The second purpose is, in aneducational way, build competence and understanding regarding ship designamongst students within the Naval Architecture field where big focus is the
educational part.
1.3 Objective
The objective of this project is to create a web based engineering tool for initialdesign of a merchant ship and provide important values for key performanceindicators (KPIs) such as fuel consumption and emissions for transport work
carried out. The objective is also that the web tool should be used in aneducational way where the report works as a manual from which the users can
get the details regarding the web tool’s functions.
1.4 Methodology
Basic knowledge regarding ship design is a prerequisite for executing a projectlike this which is gained within the courses of the masters program Naval
Architecture and Ocean Engineering. An overview of the ship design process isimportant to continue with the web tool development. By studying a lot of shipdesign literature, a theoretical framework could briefly be set up to continue thework. Specific design areas are identified and principles steps of ship design is set
up according to Figure 1.1.
2

1.5. LIMITATIONS CHAPTER 1. INTRODUCTION
Figure 1.1: Process with design steps
An understanding of the process is vital to early make good decisions andestimations regarding project length and structure. The project process continuestep by step identifying the different design areas and searching for empiricalrelations regarding the current ship parameters. Without performing any modeltests the empirical relations are an important part for continuing the project.Studying statistics from existing ships often give a brief view of the value of thedesign parameters.
The development of the web tool is an on going activity through the wholeprocess, gathering and expressing the literature into valuable code which
executes and presents the results on the screen. Efforts making the web tooleducational with an good interface is concentrated to the end of the project.The used tools for this project is the open source Net Beans Platform which
provides a software for developing web applications Java, JavaScript, HTML5,PHP, C/C++ and more. In this project JavaScript, PHP and HTML languages
are used.
1.5 Limitations
The development of the ship design evaluation tool has some limitations. Thelimitations occur within all different design areas from calculating the hull
resistance to choosing main engine.
3

1.5. LIMITATIONS CHAPTER 1. INTRODUCTION
Resistance methods
When calculating the calm water hull resistance there are different methods howto do this. The Holtrop-Mennen method is the only one used in this web tool.
Head wind assumption
The added resistance is calculated with respect to different attributes includingthe incoming wind direction which affects the ship. In this tool, head wind isalways assumed when calculating the added resistance. Head wind often gives
the most conservative results.
Propeller arrangements
Limited propeller arrangements are offered for evaluation. The maximum numberof propellers supported is two and the design tool supports only non-ducted
propellers with fixed pitch (FPP). More on the number of blades on eachpropeller in limited to between two and six.
Cavitation
When evaluating the propellers to pass the cavitation check the Keller criteria isthe only criteria used.
Engine selection
The main engine selection section is concentrated to two-stroke engines but onefour stroke main engine is offered with no gear box efficiency losses. Furthermore
no shaft generator equipment are included in the calculations.
Stability and manuevering
The design tool does not take stability and manuevering into account.
4

2Theoretical framework
To create a red line through the report and webpage, a theoretical framework isset up to describe the interacting design areas. The framework is to be seen as aguide through all the design steps in the order they are executed by the design
tool.The setup of this chapter is in the same order as they appear on the webpage.Small information-icons are also put out on the graphical user interface (GUI)where the user can find out more about the current topic. Hoovering over the
icon will present the information text.
2.1 Hull shape design
The first step in creating a ship is to determine shape of the hull. To define theshape the following parameters are used.
2.1.1 Main particulars
The first step involves the choice of main particulars for the vessel. The user isasked to select following main particulars:
- Shiptype- Length overall (LOA)
- Beam (B)- Design draft (T)- Design speed (V)- Cargo capacity
- RangeThe selection of main particulars will be used in further calculations and
estimations.
5

2.1. HULL SHAPE DESIGN CHAPTER 2. THEORETICAL FRAMEWORK
Ship type
Type of merchant ship. Eligible ship types are:- Container ship
- Tanker ship- Bulk carrier ship
- General cargo ship- Ro-Ro ship- Ro-pax ship
- Large pax ship (cruiser)- Small pax ship
The selected ship type will greatly affect the generation of ship particulars. Manyestimations of parameters through the design process is affected by the chosen
ship type.
Length overall (LOA)
The ship’s length overall [m]. Will be used when estimating length of waterline(LWL) and length between perpendiculars (LPP). The selection of length is thefirst step in a general merchant ship design process (Papanikolaou [2014]).Thelength can be estimated from the cargo capacity in a couple of different ways,
although it is not brought up here.
Beam (B)
The breadth at mid ship [m]. The selection of beam is used in further calculationswhen deciding the block coefficient CB. The user is always able to move back in
the tool to adjust this value in order to achieve a block coefficient as desired.
Design draft (T)
The design draft of the ship [m]. Selected with relation to a desirable blockcoefficient (resistance) and route limits. A lower draft gives lower friction
resistance but affect the stability and the maneuverability.
The draft is often affected by the depths on the navigating route. Wellknown-channels as Panama canal and Suez canal have restricted draft limitswhich ship designers have adapt to.
Design speed (V)
The design speed of the ship [kn]. The design speed is used when calculating thetotal resistance of the ship. It is also used when proposing a suitable block
coefficient with Van Lammerens method, see chapter 2.1.3.
6

2.1. HULL SHAPE DESIGN CHAPTER 2. THEORETICAL FRAMEWORK
The design speed, also called contract speed, defines the speed at a certain draft(design draft) for which the ship must be able to steam. The design speed couldbe interpreted as a guaranteed speed from the ship designer.
Cargo capacity
The merchant ship’s carrying capacity [ton]. Used when estimating the DWT ofthe ship, which affect the displacement.
Range
The range for which the ship should be able to operate in [nm]. A longer rangewill generate in a higher estimated DWT since larger fuel tanks is required andvice versa. Distances between certain ports are presented when hoovering the
information-icon on the GUI.
2.1.2 Ship particulars
This section describes the ship particulars, what they stand for and how they aregenerated in detail.
Figure 2.1: Ship particulars
7

2.1. HULL SHAPE DESIGN CHAPTER 2. THEORETICAL FRAMEWORK
Deadweight
The carrying capacity of the ship. This includes the cargo capacity, bunker,water and food supplies, crew etc. The deadweight is calculated as:
DWT = WC +WF +WPR +WCR (2.1)
where:WC: Weight of cargo
WF: WF1+WF2WF1: Weight of bunker
WF2: Weight of lubricantsWPR: Weight of provisions and waterWP: Weight of passengers and luggage
WCR: Weight of crew members and luggageThe bunker weight, WF1 is estimated according to Papanikolaou [2014]:
WF1 = (PB1 ∗ b1 ∗ t1) ∗ C ∗ 10−6 (2.2)
where:PB1: Required main engine power
b1: Specific fuel oil consumption, SFOC (g/kWh)t1: Time for a roundtrip (hours). Calculated as the range divided by service
speed (in this case the design speed).C=1.2-1.4: A constant margin reserve which refers to any unexpected events that
may occur during operation, such as change of course etc.Since the required main engine power and SFOC is not known at this stage,these parameters are estimated based on shiptype, cargo capacity, range and
chosen design speed. The required main engine power can be estimated accordingto Figure 2.2, where the ratio between installed propulsion power and
displacement weight are shown. A mean value of the coefficient intervals are usedrespectively for each shiptype. The installed propulsion power are divided withηM which is the product of the gearing efficiency (ηG) andthe shaft efficiency
(ηS). By including the ηG, considering an eventual gearbox, the results becomeconservative. ηS = 0.99 according to MAN [2013] and ηG = 0.965 for medium
speed diesel engines according to King [2013].Auxiliary engines bunker weight are neglected since the effect is insignificant.
This is validated in Chapter 3.2.1.
8

2.1. HULL SHAPE DESIGN CHAPTER 2. THEORETICAL FRAMEWORK
Figure 2.2: Ratios between installed propulsion and power and displacement of differenttypes of ships (Papanikolaou [2014], p.182)
To extract the propulsion power Ps from the ratio Ps/displacement, thedisplacement must be known. The displacement is the sum of the deadweightand the lightship weight, and the lightship weight are estimated according toTable 2.1. To extract the lightship weight from the table, DWT ≈ cargocapacity. This approximation is validated in Chapter 3.2.1.
The fuel consumption is estimated according to Papanikolaou [2014] where a lowspeed diesel engine has a specific fuel consumption of 170 g/kWh.
The weight of the lubricants, WF2 are estimated as 2-4% of the bunker weight(Papanikolaou [2014]).
The amount of crew members is set to 20 for every shiptype, except for thepassenger ships where weight of passengers and crew, together with
corresponding provisions, fresh water etc, should be included in ”Cargo capacity”.The amount of food for each crew member is set to 20kg, and the amount of
fresh water is according to Papanikolaou [2014] around 80-100 ton for a standardcargo ship. This will give the weight of the provisions and water, WPR.
Weight of passengers and luggage, WP=0 for all cargo ships. For the passengersships, this weight should be included in the ”Cargo capacity”. The crew weight isestimated by an average weight of 75kg/person, together with an average weightof luggage of 50kg/person (Papanikolaou [2014]). Note that the weights of the
crew and supplies will have a small effect on the ship’s total deadweight,therefore no more effort will be given on this.
9

2.1. HULL SHAPE DESIGN CHAPTER 2. THEORETICAL FRAMEWORK
Lightship
The lightship weight is estimated from:- Shiptype
- DWT- LOA
In Table 2.1 in column 3, DWT/displacement (ratioDWT/disp) relations arepresented for different ship types of various sizes. Since DWT is already
estimated before entering this step in the design tool (see Chapter Deadweight)the relation can instead be used to estimate the LS/displacement (ratioLS/disp)
according to equation:
ratioLS/disp = 1− ratioDWT/disp (2.3)
Using this equation together with the relationship between LS, DWT anddisplacement:
LS +DWT = displacement (2.4)
which gives the final equation:
LS =DWT
ratioDWT/disp
(2.5)
Since the ratios for each shiptype are described in intervals, a mean value of eachof the intervals are used for the corresponding shiptype and size. In case of usingship data that not fit into the size intervals, an alert is given to inform the userthat a correct lightship estimation is not fully supported. If the chosen shiptype
have more than one size interval, a mean value of all ratioDWT/disp will be used inthe calculation of the lightship weight.
10

2.1. HULL SHAPE DESIGN CHAPTER 2. THEORETICAL FRAMEWORK
Table 2.1: Size and weight group relations for different ship types. Column 3 presentsDWT/disp relation from where LS/disp relation is extracted.
Displacement
The total weight of the ship, [ton]. It can also be interpret as the weight of thevolume of displaced water. Salt water is assumed where ρ = 1025kg/m3.
Displacment = DWT + LS (2.6)
The displacement value is automatically updated when either LS or DWT ischanged.
LPP
Length between perpendiculars, [m]. From forward perpendicular, a vertical linewhere the stem meets the waterline, to aft perpendicular, normally at the rudder,
see Figure 2.1. LPP is estimated by comparing a number of 20 existing vesselswith respect to LOA and LPP . A ratio between the two parameters are found and
11
2.1. HULL SHAPE DESIGN CHAPTER 2. THEORETICAL FRAMEWORK
expressed as:
LPP = LOA ∗ 0.95 (2.7)
LWL
Length at waterline, [m]. For containers, tankers and bulkers, Kristensen andLutzen [2012]) equations are used:
LWL = LPP ∗ 1.01 (containers) (2.8)
LWL = LPP ∗ 1.02 (tankers and bulk) (2.9)
For the remaining shiptypes there is a general estimation by MAN [2013] whichis expressed as:
LWL = LPP ∗ 1.031 (general) (2.10)
2.1.3 Hull coefficients
At this stage the parameters that describe the hull shape is defined.
CB
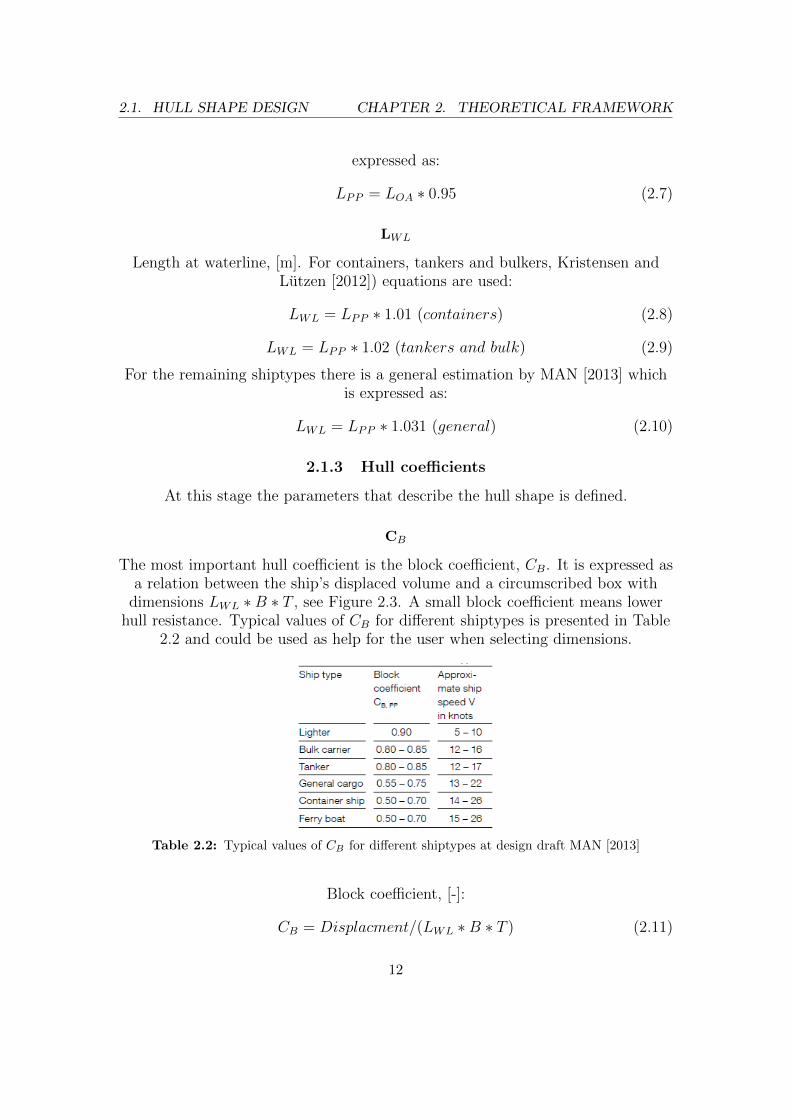
The most important hull coefficient is the block coefficient, CB. It is expressed asa relation between the ship’s displaced volume and a circumscribed box with
dimensions LWL ∗B ∗ T , see Figure 2.3. A small block coefficient means lowerhull resistance. Typical values of CB for different shiptypes is presented in Table
2.2 and could be used as help for the user when selecting dimensions.
Table 2.2: Typical values of CB for different shiptypes at design draft MAN [2013]
Block coefficient, [-]:
CB = Displacment/(LWL ∗B ∗ T ) (2.11)
12

2.1. HULL SHAPE DESIGN CHAPTER 2. THEORETICAL FRAMEWORK
Figure 2.3: Hull coefficients
The block coefficient can also be estimated from the length, LWL, and the shipspeed, V. Van Lammeren (Papanikolaou [2014] p.150) uses a semi-empirical
method considering hydrodynamic and economic critera and expresses the blockcoefficient as:
CB = 1.08Fn− 1.68Fn− 0.224Fn2 (2.12)
where Fn is the Froude number:
Fn =V√
g ∗ LWLg = 9.81m/s (2.13)
At the GUI of the web tool the user is provided the estimated value of CB whenproceeding to the next step after the calculated CB value is shown. Providing
this value helps the user to define a proper value of CB.
CM
The midship section coefficient is described as the transverse area of theimmersed midship section AM dividied by the area of a rectangular with
dimensions BWL*T, see Figure 2.3. The midship section generally do not have asignificant effect of the ship’s resistance and typical values are 0.98-0.99 for
bulkers and tankers, and 0.97-0.98 for containers (MAN [2013]).There are different methods to estimate CM from CB but the different formulas
provide similar results. In Figure 2.7 an analysis of four different methods isprovided. The Figure shows that for typical values of CB = 0.5− 0.9, the
methods provides similar results. The chosen method for the DEToSC tool is”Laboratory HSVA (Hamburg)” (Papanikolaou [2014] p.158) since it is most
recent estimation formula and provides a reasonable value of CM . It also gives arepresentative result of CM .Midship block coefficient, [-]:
CM =1
1 + (1− CB)3.5(2.14)
13

2.1. HULL SHAPE DESIGN CHAPTER 2. THEORETICAL FRAMEWORK
Figure 2.4: A comparison of different methods to estimate midship section coefficient CM .
The value of CM is set to be maximum 0.99 to provide reasonable results infurther calculations.
CWP
The waterplane area coefficient measures the ratio between the waterplane areaand the circumfering box with dimensions LWL ∗BWL and is significantlyaffected by the transverse sections and CB and CM . The coefficient greatly
affects the stability of the ship due to change of the moment of inertia. Generallythe water plane are coefficient are slightly higher (+0.1) than the CB but on fastvessels where the stern is also immersed in the water, the CWP difference will be
larger (MAN [2013]).There are several methods of how to estimate CWP . The methods consider
different stern types but in general the results from each method are very similar.An analysis of the different methods are shown in Figure 2.5, where the methodshave been evaluated for CB = 0.4− 0.99 with a constant CM = 0.98. A variationof CM from 0.97-0.99 give similar results. The chosen method for the DEToSC
tool is ”Normal section” (Papanikolaou [2014] p.163).Waterplane area coefficient, [-]:
CWP =1 + 2CB
3(2.15)
14

2.1. HULL SHAPE DESIGN CHAPTER 2. THEORETICAL FRAMEWORK
Figure 2.5: Different mehods to estimate CWP according to different values of CB whenCM = 0.98.
2.1.4 Superstructure parameters
To calculate the added resistance due to wind, the design and size of thesuperstructure is needed. The superstructure design are divided in six
parameters explaining the size of different areas of the superstructure, includingthe lateral and transverse location of those areas, see Figure 2.7. The parametersare estimated according to the chosen size of the ship where LPP and the beam,
B, of the ship are used.Since no earlier studies provide information on how to estimate the
superstructure areas, new relations between size of the ship and the neededparameters needs to be extracted. From looking and comparing 20 existing ships
of various types the relationships are invented. To further look on how biginfluence the wind has on the total added resistance, a short comparison isperformed between a typical containership with generated superstructure
parameters according to the formulas, and a containership completely withoutsuperstructure. The comparison is made looking at Beaufort states from 3 to 9
and the results are shown in Figure 2.6. Note that the results provide the relativedifference between the two cases. Thus for example an added resistance in
Beaufort 3 with a superstructure of 5%, will result in, if the superstructure isremoved, an added resistance of 4%.
15

2.1. HULL SHAPE DESIGN CHAPTER 2. THEORETICAL FRAMEWORK
Figure 2.6: Shows the difference in added resistance between a ship with generated super-structure parameters, and a ship without. Main dimensions and other data for the currentship can be found in Appendix A.
From the figure it is clear that the superstructure affects the total addedresistance, but it is obvious that the wind is not the major factor in the totalamount of added resistance, especially not in heavier weather conditions.
By showing this the influence of wrongly estimated superstructure parameters isnot a major factor and will not affect the total calculated added resistance
significantly.
Figure 2.7: Superstructure parameters
AOD
The lateral projected area above the waterline, [m2]. Estimated to 3LPP .
16
2.1. HULL SHAPE DESIGN CHAPTER 2. THEORETICAL FRAMEWORK
AXV
Area of maximum transverse section exposed to the wind, [m2]. Estimated to20B.
AY V
Projected lateral area above the waterline, [m2]. Estimated to 10LPP .
CMC
Horizontal distance from midship section to centre of lateral projected area AYV,[m]. Estimated to 0.05LPP .
HBR
Height of top of superstructure, [m]. Estimated to 20m.
HC
Height to center of lateral area, [m]. Estimated to 6m.
2.1.5 Added resistance due to wind and waves
The formulas and methods suggested by ITTC [2014] has been used as a base forcalculation of the added resistance, RAR. Both the wind, RAA, and wave, RAW,needs input such as speeds and heights. It was decided that the Beaufort’s scale
is to be used, so that the user will have an easier way to input neededparameters. In the calculation of wind resistance, head wind is always assumed.
RAR = RAA+RAW (2.16)
Beaufort scales
The scale consists of 13(0-12) different sea states that state wind speeds, waveamplitude and wave length from calm water, 0, to a hurricane, 12 (BEA). These
are used together with parameters mentioned earlier to determine the addedresistance. See Appendix E.
Shallow water
To determine the added resistance of shallow water effect another input is neededin the form of the height from sea bottom to water surface. Depending on the
chosen design speed, the user is given a water depth which gives no loss in terms
17

2.1. HULL SHAPE DESIGN CHAPTER 2. THEORETICAL FRAMEWORK
of resistance from the shallow water effect as a start value. The formulas used inDEToSC for this shallow water effect is based HydroComp Inc. (HydroComp
[2003]).
2.1.6 Calm water hull resistance
One important step is the estimation of the resistance the ship will create whenmoving through the water at certain speeds. For this project the
Holtrop-Mennen method is used.
Holtrop-Mennen method
The Holtrop-Mennen method is based on regression for wave resistance. Itapproximates the ship as two points that generates the waves. The coefficientsused in the formula has been determined statistical through experiments and
existing data. It also uses the viscous resistance from ITTC-57.
2.1.7 Total resistance
The total resistance, RT, is then the sum of calm resistance and addedresistance. It is calculated as:
RT = RTH.M. +RAR (2.17)
Its components is then illustrated with a plot, see figure 2.8.
Figure 2.8: Example plot of total resistance from DEToSC
18

2.2. PROPELLER DESIGN CHAPTER 2. THEORETICAL FRAMEWORK
2.2 Propeller design
When the hull shape has been defined the next step is to select a propeller. Apropeller concept is about to be selected as well as the diameter of the propeller.The propeller dimensions will together with the resistance and other parameters
calculate the optimal open water efficiency (highest) according to someperformance critera.
Starting from this step two profiles are used for the ship. One design profile andone service profile. The design profile corresponds to what the engine and
propeller have to perform according to the contract which is not necessarily theservice condition. The service profile is the condition which the ship perform it’smission in. Figure 2.9 shows a ship’s speed distribution from which an averageservice speed could be extracted. The design speed according to the figure is
around 16 knots.
Figure 2.9: Example plot of speed distribution of a ship
On the DEToSC webpage a function exists that finds the optimal open waterefficiency. Read more about this in Chapter 2.2.3.
19

2.2. PROPELLER DESIGN CHAPTER 2. THEORETICAL FRAMEWORK
2.2.1 Hull efficiency
The first part of this step is to calculate the hull efficiency. This is calculatedaccording to:
ηH =(1− tSSPA)
(1− wTaylor)(2.18)
In turn tSSPA, thrust deduction according to SSPA (Bertram [2012]) and wTaylor,wake fraction according to Taylor(Younis [2002]) needs information about the
size, type and arrangement of the propeller.
Propeller diameter
For the diameter of the propeller the max size allowed on the ship is normally theone that give the highest open water efficiency, therefore a function has beenimplemented that calculates the max size allow. It is calculated according to:
Dpropeller = x ∗ TD [m] (2.19)
where:x: Tanker or bulk = 0.65, Container and other = 0.74, (MAN [2013])
TD: Design draft
Propeller arrangement
Depending on the arrangement of the propeller different number of propellers areused. Single screw use one propeller, twin screw use two propellers. This has
impact in the coming calculations, generally if one propeller is used no correctionis made but if two is used certain parameters are divided by two. The type ofarrangement also have an impact on what formula is used for calculating the
wake fraction, w and the trust deduction coefficient, t.The arrangement with twin skeg - twin screw propellers have almost unchangedvalues of w and t compared to single skeg - single screw arrangement. Therefore
the hull efficiency for this arrangement is calculated according to single skeg -single screw (MAN [2013]).
Propeller type
The DEToSC tool only evaluates propeller types of FPP, fixed pitch propellers.The fixed pitch will be optimized to the service speed of the vessel.
20

2.2. PROPELLER DESIGN CHAPTER 2. THEORETICAL FRAMEWORK
Wake fraction coefficient
The wake fraction coefficient describes the relation between the arriving velocity(speed of advance) at the propeller and the ship speed. The wake fraction is
expressed as:
w =V − VAV
(2.20)
V is the ship speed and VA is the speed of advance. Since the speed of advance innot known at this stage the wake fraction coefficient needs to be estimated.
There are many different techniques of how to estimate w and a lot of authors usedifferent formulas. A comparison study is carried out and the results is presented
in Figure 2.10 for single screw ships, and Figure 2.11 for twin screw ships.
Figure 2.10: Comparison of different methods to estimate wake fraction for single screwvessels. CM = 0.98 and Dprop = 7.2m
Heckscher, Taylor and Kruger uses more simplified formulas only including hullcoefficients CB and CM , whereas Harvald uses more complicated formulas
involving also the stern type and the propeller diameter. The chosen method inthe DEToSC tool is Taylor’s (Bertram [2012]) and is expressed as:
w = 0.5CB − 0.05 (single screw) (2.21)
w = 0.55CB − 0.2 (twin screw) (2.22)
Thrust deduction coefficient
When the propeller rotates the water is ”sucked back” at the propeller and thiscauses some extra resistance to the hull. The thrust deduction is expressed as:
t =F
T(2.23)
21

2.2. PROPELLER DESIGN CHAPTER 2. THEORETICAL FRAMEWORK
Figure 2.11: Comparison of different methods to estimate wake fraction for twin screwvessels. CM = 0.98.
where F is ”the loss of thrust” and T is the total required thrust. The thrustdeduction factor t is dimensionless and increases in general when w increases.
For estimation of the thrust deduction coefficient at an early design stage thereare several existing techniques. A comparison of different methods is shown inFigure 2.12 for single screw vessels, and in Figure 2.13 for twin screw vessels.
Figure 2.12: Comparison of different methods to estimate thrust deduction for single screwvessels. CM = 0.98,Dprop = 7.2m, T=9m
22

2.2. PROPELLER DESIGN CHAPTER 2. THEORETICAL FRAMEWORK
Figure 2.13: Comparison of different methods to estimate thrust deduction for twin screwvessels. CM = 0.98,Dprop = 7.2m, T=9m
Hecksher and Danckwardt uses simplier formulas only considering CB and CM
whereas SSPA and Holtrop-Mennen uses more complicated formulas. The SSPAmodel use w in the model together with CWP (water plane area coefficient) and
CB, and Holtrop-Mennen use a combination of constants toghether withlength/breadth relations with draft and propeller diameter. For twin screw
vessels the thrust deduction coefficient will be much lower since the ”sucking” willoccur much further away from the hull than for a conventional single screw
arrangement. This phenomena is verified by the SSPA model when comparingthe single versus twin screw values of t.
When estimating the thrust deduction coefficient the model created by Bertram[2012] is used. The formula is expressed as:
t = w(1.57− 2.3CB
CWP
+ 1.5CB) (single screw) (2.24)
t = w(1.67− 2.3CB
CWP
+ 1.5CB) (twin screw) (2.25)
where w is wake fraction coefficient by Taylor’s for the corresponding blockcoefficient and single/twin screw arrangement. CWP is estimated according to
”Normal section”, see chapter 2.1.2 ”Hull coefficients”.
23

2.2. PROPELLER DESIGN CHAPTER 2. THEORETICAL FRAMEWORK
2.2.2 Set service profile
When designing the propeller it is important that the propeller is designed forthe condition which it operates most often in. Since the vessel will operate withdifferent speeds in different conditions it is difficult to set an optimal design for
the propeller. When setting up the service profile the user is given theopportunity to specify a service speed for the transport mission. This speed is
then used for finding the most optimal propeller.
Ship speed
The user specify the service speed [kn] when operating the transport mission.The speed affects the required thrust and therefore the design of the propeller.
Loading rate
The user is able to specify the loading rate for which the propeller should bedesigned for. The loading rate can be seen as an average percent of DWT the
ship will operate with and the propeller will be generated henceforth.
When adjusting the loading rate there will be a new displacement used in therequired thrust (resistance) calculation. Furthermore there will be a new draft ofthe ship which will affect the required thrust. The difference in draft is calculatedfrom the decreased DWT and the waterplane area coefficient Cwp. Thedifference in draft is expressed as:
Tdiff =DWTdiff/1.025
AreaWP
(2.26)
where AreaWP is the water plane area:
AreaWP = CwpLWLB (2.27)
Hence, the new draft:
Tnew = T − Tdiff (2.28)
Speed of advance, VA
The arriving water velocity [m/s] at the propeller disk. Calculated with theservice speed as:
VAService =Vservice1− w
(2.29)
24

2.2. PROPELLER DESIGN CHAPTER 2. THEORETICAL FRAMEWORK
Total resistance
The total hull resistance [kN] is calculated for the given service condition (servicespeed) according to the Holtrop-Mennen method as mentioned in Chapter 2.1.
Effective power
The effective power [kW] is calculated for the given service condition with theservice condition resistance and the new service speed:
PE = RT ∗ Vservice (2.30)
Required thrust
The required thrust for the specified service speed. Calculated as:
T =RTservice
1− t(2.31)
2.2.3 Search propeller
The DEToSc tool is capable of finding a suitable propeller according to the givenservice profile. It searches through the Wagening B-series propellers with a
couple of criteria:- Searching for highest possible open water efficiency
- Cavitation check for service speed- Cavitation check for design speed
The result is a 4-bladed non-ducted FPP with iterated values of:
- Optimum blade area ratio, EAR- Optimum pitch, P/D
- Required RPM for the given thrust
There is also an option for the user to specify the number of blades from 2-6. Intotal, 800 different combinations of EAR, pitch and number of blades areavailable for search request.
Input data
The input data used by the search propeller function is:- Thrust, T
- Speed of advance, Va- Propeller diameter, D
- Minimum RPM for propeller, n- Number of blades
The thrust is calculated from the hull resistance at the given design draft.
25

2.2. PROPELLER DESIGN CHAPTER 2. THEORETICAL FRAMEWORK
Wagening B-series
The Wagening B-series are a widely used fixed pitch, non-ducted propeller series.(Carlton [2012]) It contains of derived polynomials from 120 propeller modelstested at Netherlands Ship Model Basin in Wagening (Bernitsas et al. [1981]).
The propellers are evaluated for the ranges of:- Blade area ratio 0.30-1.05 (step 0.05)- Pitch-diameter ratio 0.5-1.4 (step 0.1)
- Number of blades 2-6
A plot of the open water characteristics of a 4-bladed propeller with EAR 0.5 isshown in Figure 2.14.
Figure 2.14: Open water characteristics for a propeller in Wagening B-series. The greenline corresponds to KT with constant thrust.
KT =T
ρ ∗ n2 ∗D4(Red line) (2.32)
KQ =Q
ρ ∗ n2 ∗D5(Dotted line) (2.33)
26

2.2. PROPELLER DESIGN CHAPTER 2. THEORETICAL FRAMEWORK
KT is the dimensionless thrust coefficient and KQ is the dimensionless torquecoefficient.
The x-axis on Figure 2.14 is the advance coefficient J which is a dimensionlessexpression of the speed of advance. It is expressed as:
J =Va
n ∗D(2.34)
The Wagening B-series polynomials can be found in Appendix B.
Deriving the highest open water efficiency
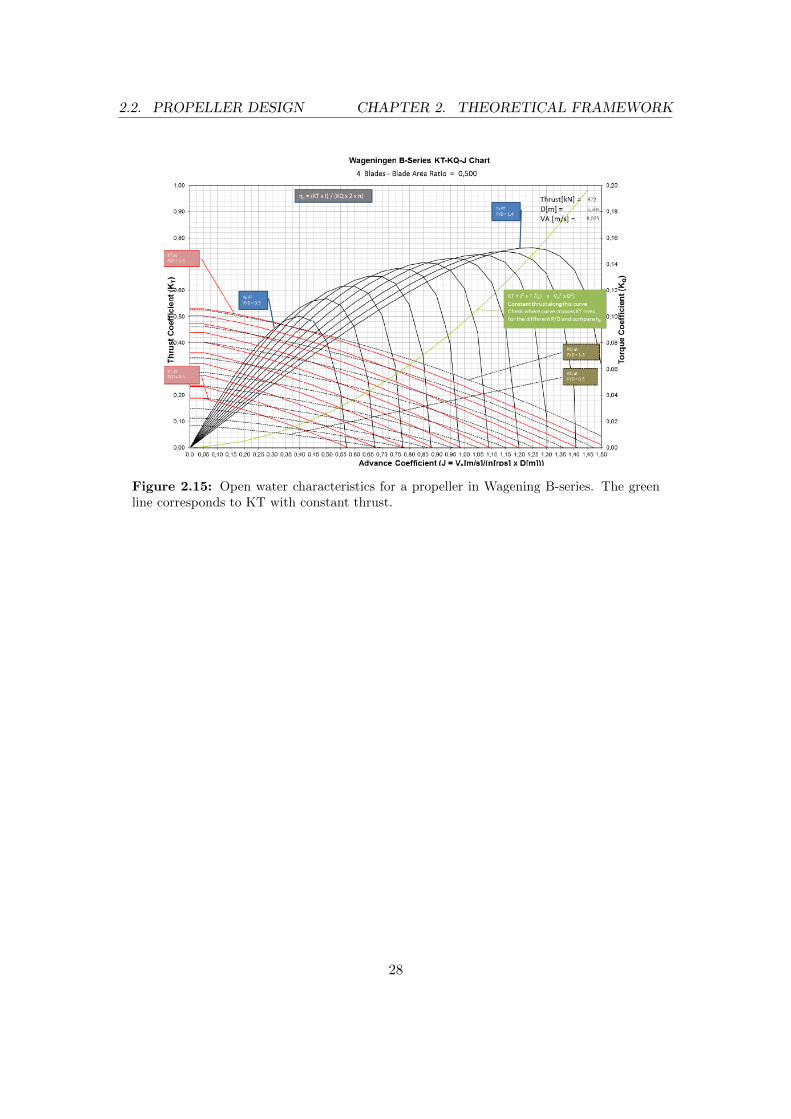
A KT-line with the required thrust (service profile) is plotted into the propellerdiagram, see Figure 2.15. KT is rewritten from equations 2.32 and 2.34 into:
KT = J2 ∗ T
VA2 ∗D2
(green line) (2.35)
At the intersection of the green (KT) and red (KT at P/D=0.5-1.4) lines, avertical line is drawn up to the corresponding η0 (η0 at P/D=0.5-1.4). This
action is performed for all the available P/D-ratios, see the blue lines in Figure2.16. A number of open water efficiencies are found with related P/D-ratios and
the highest efficiency and the corresponding PD-ratio are read and saved.The open water efficiency is expressed as:
η0 =KT
KQ∗ J
2π(2.36)
Where:J = VA
n∗D Advance coefficientVA = V ∗ (1− w) Advance velocity
n = propeller speed, [rpm]D = propeller diameter, [m]KT = Thrust coefficientKQ = Torque coefficient
27
2.2. PROPELLER DESIGN CHAPTER 2. THEORETICAL FRAMEWORK
Figure 2.15: Open water characteristics for a propeller in Wagening B-series. The greenline corresponds to KT with constant thrust.
28

2.2. PROPELLER DESIGN CHAPTER 2. THEORETICAL FRAMEWORK
Figure 2.16: Open water characteristics for a propeller in Wagening B-series. The redline and the blue vertical lines indicates the maximum open water efficiency for the differentP/D.
29

2.2. PROPELLER DESIGN CHAPTER 2. THEORETICAL FRAMEWORK
Minimum RPM
The user input of minimum value of RPM (n) results in a maximum value of Jaccording to equation 2.34. A small value of n results in a large value of J.
Therefore setting a higher minimum value of n there is a possibility that not allP/D-ratios are evaluated and the highest efficiencies are left out.
Cavitation criteria
The propellers are tested against cavitation according to the Keller criteria (readmore about cavitation and Keller in chapter 2.3.2). In order to ensure that thepropeller not only works properly at service speed, the cavitation check is also
performed for the design speed. According to the Keller criteria this often resultsin that lower blade area ratios are not selected since those would have hadproblems with cavitation at the higher design speed. According to this, an
optimum value of the blade area ratio is said to be found.
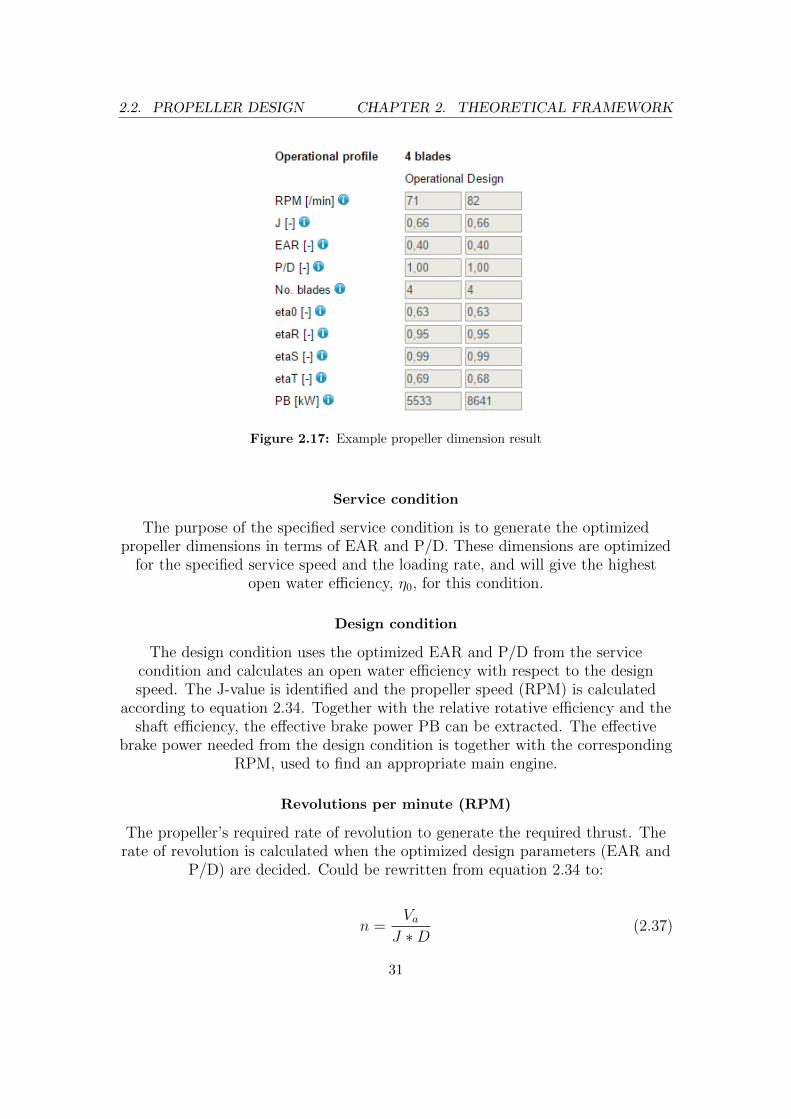
2.2.4 Propeller dimensioning results
The result from the ”Search propeller”-function is a 4-bladed propeller whichfulfills the criteria stated in section 2.2.3 ”Search Propeller”. The following
dimensions and efficiencies are presented (see Figure 2.17):- RPM [revolutions per minute]
- J [-]- EAR [-]- P/D [-]
- No. of blades [-]- η0[-]- ηR[-]- ηS[-]- ηT [-]
- PB [kW]
30
2.2. PROPELLER DESIGN CHAPTER 2. THEORETICAL FRAMEWORK
Figure 2.17: Example propeller dimension result
Service condition
The purpose of the specified service condition is to generate the optimizedpropeller dimensions in terms of EAR and P/D. These dimensions are optimized
for the specified service speed and the loading rate, and will give the highestopen water efficiency, η0, for this condition.
Design condition
The design condition uses the optimized EAR and P/D from the servicecondition and calculates an open water efficiency with respect to the designspeed. The J-value is identified and the propeller speed (RPM) is calculated
according to equation 2.34. Together with the relative rotative efficiency and theshaft efficiency, the effective brake power PB can be extracted. The effective
brake power needed from the design condition is together with the correspondingRPM, used to find an appropriate main engine.
Revolutions per minute (RPM)
The propeller’s required rate of revolution to generate the required thrust. Therate of revolution is calculated when the optimized design parameters (EAR and
P/D) are decided. Could be rewritten from equation 2.34 to:
n =Va
J ∗D(2.37)
31

2.2. PROPELLER DESIGN CHAPTER 2. THEORETICAL FRAMEWORK
Advance coefficient (J)
The advance coefficient J is a dimensionless expression of the propeller’s speed ofadvance, see equation 2.34.
Expanded Area Ratio (EAR)
Also referred to as blade area ratio and is the surface area of the blades dividedwith the area of the propeller disk see Figure 2.18
Figure 2.18: Explanation of blade area ratio. It is the blade area divided by the propellerdisc area.
A factor of 0.55 is a normal value for conventional ships with moderately loadedpropeller. Ships with heavier propeller load may have higher values. The ratio isiterated in the search propeller function in the interval 0.3-1.05 with steps of 0.05.
Pitch/Diameter ratio (P/D)
The pitch is the distance one blade travels in one revolution. The pitch/diamaterratio is the difference between that distance and the diameter of the propeller.
See figure 2.19. The ratio is iterated in the search propeller function in theinterval 0.5-1.4 with steps of 0.1.
32

2.2. PROPELLER DESIGN CHAPTER 2. THEORETICAL FRAMEWORK
Figure 2.19: Pitch ratio (Dyne,Bark)
Number of blades
The possible selection of number of blades is 2-6.
Open water efficiency (η0)
Calculated from J, EAR, P/D and no. of blades, see equation 2.36. For moreinformation of how it is calculated see Chapter 2.2.3.
The open water efficiency is normally determined by performing an open watertest in a towing tank or in a cavitation tunnel. During this test the thrust andtorque is measured and then used to calculate the open water efficiency (Dyneand Bark [2005]). When this is not possible, the Wagening B-series propeller
diagrams are used.
Relative rotative efficiency (ηR)
The relative rotative efficiency, ηR stands for that the water flow into thepropeller has a kind of rotational flow. For a single skeg ship with one propellerηR is normally around 1.0-1.07 (MAN [2013]) which means that the rotationalflow in this case is beneficial. For a conventional ship with two propellers, ηR is
quite lower, around 0.98. For a twin skeg vessel with twin-screw the value isapproximately the same as for single skeg single screw concept.
The formulas used in the evaluation tool is Holtrop-Mennen from Carlton [2012]and are expressed as (for single skeg - single screw, and twin skeg - twin screw):
ηR = 0.992− 0.05908EAR + 0.07424(Cp− 0.0225LCB) (2.38)
and for single skeg twin screw as:
ηR = 0.9737 + 0.111(Cp− 0.0225LCB)− 0.06325 ∗ P/D (2.39)
33

2.2. PROPELLER DESIGN CHAPTER 2. THEORETICAL FRAMEWORK
Shaft efficiency (ηS)
The shaft efficiency is often around 0.99 which is the value used in the DEToSCtool. It depends on the alignment and lubrication of the shaft bearings, and also
if there is any gearbox installed.
Total efficiency (ηT )
The total efficiency ηT is a product of the previous efficiencies and expressed as:
ηT = ηH × η0 × ηR × ηS (2.40)
Brake power (PB)
The brake power is the required engine power to the propel the ship at givenconditions, see Figure 2.20. The brake power is used to chose an appropriate
engine for the ship.The shaft generator power take out (PTO) is included in the brake power but is
here assumed to zero.
Figure 2.20: Required power and brake power
The propeller diagram
The propeller diagram shows the current 4-bladed propeller as a function of theadvance coefficient J, see Figure 2.21. The blue and green line shows the thrustand torque coefficient for the given propeller design (given EAR and number of
propellers) together with the red line which corresponds to the open waterefficiency curve for the given P/D-ratio. The yellow line indicates the advance
coefficient J, and corresponding open water efficiency, η0.
34

2.2. PROPELLER DESIGN CHAPTER 2. THEORETICAL FRAMEWORK
Figure 2.21: Propeller diagram with one propeller
The propeller diagram is also capable of showing an alternative propeller designwith a another number of blades (2-6). This design and its corresponding KT,KQ and η0 is shown as dotted lines, see Figure 2.22.
Figure 2.22: Propeller diagram with two propellers
35

2.3. MAIN ENGINE SELECTION CHAPTER 2. THEORETICAL FRAMEWORK
2.3 Main engine selection
On the tab ”Main engine(3)” the first step for the user is to initiate the ”Searchfor engine” function by clicking on the associated button. This will activate afunction that matches engines(with stored engines on the database) with the
given setup from ”Hull shape(1)” and ”Propeller(2)”.
2.3.1 Search for engine
This function contains a number of steps which will end in a number of suggestedtwo-stroke engines and one four-stroke depending on the input. Information suchas fuel consumption at max load and at operating speed is then displayed. Thisoutput is displayed both in figures as well as in a table to get a good overview.
First, all of the stored engines is defined with its limits, defined by the minimumand maximum rpm and effective power that the engine produce, see Figure 2.23.
For this design tool MAN tier II engines has been chosen, both two- andfour-stroke.
Figure 2.23: two-stroke MAN engines stored in database, one box defines one MAN engine
In this figure the ”Design point” is displayed. It is this point, with rpm and brakepower from the design condition, that the function compares the limits of theengines and assesses if it is within an engines limits. If it passes the check itmoves to the group of suggested engines.
For the four-stroke engine the case is different. Since the four-stroke operates inan higher rpm, 500-1000, a gearbox is needed to connect with the propeller(rpm
within 50-190). With the gearbox the four-stroke engine matches most of the
36

2.3. MAIN ENGINE SELECTION CHAPTER 2. THEORETICAL FRAMEWORK
propellers and therefore only one four-stroke engines has been used in the designtool. Any efficiency on the gearbox has not be taken into consideration.
The next figure, Figure 2.24, gives a better view of the matched or suggestedengines with the propeller curve for that case.
Figure 2.24: Propeller curve with suggested two-stroke engines
Within the figure it is also possible to see the cases where cavitation can occur.This is viewed by checking the ”cavdata” checkbox. See Figure 2.25 for anexample.
37

2.3. MAIN ENGINE SELECTION CHAPTER 2. THEORETICAL FRAMEWORK
Figure 2.25: Propeller curve with suggested two-stroke engines and cavitation area
2.3.2 Cavitation data
In the propeller curve graph, the cavitation data are plotted. The cavitation datadescribes where in the graph there is a risk for cavitation. The data are extractedfrom the Keller Criteria which uses a blade area estimation technique where themean thrust are put in relation to the required blade surface area. The Keller
criteria is derived as:
AE
A0
=(1.3 + 0.3Z)T
(P0 − PV )D2+K (2.41)
whereAE/A0: Blade area coefficient
P0: Static pressure at centerline of the immersed propeller [kN/m2]PV : Vapour pressure [ 1.7 kN/m2]
Z: Number of bladesD: Propeller diameter [m]T: Propeller thrust[kN]
K is constant which varies with number of propellers and shiptype as:K = 0.0 for fast naval ships (twin screw)
K = 0.1 for slow merchant ships (twin screw)K = 0.2 for single screw ships
The formula can be rewritten as:
Tmax = (AE
A0
−K)(P0 − PV )D2
(1.3 + 0.3Z)T(2.42)
38
2.3. MAIN ENGINE SELECTION CHAPTER 2. THEORETICAL FRAMEWORK
where Tmax is a maximum thrust is calculated for a given blade area ratio of thedesign. This maximum thrust should not be exceeded to minimize the risk of
cavitation. The thrust is evaluated for all rpm as follows:
T =RT
1− t/no.Props (2.43)
where t is the given thrust deduction coefficient (derived from the hull form), andRT is the total resistance evaluated by the Holtrop-Mennen method for each rpm
with corresponding ship speed. To minimize risk of cavitation, T/Tmax < 1.For the chosen design of the propeller, there is a certain value of rpm from whicha cavitation risk is active. When using the Keller criteria, typically it is face and
back cavitation that are evaluated. The face and back cavitation will result inthrust breakdown and is something very important trying to eliminate or
minimize in the design.
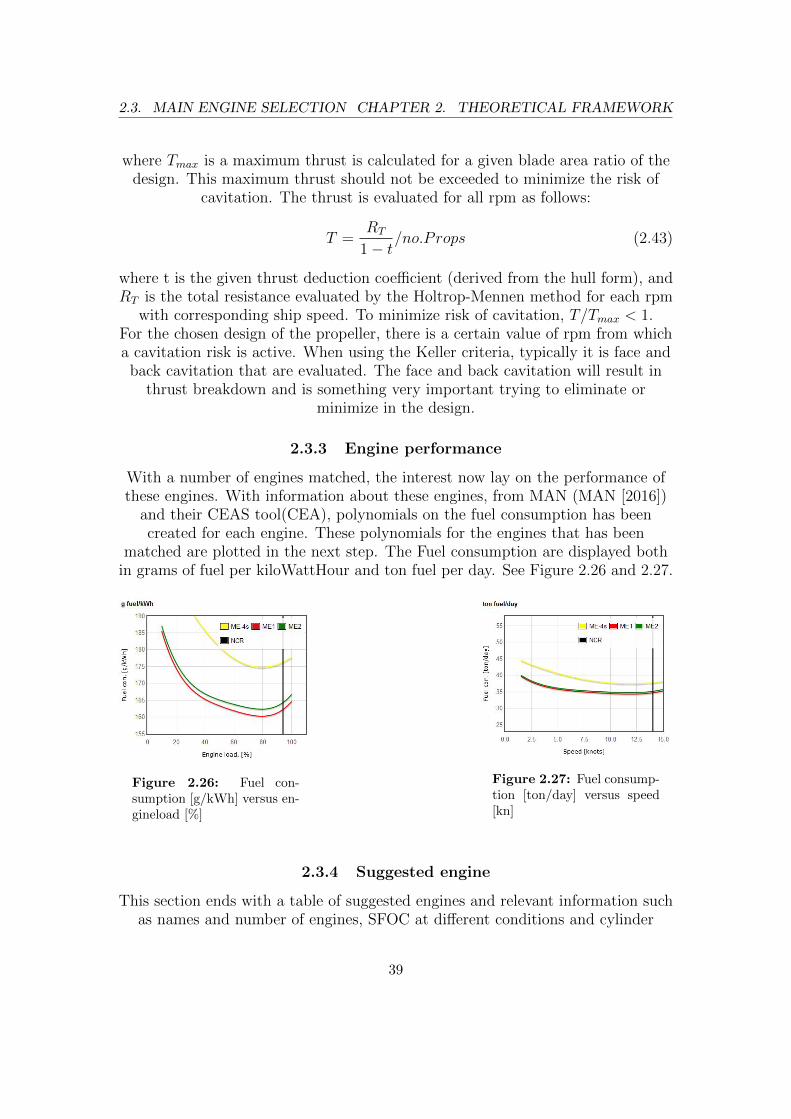
2.3.3 Engine performance
With a number of engines matched, the interest now lay on the performance ofthese engines. With information about these engines, from MAN (MAN [2016])
and their CEAS tool(CEA), polynomials on the fuel consumption has beencreated for each engine. These polynomials for the engines that has been
matched are plotted in the next step. The Fuel consumption are displayed bothin grams of fuel per kiloWattHour and ton fuel per day. See Figure 2.26 and 2.27.
Figure 2.26: Fuel con-sumption [g/kWh] versus en-gineload [%]
Figure 2.27: Fuel consump-tion [ton/day] versus speed[kn]
2.3.4 Suggested engine
This section ends with a table of suggested engines and relevant information suchas names and number of engines, SFOC at different conditions and cylinder
39

2.3. MAIN ENGINE SELECTION CHAPTER 2. THEORETICAL FRAMEWORK
utilization. In the SFOC columns the fuel consumption is displayed as gram fuelper kWh and as kg per day to better see the difference between the engines. Forthe last SFOC column, SFOC min, the minimum fuel consumption is displayed
together with the speed for that fuel consumption.With these graphs and the table a choice can be made on which engine the userwants to use. For further comparison an EEDI, Energy Efficiency Design Indexvalue can be calculated for each engine by going to the ”EEDI(4)” tab. More on
this in the EEDI chapter.
40

2.4. EEDI CHAPTER 2. THEORETICAL FRAMEWORK
2.4 EEDI
To evaluate the environmental impact of the engines an Energy Efficiency DesignIndex, EEDI, is calculated. The EEDI is an index the define the amount of
carbon dioxide that the ship produce during operation. The unit is gram CO2
per ton-mile.In these calculations a required EEDI and a attained EEDI is determined. Theattained EEDI have to be equal to or lower then the required EEDI. The EEDIhas been developed by IMO(IMO [2014]) and are today a commonly used index.By filling in some more information such as type of fuel on the main engine, theauxiliary engine and ice class, the user can then activate the function and receive
a required EEDI and a attained EEDI for all of the suggested engines. Theattained EEDI is calculated for the design condition, the operating condition and
for the case where the fuel consumption is at its lowest.
2.4.1 Required EEDI
The required EEDI is calculated with:
EEDIreq = a ∗ bc (2.44)
where:a,c are variables determined by the type of ship.
Table 2.3: EEDI required variables
Ship type a c
Container 174.22 0.201
Tanker 1218.80 0.488
Bulk 961.79 0.477
General cargo 107.48 0.216
Ro-Ro ship 1405.15 0.498
Ro-Pax ship 752.16 0.381
Large pax not used* not used*
Small pax not used* not used*
* EEDI not valid for this caseb = capacity(different depending on ship type).Capacity depends on ship type. See table 2.4.
V = volumek1 = 0.2+0.02*log10(V ) (ORGANIZATION [1983])
41

2.4. EEDI CHAPTER 2. THEORETICAL FRAMEWORK
Table 2.4: Capacities for different shiptypes
Ship type Capacity
Container 0.7*Deadweight
Tanker Deadweight
Bulk Deadweight
General cargo Deadweight
Ro-Ro ship Deadweight
Ro-Pax ship Deadweight
Large pax GT, not used (GT=k1*V)
Small pax GT, not used (GT=k1*V)
2.4.2 Attained EEDI
From the inputs by the user the attained EEDI can be calculated by:
Figure 2.28: Formula for EEDI
The first term, marked blue, is a summation of the main engines times the fjterm. fj is a correction factor that takes design elements in to consideration. Itdepends on the type of ship and the ice class and if no ice class is given fj = 1.
Each engine term is a multiplication of the engine power(PME), fuel typecoefficient(CFME) and the fuel consumption(SFOCME).
In similar fashion the auxiliary engine, marked orange, is a multiplication of thepower(PAE), fuel type coefficient(CFAE) and the fuel consumption(SFOCAE). Inthis design tool a simplified formula to estimate the size of the auxiliary engine is
used (Rowen et al. [1990]).
kWe = 100 + 0.55 ∗MCR0.7 (2.45)
42

2.4. EEDI CHAPTER 2. THEORETICAL FRAMEWORK
where:MCR= main engine maximum continus rating in kW.
The third term, purple, defines the shaft generator or motors. For the design toola choice has been made to not include this part. Both since more input is neededby user that could be hard to estimate and the design tool searches for a brakepower and estimates a main engine. No information about the auxiliary system.
In this case the simplified formula is used for an easy way to estimate oneauxiliary engine, no shaft generator. This term is removed.
The three terms for the Main engine, auxiliary engine and the shaft generator isadded and then subtracted with the saving from the efficiency technologies. Theefficiency technologies used in the design tool is a ”Air lubrication system” and a
”Waste heat recovery system”.This sum is then divided by the transport work:
fi ∗ Capacity ∗ Vref ∗ fw (2.46)
fi is a capacity factor for any technical/regulatory limitations on capacity. Itdepends on ship type and ice class and if no ice class is given fi = 1.
Vref is the speed in knots.fw is a coefficient that indicate the decrease of speed in different sea conditions,
for example Beaufort 3. For most new ships fw = 1.
43

3Results
3.1 DEToSC (Design Evaluation Tool of Ship Concept)
The work of this thesis has resulted in a design tool accessible on the webpagepaae.se under the SSEM Display section. An overview of the page and its tabs
can be seen in Appendix C.
3.2 Validation of DEToSC
The validation of this design tool has been performed by comparing its output toexisting ships and their data. The validation has been divided into different
section to better validate the design tool. This way each sections output does notdisturb the next sections output(a fault in an early stage will be carried on and
cause an impact). The input for each section is the data from the reference ships.The ships chosen to be reference ships is called RoRo1, RoRo2 and general1, Two
Ro-Ro ships and one general cargo. See Appendix D for information on thereference ships. Due to the fact that the data available on existing ships does not
contain all the information that is needed, only the first few sections could bevalidated separately. Therefore an overall validation has been performed. This
validation is easier to perform since the input is only the ship particulars.
3.2.1 Hull shape (1)
The first validation is on the ship particulars and the hull coefficients followed bythe resistance calculations.
44

3.2. VALIDATION OF DETOSC CHAPTER 3. RESULTS
Generate ship particulars
As Table 3.1 displays in the difference column it determines the ship particularsquite well. Most of the variables differ by only ± 3%.
Table 3.1: Validation of ship particular
Input RoRo1 RoRo2 General1
LOA 183,1 190,2 199,9
Beam 25,2 26 31
Draft 7,5 7,5 11,5
Cargo capacity - 12000 37000
Range - 6000 10000
Shiptype Ro-Ro Ro-Ro General cargo
Output Reference DEToSC Difference Reference DEToSC Difference Reference DEToSC Difference
Deadweight 12500 - - 14000 12834 -8% 40000 38991 -3%
Lightship 9167 - - 10174 10501 +3% 14000 14790 +6%
Displacment 21667 - - 24174 23335 -3% 54000 53781 -0,4%
LPP 172,82 174 +1% 178,6 181 +1% 191 190 -1%
LWL 174 179 +3% 183,716 187 +2% 191 196 +3%
Deadweight estimation
An approximation of the deadweight ≈ cargo capacity, when extracting thelightship weight from the ratio lightship/displacement in Table 2.1, shows no
significant effect on the result.Neglecting the auxiliary engines bunker weight gives a lower deadweight. Avalidation shows that auxiliary engines bunker weight up to 300 tons can beneglected since it will result in no change of the block coefficient CBb. The
validation is performed with a containership with LOA=200m, B=30m, T=9m,Design speed=16kn, Cargo capacity=20,000 ton, Range=2000nm, CB=0.56.
Generate hull coefficients
The next validation is on the hull coefficients and the results can be seen in table3.2. It can be seen that the block coefficient, CB, differ from -0,3% to +6%. Theother outputs, the midship coefficient and waterplane area coefficient, does nothave enough reference data to compare with. Only RoRo2 have information on
these.
45

3.2. VALIDATION OF DETOSC CHAPTER 3. RESULTS
Table 3.2: Validation of hull coefficients
Input RoRo1 RoRo2 General1
Deadweight 12500 14000 40000
Lightship 9167 10174 14000
Displacment 21667 24174 54000
LPP 172,82 178,6 191
LWL 174 183,716 191
Beam 25,2 26 31
Draft 7,5 7,5 11,5
Output Reference DEToSC Difference Reference DEToSC Difference Reference DEToSC Difference
Cb 0,6219 0,66 +6% 0,672 0,67 -0,3% 0,7717 0,79 +2%
Cm - 0,98 - 0,991 0,98 -1% - 0,99 -
Cwp - 0,77 - 0,852 0,78 -8% - 0,86 -
Resistance calculation
In this validation certain inputs are now lacking from the reference ships as wellas some of the outputs to compare with. The reference ship RoRo2 contain
enough data to make a full comparison on.
Table 3.3: Validation of the resistance calculations
Input RoRo1 RoRo2 General1
Deadweight 12500 14000 40000
LOA 183,1 24174 54000
LWL 174 183,716 191
Beam 25,2 26 31
Draft 7,5 7,5 11,5
Stern type normal normal normal
Design speed 18 19,5 17
Cb 0,6219 0,672 0,7717
Cm - 0,991 -
Added res. - 0 0
Output Reference DEToSC Difference Reference DEToSC Difference Reference DEToSC Difference
RT 647 0,608,9 -6% 679,55 786,7 +16% - 1140,8 -
3.2.2 Propeller (2)
The second validation is on the propeller section of the design tool. This sectioncontains four parts, hull efficiency, propeller dimensioning, relative rotative
efficiency and the brake power. The reference data to use as inputs and compare
46

3.2. VALIDATION OF DETOSC CHAPTER 3. RESULTS
outputs to, on these parts, are all lacking some data therefore the validation onthis section is not so accurate.
Hull efficiency
For the hull efficiency a full comparison could only be performed on the referenceship RoRo2. See table 3.4.
Table 3.4: Validation of hull efficiency
Input RoRo1 RoRo2 General1
Prop.con. Single Single Single
Diameter Prop. 5,2 5,5 6,8
Cb 0,6219 0,672 0,7717
Beam 25,2 26 31
LPP 172,82 178,6 191
Stern type normal normal normal
Output Reference DEToSC Difference Reference DEToSC Difference Reference DEToSC Difference
w - - - 0,21 0,285 +36% - - -
t - - - 0,2 0,171 -15% - - -
etaH 1,14 1,16 +2% 1,013 1,16 -15% 1,21 1,19 +2%
47

3.2. VALIDATION OF DETOSC CHAPTER 3. RESULTS
Propeller dimensioning, eta0
The way that the design tool is designed, the input for this part, the thrust, canonly be modified by changing the operating speed. By changing it, a thrust thatmatch the thrust from the reference ships can be achieved and a comparison can
be performed. See table 3.5.
Table 3.5: Validation of propeller dimensioning
Input RoRo1 RoRo2 General1
Thrust 785 865 -
Output Reference DEToSC Difference Reference DEToSC Difference Reference DEToSC Difference
RPM 122,5 137 +12% 128 130 +2% 85,5 - -
J - 0,55 - - 0,55 -15% - - -
EAR - 0,65 - - 0,8 - - - -
P/D - 0,9 - 1 0,9 -10% 0,765 - -
blades - 4 4 4 5 -
eta0 0,61 0,58 -5% - 0,57 - 0,559 - -
Relative rotative efficiency
This part is lacking to much input data on the reference ships to be able toperform a good validation. Information on the longitudinal center of buoyancy,prismatic coefficient, blade area ratio and pitch ratio are needed also some data
from previous parts. The output is the Relative rotative efficiency.
Brake power, PB
Since this part need inputs from previous parts a validation can not beperformed. The information needed are hull efficient, open water efficient,
relative rotative effficienct, shaft efficiency, sea margin and engine margin. Theoutput is the brake power, PB.
3.2.3 Main Engine (3)
The output from the ”Main Engine (3)” tab is a number of suggested engines.Since the tool only use MAN engines the best validation would be to compare
the suggested engines to that of ships with MAN engines installed. It can also becompared to reference ships that do not have MAN engines by comparing its
engine to a MAN engine. This way the validation can be performed by checkingthat the design tool either suggest one of equal size or a larger engine. In thecase where the design point lies outside all of the MAN two-stroke engines the
48

3.2. VALIDATION OF DETOSC CHAPTER 3. RESULTS
design tool will give no suggestion for two-stroke but will always give asuggestion for a four-stroke engine. If a MAN two-stroke engine still is desiredchanges need to be made. For the three reference ships the following engines
where suggested, see table 3.6.
Table 3.6: Validation of Main engine
RoRo1 RoRo2 General1
Engine Name Power [kW] Name Power [kW] Name Power [kW]
Installed 1xSulzer 7 RTA52U 10920 2xMAN 9L48/60B 18000 1xMAN 6S60ME 17661
Suggested
4-stroke 1xMAN 12V48/60CR 14400 1xMAN 14V48/60CR 16800 1xMAN 16V48/60CR 19200
2-stroke - - - - - -
3.2.4 EEDI (4)
The fourth and the last individual validation is on the EEDI section. The EEDIis calculated according to IMO (IMO [2014]) and the values calculated for the
reference ships are close to that of existing ships values. See table 3.7.
Table 3.7: Validation of EEDI
EEDI req EEDI at Design speed
RoRo1 12,81 9,54
RoRo2 12,1 9,88
General1 10,9 8,54
3.2.5 Overall
To be able to perform a validation of this design tool an overall validation hasbeen chosen. In this case it has been decide to compare the Brake power output
to that of the data from the reference ship. The input for this validation hasbeen the ship particulars. See table 3.8.
49

3.2. VALIDATION OF DETOSC CHAPTER 3. RESULTS
Table 3.8: Overall validation
Input RoRo1 RoRo2 General1
LOA 183,1 190,2 199,9
LPP 172,82 178,6 191
LWL 174 183,715 191
Beam 25,2 26 31
Draft 7,5 7,5 11,5
Deadweight 12500 14000 40000
Lightship 9167 10174 14000
Displacement 21667 24174 54000
Shiptype RoRo RoRo General cargo
Design Speed 18 19,5 17
Propeller Diameter 5,2 5,5 6,8
Output
PB ref 10920 18000 17661
PB DEToSC 12542 16507 21370
Difference +15% -8% +21%
50

3.2. VALIDATION OF DETOSC CHAPTER 3. RESULTS
51

4Future Work
One step or function in this design tool that there was a hope to implement inDEToSC was that of a route simulation. The function would for instance take aroute as input from a map and then use statistics on the weather to calculate theadded resistance, use the length to decide amount bunker and more. Data needed
to get as accurate conditions for the mission as possible. This function wasdecided to not be of high priority until more important steps/function had beencreated. Since it was deemed large and complicated it was never implemented.Another implementation that was discussed but not implemented was to have
two different start points, either ”Design new ship” or ”evaluate existing ship”. Atthis moment everything lies within ”Design new ship” where there is possibility toboth design a new ship and input information from a reference ship to evaluate
an existing ship. By separating the start point, a better structure for the”evaluate existing ship” is possible and make it so a user could both input their
own values or select a reference ship from stored ships.Today only certain information is stored on a database. A wish was to improvethe connection and the usage of the database so that the user can create and
store their ships and new ships in our design tool. This way the user cancompare his or her designs with each other. Another good thing about the
storing of data is that it will become a source of information about new ships andexisting ship which can be used by ScandiNAOS AB or students to learn,
validate designs or validate functions.In the first part, hull design, two things would be good to look at. First the
superstructure parameter. More reference data needs to be gathered to create agood formula for estimating these parameters if they are not known. The secondthing links with the route simulation mention earlier, how to implement that into
resistance calculation. Perhaps by first having one calm resistance calculationand then when the user comes to the route simulation calculate a resistance with
52

CHAPTER 4. FUTURE WORK
the added resistance.Some changes to the search propeller function like displaying more of the
approved propeller designs could be made. The function gives the design whichgives the best open water efficiency, but it could be interesting to see the otherapproved propeller designs with their lower open water efficiency. The function
could be written in such a way that it displays all the approved designs.In the design tool it was decided to use MAN-engines, since they are widely used
and have much information about their engines. The design tool needs to beexpanded in the Main engine section with more brands and more engines. The
validation on the engine part resulted in a four-stroke engine for all of thereference ships, due to the rpm and brake power. With lower rpm or brake power
two-stroke engines would have been suggested. If there would have been moreengines of different brands more suggested engines could be displayed and a goodcomparison between the brands could be made. The design tool does not look at
auxiliary engines or shaft generators, it only estimate these in the EEDIcalculations. A new part could be made that calculates these and gives some
suggestion.A study on the EEDI results of the design tool could be made. A number ofships needs to be designed and their EEDI values stored. By then comparingthese results, the EEDI value, type of ship and deadweight, with that of theregular values for those shiptypes and deadweights a good validation on the
EEDI calculations can be made.More reference ships and information on these is needed to perform a good
validation. A difficult step is to get a hold of all the information on the ship thatis needed to validate each part separately.
Opportunity exists to develop the tool further with new functions but alsoimprovements to the current functions. Also on the design tools visual aspect.
By making it user-friendly and modern more people are enticed to use it.
53

5Conclusion
The result seen as a web based design tool are over expectation. As a design toolto get a good overview over each element and how they interact it is very good.
The state of the design tool should give one of the planned users, student, a goodexperience and learn something from using it. It ties the separate area togetherand displays how they interact. For the other planned users, ship designers, thedesign tool needs more fixing and correcting of the outputs of each part so that
they are reliable.Looking at the result from each sections separate validation, a conclusion can be
drawn that the design tool is quite accurate to determine the lengths, weightsand block coefficient. On the other sections, starting from the resistance
calculations, the results are not as good. They differ more and are less accuratesince there are less reference data available.
An innovative idea implemented in this design tool is the view on at whatcondition the propeller should be optimized for. The search propeller functionoptimises for the service condition and not the design condition which is the
normal way of doing it. In the next step when selecting a main engine the designcondition is used since it needs to be able to perform at this condition. A slight
improvement on the open water efficiency has been seen in a few cases but astudy of this need to be performed to determine this improvement. Overall thesearch propeller works well, where it also takes cavitation into consideration for
both the service condition and the design condition.Regarding cavitation it is assumed that it has its maximum at design speed. This
will affect the blade area. By implementing it this way it is assured that thepropeller designed for the service condition does not get cavitation at the designspeed. This will results in fewer propeller cases that is approved by the ”search
propeller” function, but it ensures that the propeller will not be subject tocavitation in any service condition.
54

CHAPTER 5. CONCLUSION
The main engine selection function performs well, it always suggest engines thatis equal to or larger than the brake power at design speed. But it should be
expanded so that more engines from MAN and from other manufacturers can besuggested. The two resulting graphs on fuel consumption and the table that
presents the engines show the result in a good way. The project as a whole hashad a steep learning curve, where both knowledge in each section hull design,
propeller design and engine selection where gathered and knowledge in theprogramming language used where learned. The layup or structure of the code
can be improved. Since most of the knowledge have been self learned thestructure is not always as clear as it should be. Some functions could be
streamlined, minimized and made more logical to both lower the amount of codeas well as making it easier to understand for the coder.
The usability of the page have been implemented to a good degree. Throughoutthe steps and tabs exists a clear line and a possibility to go back is presented at
many parts. The results from every step and calculations is presented andexplained in the information icon. Figures and graphs is presented to give the
user as much understanding as possible. Some of which can be interacted with.As a webpage the goal was to create a page that contain much data yet looks
simple to be informative yet quick to get a grasp of the scope of the design tool.
55
Bibliography
Beaufort wind scale. http://www.navipedia.pl/en/naviaidsbeaufort.html.Accessed: 2016-03-20 to 2016-05-28.
Ceas engine calculations. http://marine.man.eu/two-stroke/ceas. Accessed:2016-03-25 to 2016-04-28.
M. M. Bernitsas, D. Ray, and P. Kinley. Kt, kq and efficiency curves for thewagening b-series propellers. 1981.
Volker Bertram. Practical Ship Hydrodynamics. 2012.
JS Carlton. The early development of the screw propeller. Elsevier Ltd, secondedition edition, 2012.
Gilbert Dyne and Goran Bark. Ship propulsion. 2005.
HydroComp. When does shallow water become a problem? 2003.
IMO. 2014 guidelines on the method of calculation of the attained energy efficiencydesign index (eedi) for new ships. 2014.
ITTC. Speed and power trials, part 2 - analysis of speed/power trial data. 2014.
Dr Koh Kho King. Power estimates. 2013.
Hans Otto Kristensen and Marie Lutzen. Prediction of resistance and propulsionpower of ships. 2012.
MAN. Man diesel turbo - basic principles of ship propulsion. 2013.
MAN. Ship propulsion - tier ii and tier iii. 2016.
INTERNATIONAL MARITIME ORGANIZATION. International conference ontonnage measurement of ships. 1983.
56

BIBLIOGRAPHY BIBLIOGRAPHY
Apostolos Papanikolaou. Ship Design - Methodologies of Preliminary Design.Springer Netherlands, 1 edition, 2014.
Alan L. Rowen et al. Marine diesel power plant practise. The Society of NavalArchitects and Marine Engineers, Technical And Research Program, 1990.
Prof. Dr. Galal Younis. Lectures on powering and propulsion. 2002.
57

AAppendix A - Data used for
determining the influence of thesuperstructure on added
resistance
Ship data for used ship en evaluation of the influence from head wind in addedresistance calculation:
58

APPENDIX A. APPENDIX A - DATA USED FOR DETERMINING THEINFLUENCE OF THE SUPERSTRUCTURE ON ADDED RESISTANCE
Ship 1
Parameter Value
Type Containership
LOA 200 m
B 30 m
T 9 m
Design speed 16 kn
Cargo capacity 20000 ton
Range 2000 NM
DWT 20577 ton
LS 8610 ton
Displacement 29187 ton
LPP 190 m
LWL 192 m
Cb 0.56
Cm 0.95
Cwp 0.71Ship 1.1 and 1.2 data:
Added resistance
Beaufort scale Ship 1.1 Ship 1.2 Relative difference
3 8% 10% 20%
4 22% 25% 12%
5 48% 54% 11%
6 85% 96% 11%
7 159% 176% 10%
8 294% 318% 8%
9 522% 556% 6%
59

BAppendix B - Wagening B-series
Coefficients for KT and KQ for the Wagening B-series polynomials are shown inTable B.1 and Table B.2. The coefficients are used to plot all the Wagening
B-series propellers in the web design tool.Below are the summation equations used to derive KT and KQ from thecoefficients. The coefficients are valid for Reynolds number Rn = 2× 10⁶.
KT =∑s,t,u,v
CTs,t,u,v × Js × (P/D)t × (Ae/Ao)u × zv (B.1)
KQ =∑s,t,u,v
CQs,t,u,v × Js × (P/D)t × (Ae/Ao)u × zv (B.2)
60

APPENDIX B. APPENDIX B - WAGENING B-SERIES
Table B.1: Coefficients for the polynomials of KT in Wagening B-series
KT
CTs,t,u,v s (J) t (P/D) u (Ae/Ao) v (Z)
0,00880496 0 0 0 0
-0,204554 1 0 0 0
0,166351 0 1 0 0
0,158114 0 2 0 0
-0,147581 2 0 1 0
-0,481497 1 1 1 0
0,415437 0 2 1 0
0,0144043 0 0 0 1
-0,0530054 2 0 0 1
0,0143481 0 1 0 1
0,0606826 1 1 0 1
-0,0125894 0 0 1 1
0,0109689 1 0 1 1
-0,133698 0 3 0 0
0,00638407 0 6 0 0
-0,00132718 2 6 0 0
0,168496 3 0 1 0
-0,0507214 0 0 2 0
0,0854559 2 0 2 0
-0,0504475 3 0 2 0
0,010465 1 6 2 0
-0,00648272 2 6 2 0
-0,00841728 0 3 0 1
0,0168424 1 3 0 1
-0,00102296 3 3 0 1
-0,0317791 0 3 1 1
0,018604 1 0 2 1
-0,00410798 0 2 2 1
-0,000606848 0 0 0 2
-0,0049819 1 0 0 2
0,0025983 2 0 0 2
-0,000560528 3 0 0 2
-0,00163652 1 2 0 2
-0,000328787 1 6 0 2
0,000116502 2 6 0 2
0,000690904 0 0 1 2
0,00421749 0 3 1 2
5,65229E-05 3 6 1 2
-0,00146564 0 3 2 2
61

APPENDIX B. APPENDIX B - WAGENING B-SERIES
Table B.2: Coefficients for the polynomials of KQ in Wagening B-series
KQ
CQs,t,u,v s (J) t (P/D) u (Ae/Ao) v (Z)
0,00379368 0 0 0 0
0,00886523 2 0 0 0
-0,032241 1 1 0 0
0,00344778 0 2 0 0
-0,0408811 0 1 1 0
-0,108009 1 1 1 0
-0,0885381 2 1 1 0
0,188561 0 2 1 0
-0,00370871 1 0 0 1
0,00513696 0 1 0 1
0,0209449 1 1 0 1
0,00474319 2 1 0 1
-0,00723408 2 0 1 1
0,00438388 1 1 1 1
-0,0269403 0 2 1 1
0,0558082 3 0 1 0
0,0161886 0 3 1 0
0,00318086 1 3 1 0
0,015896 0 0 2 0
0,0471729 1 0 2 0
0,0196283 3 0 2 0
-0,0502782 0 1 2 0
-0,030055 3 1 2 0
0,0417122 2 2 2 0
-0,0397722 0 3 2 0
-0,00350024 0 6 2 0
-0,0106854 3 0 0 1
0,00110903 3 3 0 1
-0,000313912 0 6 0 1
0,0035985 3 0 1 1
-0,00142121 0 6 1 1
-0,00383637 1 0 2 1
0,0126803 0 2 2 1
-0,00318278 2 3 2 1
0,00334268 0 6 2 1
-0,00183491 1 1 0 2
0,000112451 3 2 0 2
-2,97228E-05 3 6 0 2
0,000269551 1 0 1 2
0,00083265 2 0 1 2
0,00155334 0 2 1 2
0,000302683 0 6 1 2
-0,0001843 0 0 2 2
-0,000425399 0 3 2 2
8,69243E-05 3 3 2 2
-0,0004659 0 6 2 2
5,54194E-05 1 6 2 2
62

CAppendix C - Overview of
DEToSC
An example run of the DEToSC in the order they appear on the webpage.
Hull shape (1)
63

APPENDIX C. APPENDIX C - OVERVIEW OF DETOSC
Propeller (2)
64

APPENDIX C. APPENDIX C - OVERVIEW OF DETOSC
Main engine (3)
65
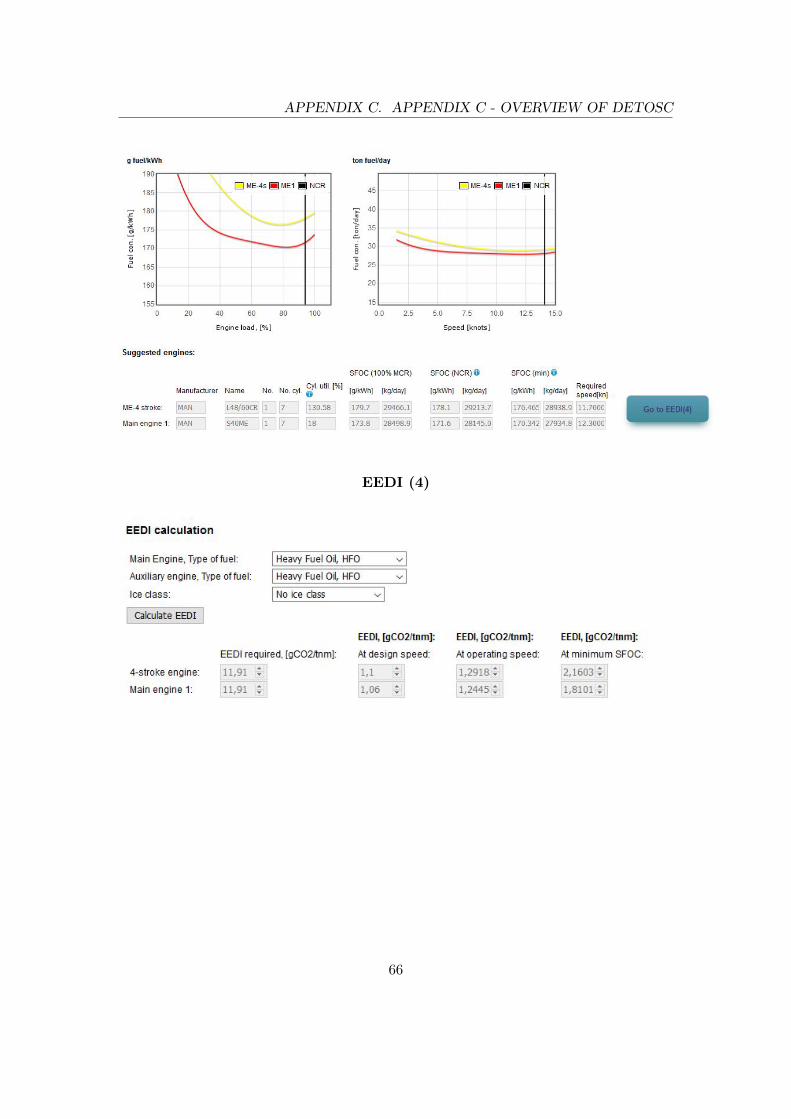
APPENDIX C. APPENDIX C - OVERVIEW OF DETOSC
EEDI (4)
66

DAppendix D - Reference ships for
validation
Reference data for the three ships, RoRo1, RoRo2 and General1, used to validateDEToSC. See next page.
67

NAME RoRo1Main ParticularsLOA [m] 183,1Beam, B [m] 25,2Design draft, T [m] 7,5Design (contract) speed [kn] 18Ship type RoRoCargo capacity [ton]Range [nm]
Ship particularsDW [ton] 12500LS [ton] 9167Volume [m3]Displacement [ton] 21667LWL [m] 174Maximum section area Amx [m2]Waterplane area, Awl [m2]LPP [m] 172,82Block coefficient, Cb = Volume/(Lwl x B x T) 0,6219Maximum section coefficient, Cm = Amx/(B x T)Waterplane coefficient, Cwp = Awl/(Lwl x B)Prismatic coefficient, Cp Volume/(Lwl x Amx)
Wetted surface area WSA 4977Wetted surface area WSA incl appendix
Generated superstructure parametersNo superstructure parameters
Environmental conditionsNo enviormental conditions
Calculate resistanceStern typeSM [%] 0,21Added Resistance [%] 0,167Resistance method Holtrop-Mennen
Operational profileShip Speed, V [knots] 18Speed of advance, VA [m/s]RT [kN] 647PE [kW] 5238Thrust [kN] 785Wake fraction coefficient wThrust deduction coefficient tHull efficiency

Propeller diameter [m] 5,2Propeller arrangement SinglePropeller type CPPRPM [/min]Advance number, JEAR, EARPitch ratio, P/DNumber of blades, zOpen water efficency, eta0 61%Relative rotative efficency, etaR 100%Propeller efficiency, behind hull = etaB = eta0 x etaR 61%Hull efficiency = etaH = (1-t)/(1-w) 114%Propulsive efficency, etaD = etaB x etaH 70%Shaft efficiency, etaS 99%Total efficency, etaT = etaD x etaS 69%PD_des_est [kW] 8593 PB_des_est [kW]Cotract SMContract engine marginContract shaft generatorDesign (contract) Brake power, PB [kW] 10920RPM at contract brake power [RPM] 122,5
ME: 1xSulzer 7 RTA 52 U disellink with info about ship : http://www.faktaomfartyg.se/spaarneborg_2000.htm

NAME RoRo2Main ParticularsLOA [m] 190,2Beam, B [m] 26Design draft, T [m] 7,5Design (contract) speed [kn] 19,5Ship type RoRoCargo capacity [ton]Range [nm] 6000Ship particularsDW [ton] 14000LS [ton] 10174Volume [m3]Displacement [ton] 24174LWL [m] 183,716Maximum section area Amx [m2]Waterplane area, Awl [m2]LPP [m] 178,6Block coefficient, Cb = Volume/(Lwl x B x T) 0,672Maximum section coefficient, Cm = Amx/(B x T) 0,991Waterplane coefficient, Cwp = Awl/(Lwl x B) 0,852Prismatic coefficient, Cp Volume/(Lwl x Amx) 0,678Wetted surface area WSA 5860Wetted surface area WSA incl appendix 5929Generated superstructure parametersNo superstructure parameters
Environmental conditionsNo enviormental conditions
Calculate resistanceStern typeSM [%]Added Resistance [%] 0Resistance method Holtrop-Mennen
Operational profileShip Speed, V [knots] 19,5Speed of advance, VA [m/s]RT [kN] 679,55PE [kW] 6830,5Thrust [kN]
Wake fraction coefficient w 0,21Thrust deduction coefficient t 0,2Hull efficiency 1,013

Propeller diameter [m] 5,5Propeller arrangement SinglePropeller type CPPRPM [/min] 128Advance number, JEAR, EARPitch ratio, P/D 1Number of blades, z 4Open water efficency, eta0Relative rotative efficency, etaRPropeller efficiency, behind hull = etaB = eta0 x etaRHull efficiency = etaH = (1-t)/(1-w)Propulsive efficency, etaD = etaB x etaHShaft efficiency, etaSTotal efficency, etaT = etaD x etaS 59%PD_des_est [kW] 12789 PB_des_est [kW]Cotract SM 15%Contract engine margin 90%Contract shaft generator 800Design (contract) Brake power, PB [kW] 18000RPM at contract brake power [RPM] 130
ME: 2 x MAN 9L48/60B diesellink with info about ship : http://www.faktaomfartyg.se/transpaper_2006.htm

NAME General1Main ParticularsLOA [m] 199,9Beam, B [m] 31Design draft, T [m] 11,5Design (contract) speed [kn] 17Ship type General cargoCargo capacity [ton] 37000Range [nm] 10000Ship particularsDW [ton] 40000LS [ton] 14000Volume [m3]Displacement [ton] 54000LWL [m] 191Maximum section area Amx [m2]Waterplane area, Awl [m2]LPP [m] 191Block coefficient, Cb = Volume/(Lwl x B x T) 0,7717Maximum section coefficient, Cm = Amx/(B x T)Waterplane coefficient, Cwp = Awl/(Lwl x B)Prismatic coefficient, Cp Volume/(Lwl x Amx)
Wetted surface area WSA 8470Wetted surface area WSA incl appendix
Generated superstructure parametersNo superstructure parameters
Environmental conditionsNo enviormental conditions
Calculate resistanceStern typeSM [%]Added Resistance [%]Resistance method
Operational profileShip Speed, V [knots] 17Speed of advance, VA [m/s]RT [kN]PE [kW]Thrust [kN]
Wake fraction coefficient wThrust deduction coefficient tHull efficiency

Propeller diameter [m] 6,8Propeller arrangement Single Propeller type FPPRPM [/min] 85,5Advance number, JEAR, EARPitch ratio, P/D 0,769Number of blades, z 5Open water efficency, eta0 55,9%Relative rotative efficency, etaR 100%Propeller efficiency, behind hull = etaB = eta0 x etaR 55,9%Hull efficiency = etaH = (1-t)/(1-w) 121%Propulsive efficency, etaD = etaB x etaH 67,6%Shaft efficiency, etaS 99%Total efficency, etaT = etaD x etaS 67,0%PD_des_est [kW] 6500 PB_des_est [kW] 14200Cotract SM 12%Contract engine margin 90%Contract shaft generatorDesign (contract) Brake power, PB [kW] 17661RPM at contract brake power [RPM]
ME: 1 x MAN 6S60 MC-Clink with info about ship : https://www.fleetmon.com/vessels/westwood-rainier_9226035_30713/

EAppendix D - Beaufort Scales
The data used to transfer Beaufort scales to wind speed, wave heights and wavelengths. Some modifications has been made to have a good range and to be
conservative.
Table E.1: My caption
Beaufort Description Wind [km/h] Wave length [m] Wave height [m]
0 Calm 0-1 - -
1 Light air 2-6 to 5 0,1-0,2
2 Light breeze 7-12 to 15 0,2-0,3
3 Gentle breeze 13-18 to 25 0,6-1,0
4 Moderate breeze 19-26 to 50 1,0-1,5
5 Fresh breeze 27-35 to 75 2,0-2,5
6 Strong breeze 36-44 to 100 3,0-4,0
7 Near gale 45-54 to 135 4,0-5,5
8 Gale 55-65 150-200 5,5-7,5
9 Strong gale 66-77 150-200 7,0-10,0
10 Storm 78-90 to 250 9,0-12,5
11 Violent storm 91-104 to 300 11,5-14,0
12 Hurricane >104 300 and longer 15,0 and higher
74