design, fabrication and evaluation of …
TRANSCRIPT

www.ejpmr.com
Kumar et al. European Journal of Pharmaceutical and Medical Research
332
DESIGN, FABRICATION AND EVALUATION OF ROSUVASTATIN PHARMACOSOME
- A NOVEL SUSTAINED RELEASE DRUG DELIVERY SYSTEM
Pal Tapas Kumar*1, Jayita Mishra
2 and Abhishekh Podder
2
1NSHM College of Pharmaceutical Technology, NSHM Knowledge Campus, Kolkata Group of Institutions, 120, B L
Shah Road, Kolkata 700053, West Bengal. 2Research Scholar (M. Pharm), Department of Pharmaceutics, NSHM Knowledge Campus, Kolkata – Group of
Institutions, 120, B L Shah Road, Kolkata 700053, West Bengal.
Article Received on 13/02/2016 Article Revised on 04/03/2016 Article Accepted on 24/03/2016
INTRODUCTION
Rosuvastatin is recommended to be used for the
treatment of dyslipidemia only after other measures such
as diet, exercise, and weight reduction have not improved
cholesterol levels. Rosuvastatin is a competitive inhibitor
of the enzyme HMG-CoA reductase, with mechanism of
action similar to that of other statins. It has approximate
elimination half-life of 19 hrs & time to reach peak
plasma concentration within 3–5 hrs following oral
administration. Dose: Start with 5 mg OD, increase if
needed up to 20 mg/day, (max 40 mg/ day)
Pharmacosomes, bearing unique advantages over
liposome and niosome vesicles have come up as potential
alternative to conventional vesicular drug delivery. They
are colloidal dispersions of drugs covalently bound to
lipids. Depending upon the chemical structure of the
drug–lipid complex they may exist as ultrafine vesicular,
micellar, or hexagonal aggregates. As the system is
formed by linking a drug (pharmakon) to a carrier
(soma), they are termed as “Pharmacosomes”. They are
an effective tool to achieve desired therapeutic goals such
as drug targeting and controlled release.
SJIF Impact Factor 3.628
Research Article
ISSN 2394-3211
EJPMR
EUROPEAN JOURNAL OF PHARMACEUTICAL
AND MEDICAL RESEARCH www.ejpmr.com
ejpmr, 2016,3(4), 332-350
*Correspondence for Author: Pal Tapas Kumar
NSHM College of Pharmaceutical Technology, NSHM Knowledge Campus, Kolkata Group of Institutions, 120, B L Shah Road, Kolkata 700053, West Bengal.,
ABSTRACT
Pharmacosomes are amphiphilic lipid vesicular systems containing phospholipid complexes with characteristic
potential to improve solubility, absorptivity and bioavailability of both poorly water soluble as well as poorly
lipophilic drugs. With an objective to improve the aqueous solubility and subsequent bioavailability of a model
BCS class III drug, Rosuvastatin Calcium, its Pharmacosomes were developed and subjected to evaluation of
physicochemical characteristics. The cumulative release profile and permeation studies had been also done by in-
vitro dissolution test, in-vitro diffusion study by modified Franz diffusion cell using egg membrane and in-vivo
study for antihyperlipidemic effect by Tritron induced hyperlipidemia animal model. Solubility of prepared
Pharmacosomes was found to be higher than pure Rosuvastatin Calcium. Drug content was found to be in the range
of 90.4±0.52% to 94.4±0.61% in all the batches of Pharmacosomes. FTIR data also demonstrated superimposed
curves to confirm the stability of Pharmacosome complex after 2 months stability study at 40 deg C temp and 75%
RH. After 24 hours, maximum drug released from formulation F1 was found as 66.93% in the dissolution study and
maximum drug permeated by diffusion through egg membrane from formulation F1 was 49.50% in the diffusion
study. In-vitro and in-vivo experiments justify and confirm Rosuvastatin Pharmacosomes formulations as
significantly better than Rosuvastatin Calcium as a unique sustained release delivery system with simultaneous
reduction of Dosage and improved bioavailability.
KEYWORDS: Pharmacosome, Hand shaking method, Hyperlipidemic, Statins, Log P value, Vesicular systems.

www.ejpmr.com
Kumar et al. European Journal of Pharmaceutical and Medical Research
333
Figure 1: Depending upon the chemical structure of
the drug–lipid complex they may exist as ultrafine
vesicular, micellar, or hexagonal aggregates.
The criterion for the development of the vesicular
Pharmacosomes is dependent on surface and bulk
interactions of lipids with drug. Any drug possessing an
active hydrogen atom (-COOH, -OH, -NH2, etc.) can
be esterified to the lipid, with or without spacer chain that
strongly result in an amphiphilic compound, which will
facilitate membrane, tissue, or biological cell wall
transfer. The prodrug conjoins hydrophilic and lipophilic
properties, thus acquires amphiphilic characters, and
therefore found to reduce interfacial tension, and at
higher concentrations exhibits mesomorphic behavior.[17,
27-30]
MATERIALS FOR PHARMACOSOMES There are three essential components for Pharmacosomes
preparation.
1) Drugs: Drugs containing active hydrogen atom (-
COOH, OH, NH2) can be esterified to the lipid, with or
without spacer chain and they forms amphiphilic
complex which in turn facilitate membrane, tissue, cell
wall transfer in the organisms.
2) Solvents: For the preparation of Pharmacosmes, the
solvents should have high purity and volatile in nature. A
solvent with intermediate polarity is selected for
Pharmacosomes preparations.
3) Lipid: Phospholipids are the major structural
component of biological membranes, where two types of
phospholipids generally used- phosphoglycerides and
spingolipids. The most common phospholipid is
phosphatidylcholine molecule. Phosphatidylcholine is an
amphipathic molecule in which a glycerol bridges links a
pair of hydrophobic acetyl hydrocarbon chains, with a
hydrophilic polar head group, Phosphatidylcholine.[28-30]
Figure 2: Molecular structure of Phosphatidylcholine – a Phospholipid
PREPARATION OF PHARMACOSOMES In general two methods have been employed to prepare
Pharmacosomes.
Hand-shaking method: In the hand-shaking
method, the dried film of the drug–lipid complex
(with or without egg lecithin) is deposited in a
round-bottom flask and upon hydration with aqueous
medium, readily gives a vesicular suspension.
Ether-injection method: In the ether-injection
method, an organic solution of the drug– lipid
complex is injected slowly into the hot aqueous
medium, wherein the vesicles are readily formed. At
low concentration the amphiphiles exists in the
monomer state. Further increase in monomers may
lead to variety of structures i.e., micelles of spherical
or rod like or disc shaped type or cubic or hexagonal
shape. Mantelli et al., compared the effect of
diglyceride prodrug on interfacial tension, with the
effect produced by a standard detergent
dodecylamine hydrochloride, and found similar
effect on lowering of surface tension. Above the
critical micelle concentration (CMC), the prodrug
exhibits mesomorphic lyotropic behavior, and
assembles in supramolecular structures.
Other Approaches: Another approach for
producing Pharmacosomes was recently developed
in which a biodegradable micelle forming drug
conjunct was synthesized from the hydrophobic drug
driamycin and a polymer composed of
polyoxyethylene glycol and polyaspartic acid. This
method has the benefit that although it may be
possible to dilute out the micelle, the drug will
probably not precipitate because of the water
solubility of the monomeric drug conjunct.[17, 31]
Muller-Goymann and Hamann produced fenoprofen
Pharmacosomes using a modified technique that
involved diluting lyotropic liquid crystals of
amphiphilic drugs.[17, 32]
Approaches have been done
to attach drugs to various glyceride-like groups, and
the resulting amphiphilic molecules have been

www.ejpmr.com
Kumar et al. European Journal of Pharmaceutical and Medical Research
334
spontaneously dispersed. They were labeled
Pharmacosomes because of their tendencies to form
unilamellar vesicles. It was suggested that these
molecules should enhance lymph transport[17,33]
Zhang et al. optimized the preparation of 3', 5'-
dioctanoyl-5-fluoro-2'-deoxyuridine Pharmacosomes
and found that the drug Phosphatidylcholine ratio,
glycerol tristearate concentration and pluronic F-68
concentration, have an influence on the mean
particle size, entrapment ratio, and drug loading.[34]
Singh et al. formulated “vesicular constructs” by
encapsulating antibiotic amoxicillin in aqueous
domain by using phosphatidylethanolamine with
various molar ratios of Phosphatidylcholine and
cholesterol which significantly enhanced
cytoprotection.[35]
ADVANTAGES OF PHARMACOSOME
As drug is covalently bound, membrane fluidity has
no effect on release rate, but in turn
Depends upon the phase-transition temperature of
the drug-lipid complex.
No leakage of drug take place as the drug is
covalently linked to the carrier.
Drug can be delivered directly to the site of
infection.
Their degradation velocity into active drug molecule,
after absorption depends very much on the size and
functional groups of the drug molecule, the chain
length of the lipids, and the spacer.
Reduced cost of therapy
Suitable for both hydrophilic and lipophilic drugs.
The aqueous solution of these amphiphiles exhibits
concentration dependent aggregation.
High and predetermined entrapment efficiency as
drug and carrier are covalently linked together.
Volume of inclusion doesn’t influence entrapment
efficiency
No need of removing the free un-entrapped drug
from the formulation which is required in case of
liposomes.
Improves bioavailability especially in case of poorly
soluble drugs.
Reduction in adverse effects and toxicity. Their degradation velocity into active drug molecule,
after absorption depends very much on the size and
functional groups of the drug molecule, the chain
length of lipids and the spacer.[4, 17, 36]
Table no. 1: Pharmacosomes differs from Liposome, Niosome and Transferosome.
VESICULAR SYSTEM ISSUES ENCOUNTERED ADVANTAGE OF PHARMACOSOME
LIPOSOME
1.Expensive
2.Degradation by oxidation
3.Lack of purity of natural
phospholipids
4.Chances of leaching of drug
1.Cheaper
2.Oxidation resistant
3.Pure natural phospholipid not needed
4. Covalent linkage prevents drug leakage.
NIOSOME
1. Time consuming prepn.
2. Comparatively less efficient
3. Instability
1. Less time consuming prepn.
2.More efficient
3.More stable
TRANSFEROSOME 1.Expensive,
2.Chemical instability
1.Cheap
2.Chemically stable
LITERATURE REVIEW
In the study of Akbari B.V et al[50]
by using inclusion
complexation with β-cyclodextrin (β-CD); the solubility
of Rosuvastatin Ca was found significantly increased in
the phase solubility profile and apparent stability constant
(KC) was found as 42.003M-1
. The inclusion complex
prepared with β-CD by kneading method exhibited
greatest enhancement in solubility and fastest dissolution
(98.96% RST release in 30 min) of RST.
Salih et al[49]
studied formulation and in vitro evaluation
of Rosuvastatin calcium niosomes using non-ionic
surfactants (Span 20, Span 60, span 80), cholesterol and
lecithin in different ratios by film hydration method and
evaluated the formulas in terms of assay of drug in each
formula (entrapment efficiency) by HPLC, particle size,
morphology, in-vitro drug release and ex-vivo
permeation study. Fourier transform infrared (FTIR) was
used for study of drug – excipients compatibilities.
Anup Kumar Chakraborty et al[51]
studied formulation
of dosage form of Rosuvastatin calcium and development
of a new, simple, precise, rapid, and accurate validated
reverse phase liquid chromatographic RP-HPLC method
for its estimation in the routine analysis. Another simple,
specific and economic spectroscopic method has been
developed for the estimation of Rosuvastatin calcium in
bulk and tablet dosage form by Rekha rajeevkumar et
al.[53]
In the developed method water was used as the
solvent. The absorption maximum of the drug was found
to be 241nm. The drug follows a linear Lambert-Beer law
relationship with respect to the drug concentration in the
range of 5-30μg/mL, with linearity coefficient of 0.9998.
The proposed method can be applied for the routine
estimation of Rosuvastatin Calcium in the laboratory.
J. Dwivedi et al[55]
studied formulation & evaluation of
Sustained Release multi-particulate pellets of
Rosuvastatin Calcium, prepared by using fluidized bed

www.ejpmr.com
Kumar et al. European Journal of Pharmaceutical and Medical Research
335
coating method. Different pellet formulations were made
by using sustained release rate controlling polymer like
Eudragit NE30D. The release of Rosuvastatin calcium
from the tablet for a period up to 16 hrs was recorded in
controlled manner.
MATERIALS
Table 2: List of Materials.
Sl. No. Materials Source
1. Rosuvastatin Calcium Hygeia Pharmaceuticals Kolkata, India.
2. Soya Lecithin (30%) Himedia, India
3. Cholesterol Merck Specialties Pvt. ltd, India
4. Hydrochloric Acid Merck Specialties Pvt. ltd, India
5. Methanol Merck Specialties Pvt. ltd, India
6. Chloroform Merck Specialties Pvt. ltd, India
7. Dichloromethane Merck Specialties Pvt. ltd, India
8. Potassium dihydrogen phosphate Merck Specialties Pvt. ltd, India
9. Disodium hydrogen phosphate Merck Specialties Pvt. ltd, India
10. Tritron X 100 Loba chemie pvt ltd, India
11. Cholesterol test kit Span diagnostics ltd, India
12. HDL- Cholesterol test kit Span diagnostics ltd, India
13. Triglycerides test kit Span diagnostics ltd, India
Table 3: List of Instruments.
SL No. Instrument Manufacturer
1 Digital weighing balance Metler
2 pH meter Model no. -LI- 615, Elico
3 Ultrasonic bath with digital timer, temp.
control Model no.- UD200SH-6L, Takashi, Japan
4 Vacuum drying oven Indian Instrument pvt. ltd.
5 Hot air oven Labquip
6 Magnetic stirrer with thermostat Remi-make
7 Water bath (thermostatically control) Labquip
8 Double distillation apparatus
(Borosil glass) Testing instrument mfg. Co. Pvt. ltd
9 Heating Mantle Sinha Scientific
10 UV/visible Spectrophotometer Model no. UV 1800, Shimadzu,Japan
11 FTIR Spectrophotometer Model no. Alpha- T, Bruker, Germany
12 Micro centrifuge Spinwin Remi-make
13 Projection microscope (Trinocular) Model no. PRM- 18T,
Scientific equipment pvt .ltd.
14 Scanning electron microscopy Model no. JSM6360, Jeol make, UK
15 X-Ray Diffraction Model no. ULTIMA-III, Rigaku make, Japan
METHODS
(A) ANALYTICAL: Development of UV
Spectroscopic Methods
(a) Determination of absorption maxima: Absorption
maxima or the wavelength at which absorption takes
place. For accurate analytical work it is important to
determine the absorption maxima of the substance under
study. Double beam UV-VIS Spectrophotometer
(Shimazdu model no. uv-1800-240v) in the range of 200-
800 nm is used.
(b) Preparation of standard calibration curve in water
and in Ph 6.8 Phosphate buffer: It is done using double
beam UV-VIS Spectrophotometer (Shimazdu model no.
uv-1800-240v) at 242 nm spectrophotometrically.
(B) EXPERIMENTAL
1. Preparation of Pharmacosomes by Hand shaking
method: Pharmacosomes of Rosuvastatin Calcium were
prepared with an equimolar ratio (1:1) of Rosuvastatin
Calcium and Phosphatidylcholine. Pharmacosomes were
prepared in two steps.
(a) Acidification of Rosuvastatin Calcium:
Rosuvastatin Calcium(1mole) dissolved in water
then acidify with 1(N) HCL, which results
Rosuvastatin Calcium converts into Rosuvastatin
that contain free carboxyl group or an active
hydrogen atom can be esterified with or without
spacer chain to the hydroxyl group of a lipid
molecule.

www.ejpmr.com
Kumar et al. European Journal of Pharmaceutical and Medical Research
336
Figure 3: Preparation of Rosuvastatin Pharmacosomes.
After acidification, these aqueous solutions of
Rosuvastatin extracted into chloroform by shake flask
method. This aqueous solution (50 ml) was then
transferred to a 100 ml of separating funnel with 25 ml of
chloroform in two times and was shaken well for 30
minutes. Then the separating funnel was kept still for
about 24 hours. Then Separate 50 ml chloroform layer
and measured the concentration of drug from the aqueous
layer spectrophotometrically at 242 nm (Double beam
UV Spectrophotometer).
(b) Preparation of Pharmacosomes of Rosuvastatin:
Rosuvastatin extracted into chloroform (50ml) mix
with 50ml dichloromethane in which lecithin soya
(30%) dissolved in a 250 ml round bottom flask and
reflux for 3hours at 45oC. After 3 hrs this mixed
solution transferred into beaker for solvent
evaporation. After solvent evaporation, a thin film of
solid mixture is deposited on the wall of beaker.
Then this beaker was kept in a vacuum dryer for
vacuum drying for 24 hours at 45oC. The
Pharmacosomes were collected and placed in a
vacuum desiccator overnight and then subjected to
characterization.
Table 4: List of different codes with different ratio for preparation of Pharmacosomes
CODE DRUG:
LECITHIN SOYA
WEIGHT TAKEN (MG)
DRUG LECITHIN SOYA
F1 1:1 50 127
F2 1:1 100 254
F3 1:1 200 508
F4 1:1 300 762
F5 1:1 400 1016
F6 1:1 500 1270
2. Preparation of Liposome of Rosuvastatin by Hand
Shaking method: Liposome of Rosuvastatin Calcium
were prepared with a ratio (1:1:0.66) of Rosuvastatin
Calcium, lecithin soya and cholesterol. Liposomes were
prepared in two steps, these are:
(a) Acidification of Rosuvastatin Calcium:
Rosuvastatin Calcium(1 mole) dissolved in water
then acidify with 1(N) HCL, which results
Rosuvastatin Calcium converts into Rosuvastatin
that contain free carboxyl group or an active
hydrogen atom can be esterified with or without
spacer chain to the hydroxyl group of a lipid
molecule.

www.ejpmr.com
Kumar et al. European Journal of Pharmaceutical and Medical Research
337
Figure 4: Preparation of Liposome of Rosuvastatin.
After acidification, this aqueous solution of Rosuvastatin
extracted into chloroform by shake flask method. This
aqueous solution (50 ml) was then transferred to a 100 ml
of separating funnel with 25 ml of chloroform in two
times and was shaken well for 30 minutes. Then the
separating funnel was kept still for about 24 hrs. Then
separate 50 ml chloroform layer and measured the
concentration of drug from the aqueous layer
spectrophotometrically at 242 nm
(b) Preparation of Liposome of Rosuvastatin (L1):
Rosuvastatin extracted into chloroform(50ml) mix
with 50ml dichloromethane in which lecithin soya
(1mole) and cholesterol (0.66mole) dissolved in a
250 ml round bottom flask and reflux for 3hours at
45oC. After 3 hrs this mixed solution transferred into
beaker for solvent evaporation. After solvent
evaporation, a thin film of solid mixture is deposited
on the wall of beaker. Then this beaker was kept in a
vacuum dryer for vacuum drying for 24 hours at
45oC. The liposomes were collected and placed in
vacuum desiccators overnight and then subjected to
characterization.
EVALUATION OF PHARMACOSOMES OF
ROSUVASTATIN
Drug content study 36 mg Rosuvastatin (RSV) Pharmacosomes complex
equivalent to 10 mg Rosuvastatin Calcium was weighed
and taken with pH 6.8 phosphate buffer. At the end of 24
hours, after membrane filtration (0.45μm membrane
filter) of this colloidal suspension, 50ml of this solution
was diluted with 50ml of pH 6.8 phosphate buffer. Then
suitable dilutions measured for drug content at 242 nm
spectrophotometrically in a double beam UV
Spectrophotometer.
Solubility study From the rest of the 50ml RSV- Pharmacosomes solution
in buffer, 40 ml transferred in a 100ml separating funnel
with 40ml octanol and was shaken well for 30 minutes.
Then the separating funnel was kept still for about 1
hour. Concentration of the drug was determined from the
aqueous layer as well as octanol layer
spectrophotometrically at 242 nm in a double beam UV
Spectrophotometer.
Vesicle Shape Determination The surface morphology (roundness, smoothness, and
formation of aggregates) of Pharmacosomes were
studied by Scanning Electron Microscopy (SEM).
Drug Excipient Interaction Studies
(Compatibility Studies) IR spectra for Rosuvastatin Calcium, Phospholipid (soya-
lecithin) and Rosuvastatin-phospholipid complex were
obtained on an IR spectrometer in the transmission mode
with the wave number region 3500- 1000 cm-1.
X-Ray Powder Diffraction Analysis (XRPD) The crystalline state of Rosuvastatin Calcium was
evaluated with X-ray powder diffraction. The X-ray
generator was operated at 40 KV tube voltages and 40
mA of tube current, using the Ka lines of copper as the
radiation source. The scanning angle ranged from 1 to
600 of 2θ in step scan mode.
In vitro dissolution studies[44]
In vitro dissolution studies of all Pharmacosomes of
Rosuvastatin formulations (F1 to F6) as well as pure
Rosuvastatin Calcium were performed in triplicate in a
USP eight station dissolution test apparatus, type II at
100 rpm and at 37 °C and then analyzed at 242 nm in
Double beam UV VIS spectrophotometer.
In vitro diffusion studies[48,63]
The release of Rosuvastatin from the Pharmacosomes
formulations was determined by using modified
membrane diffusion technique using egg membrane. The

www.ejpmr.com
Kumar et al. European Journal of Pharmaceutical and Medical Research
338
collected samples were analyzed at 242 nm in Double
beam UV VIS spectrophotometer.
Comparison of in vivo efficiency of
Pharmacosomes with standard drug Rosuvastatin
calcium as lipid lowering agent to reduce blood
cholesterol level
1. Experimental animals and housing Wistar male rats were purchased from local distributor,
Kolkata. They were housed, three per polypropylene cage
under standard laboratory conditions at room temperature
(25°C ± 2°C) with 12 hr light /dark cycle. The animals
were provided with standard food and water, except
during experimentation. Ethical clearance was obtained
from Institutional Animal Ethical committee (IAEC) of
NSHM College of Pharmaceutical Technology, Kolkata.
2. Experimental Design[73]
Triton X 100 induced hyperlipidemia: Twenty four
male Wistar rates weighing 190 to 200 gm were
randomly divided into 4 groups of 6 each and kept in
their cages for 5 days prior dosing to allow for
acclimatization to the laboratory conditions. The animals
received the drugs as per the table 5.
Table 5: Different groups with animal model:
Group Model
Group1 Administered vehicle(0.1% Na CMC suspension) and served as Normal control
Group2 Administered Triton X 100 and served as Positive control(200mg/kg)
Group3 Administered daily dose of Rosuvastatin calcium(10mg/kg) B.Wt + Tritron (200mg/kg)
Group4 Administered single dose of Pharmacosomes of Rosuvastatin (36mg/kg) B.Wt + Tritron (200mg/kg)
After 24 hours and 48 hours, blood was collected by retro
orbital puncture in the ear under localized ether
anesthesia and subject to centrifugation to obtain serum.
Serum was analyzed for serum TGs, serum TC, serum
HDL-C.
3. Measurement of Lipid profile: Total Cholesterol
(TC), High Density Lipoprotein (HDL), Triglycerides
(TG) have been measured by the test kit of Span
Diagnostic ltd, India.
I. Total Cholesterol (TC)[64-70]
(a) Clinical significance: Serum cholesterol serves as
an indicator of propensity towards Coronary Heart
Disease (CHD), Liver function, Biliary function,
Intestinal absorption, Thyroid Function and Adrenal
disease.
Increased concentration: Increased cholesterol
concentration is found in Idiopathic
Hypercholesterolemia, Hyperlipoproteinemia, Nephrotic
syndrome, Hypothyroidism, Nephrosis and Diabetic
Mellitus. Hypercholesterolemia is known to be associated
with an increased risk of coronary Heart Disease (CHD).
Decreased concentration: Decreased cholesterol
concentration is found in Hepatocellular disease,
Hyperthyroidism, Chronic Anemia, Starvation and
Hypobetalipoproteinemia. Serum cholesterol
concentration is very low in rare genetic disease like
Abetalipoproteinemia.
(b) Assay principle: The principle is being showed in
figure 5. Absorbance of colored dye is measured at 505
nm and is proportional to amount of Total Cholesterol
concentration in the sample.
1. Cholesterol esters + H2O Cholesterol + Fatty acid
2. Cholesterol + O2 Cholest-4-ene-3-one + H2O2
3. H2O2+Phenol+4-Aminoantipyrine+ p-Hydroxybenzenesulfonate
Quinoneimine chromagen + 4 H2O
Figure 5: Coupled assay steps used to determine the concentration of cholesterol.
(c) Assay procedure
Mix the reagents well as directed. Incubate at 37oC for 10minutes or at room Temperature (15-30
oC) for 30 minutes.
cholesterol
cholesterol
peroxidase

www.ejpmr.com
Kumar et al. European Journal of Pharmaceutical and Medical Research
339
Table 6: Assay procedure for Total Cholesterol.
Pipette into tubes marked Blank Standard Test
Serum/Plasma - - 10 μL
Reagent 2 - 10 μL -
Reagent 1 1000μL 1000 μL 1000 μL
(d) Calculation Cholesterol concentration (mg/dL) = [(Absorbance of test)/ (Absorbance of standard)]*200
II. High Density Lipoprotein (HDL)[64-70]
(a) Clinical Significance: HDL transports
Cholesterol from tissues to the liver for catabolism while
LDL transports cholesterol from sites of origin to
deposition in tissues.
Increased concentration: Increased HDL Cholesterol
concentration reduces the risk of cardiovascular disease.
Moderate to vigorous exercise, estrogens and moderate
consumption of alcohol may increase serum HDL –
Cholesterol.
Decreased concentration: Decreased HDL-Cholesterol
concentration increased the risk of cardiovascular
disease. It is lowered in Tangier disease, heavy cigarette
smoking, obesity, very high carbohydrate diets,
uncontrolled Diabetes Mellitus and in male sex hormone
therapy.
(b) Assay Principle: Low Density Lipoprotein,
Very Low Density Lipoproteins and chylomicron
fractions are precipitated by addition of polyethylene
Glycol 6000 (PEG). After centrifugation, the High
Density Lipoprotein (HDL) fraction remains in the
supernatant and is determined with CHOD-PAP method.
(c) Assay procedure
Table 7: Step 1: HDL Cholesterol separation.
Pipette into tubes marked Test
Serum/Plasma 200 μL
Reagent 3 200μL
Mix the reagents well as directed and keep at room
temperature (15-30oC) for 10 minutes. Centrifuge for 15
minutes at 2000 rpm and separate clear supernatant. Use
the supernatant for HDL –Cholesterol estimation.
Table 8: Step 2: HDL Cholesterol estimation
Pipette into tubes marked Blank Standard Test
Supernatant from step 1 - - 100 μL
Reagent 4 - 100 μL -
Reagent 1 1000μL 1000 μL 1000 μL
Mix above ingredients well as directed. Incubate at 37oC for 10minutes or at room Temperature (15-30
0C) for 30
minutes.
(d) Calculation HDL-Cholesterol concentration (mg/dL)
= [(Absorbance of test)/ (Absorbance of
standard)]*50*2#
# (2= Dilution factor, as sample is diluted 1:1 in step 1)
III. Triglycerides[64-72]
(a) Clinical Significance: Triglycerides are family of
lipids produced endogenously from carbohydrates and
absorbed from the diet and are found in all plasma
lipoproteins. Triglycerides measurement is an important
tool in the diagnosis of Hyperlipidemias.
Increased concentration: Increased concentration of
triglycerides is found in hypertriglyceridemia, Ischemic
Heart Disease, Hyperlipoproteinemia types 1 and 5,
Nephrotic syndrome, Hypothyroidism, Diabetes Mellitus,
acute pancreatitis, Glycogen storage disease and tangier
disease.
Decreased Concentration: Decreased concentration of
triglycerides is found in rare disease like
Abetalipoproteinemia.
(b) Assay Principle: The assay is carried out as per
steps in figure 6 and the absorbance of colored dye,
measured at 505nm, is proportional to Triglycerides
concentration in the sample.
LPL
1. Triglycerides Glycerol+ FFA

www.ejpmr.com
Kumar et al. European Journal of Pharmaceutical and Medical Research
340
GK
2. Glycerol+ ATP Glycerol 3-Phosphate+ADP
GPO
3. Glycerol 3-Phosphate + O2 DAP+ H2O2
POD
4. 2H2O2 +4-AAp+ 4-chlorophenol quinoneimine dye+ 4 H2O
Figure 6: Coupled assay used to determine the concentration of Triglycerides.
(c) Assay procedure
Table 9: Assay procedure for estimation for
Triglycerides:
Pipette into
tubes marked Blank Standard Test
Serum/Plasma - - 10 μL
Reagent 2 - 10 μL -
Reagent 1 1000μL 1000 μL 1000 μL
Mix above ingredients well as directed .Incubate at 37oC
for 10 minutes.
(d) Calculation Triglycerides (mg/dl) = [(Absorbance of test)/
(Absorbance of standard)]*200
Atherogenic Index= TC/HDL-C
STABILITY STUDY Optimized formulation F3 RSV-Pharmacosomes and
another vesicular formulation L1 liposome were selected
for comparison as well as the stability study. F3 RSV-
Pharmacosomes and L1 liposome were covered by
aluminum foil and stored in an incubator at 400 C and
75% Relative humidity. After 2 months, Pharmacosomes
and liposome were examined for Drug content and FTIR
spectral evaluation and the compatibility study.
RESULT AND DISCUSSION
(A) Analytical: Development of UV Spectroscopic
Method
(a) Determination of absorption maxima: The
absorption maxima obtained at 242 nm with a
characteristic peak. The obtained results confirm the
identification of Rosuvastatin Calcium.
Fig. 7: Determination of absorption maxima of
Rosuvastatin Calcium.
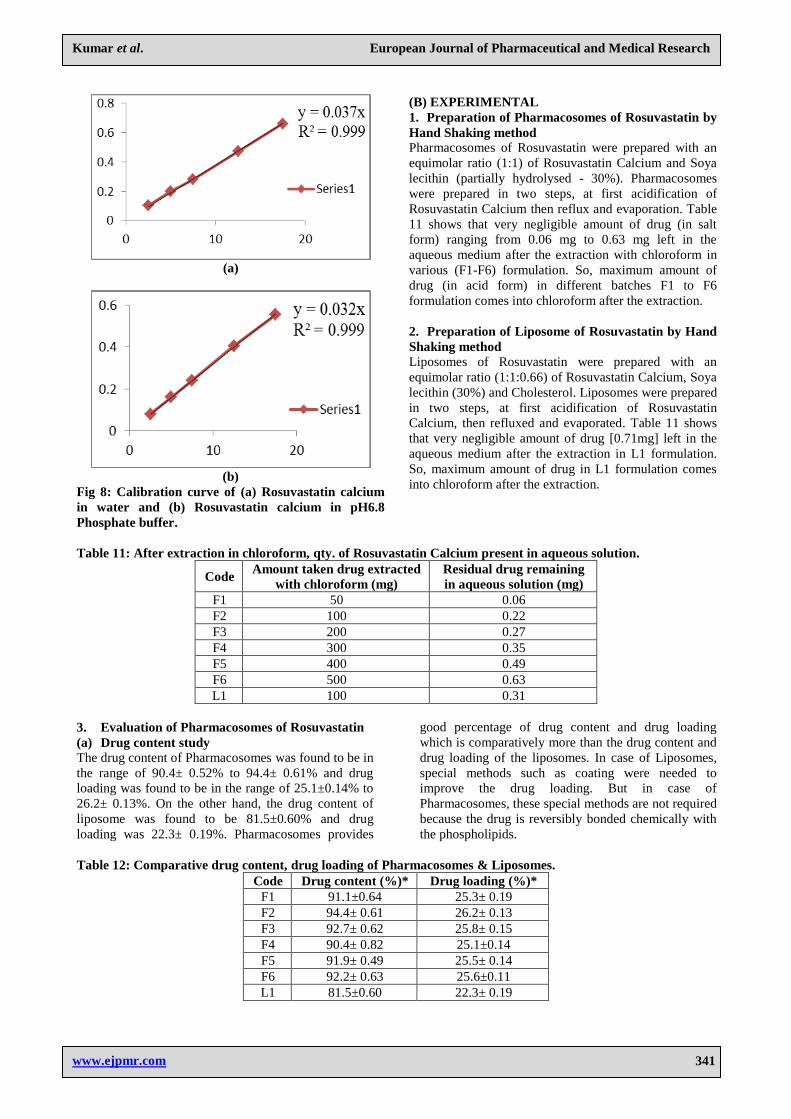
(b)Preparation of standard calibration curve in water The standard calibration curve of Rosuvastatin Calcium
in water was obtained by plotting absorbance Vs
Concentration [Table 10].The standard curve is shown in
Figure 8(a) with the slope of 0.037 and correlation
coefficient of 0.999. The curve was found to be linear in
the concentration range of 2-18 μg/ml (Beer’s range) at
242 nm.
(c)Preparation of standard calibration curve in pH6.8
Phosphate buffer The standard calibration curve of Rosuvastatin Calcium
in water was obtained by plotting absorbance Vs
Concentration [Table 10].The standard curve is shown in
Figure 8(b) with the slope of 0.032 and correlation
coefficient of 0.999. The curve was found to be linear in
the concentration range of 2-18μg/ml (Beer’s range) at
242 nm.
Table 10: Calibration curve data of Rosuvastatin calcium in water and pH 6.8 Phosphate buffer.
Conc. (μg/ml) Absorbance* ± S.D (in water) Absorbance* ± S.D (in pH 6.8)
2.5 0.104± 0.0012 0.079± 0.0007
5 0.195± 0.0064 0.164± 0.0044
7.5 0.284± 0.0040 0.245± 0.0042
12.5 0.468± 0.0029 0.404±0.00212
17.5 0.660± 0.0053 0.557±0.00424
www.ejpmr.com
Kumar et al. European Journal of Pharmaceutical and Medical Research
341
(a)
(b)
Fig 8: Calibration curve of (a) Rosuvastatin calcium
in water and (b) Rosuvastatin calcium in pH6.8
Phosphate buffer.
(B) EXPERIMENTAL
1. Preparation of Pharmacosomes of Rosuvastatin by
Hand Shaking method
Pharmacosomes of Rosuvastatin were prepared with an
equimolar ratio (1:1) of Rosuvastatin Calcium and Soya
lecithin (partially hydrolysed - 30%). Pharmacosomes
were prepared in two steps, at first acidification of
Rosuvastatin Calcium then reflux and evaporation. Table
11 shows that very negligible amount of drug (in salt
form) ranging from 0.06 mg to 0.63 mg left in the
aqueous medium after the extraction with chloroform in
various (F1-F6) formulation. So, maximum amount of
drug (in acid form) in different batches F1 to F6
formulation comes into chloroform after the extraction.
2. Preparation of Liposome of Rosuvastatin by Hand
Shaking method Liposomes of Rosuvastatin were prepared with an
equimolar ratio (1:1:0.66) of Rosuvastatin Calcium, Soya
lecithin (30%) and Cholesterol. Liposomes were prepared
in two steps, at first acidification of Rosuvastatin
Calcium, then refluxed and evaporated. Table 11 shows
that very negligible amount of drug [0.71mg] left in the
aqueous medium after the extraction in L1 formulation.
So, maximum amount of drug in L1 formulation comes
into chloroform after the extraction.
Table 11: After extraction in chloroform, qty. of Rosuvastatin Calcium present in aqueous solution.
Code Amount taken drug extracted
with chloroform (mg)
Residual drug remaining
in aqueous solution (mg)
F1 50 0.06
F2 100 0.22
F3 200 0.27
F4 300 0.35
F5 400 0.49
F6 500 0.63
L1 100 0.31
3. Evaluation of Pharmacosomes of Rosuvastatin
(a) Drug content study
The drug content of Pharmacosomes was found to be in
the range of 90.4± 0.52% to 94.4± 0.61% and drug
loading was found to be in the range of 25.1±0.14% to
26.2± 0.13%. On the other hand, the drug content of
liposome was found to be 81.5±0.60% and drug
loading was 22.3± 0.19%. Pharmacosomes provides
good percentage of drug content and drug loading
which is comparatively more than the drug content and
drug loading of the liposomes. In case of Liposomes,
special methods such as coating were needed to
improve the drug loading. But in case of
Pharmacosomes, these special methods are not required
because the drug is reversibly bonded chemically with
the phospholipids.
Table 12: Comparative drug content, drug loading of Pharmacosomes & Liposomes.
Code Drug content (%)* Drug loading (%)*
F1 91.1±0.64 25.3± 0.19
F2 94.4± 0.61 26.2± 0.13
F3 92.7± 0.62 25.8± 0.15
F4 90.4± 0.82 25.1±0.14
F5 91.9± 0.49 25.5± 0.14
F6 92.2± 0.63 25.6±0.11
L1 81.5±0.60 22.3± 0.19

www.ejpmr.com
Kumar et al. European Journal of Pharmaceutical and Medical Research
342
(b) Solubility study Water solubility of all the Pharmacosomes of
Rosuvastatin (F1to F6) was found to be much higher
than that of pure Rosuvastatin Calcium (D1) and
Liposome of Rosuvastatin (L1) (Table 13). The log P
value of all the Pharmacosomes of Rosuvastatin (F1 to
F6) in the range of -0.25 to -0.34 which is much lower
than the log P value of pure drug Rosuvastatin Calcium
was 1.2459 and Liposome of Rosuvastatin was 0.14.
These log P value results indicates the improvement in
water solubility of Rosuvastatin in the form of
Pharmacosomes. These can be explained by the
solubilization theory resulted from the formation of
micelle in the medium and also by the amorphous
nature of the complex. The amphiphilic nature of
complex, which may prove to be responsible for the
improvement of bioavailability and increase in the
solubility of the drug.
Table 13: Comparative Solubility between Pharmacosomes, Liposome & RSV-Ca.
Code Solubility in aqueous layer(μg/ml)* Solubility in octanol layer(μg/ml)* Log P
F1 91.12± 1.24 42.01±0.62 -0.33
F2 92.37± 1.94 41.70±1.13 -0.34
F3 90.79±0.78 44.36±0.71 -0.31
F4 83.06±1.33 46.56±1.68 -0.25
F5 86.42±1.58 45.25±0.87 -0.28
F6 87.89±1.77 44.66±1.12 -0.30
L1 67.4±1.41 93.6±1.13 0.14
D1 11.0± 0.35 192.62± 1.59 1.24
(c) Vesicle Shape Determination The surface morphology of Pharmacosomes were studied
by Scanning Electron Microscopy (SEM).
Pharmacosomes of Rosuvastatin were found to be of disc
shaped or irregular shaped with rough surface
morphology. The surface was found to be sticky in the
Pharmacosomes complexes prepared with low purity
grades (30 %) of phospholipids (Figure 9). As the
phospholipids are natural component their different
purity grades may have different effects in shape and
surface morphology. On the other hand, those
Pharmacosomes complexes prepared with the high purity
grades of phospholipids (80%) their surface show rough,
non-sticky and free flowing nature.[29]
(a) 100X Magnification
(b) 200X Magnification
Figure 9: Scanning Electron Microscopy of
Pharmacosomes of Rosuvastatin.
(d) Drug Excipients Interaction Studies
(Compatibility Studies)
(i) FTIR spectra of Rosuvastatin Calcium and
acidified Rosuvastatin Calcium Conversion of Rosuvastatin Calcium to acidified
Rosuvastatin Calcium was done by 1(N) HCL. This
conversion is evaluated by FTIR Spectroscopy (Figure
10). The FTIR Spectra of Pure Rosuvastatin Calcium
showed there characteristics absorption peak 3439.07
cm-1 of OH stretching functional group that shifted to
3452.80 cm-1 of the acidified Rosuvastatin Calcium. In
acidified Rosuvastatin Calcium[3]
additional
characteristics absorption peaks seen in the region of
2500 to 3000 cm-1 these are 2966.58, 2926.79,
2862.33cm-1. In Pure Rosuvastatin calcium 2360.33cm-1
a characteristics absorption peak was seen but after
acidify in acidified Rosuvastatin Calcium this peak is
missing. So, this result justify the conversion of
Rosuvastatin calcium to acidified Rosuvastatin calcium.

www.ejpmr.com
Kumar et al. European Journal of Pharmaceutical and Medical Research
343
Figure 10: FTIR Overlaid spectra of Rosuvastatin Calcium and acidified Rosuvastatin Calcium.
ii) FTIR spectra of acidified Rosuvastatin Calcium,
Soya Lecithin (PDC), Pharmacosomes and Physical
mixture Drug: Phosphatidylcholine. The formation of complex can be confirmed by the FTIR
Spectroscopy. FTIR Spectra of Pharmacosomes of
Rosuvastatin were significantly different from all the
individual component and that of physical mixture
(Figure 11). FTIR Spectra of acidified Rosuvastatin
Calcium shows OH stretching at 3452.80 cm-1, C=O
stretching at 1733.55(PDC) 1737.63 cm-1 to 1738.62 cm-
1 in the Pharmacosomes. -CN stretching of cm-1. FTIR
Spectra of Soya Lecithin Shows OH stretching at
3384.64 cm-1, C=O stretching at 1737.63 cm-1, -CN
stretching at 1231.94 cm-1. The FTIR Spectra of
Pharmacosomes of Rosuvastatin shows OH stretching at
3393.11 cm-1. C=O stretching shifted from acidified
Rosuvastatin Calcium1733.55 cm-1 and soya lecithin
Soya Lecithin (PDC) at 1231.94 cm-1 shifted to 1232.35
cm-1. Thus the FTIR Spectra indicate the interaction of
Soya lecithin with the acidified Rosuvastatin Calcium
COOH group and formation of Pharmacosomes.
Figure 11: FTIR Overlaid spectra of acidified Rosuvastatin Calcium, Phosphatidylcholine (PDC),
Pharmacosomes and Physical mixture.
Drug: Phosphatidylcholine
(iii) FTIR Spectra of all Pharmacosomes formulations FTIR Spectra of all F1 to F6 Pharmacosomes formulation
indicates the functional group such as -CN stretching,
C=O stretching, OH stretching present in or within the
range in the region. Moreover, No additional peaks does
not seen in comparison of all the Pharmacosomes
formulations (Figure 16).

www.ejpmr.com
Kumar et al. European Journal of Pharmaceutical and Medical Research
344
Figure 12: FTIR Overlaid spectra of all Pharmacosomes formulations.
(iv) FTIR spectra of Pharmacosomes, Liposome and
Physical mixture Drug: Phosphatidylcholine.
The FTIR Spectra of Pharmacosomes of Rosuvastatin
shows OH stretching at 3393.11 cm-1, C=O stretching
at 1738.62 cm-1, -CN stretching 1232.35 cm-1. The
FTIR Spectra Liposome of Rosuvastatin shows OH
stretching at 3366.58 cm-1, C=O stretching at c
1739.03 cm-1, -CN stretching at 1230.86 cm-1. In
Pharmacosomes a characteristics absorption peak
3009.10 cm-1 was seen but in Liposome this peak is
missing. Thus the FTIR Spectra indicate characteristics
difference between Pharmacosomes and Liposome
(Figure 13).
Figure 13: FTIR Overlaid spectra of Pharmacosomes, Liposome and Physical mixture Drug:
Phosphatidylcholine.
(e) X-Ray Powder Diffraction Analysis (XRD)
The XRD of Pharmacosomes of Rosuvastatin (Figure 16)
revealed a broad peak which is similar to the peak of
soya Lecithin (PDC)(Figure 15) It suggested that the
Rosuvastatin Calcium in the phospholipid complex was
either in amorphous form or molecularly dispersed. The
disappearance of Rosuvastatin Calcium crystalline
diffraction peaks (figure 14) confirmed the formation of
the phospholipid complex. Unlike liposomes, chemical
bonding between the drug and phospholipids in the
development of Pharmacosomes might have resulted into
a significant change of its X-ray diffraction. These results
are well supported by previous studies done with the
Pharmacosomes of Diclofenac.[44]
Figure 14: X Ray Diffraction(XRD) of Rosuvastatin Calcium.

www.ejpmr.com
Kumar et al. European Journal of Pharmaceutical and Medical Research
345
Figure 15: X Ray Diffraction(XRD) of Soya Lecithin(30%).
Figure 16: X Ray Diffraction(XRD) of Pharmacosomes of Rosuvastatin.
(f)In vitro dissolution studies In vitro release studies of Pharmacosomes of
Rosuvastatin (F1 to F6) and pure Rosuvastatin Calcium
were carried out in phosphate buffer pH 6.8, as showed in
Figure 23. At the end of 24 hours, % cumulative release
of drug from Pharmacosomes of Rosuvastatin was found
to be in the range of 66.93% to 56.81% (Table 14). In
case of pure Rosuvastatin Calcium, the % cumulative
release of drug amount at the end of 90 minutes is 100%
(Table 14). Phospholipids being an amphiphilic
surfactant increased the solubility of the drug by the
action of wetting and dispersion. And that’s why the
dissolution profile of the Pharmacosomes of Rosuvastatin
was found to be improved. The release experiments
clearly indicated sustained release of Rosuvastatin from
all Pharmacosomes formulations. On the other hand,
immediate release pattern shows on the dissolution study
of pure Rosuvastatin Calcium.
Table 14: Comparative % Cumulative dissolution release data of Pharmacosomes formulations at different time
with Pure RSV Calcium.
Time
(mins)
F1 (%
Release)
F2
(%Release)
F3
(%Release)
F4
(%Release)
F5
(%Release)
F6
(%Release)
Pure RSV Ca
(% Release)
15 1.4 2.25 1.69 2.53 3.09 3.78 30.1
30 2.53 4.78 4.22 4.5 5.34 5.31 55.5
45 3.93 7.03 5.34 7.59 7.03 7.87 85.7
60 4.78 8.72 5.91 11.25 10.96 10.12 98.5
90 12.65 12.38 9.56 12.65 12.09 11.53 100.0
120 19.96 23.91 22.50 18.56 14.9 11.81 100.0
240 23.9 26.16 25.31 22.5 20.53 18.28 100.0
360 29.25 31.50 30.09 27.56 27 24.46 100.0
1440 66.93 65.53 62.72 64.4 59.34 56.81 100.0
(g) In vitro diffusion studies In vitro diffusion studies Pharmacosomes of Rosuvastatin
(F1 to F6) and pure Rosuvastatin Calcium were carried
out in phosphate buffer pH 6.8, (Figure 17) by modified
franz diffusion cell using egg membrane. At the end of
24 hours, % cumulative release of drug from
Pharmacosomes of Rosuvastatin was found to be in the
range of 49.50% to 41.40 (Table 15). In case of pure
Rosuvastatin Calcium, the % cumulative release of drug
amount at the end of 24 hours minutes is 96.88% (Table
15). The release experiments also clearly indicated
sustained release of Rosuvastatin from all
Pharmacosomes formulations comparative with release
pattern shows on the diffusion study of pure Rosuvastatin
Calcium.

www.ejpmr.com
Kumar et al. European Journal of Pharmaceutical and Medical Research
346
Table 15: Comparative % Cumulative diffusion data of Pharmacosomes formulations at different time with
Pure Rosuvastatin Calcium.
Time
(mins)
F1
(% Release)
F2
(%Release)
F3
(%Release)
F4
(%Release)
F5
(%Release)
F6
(%Release)
Pure RSV Ca
(% Release)
5 4.12 3.00 2.10 2.70 1.70 1.40 9.30
15 5.00 4.70 3.20 4.20 2.70 2.50 15.00
30 6.50 7.00 5.70 6.10 4.30 4.10 21.60
45 8.00 8.10 6.50 7.40 5.40 5.00 24.00
60 8.60 8.20 7.10 8.00 6.50 6.20 26.50
90 10.80 10.50 8.70 9.50 8.10 7.50 29.70
120 12.60 12.20 9.60 11.40 8.90 8.40 32.70
240 29.10 22.00 19.40 21.30 18.10 17.50 42.37
360 33.13 27.50 23.30 25.70 22.40 21.70 55.88
1440 49.50 48.00 45.10 47.20 43.30 41.40 96.88
Figure 17: Comparative % Cumulative diffusion
release study of Pharmacosomes formulations at
different time with Pure Rosuvastatin Calcium.
(h)Comparison of in vivo efficiency of Pharmacosomes
with standard drug Rosuvastatin calcium as lipid
lowering agent to reduce blood cholesterol level Animal study data (Table 16) showed that total
cholesterol, triglycerides and HDL level in standard drug
treated group (RSV-Ca) and RSV- Pharmacosomes
treated group had been returned back to normal level
(24hr) and even below (48hr) when compared total
cholesterol, triglycerides and HDL level normal control
group. However, the difference existed in the dosage
schedule (Table 5). When compared to the positive
control group evident from( Figure 18) the reduction in
total cholesterol level in 24 hours and 48 hours are quiet
significant and comparable which justified total dose
reduction sustained release profile as well as improved
bioavailability of Pharmacosomes formulation.
Table 16: Data for the Effect of Pharmacosomes of Rosuvastatin and standard drug Rosuvastatin Calcium in
blood Triglycerides levels, Total Cholesterol levels, HDL Cholesterol levels.
Treatment Group Total Cholesterol
(mg/dl)
Triglycerides
(mg/dl)
HDL-Cholesterol
(mg/dl)
24 hr 48 hr 24 hr 48 hr 24 hr 48 hr
Normal Control
(Gr 1)
66.87±
0.7745
66.87 ±
0.6927
57.40±
0.6154
57.73±
0.4279
38.67±
0.6667
38.92±
0.7569
Positive (Tritron) Control
(Gr 2)
133.3±
0.9545*
126.7±
1.022*
173.3±
0.7282*
177.0±
1.143*
13.50±
0.7638*
12.45±
0.533*
Standard drug (Rave-Ca) treated
(Gr 3)
47.67±
0.7719*#
25.42±
0.8352*#
47.11±
0.7514*#
46.17±
1.067*#
19.11±
0.6641*#
32.54±
0.3257*#
Formulation (Pharmacosomes)
Treated (Gr 4)
59.26±
0.5863*#
23.69±
0.337*#
49.21±
0.5163*#
45.93±
1.291#
15.82±
0.7821*#
34.69±
0.60*#
Figure 18: Comparative effect of Pharmacosomes of
Rosuvastatin and standard drug Rosuvastatin
Calcium in Triglycerides(TG) , Total cholesterol (TC),
HDL- Cholesterol.
The biological parameter Atherogenic Index (Table 17)
in standard drug treated group (RSV-Ca) and RSV-
Pharmacosomes treated group had been returned back to
the normal level (24hr) and even below (48hrs) when
compare to the Atherogenic Index of a normal control
group(figure 19).

www.ejpmr.com
Kumar et al. European Journal of Pharmaceutical and Medical Research
347
Table 17: Data for the effect of Pharmacosomes of Rosuvastatin and Standard drug Rosuvastatin Calcium in
Atherogenic Index(TC/HDL-C).
Figure 19 : Comparative effect of Pharmacosomes of
Rosuvastatin and standard drug Rosuvastatin
Calcium in Atherogenic Index (TC/HDL-C)
(i) Histopathology study of liver In the histopathological study, Tritron induced positive
control group (Figure 29B) shows fatty infiltration and
granular degeneration as compared to normal control
(Figure 29A). Standard drug Rosuvastatin Calcium
shows reduction of cytoplasmic fatty infiltration and
granular degeneration (Figure 29C). Pharmacosomes of
Rosuvastatin also shows cytoplasmic fatty infiltration and
granular degeneration (Figure 29D) as shown in standard
drug Rosuvastatin Calcium treated group.
(A)
(B)
(C)
(D)
Figure 20: (A) Normal control , B) Positive control, C)
Standard drug treated, D) Pharmacosomes treated.
(j) Stability study of optimized formulation Pharmacosomes of Rosuvastatin was compatible at 40
oC
and 75% RH and the stability of Pharmacosomes was
confirmed by FTIR. No additional peak was observed
after 2 month. Drug content and loading was almost same
after 2 months and in initial condition in Pharmacosomes
of Rosuvastatin. (Figure 22, Table 18) On the other hand,
the stability of Liposome was also confirmed by FTIR
and a new peak was observed in 2320.48 cm-1. So, this
stability results indicate Liposome was not compatible at
40oC and 75% RH; whereas Pharmacosomes was
compatible.
Treatment Group Atherogenic Index
24 hr 48 hr
Normal Control (Gr 1) 1.72 1.71
Positive (Tritron) Control (Gr 2) 9.54 10.17
Standard drug (Rsv-Ca) Treated (Gr 3) 2.49 0.78
Formulation (Pharmacosomes) Treated (Gr 4) 3.74 0.68

www.ejpmr.com
Kumar et al. European Journal of Pharmaceutical and Medical Research
348
Figure 22: FTIR Overlaid spectra of Pharmacosomes for stability study (examined after 2month of storage on
400C and 75% RH).
Table 18: Stability study of optimized Pharmacosomes formulation.
Code Drug Content (%) Drug loading (%)
F3(Initial) 92.7± 0.62 25.80± 0.15
F3 (After 2 month) 91.11±0.47 25.29±0.10
CONCLUSION
In the present study, a Pharmacosomes of Rosuvastatin
was prepared by a simple and reproducible Hand Shaking
method and evaluated for various Physicochemical, in-
vitro and in-vivo experiments. Physicochemical
investigations showed that Pharmacosomes of
Rosuvastatin improved solubility comparative with the
solubility of Pure Rosuvastatin Calcium. The dissolution
profile of Pharmacosomes of Rosuvastatin showed a
sustained release drug delivery comparative with the
dissolution profile of pure Rosuvastatin Calcium. The
diffusion profile of Pharmacosomes of Rosuvastatin
Calcium also showed a sustained release drug delivery
comparative with the diffusion profile of pure
Rosuvastatin Calcium. The FTIR and XRPD studies
confirmed the formation of the complex. SEM study
shows irregular shape and rough surface morphology of
Rosuvastatin Pharmacosomes. From the statistical
analysis, it is evident that Pharmacosomes formulation
really provide a sustaining effect on TC, TG and HDL
cholesterol results. However comparing the difference in
reduction level in TC and TG in 24 hrs and 48 hrs and
increase level in HDL-C in 24 and 48 hrs, it may be
concluded that an ideal novel sustained release delivery
system should include and immediate loading dose of
parent drug of Rosuvastatin Calcium along with a
maintenance dose of Rosuvastatin Pharmacosomes.
Pharmacosomes of Rosuvastatin Calcium was compatible
at 37OC and 75% RH and the stability of Pharmacosomes
was confirmed by FTIR. No additional peak was
observed after 2 month and at initial condition and after 2
month the drug loading was almost same. This
Pharmacosomes of Rosuvastatin Calcium may be of
potential use for improving bioavailability. Thus, the
formulated Pharmacosomes seem to be potential
candidate as an oral sustained drug delivery system in
this era of novel and sustained drug delivery systems.
The developed formulations are expected to improve the
patient compliance, form better dosage regimen, dose
reduction and provide optimum maintenance therapy to
Hyperlipedimic patients.
REFERENCES 1. Biju SS, Talegaonkar S, Mishra PR and Khar K.R.;
Vesicular System: An overview I.J.P.S, 2009; 71(4):
421-427.
2. Jin. Y et al. Self-Assembled Drug Delivery Systems-
Properties and In Vitro –In Vivo Behaviour of
Acyclovir Self-Assembled Nanoparticles (san). Int J
Pharm, 2006; 309(1– 2): 199-207.
3. Vaizoglu MO and Speiser PP. Pharmacosomes--A
Novel Drug Delivery System. Acta Pharmacetica
Suecica, 1986; 23: 163 – 172.
4. Goldberg. E P. Eds. In; Targeted Drugs, 2nd edition,
Wiley, New york, 1983; 312.
5. Gregoriadis. G. Nature, 1977; 265-407.
6. Poste G, Krisch R and Koestler T. Liposome
Technology. Vol 3, CRC Press Inc, Banco Raton, F1,
1983; 29.
7. Saraf Swarnlata, Rathirahul, Kaur Chanchal Deep
and Saraf Shailendra. Colloidosomes: an Advanced
vesicular system in drug delivery. Asian Journal of
Scientific Research, 2011; 4: 1-15.
8. Annakula Deepthi, Rao Madhukar, Jukanti Raju,
Bandari Suresh, Reddy Prabhakar Reddy Veera. Pro-
vesicular drug delivery systems: An overview and
appraisal. Scholars Research Library, 2010; 2:
135-146.
9. Keservani Raj K, Sharma Anil K, Ayaz MD,
Kesharwani Rajesh K. Review Novel drug delivery
system for the vesicular delivery of drug by the
niosomes. International Journal of Research in
Controlled Release, 2011; 1: 1-8.
10. Gupta Stuti, Singh Ravindra Pal, Lokwani Priyanka,
Yadav Sudhir, Gupta Shivjee K. Vesicular System
As Targeted Drug Delivery System: An Overview.
International Journal of Pharmacy & Technology,
2011; 3: 1021.

www.ejpmr.com
Kumar et al. European Journal of Pharmaceutical and Medical Research
349
11. Doijad Rajendra C, Bhambere Deepak S, Manvi
Fakirappa V and Deshmukh Narendra V.
Formulation And Characterization Of Vesicular
Drug Delivery System For Anti-HIV Drug. Journal
of Global Pharma Technology, 2009; 1: 94-100.
12. Prajapati SK, Kumar S, Sahu VK, Prakash G. Pro-
niosomal Gel of Flurbiprofen: Formulation and
Evaluation. Journal of Drug Delivery &
Therapeutics, 2012; 2: 105-114.
13. Gangwar Mayank, Singh Ranigi, Goel RK, Nath
Gopal: Recent Advances In Various Emerging
Vesicular Systems: An Overview. Asian Pacific
Journal of Tropical Biomedicine, 2011; 33: 848.
14. Polanski. M.J and Juliano. R.L. Pharmacol. Rev,
1983; 36: 27.
15. Bangham AD, Standish MM and Watkins JG. The
action of steroids and streptolysin S on the
permeability of phospholipid structures to cations. J.
Mol. Biol, 1965; 13: 238.
16. Ogihara Umedai, Sasaki T, Toyama H, Odak, Sneha
M, Nishigori H. Cancer Detect Prev, 1997; 21(6):
490.
17. Kavitha D, Naga Sowjanya J, Shanker Panaganti.
Pharmacosomes: An Emerging Vesicular System.
International Journal Of Pharmaceutical Sciences
Review And Research, 2010; 5(3): 168-171.
18. Anwekar H., Patel S., Singhai A.K., Liposome-As
Drug Carrier, International Journal of Pharmacy
and Life Sciences, 2011; 2(7): 945-951.
19. Wagner A., Uhl K.V., Liposome Technology for
Industrial Purposes, Journal of Drug Delivery, 2011;
2010: 1-9.
20. Cevc G., Schatlein A.,Blume G., Transdermal Drug
Carriers: Basic Properties, Optimization and
Transfer Efficiency in the case of Epicutaneous
Applied Peptides, Journal of Controlled Release,
1995; 36: 3-16.
21. Jain S., Jaio N., Bhadra D., Tivari A.K., Jain N.K.,
Transdermal Delivery of an Analgesic Agent using
Elastic Liposomes: Preparation, Characterization and
Performance Evaluation. Current Drug Delivery,
2005; 2(3): 223-233.
22. Ali N., Harikumar S.L., Kaur A., Niosomes: An
Excellent Tool for Drug Delivery, International
Journal of Research in Pharmacy and Chemistry,
2012; 2(2): 479-487.
23. Khan A., Sharma P.K., Visht S., Malviya R.,
Niosomes as Colloidal Drug Delivery System: A
Review, Journal of Chronotherapy and Drug
Delivery, 2011; 2(1): 15-21.
24. Jadhav S.M., Morey P., Karpe M., Kadam V., Novel
Vesicular System: An Overview, Journal of Applied
Pharmaceutical Sciences, 2012; 02(01): 193-202.
25. Tarekegn A., Joseph N.M., Palani S., Zacharia A.,
Ayenew Z., Niosomes in Targeted Drug Delivery,
International Journal of Pharmaceutical Sciences
and Research, 2010; 1(9): 1-8.
26. Diljyot K. Niosomes: A New Approach to Targeted
Drug Delivery, International Journal of
Pharmaceutical and Phytopharmacological
Research, 2012; 2(1): 53-59.
27. De Pintu kumar, De Arnab. Pharmacosomes: A
potential vesicular drug delivery system. I R J P,
2012; 3(3): 102-105.
28. Kaur and Kanwar M. Ocular Preparations: The
Formulation Approach. Drug Dev. Ind. Pharm,
2002; 28 (5): 473–493.
29. Semalty A, Semalty Mona, Rawat BS, Singh D, and
Rawat SM. Development and Evaluation of
Pharmacosomes of Aceclofenac. Indian Journal
Pharmaceutical Sciences, 2010; 5: 576-581.
30. Semalty A., Semalty M, Singh D and Rawat MS.
Development and Characterization of Aspirin-
Phospholipid Complex for Improved Drug Delivery.
International Journal of Pharmaceutical Sciences
and Nanotechnology, 2010; 3(2): 940-947.
31. Lawrence. MJ. Surfactant Systems: Their Use in
Drug Delivery. Chem. Soc. Rev, 1994; 23: 417–424.
32. Muller-Goymann CC and Hamann HJ.
Pharmacosomes: Multilamellar Vesicles Consisting
of Pure Drug. Eur J Pharm Biopharm, 1991; 37:
113–117.
33. Valentino JS and William NC. Lymphatic Transport
of Drugs. CRC Press. Boca Raton, FL, 1992; 205.
34. Zhang ZR, Wang JX and Lu J. Optimization of the
Preparation of 3',5'-dioctanoyl-5-fluoro- 2'-
deoxyuridine Pharmacosomes Using Central
Composite Design. Yao Xue Xue Bao, 2001; 36(6):
456–461.
35. Singh A and Jain R. Targeted Vesicular Constructs
for Cytoprotection and Treatment of H. Pylori
Infections. US Patent., 2003; 6576: 625,.
36. Ping. A, Jin. Y and Da-wei. C. Preparation and In
Vivo Behavior of Didanosine Pharmacosomes in
Rats. Chin. J. Pharm, 2005; 3: 227–235.
37. Vyas SP, JaitelyVikas, Kanaujia P. Synthesis and
characterization of polymitoylpropanolol
hydrochloride auto-lymphotrophs for oral
administration. International journal of
pharmaceutics., 1999; 186: 177-189.
38. Bombardelli E, Spelta M. phospholipid-polyphenol
complexes: a new concept in skin care ingredients.
Cosm toil, 1991; 106(3): 69-76.
39. Mahley RW, Bersot TP. Drug therapy for
hypercholesterolemia and dyslipidemia. In: Brunton
LL, Lazo JS, Parker KL. Editors. Goodman and
Gilman’s the pharmacological basis of
therapeutics.11th ed. USA: McGraw-2006; 933-66.
40. Rang HP, Dale MM, Ritter JM. Atherosclerosis and
lipoprotein metabolism. In: Moore PK. Editors.
Pharmacology. 5th
ed. Scotland: Churchill
Livingstone., 2003; 306.
41. KD Tripathi. Essential of Medical Pharmacology.
Jaypee Brothers Medical Publishers (P) Ltd.6th
edition, 2009; 614-616.
42. Rang HP, Dale MM, Ritter JM, Flower PK.
Pharmacology. 6th ed. Churchill Livingstone:
London., 2007.

www.ejpmr.com
Kumar et al. European Journal of Pharmaceutical and Medical Research
350
43. Yiguang J, Tongc L, Ping A, Miao L, Houb X,
International Journal of Pharmaceutics, 2006; 309.
44. Self-Assembled Drug Delivery Systems-Properties
and In Vitro –Behaviour of Acyclovir Self-
Assembled Nanoparticles (SAN). In Vivo., 199–207.
45. Semalty A, Semalty M, Singh D, Rawat MSM.
Development and physicochemical evaluation of
Pharmacosomes of diclofenac. Acta Pharmaceutica,
2009; 59: 335–44.
46. Peng-Fei Yue, Qin Zheng, Bin Wu, Ming Yang, Mu-
Sheng Wang, Hai-Yan Zhang, Peng-Yi Hu. Process
optimization by response surface design and
characterization study on geniposide
Pharmacosomes. Pharmaceutical Development and
Technology., 2012; 17: 94-102.
47. Han M, Chen J, Chen S, Wang X, Preparation and
study in vitro of 20(S)-protopanaxadiol
Pharmacosomes. Zhongguo Zhong Yao Za Zhi, 2010;
35: 842-6. 0.
48. Ivanov VE, Moshkovskii YS, Raikhman LM. Effect
of temperature on cascade system of Pharmacosomes
fusion. Pharmaceutical Chemistry journal, 15(9):
619-62.
49. Amandeep Kaur, Nihau Sharma and S.L. Harikumar.
Design and development of ketoprofen
Pharmacosomes for oral delivery. Pharmacophore
2013; 4(4): 111-119.
50. Omar S. Salih, Laith H. Samein, Wedad k. Ali.
Formulation and in vitro evaluation of Rosuvastatin
calcium niosomes. Int J Pharm PharmSci, 5(4):
525-53550.
51. Akbari B.V, Valaki B.P., Maradiya V. H., Akbari
A.K., G. Vidyasagar. Enhancement of solubility and
dissolution rate of Rosuvastatin calcium by
complexation with Β-Cyclodextrin. International
Journal of Pharmaceutical & Biological Archives.,
2011; 2(1): 492-501.
52. Anup Kumar Chakraborty, Sudha Ranjan Mishra,
Himanshu bhusan Sahoo. Formulation of dosage
form of Rosuvastatin calcium and development of
validated RP-HPLC method for its estimation.
International Journal of Analytical and
Bioanalytical Chemistry., 2011; 1(3): 89-101.
53. Ehsan Ali Mohamed, Dr. Shaimaa N. Abd Al
Hammid. Formulation and evaluation of
Rosuvastatin Orodispersible tablets. Int J Pharm
PharmSci, 5(2): 339-346.
54. Rekharajeev kumar, S. Anbazhagan, P. Rajeev
Kumar. Analytical method development and
validation of Rosuvastatin calcium in pure form and
pharmaceutical formulations by UV spectroscopy.
International Journal of PharmTech Research., 4(4):
1601-1605.
55. P. Rohini. Formulation and evaluation of orally
disintegrating tablets of Rosuvastatin. Global
Journal of Pharmacology., 2013; 7(3): 249-257.
56. J. Dwivedi, O.P. Mahatma. Formulation &
Evaluation of Sustained Release Formulation of
Rosuvastatin Calcium. Asian Journal of Biochemical
and Pharmaceutical Research., 2011; 3(1).
57. S Kishore Kumar, K Elango N Deattu, Al
Akilandeshwari. Enhancement of dissolution rate
and formulation development of Rosuvastatin
calcium solid dispersion tablets employing starch
phosphate as carrier. International Journal of
Pharmacy Research & Science., 2014; 02(2):
164-170.
58. S.R. Ambole, P.J. Shirote, M.S. Kondawar.
simultaneous estimation for Rosuvastatin calcium
and aspirin from capsule dosage forms by first order
derivative spectroscopic method. International
Journal of Chem Tech Research., 4(3): 966-970.
59. B. Patel Zalak, S. Patel Kruti, S. Shah Ankit, I. Surti
Naazneen. Preparation and optimization of micro
emulsion of Rosuvastatin calcium. Journal of
Pharmacy and Bioallied Sciences., March 2012;
118-119.
60. www.drugbank.com, accessed on 3rd march, 2013.
61. www.dailymed.com, accessed on 3rd march, 2013.
62. www.chemicalbook.com, accessed on 3rd march,
2013.
63. www.wikipedia.com, accessed on 3rd march, 2013.
64. Srinivas S. Preparation and evaluation of niosomes
containing Aceclofenac Sodium. Dissertation
submitted to Rajiv Gandhi University of Health
Sciences., 2010.
65. Herbert k, lipids, In Clinical chemistry: theory,
Analysis and Co-relation, Kaplan L.A and Pesce A.J,
Eds. C.V Mosby, Toronto, 1984; 1182-1230.
66. Xnader R, paul B, John A, Lipids, Lipoproteins and
Apolipoproteins, In Tietz Textbook of Clinical
Chemistry, 3?rd
ed, Burtis C A and Ashwood E.R.,
Eds. W.B. saunders, Philadelphia, 1994; 809-852.
67. siedel j et al, Clin. Chem., 1983; 29/6: 1073.
68. Young D., In Effect of preanalytical Variables on
Clinical Laboratory Tests, 2nd
ed., AACC Press,
Washington, 1997; 493-497.
69. Warnick et al, Clin Chem., 1995; 41: 1427-33.
70. Kaplan A, lavernel L.s., Lipid Metabolism, In
Clinical Chemistry: Interpretation and Techniques,
2nd
ed., Lea and Febiger, Philadelphia, 1983;
333-336.
71. Executive summary of the third report of the
National Cholesterol education Programme (NCEP)
Expert Panel on Detection, Evaluation and
Treatment of High Blood Cholesterol in Adults
(Adult Treatment Panel –III).
72. Stein A., Mayer G L., Clin Chem., 1995; 41:
1421-1426.
73. McGowan MW. Et al., Clin. Chem., 1983; 29: 538.
74. Test Kit of Span Diagnostic Ltd, India.