digital flood maps - kentucky...digital flood maps have a wide range of active and potential users....
TRANSCRIPT
DIGITAL FLOOD MAPS How to View and Use Digital Flood Maps
Revised March 2019
Abstract
This booklet gives you a comprehensive overview of how to view and use digital flood maps from the Kentucky Division of Water, the Federal Emergency Management Agency, and the United States Geological Survey

Page Intentionally Left Blank

3
Questions? Comments? Contact the Division of Water at [email protected]
Table of Contents
I. Introduction …………………………………………………………………………… 3
II. Kentucky Flood Hazard Portal ……………………………………………….. 4 III. Mobile Flood App …………………………………………………………………… 8
IV. Flood Map Update Portal ………………………………………………………. 10 V. FEMA Map Service Center ……………………………………………………… 11 VI. FIRMette Tool ………………………………………………………………………… 13 VII. Compare Tool ……………………………………………………………………….. 14 VIII. ArcMap …………………………………………………………………………………. 15
IX. Flood Inundation Mapper ……………………………………………………… 18
Introduction Digital flood maps have a wide range of active and potential users. Citizens use the maps to see if their home is located in the floodplains. Community officials use these products to administer floodplain management regulations and mitigate flood damage. Lending institutions and federal agencies use the products to locate properties and buildings to determine whether flood insurance is required when making loans and providing grants for the purchase or construction of buildings. Because we live in a digital age and because of the great increase of data available, there are many ways that you can view and use digital floodplain maps. This publication is designed to help you find some of the available mapping resources available in the Commonwealth, walks you through how to use these digital map services effectively, and to understand some of their unique abilities & their limitations. The following pages give a brief overview tools specific to Kentucky, as well as tools from FEMA and the USGS. Your use of these mapping services may depend on several factors such as what are you trying to see using the flood maps, your internet connection, the capabilities of your computer, which programs you have downloaded to your computer, and which programs you have access to. For help using these digital resources or for more information about flood risk information included in these programs, please contact the Kentucky Division of Water (KDOW) State NFIP Coordinator by emailing [email protected] or the KDOW Risk MAP team at [email protected].

4
Questions? Comments? Contact the Division of Water at [email protected]
Kentucky Flood Hazard Portal Kentucky Division of Water (KDOW)
Before You Start The Flood Hazard Portal is available at: https://watermaps.ky.gov/RiskPortal/. To use the Portal, you must use either Google Chrome, Mozilla Firefox, or Apple Safari web browsers on your computer. The Portal does not work well in Internet Explorer. Use one of the suggested web browser for best results.
Using the Flood Risk Portal The Kentucky Flood Hazard Portal is an online map service that allows you to easily view all of the current effective floodmaps for the Commonwealth of Kentucky. This includes information such as the streams & rivers, Flood Hazard Zones, FIRM Panel boundaries, numbers & effective dates, and areas where a Letter of Map Change (LOMA & LOMRs) have been issued. To find your area of interest by searching for a street address, general location (i.e. city name), or by Latitude & Longitude for any location in Kentucky. The search bar feature is located in the top right corner (circled below in GREEN).
The portal also includes a feature allowing users to select the type of Basemap on which they would like to have the floodplains shown. Some of the available basemaps include aerial imagery, road maps, and topographic maps. To change your basemap, click the ‘Switch Basemap’ button in the upper right corner of the page near the search bar (circled above in ORANGE). These different maps allow users to identify and view different features of the community’s floodplains as seen in the example from Morehead below.
5
Questions? Comments? Contact the Division of Water at [email protected]
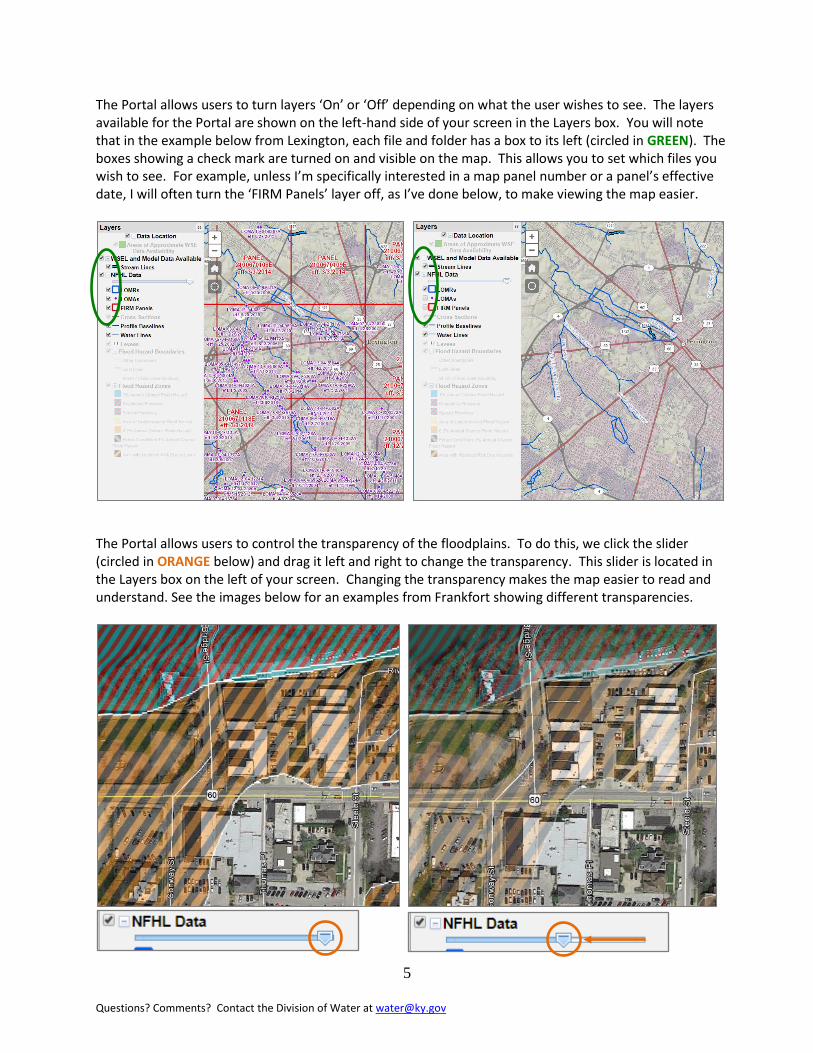
The Portal allows users to turn layers ‘On’ or ‘Off’ depending on what the user wishes to see. The layers available for the Portal are shown on the left-hand side of your screen in the Layers box. You will note that in the example below from Lexington, each file and folder has a box to its left (circled in GREEN). The boxes showing a check mark are turned on and visible on the map. This allows you to set which files you wish to see. For example, unless I’m specifically interested in a map panel number or a panel’s effective date, I will often turn the ‘FIRM Panels’ layer off, as I’ve done below, to make viewing the map easier.
The Portal allows users to control the transparency of the floodplains. To do this, we click the slider (circled in ORANGE below) and drag it left and right to change the transparency. This slider is located in the Layers box on the left of your screen. Changing the transparency makes the map easier to read and understand. See the images below for an examples from Frankfort showing different transparencies.
6
Questions? Comments? Contact the Division of Water at [email protected]
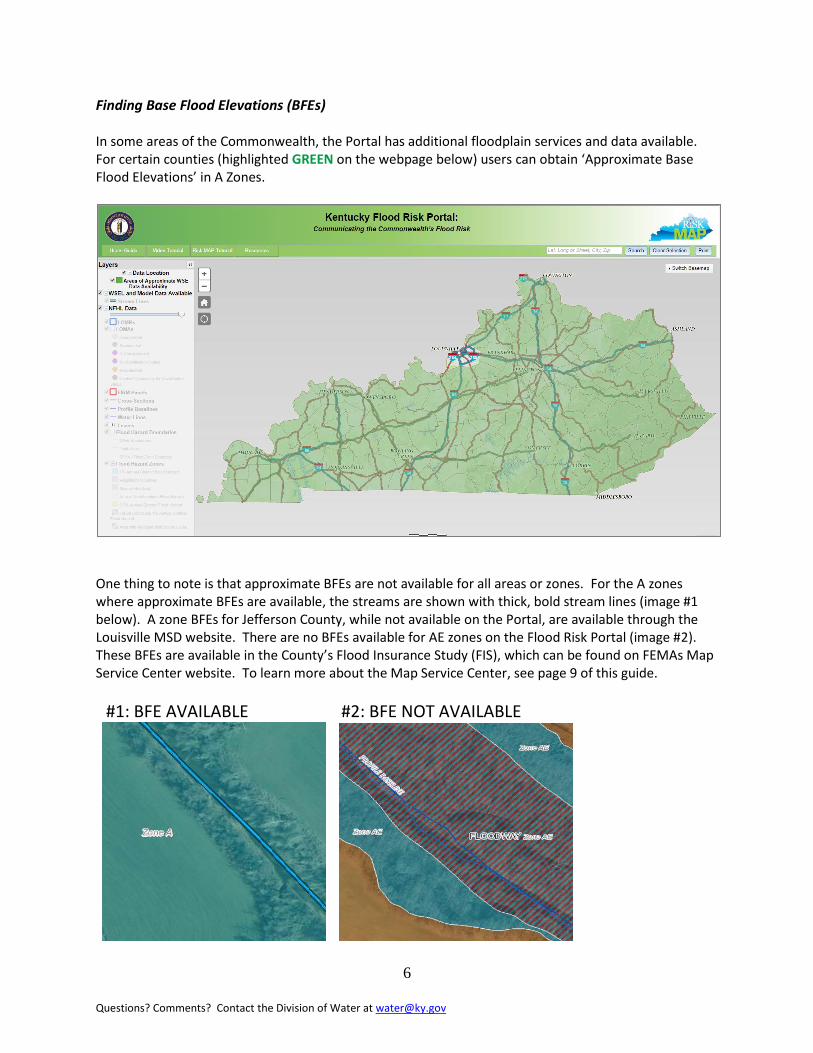
Finding Base Flood Elevations (BFEs) In some areas of the Commonwealth, the Portal has additional floodplain services and data available. For certain counties (highlighted GREEN on the webpage below) users can obtain ‘Approximate Base Flood Elevations’ in A Zones.
One thing to note is that approximate BFEs are not available for all areas or zones. For the A zones where approximate BFEs are available, the streams are shown with thick, bold stream lines (image #1 below). A zone BFEs for Jefferson County, while not available on the Portal, are available through the Louisville MSD website. There are no BFEs available for AE zones on the Flood Risk Portal (image #2). These BFEs are available in the County’s Flood Insurance Study (FIS), which can be found on FEMAs Map Service Center website. To learn more about the Map Service Center, see page 9 of this guide.
#1: BFE AVAILABLE #2: BFE NOT AVAILABLE

7
Questions? Comments? Contact the Division of Water at [email protected]
To get an approximate BFE in one of the highlighted counties, users have to simply clicking the stream centerline as shown below. A ‘Results’ box will appear that provides you the Approximate Base Flood Elevation (BFE) for the location the user selected. You can see in the example below from Graves County (circled in GREEN) the approximate BFE for this site is 410.1 ft. The BFEs available on the Portal can be used for actions such as permit applications, building requirements, Elevation Certificates, and Letters of Map Change applications.
For Surveyors, Engineers, or other technical users, the Portal also allows you to download the model used to create the effective flood maps. From the results box shown above, click the ‘Download Mode Here’ link (circled in ORANGE). This gives you the option of downloading the effective A zone models, the Hydraulic and Hydrology Reports, and the Flood Insurance Study (FIS) for your location. Additional resources are available for help using the Portal. This includes several guides, videos, and tutorials. These tutorials are located in the upper left-hand page of the screen and are seen below (circled in BLUE).
The ‘Users Guide’ is an explanation of how several of the Flood Risk Portals that walks users through, step by step, how all of the Portal’s features work. There is also a Video Tutorial available on YouTube that visually shows users many of the features.
8
Questions? Comments? Contact the Division of Water at [email protected]
Mobile Applications
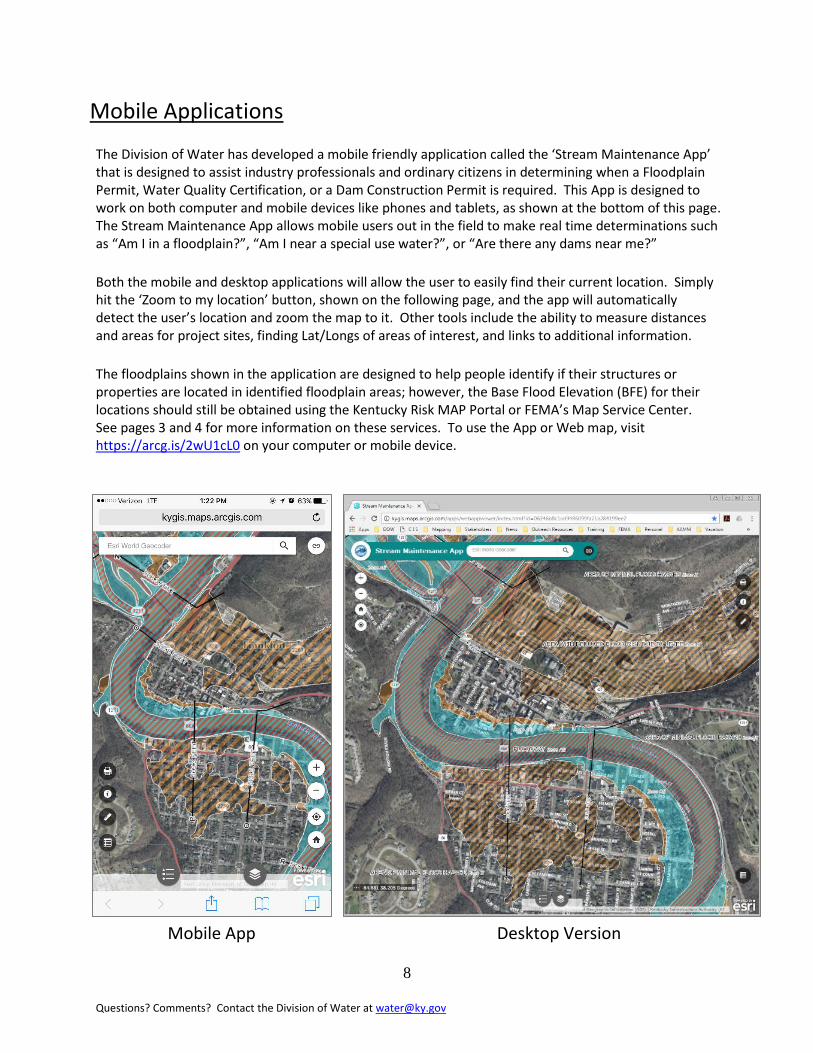
The Division of Water has developed a mobile friendly application called the ‘Stream Maintenance App’ that is designed to assist industry professionals and ordinary citizens in determining when a Floodplain Permit, Water Quality Certification, or a Dam Construction Permit is required. This App is designed to work on both computer and mobile devices like phones and tablets, as shown at the bottom of this page. The Stream Maintenance App allows mobile users out in the field to make real time determinations such as “Am I in a floodplain?”, “Am I near a special use water?”, or “Are there any dams near me?”
Both the mobile and desktop applications will allow the user to easily find their current location. Simply hit the ‘Zoom to my location’ button, shown on the following page, and the app will automatically detect the user’s location and zoom the map to it. Other tools include the ability to measure distances and areas for project sites, finding Lat/Longs of areas of interest, and links to additional information.
The floodplains shown in the application are designed to help people identify if their structures or properties are located in identified floodplain areas; however, the Base Flood Elevation (BFE) for their locations should still be obtained using the Kentucky Risk MAP Portal or FEMA’s Map Service Center. See pages 3 and 4 for more information on these services. To use the App or Web map, visit https://arcg.is/2wU1cL0 on your computer or mobile device.
Mobile App Desktop Version

9
Questions? Comments? Contact the Division of Water at [email protected]
Mobile Application Controls
Web Links
For More
Information
Zoom:
In & Out
Home Start
Screen
Layers Legend
Measure Tools
& Lat/Long
Finder
Information
Search Bar

10
Questions? Comments? Contact the Division of Water at [email protected]
Flood Map Updates Kentucky Division of Water (KDOW)
Flood risks can change over time. Water flow & drainage patterns can change dramatically because of surface erosion, land use, and natural forces. Keeping a communities flood maps up to date is an important step in helping a community protect lives and reduce property damage as a result of flooding. The Kentucky Division of Water is FEMA’s Cooperating Technical Partner (CTP) in updating the Commonwealth’s flood maps. The process, called Risk MAP, combines flood hazard identification (mapping), flood risk assessment, and hazard mitigation planning activities, to create a holistic view of flood risks in communities across the Commonwealth. As this flood map update process nears completion, preliminary flood maps are available for community members and community elected officials to review.
These preliminary flood maps are made available digitally on the Kentucky Watermaps page (shown above) for review by local officials and community members to better inform them of their community’s flood risks. Allowing community members to review these maps before they become effective allows users the opportunity to help enhance these products and to be aware of any changes. These maps can also be used by lenders, insurance agents, and community officials to help manage flood risks. For local coordinators, it is suggested that any preliminary flood maps are used in the managing of floodplains. In instances where the new maps show a change in the BFE, FEMA recommends that until these new maps go effective, community officials use the more conservative of the two BFEs. These preliminary maps are only available temporarily. Once they become effective, these preliminary maps are removed from this page and included on the Flood Risk Portal discussed on page 4 of this guide. The FEMA Flood Map Project Updates maps are available at http://watermaps.ky.gov/ and selecting the ‘FEMA Flood Map Project Updates’ story map page.
11
Questions? Comments? Contact the Division of Water at [email protected]
Map Service Center Federal Emergency Management Agency (FEMA)
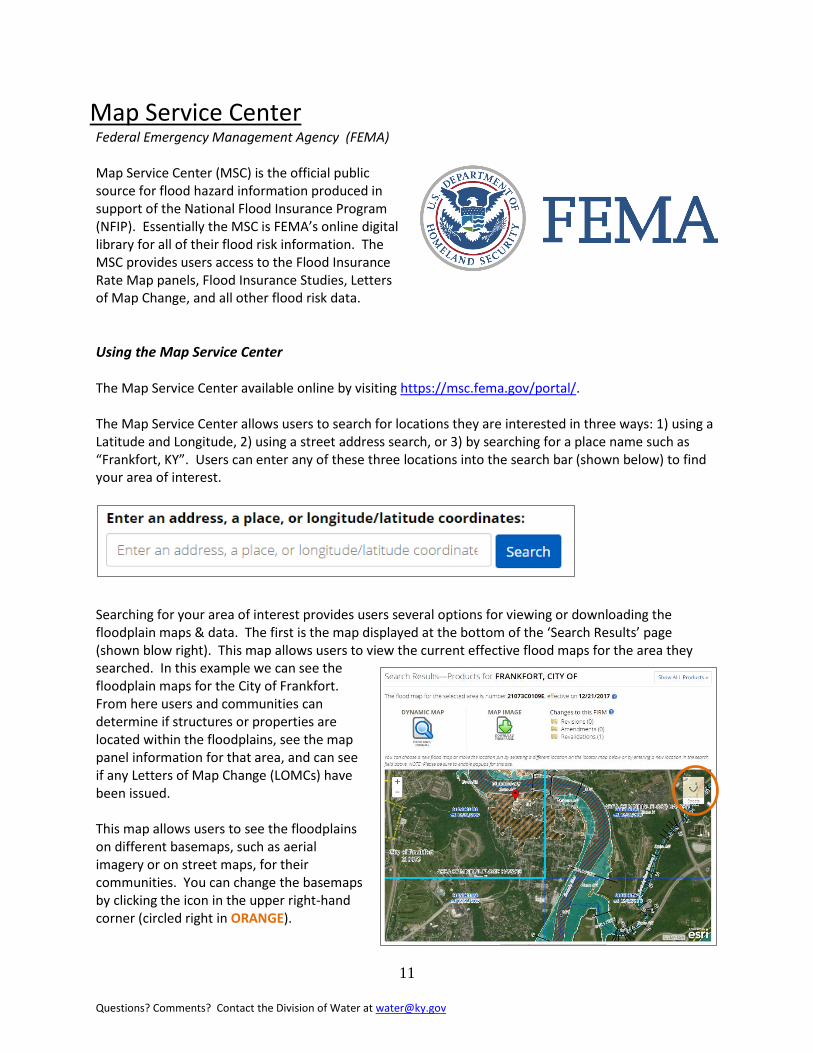
Map Service Center (MSC) is the official public source for flood hazard information produced in support of the National Flood Insurance Program (NFIP). Essentially the MSC is FEMA’s online digital library for all of their flood risk information. The MSC provides users access to the Flood Insurance Rate Map panels, Flood Insurance Studies, Letters of Map Change, and all other flood risk data.
Using the Map Service Center The Map Service Center available online by visiting https://msc.fema.gov/portal/. The Map Service Center allows users to search for locations they are interested in three ways: 1) using a Latitude and Longitude, 2) using a street address search, or 3) by searching for a place name such as “Frankfort, KY”. Users can enter any of these three locations into the search bar (shown below) to find your area of interest.
Searching for your area of interest provides users several options for viewing or downloading the floodplain maps & data. The first is the map displayed at the bottom of the ‘Search Results’ page (shown blow right). This map allows users to view the current effective flood maps for the area they searched. In this example we can see the floodplain maps for the City of Frankfort. From here users and communities can determine if structures or properties are located within the floodplains, see the map panel information for that area, and can see if any Letters of Map Change (LOMCs) have been issued. This map allows users to see the floodplains on different basemaps, such as aerial imagery or on street maps, for their communities. You can change the basemaps by clicking the icon in the upper right-hand corner (circled right in ORANGE).

12
Questions? Comments? Contact the Division of Water at [email protected]
The Map Service Center also provides users access to all preliminary, pending, effective, and historic flood risk data for their community of interest. This data is available through the MSC Search Results page under the ‘Show ALL Products’ button (circled below in GREEN).
This Show ALL Products button takes users to a new results page that allows users to select the folder for the type of product in which they are interested. The folders available for each community are preliminary, pending, effective, and historic products. Each of these folders contain FIRM Panels (flood maps), FIS Reports, and the LOMCs. The effective products show the flood risk products that are currently being used by lenders, insurance providers, and communities to manage flood risk. The historic products are those maps, reports, and letters that were in use at one time but have been replaced by the effective products. Preliminary & Pending products are map products that are in the process of updating the effective products and are there for people to review and communities to use. Users can download or view individual products by selecting the one for which they are interested. For community officials, the ‘Download All’ buttons (circled in ORANGE) lets you download all of the letters, panels, or reports for the community you selected. Every community should keep a copy of all paper maps, reports, and letters on file in perpetuity in the event that a disaster making viewing electronic maps impossible. There is also a ‘Flood Risk Products’ folder (circled right in BLUE) that is available for communities with access to GIS software. These products are supplementary resources created specifically for communicating flood risk to community residents and property owners. Some of the different products include depth grids, percent annual chance of flooding, and the percent chance of flooding over 30 years. The ‘1% Chance Depth Grid” maps indicate to the user what the expected depth of water would be during the 1% chance flood, commonly referred to as the 100-year flood. The percent annual change maps show individual property owners their chance of a flood occurring in any given year. The ‘Percent Chance of Flooding Over 30 Year Period’ maps inform homeowners the chance of flooding while they have a mortgage.
13
Questions? Comments? Contact the Division of Water at [email protected]
FIRMette Tool Federal Emergency Management Agency (FEMA)
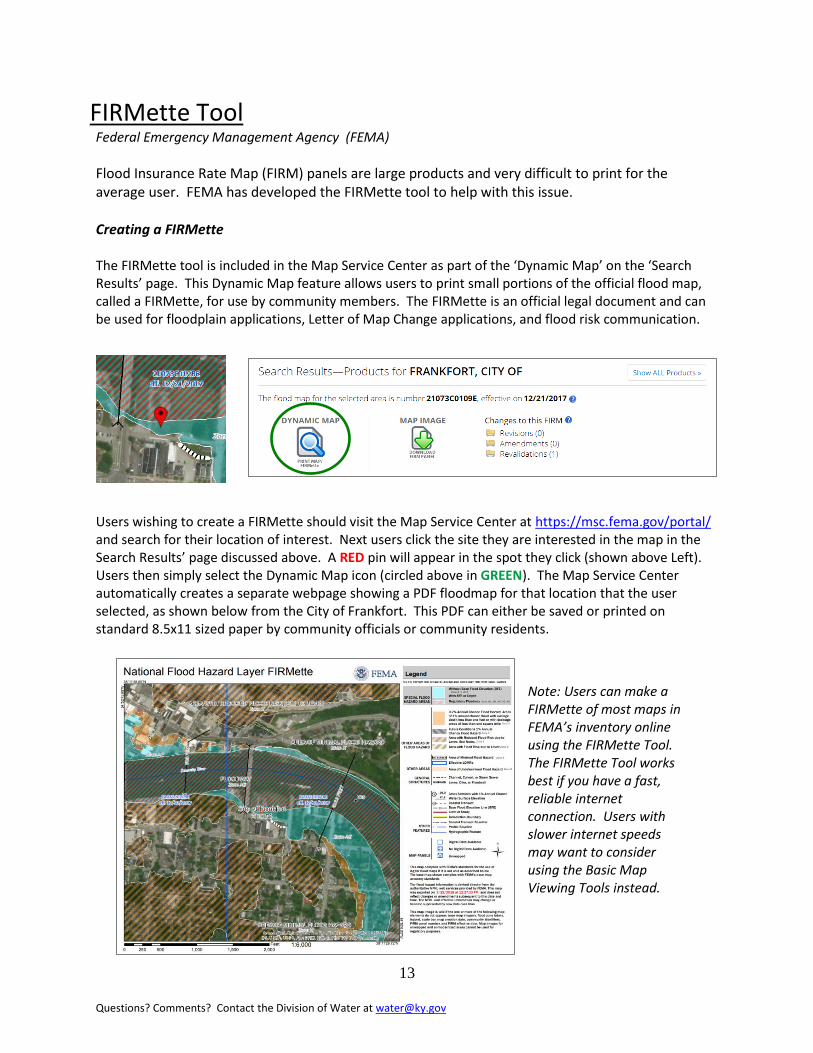
Flood Insurance Rate Map (FIRM) panels are large products and very difficult to print for the average user. FEMA has developed the FIRMette tool to help with this issue. Creating a FIRMette The FIRMette tool is included in the Map Service Center as part of the ‘Dynamic Map’ on the ‘Search Results’ page. This Dynamic Map feature allows users to print small portions of the official flood map, called a FIRMette, for use by community members. The FIRMette is an official legal document and can be used for floodplain applications, Letter of Map Change applications, and flood risk communication.
Users wishing to create a FIRMette should visit the Map Service Center at https://msc.fema.gov/portal/ and search for their location of interest. Next users click the site they are interested in the map in the Search Results’ page discussed above. A RED pin will appear in the spot they click (shown above Left). Users then simply select the Dynamic Map icon (circled above in GREEN). The Map Service Center automatically creates a separate webpage showing a PDF floodmap for that location that the user selected, as shown below from the City of Frankfort. This PDF can either be saved or printed on standard 8.5x11 sized paper by community officials or community residents.
Note: Users can make a FIRMette of most maps in FEMA’s inventory online using the FIRMette Tool. The FIRMette Tool works best if you have a fast, reliable internet connection. Users with slower internet speeds may want to consider using the Basic Map Viewing Tools instead.
14
Questions? Comments? Contact the Division of Water at [email protected]
Preliminary Map Comparison Tool Federal Emergency Management Agency (FEMA)
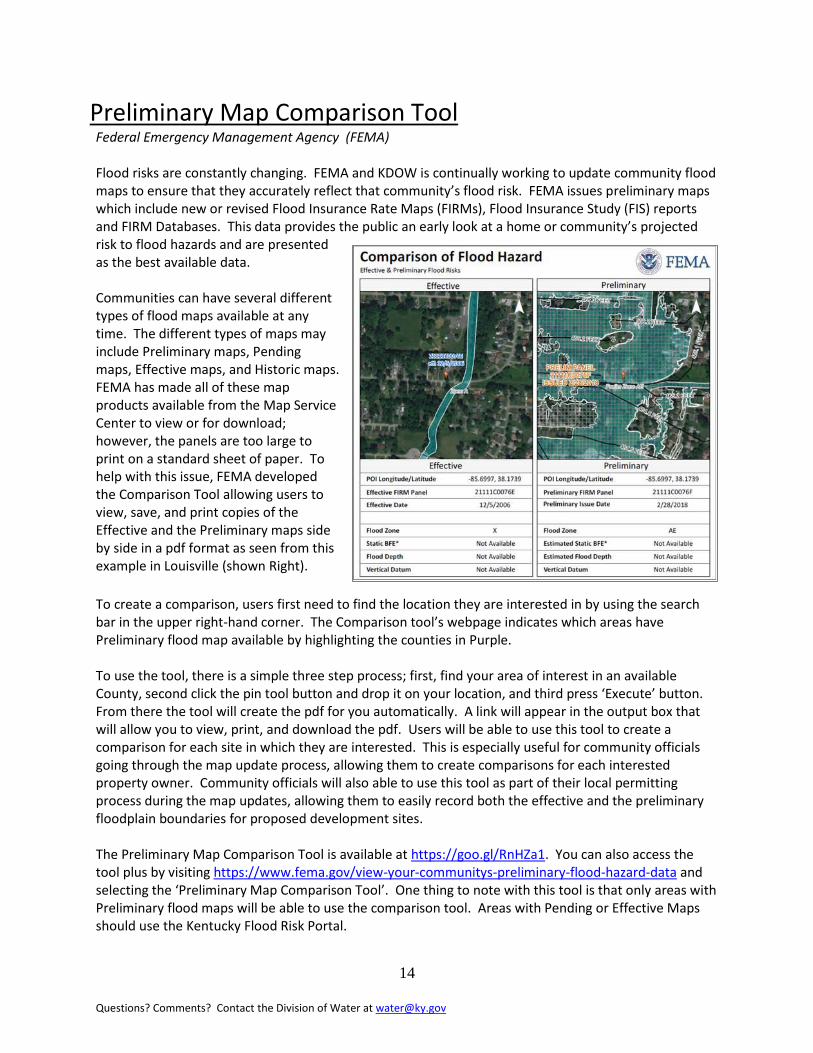
Flood risks are constantly changing. FEMA and KDOW is continually working to update community flood maps to ensure that they accurately reflect that community’s flood risk. FEMA issues preliminary maps which include new or revised Flood Insurance Rate Maps (FIRMs), Flood Insurance Study (FIS) reports and FIRM Databases. This data provides the public an early look at a home or community’s projected risk to flood hazards and are presented as the best available data. Communities can have several different types of flood maps available at any time. The different types of maps may include Preliminary maps, Pending maps, Effective maps, and Historic maps. FEMA has made all of these map products available from the Map Service Center to view or for download; however, the panels are too large to print on a standard sheet of paper. To help with this issue, FEMA developed the Comparison Tool allowing users to view, save, and print copies of the Effective and the Preliminary maps side by side in a pdf format as seen from this example in Louisville (shown Right).
To create a comparison, users first need to find the location they are interested in by using the search bar in the upper right-hand corner. The Comparison tool’s webpage indicates which areas have Preliminary flood map available by highlighting the counties in Purple. To use the tool, there is a simple three step process; first, find your area of interest in an available County, second click the pin tool button and drop it on your location, and third press ‘Execute’ button. From there the tool will create the pdf for you automatically. A link will appear in the output box that will allow you to view, print, and download the pdf. Users will be able to use this tool to create a comparison for each site in which they are interested. This is especially useful for community officials going through the map update process, allowing them to create comparisons for each interested property owner. Community officials will also able to use this tool as part of their local permitting process during the map updates, allowing them to easily record both the effective and the preliminary floodplain boundaries for proposed development sites. The Preliminary Map Comparison Tool is available at https://goo.gl/RnHZa1. You can also access the tool plus by visiting https://www.fema.gov/view-your-communitys-preliminary-flood-hazard-data and selecting the ‘Preliminary Map Comparison Tool’. One thing to note with this tool is that only areas with Preliminary flood maps will be able to use the comparison tool. Areas with Pending or Effective Maps should use the Kentucky Flood Risk Portal.

15
Questions? Comments? Contact the Division of Water at [email protected]
ArcMap - National Flood Hazard Layer Federal Emergency Management Agency (FEMA)
For floodplain managers with access to GIS software, FEMA has developed a REST service available that brings effective National Flood Hazard Layer (NFHL) data into your GIS program. It’s a “live” layer accessed via the web, so when FEMA updates on their end, the updates show up automatically in your projects. This allows you to have access to the most up-to-date floodplain maps, LOMA’s and LOMR’s, FIRM Panels, Base Flood Elevations, stream lines, and many other useful layers. A high speed internet connection is required when using the Rest Service.
Adding the NFHL Rest Service
Step 1) Open the ArcMap project where you would like to add the NFHL. Click the ‘Add Data’ button.
Step 2) In the ‘Add Data’ popup, click the dropdown box at the top of the popup, select ‘GIS Servers’
You then select the ‘Add ArcGIS Server’. Then click ‘Add’.

16
Questions? Comments? Contact the Division of Water at [email protected]
Step 3) Select the ‘Use GIS services’ and click ‘Next’.
Step 4) Type the URL provided below into ‘Server URL’ of the popup box. Click ‘Finish’
Rest Service URL: https://hazards.fema.gov/gis/nfhl/rest/services

17
Questions? Comments? Contact the Division of Water at [email protected]
Step 5) A new server has been automatically added to your list of available GIS Servers. Select this new
server and click ‘Add’.
Step 6) Open the ‘public’ folder. Select the ‘NFHL’ file and click ‘Add’.
Congratulations! You have now added the National Flood Hazard Layer Rest Service to your ArcMap project. Once you have the NFHL layer added, be sure to save your project to ensure that this layer will be available to you going forward. Additionally, once you have this server added, if you have multiple projects you would like to use the NFHL with, you simply need to complete steps 1, 5, and 6 for those additional projects. For more help troubleshooting the NFHL, contact the Kentucky Risk MAP team at [email protected].

18
Questions? Comments? Contact the Division of Water at [email protected]
Flood Inundation Mapper United States Geological Survey (USGS)
The United States Geological Survey (USGS) has developed a digital mapping program called Flood Inundation Mapping, that is designed to help communities protect lives and property by providing tools and information to better understand their flood risks and make cost-effective mitigation decisions.
Using the Flood Risk Portal To access the Flood Inundation Mapper, visit https://fim.wim.usgs.gov/fim/ on your computer. This link is also mobile friendly so you’re able to use it on your smart phone or tablet as well. A map showing the locations of available inundation maps will appear. Select the mapper you’re interested in and a click on the ‘Flood Tools’ popup box. This tool allows the user to select the elevation of the water at the gage for which they are interested. The slider bar (below Left) lets the user move the river stages up or down depending what river gage elevation in which they’re interested. You can see in the example below from Frankfort what the water level looks like in real time when the river reaches its flood stage of 31’ (Middle) and when it nears its historic crest of 48’ (Right).
In addition to seeing the different flood elevations, the Inundation Mapper tool now lets users select flooded areas to see what the expected water depth would be at the selected location. You can see in the example to the right that the City of Frankfort’s wastewater treatment plant can expect 1.5-2.5 ft. of water when the gage reaches this particular water level. This allows users to understand how the different river gage elevations will affect their community or individual properties. The tool also allows communities to increase their preparedness & planning, and to enhance their response to flooding. There are currently only a select few communities in the Commonwealth with Flood Inundation Maps available. If your community is interested having one, contact USGS or KDOW for more information.

19
Questions? Comments? Contact the Division of Water at [email protected]
Page Intentionally Left Blank

Kentucky Division of Water 300 Sower Boulevard, 3rd Floor
Frankfort, KY 40601 (502) 564-3410 [email protected]