dr maria vesna nikolic (orcid id : 0000-0001-5035-0170
TRANSCRIPT

Acc
epte
d A
rtic
le
This article has been accepted for publication and undergone full peer review but has not
been through the copyediting, typesetting, pagination and proofreading process, which may
lead to differences between this version and the Version of Record. Please cite this article as
doi: 10.1111/ijac.13190
This article is protected by copyright. All rights reserved.
DR MARIA VESNA NIKOLIC (Orcid ID : 0000-0001-5035-0170)
Article type : Article
Investigation of ZnFe2O4 spinel ferrite nanocrystalline screen-printed thick
films for application in humidity sensing
Maria V. Nikolic1*, Zorka Z. Vasiljevic2, Miloljub D. Lukovic1, Vera P. Pavlovic3, Jugoslav B. Krstic4,
Jelena Vujancevic2, Nenad Tadic5, Branislav Vlahovic6, Vladimir B. Pavlovic2
1Institute for Multidisciplinary Research, University of Belgrade, Kneza Viseslava 1, 11030, Belgrade,
Serbia
2Institute of Technical Sciences of SASA, Knez Mihailova 35, 11000 Belgrade, Serbia
3University of Belgrade, Faculty of Mechanical Engineering, Kraljice Marije 16, 11000 Belgrade,
Serbia
4 Institute of Chemistry, Technology and Metallurgy, Department of Catalysis and Chemical
Engineering, University of Belgrade, Studentski trg 12-16/III, 11000 Belgrade, Serbia
5University of Belgrade, Faculty of Physics, Studentski trg 12, 11000 Belgrade, Serbia
6 North Carolina Central University, 18001 Fayeteville Street, Durham, NC 27707, USA
*corresponding author [email protected]

Acc
epte
d A
rtic
le
This article is protected by copyright. All rights reserved.
Abstract
Zinc ferrite nanocrystalline powder was obtained by solid state synthesis of starting zinc
oxide and hematite nanopowders. Field emission scanning electron microscopy (FESEM and
transmission electron microscopy (TEM), X-ray diffraction (XRD), X-ray photoelectron spectroscopy
(XPS) and Raman spectroscopy confirmed the formation of nanocrystalline zinc-ferrite powder with
a mixed spinel structure with small amounts of remaining zinc oxide and hematite as impurities.
Thick film paste was formed and screen printed on test interdigitated PdAg electrodes on alumina
substrate. Formation of a porous nanocrystalline structure was confirmed by scanning electron
microscopy (SEM) and Hg porosimetry. Humidity sensing properties of zinc ferrite thick films were
investigated by monitoring the change in impedance in the relative humidity interval 30-90% in the
frequency range 42 Hz – 1 MHz at room temperature (25 oC) and 50 oC. At 42 Hz at both analyzed
temperatures the impedance reduced 46 times in the humidity range 30-90%. The dominant
influence of grain boundaries was confirmed by analysis of complex impedance with an equivalent
circuit.
Keywords: zinc ferrite, thick film, electrical properties, humidity sensor
1. INTRODUCTION
With continued industrial progress and overall increase in pollution, gas detection continues
to have a very important role through monitoring and control in environment protection, safety in
households and industry and many other aspects of human life1. Humidity monitoring and control is
significant for quality control, plant cultivation and in many other industrial fields2. Metal oxide
semiconductor gas sensor materials have been intensively investigated over the last 50 years. This
research has involved a wide variety of metal oxides such as TiO2, WO3, Fe2O3 (transition metal-

Acc
epte
d A
rtic
le
This article is protected by copyright. All rights reserved.
oxides), ZnO, SnO2 (post-transition metals)1. Metal oxide gas sensors have shown high sensitivity,
fast response, long term stability, high selectivity, low cost and are simple. Complex oxides, such as
spinel oxides and especially spinel ferrites (unit formula AB2O4) are very promising materials for
sensing different gases, even though they have been much more widely applied as magnetic
materials. Spinel ferrites have shown sensitivity to a wide variety of gases, such as H2O (humidity),
CO, ethanol, acetone, VOCs3-8.
The spinel structure with an AB2O4 unit formula represents a cubic crystal system with 32
closely packed oxygen atoms with 64 tetrahedral sites and 32 octahedral sites. In spinel ferrites the
general formula is MFe2O4. Depending on the balance between M2+ and Fe3+ cations on 8 tetrahedral
and 16 octahedral sites three spinel structures are possible: normal where all M2+ divalent cations
are on the tetrahedral sites and trivalent Fe3+ cations are on octahedral sites, inverse where divalent
cations occupy octahedral sites and trivalent cations are equally distributed on remaining octahedral
sites and tetrahedral sites, and mixed where both M2+ and Fe3+ cations randomly occupy both
octahedral and tetrahedral sites1,9.
Conventionally ZnFe2O4 has a normal spinel structure with Zn2+ cations occupying octahedral
sites10. However, the cation distribution in spinel ferrites and thus zinc-ferrite, is greatly influenced
by the synthesis procedure, especially when nanosized particles are obtained11-15. Nanosized zinc-
ferrite particles have a mixed spinel structure, with the inversion parameter depending on the
synthesis route9. Particle size, morphology, structure and the inversion parameter greatly influence
the resulting properties of nanoscale zinc ferrite, enhancing and broadening the potential
application of this material besides magnetic devices to drug delivery, photocatalysis, antifungal
activity and gas sensing5, 13, 14, 16, 17.
Modification of ZnFe2O4 with ion substitution or forming composites with other materials
further enhances the properties of this spinel ferrite for a wide range of applications, such as gas
sensor, semiconductor photocatalyst and cathode material in lithium ion batteries10. Thus,

Acc
epte
d A
rtic
le
This article is protected by copyright. All rights reserved.
significantly improved photoelectrochemical activity was obtained for ZnFe2O4/-Fe2O3
heterojunction arrays18. Enhanced gas sensing performance has been achieved for ZnO/ZnFe2O4
composite nanoheterostructures19-21. The influence of magnesium substitution in nanoparticle zinc
ferrites on the humidity response and sensitivity was investigated by Patil et al4.
The gas sensing mechanism of spinel ferrite oxides is well known1, 16, 17. It is a surface-related
mechanism where a porous structure offers more active sites accessible for sensing reactions16, 17. In
theory spinel ferrites are predisposed to good sensing performance due to the difference in size
between, for example, Zn(II) and Fe(III) cations, electronegativity and other properties, so they are
capable of chemisorbing more oxygen than other metal oxides16. Physicochemical characteristics of
spinel ferrites can be tuned due to the differences in geometry and ion bonding energy between
cations and surrounding oxygen ions in octahedral and tetrahedral polyhedron1. In ZnFe2O4 changes
to the cation positioning in the spinel structure from normal to mixed, establish conditions for
improved gas sensing properties of mixed spinel ZnFe2O41. One issue is instability of Zn2+ cations in
octahedral sites at temperatures higher than 300 oC, and this prevents exploitation of ZnFe2O4 in
many gas sensors. However, humidity sensing does not occur at high temperatures, but most often
at temperatures close to room temperature. In their recent work Xu et al.2 obtained a high humidity
response of sol-gel synthesized ZnFe2O4 thin films. In this work we have synthesized nanocrystalline
zinc ferrite powder with small amounts of zinc oxide and hematite as impurities, using a simple solid
state procedure. It was used to form thick film paste that was screen printed on test interdigitated
PdAg electrodes on alumina substrate. The aim was to analyze the influence of humidity on
impedance response in view of potential application of this low cost simple method and versatile
material in humidity sensing.

Acc
epte
d A
rtic
le
This article is protected by copyright. All rights reserved.
2. EXPERIMENTAL
2.1 Materials
Starting commercial nanopowders of ZnO (Chempur, 99.5%, grain size 20 nm) and α-Fe2O3
(hematite, Alfa Aesar 99%, grain size 20-60 nm) in the appropriate molar ratio to form ZnFe2O4 were
homogenized in a planetary ball mill for 15 min and calcined at 900oC for 2h, and the obtained
powder was then sieved through a 38 m (400 mesh) sieve.
Thick film paste was prepared by the addition of organic agents to 6 gr of the synthesized
powder following the procedure described by Ito et al22. The organic agents used were 30 ml of
anhydrous ethanol as a solvent, 20 g of alpha-terpineol (95% min, Alfa Aesar) as an organic solvent
and 3 g of ethyl-cellulose (viscosity 4 cP, Aldrich Chemistry) as a binder. The combination of 1 ml
acetic acid (MOS HEMOS, pro analysis) and 5 ml of distilled water was used to peptize the paste. An
ultrasonic horn (Bandelin Sonoplus 2070HD) was used for homogenization. Alpha terpineol was
added as an organic solvent as it gives long-term stability and reproducible results compared to
water-based pastes22. The combination of water and acetic acid acted as aggregation blockers and
adhesion enhancers22,23.
Interdigitated PdAg electrodes were screen printed on alumina substrate and fired in a
conveyor furnace at 850oC for 10 minutes in air. The analyzed electrode spacing was 0.2 and 0.25
mm. Four layers of paste were then screen printed on the prepared alumina substrate with
interdigitated PdAg electrodes. Each layer was dried for 15 minutes at 60oC, before the next layer
was printed. The average layer thickness was estimated to be 12-15µm, so the resulting thick film
thickness was estimated to be 55 μm. The sensors were heat treated in air in a furnace at 600oC
for 30 minutes. An example of a thick film test sample is shown in Figure 1.

Acc
epte
d A
rtic
le
This article is protected by copyright. All rights reserved.
2.2 Structural characterization
X-ray diffraction (XRD) analysis of the obtained zinc ferrite powder was performed on a
Philips PW 1050 diffractometer with CuK radiation, step 0.02 s and holding time 10s. XRD analysis
of the thick film material (powder) peeled off the sensor substrate was performed on a Rigaku
Ultima IV diffractometer. Structural refinement was performed using the Rietveld method with the
GSAS II package24. Samples were analyzed for the presence of ZnFe2O4 with a mixed cubic spinel
structure, using starting parameters given by Waerenborgh et al25 (ICSD 75104, a = 8.4409, inversion
parameter 0.201), ZnO and -Fe2O3 (hematite).
Transmission electron microscopy (TEM) of the obtained powder was performed on a JEOL
JEM-1400 PLUS device.
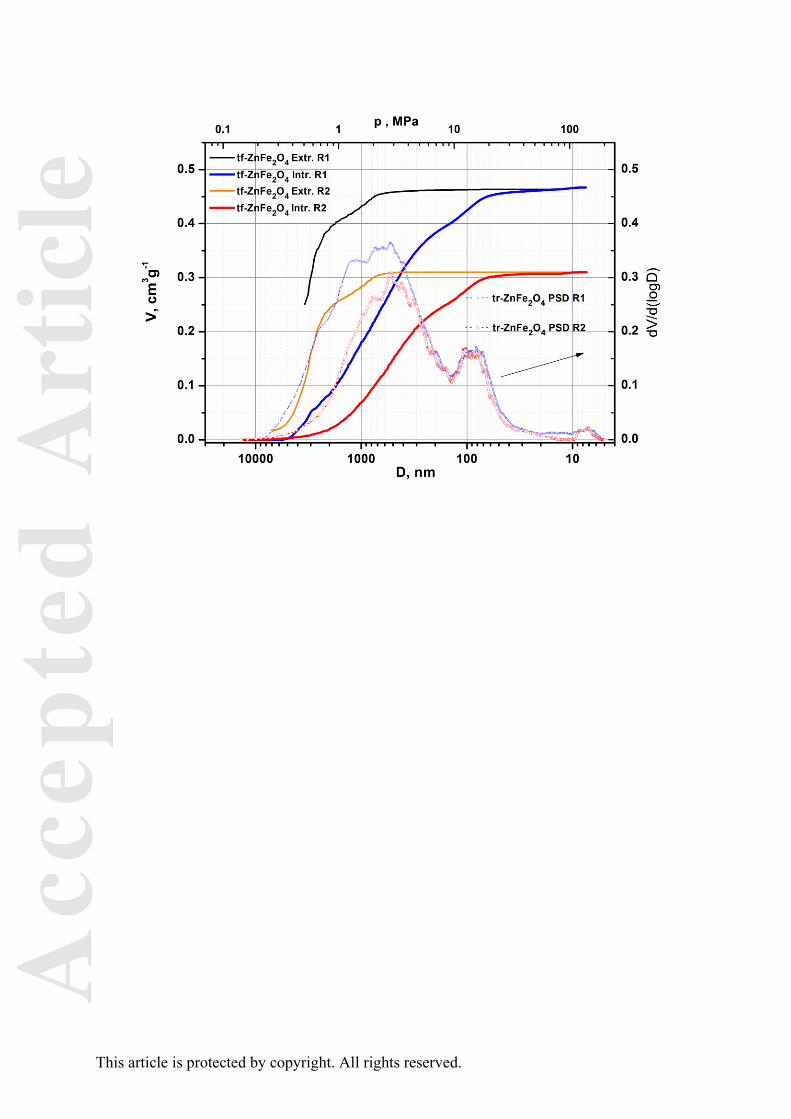
Hg porosimetry measurements were performed in order to determine textural parameters
of the synthetized ZnFe2O4 powder and thick film (denoted as tf-ZnFe2O4) obtained by peeling
material (powder) off the sensor substrate after paste preparation procedure and calcination. This
will enable estimation of the overall influence of the preparation procedure on the porosity of thick
film sensor material.
A CD3-P type dilatometer was used for measurement of both samples in the pressure range
from 0.1 to 200 MPa, for which the blank volume value (compressibility of mercury and dilatometer
parts) was determined.
Bulk density measurements (ρbl) of samples were performed on a Macropore Unit 120
(Fisons Instruments) using mercury as the displacing fluid. Prior to analysis the sample was dried in
an oven at 110 ºC during 24 h and additionally evacuated in a sample holder at the analytical
position for 2 h. Mercury porosimetry measurements were performed on a High pressure unit
PASCAL 440 (Thermo Fisher) within the same pressure range as blank measurement. For each
sample two intrusion-extrusion runs (R1 and R2), one after the other, were conducted. Automatic
Acc
epte
d A
rtic
le
This article is protected by copyright. All rights reserved.
data acquisition of intrusion-extrusion runs vs. applied pressure values was obtained through the
SOLID Software System interface for a PC. The SOLver Ver. 1.3.4 software was used for calculation of
parameters obtained from Hg porosimetry measurement: total cumulative volume (Vtot), apparent
density (ρApp) at maximal intrusion pressure, specific surface area and porosity. The same values of
mercury surface tension (0.48 N/m) and contact angle (140°) were used for all calculations. The
proper value of mercury density was used for all individual runs depending on the Hg temperature of
specific measurement. In all measurement The value of true density (5.38 g/cm3) was obtained in all
measurements by calculating from XRD data taking account the mass percent of all phases present
in the synthetized materials (ZnFe2O4, -Fe2O3 and ZnO).
Field-emission scanning electron microscopy (FESEM) of the starting powder and thick films
was performed on a TESCAN MIRA3 XM FESEM device.
Scanning electron microscopy (SEM) images of the thick film surface were recorded on a
TESCAN Electron Microscope VEGA TS 5130MM device.
X-ray photoelectron (XPS) spectra measurements were conducted on a Kratos Axis Ultra XPS
system. The X-Ray source was monochromated Aluminum K-alpha X-Ray with a source voltage of 15
kV and current of 10mA. All survey scans were performed with pass energy of 160eV, and all region
scans were performed with pass energy of 20eV. All data was calibrated to the C-C portion of the C1s
peak at 284.5eV.
Raman spectra of the starting ZnO/Fe2O3 powder mixture and the synthesized ZnFe2O4
powder were recorded on a Horiba Jobin Yvon LabRam HR evolution spectrometer in backscattering
geometry in the range 100-1500 cm-1 with a He-Ne laser (632.8 nm), grating 1800 lines/mm, slit 100,
power at sample of 0.4 and 1 mW and acquisition 20s/5 cycles.

Acc
epte
d A
rtic
le
This article is protected by copyright. All rights reserved.
2.3 Testing of Humidity Response
Change of impedance of zinc ferrite thick film samples was measured in a JEIO TECH TH-KE-
025 Temperature and humidity climatic chamber in the frequency range 42 Hz - 1MHz on a HIOKI
3532-50 LCR HiTESTER device. The relative humidity was varied from 30 to 90%. Measurements
were conducted at two operating temperatures 25 and 50oC. The sample was placed into the
chamber and impedance was measured using wires soldered to the electrodes. Prior to each
measurement the sample was dried for 20 minutes at 50oC to remove any excess moisture. The
chamber was set to the desired temperature and when this was achieved (on average 30-60
minutes) the humidity was varied from 30 to 90% and back. Impedance was measured after the set
humidity value was achieved/stabilized (on average 45-90 minutes). This cycle was repeated for each
analyzed sample.
3. RESULTS AND DISCUSSION
3.1 Structural and morphological analysis of ZnFe2O4 powder
Rietveld refinement of the XRD of the obtained powder (Figure 2) showed that it contained
ZnFe2O4 with a mixed spinel structure, and small amounts of unreacted ZnO and Fe2O3 (hematite).
Determined structural parameters (cell parameters, atomic positions, isotropic thermal
displacement, occupancies and average oxygen-metal distances) from Rietveld refinement and
crystallite sizes calculated using the Sherrer equation are given in Table 1.
The general formula for a spinel ferrite is
with the divalent
atom Me (Zn, Ni, Mg, Mn, Co, Fe etc.) occupying either tetrahedral (A - 8a) or octahedral (B – 16d)
sites, where x denotes the inversion parameter26. When x = 0, the divalent atoms are all located on
the tetrahedral sites and the spinel is normal. When x = 1, the divalent atoms are all located on
octahedral sites and the spinel is inverse. All other variations of x can be defined as mixed (random)

Acc
epte
d A
rtic
le
This article is protected by copyright. All rights reserved.
spinel. Zinc ferrite in bulk form is a normal spinel, where divalent non-magnetic Zn2+ ions
preferentially occupy tetrahedral (A) sites and all Fe3+ ions occupy octahedral sites12. However, in
nanocrystalline ZnFe2O4 Zn2+ and Fe3+ cations are distributed on both octahedral and tetrahedral
sites leading to a mixed spinel structure resulting in enhanced magnetic, electric and gas sensing
properties10-17.
Analysis of the determined structural parameters given in Table 1 shows that the inversion
parameter in our powder was 0.4 (denoting the occupancy of Fe3+ ions on tetrahedral sites)
indicating a mixed spinel structure where 40% Fe3+ ions are located on tetrahedral sites, i.e. 40% Zn2+
ions are located on octahedral sites. The determined lattice parameter for zinc-ferrite was also
relatively low (a = 8.42742 Å) and this according to literature data26 can be an indication of cation
inversion due to the differences in ionic radius between Zn2+ and Fe3+ ions. Thus, Pradeep et al11
obtained a lattice parameter of 8.429 Å for nanocrystalline zinc ferrite and the inversion degree of
0.35. Lemine et al.27 also explained reduction of the lattice parameter from 8.448 to 8.427 Å by
redistribution of Zn2+ and Fe3+ ions within interstitial states resulting in changes in magnetic
properties. Reduction of the lattice parameter can also be attributed to the presence of lattice
defects26. Yadav et al12 also associated variation in the lattice constant with distortion in the lattice
and redistribution of cations. However, it has been shown that XRD is not the best method to deal
with cation occupation26. The cation occupation in spinels has been determined by a variety of other
methods, such as X-ray photoelectron spectroscopy, Raman spectroscopy, neutron diffraction and
others 1.
Rietveld refinement of the XRD of the thick film powder peeled off the substrate (Figure 2)
showed that the structure remained the same including the phase composition and amounts and
also inversion parameter. No new phase was noted.
FESEM and TEM images of the obtained zinc-ferrite powder are shown in Figure 3. The
powder grain size had an average grain size of around 200 nm.

Acc
epte
d A
rtic
le
This article is protected by copyright. All rights reserved.
Figure 4a shows the measured XPS spectra of zinc-ferrite powder. This technique is most
often used to study structural inversion in ZnFe2O428. Deconvolution of the Zn 2p3/2 peak was
performed in the Zn2p spectra as shown in Figure 4b. The peak at 1021.2 eV can be attributed to
Zn2+ occupying tetrahedral sites in zinc ferrite. The smaller peak at 1022.3 eV is close to literature
values for BE Zn 2p3/2 in the cases when Zn2+ occupies octahedral sites29,30. Sutka et al27 estimated
the inversion degree using the intensity ratios of the main Zn2p3/2 peak and shoulder. In our case,
due to the presence of unreacted ZnO in the powder (even though this amount is small), according
to Bera et al30, the Zn2p3/2 peak shape is due to the presence of three types of Zn2+: Zn2+ on
tetrahedral sites (normal spinel), Zn2+ in the oxide and Zn2+ in octahedral sites so estimation of the
inversion degree was not possible. However, XPS results confirm the results of XRD analysis that the
obtained zinc-ferrite powder has a mixed spinel structure.
The asymmetrical complex peak of the O1s spectrum (Figure 4c) can be decomposed into
three peaks. The peak obtained at 529.7 eV after deconvolution corresponds to lattice oxygen and
is characteristic of oxygen inside the (Fe/Zn)-O framework. The peaks obtained at 530.8 eV and
532 eV can be attributed to the existence of adsorbed oxygen on the sample surface. This marks
active surface oxygen species, including surface oxygen of adsorbed oxygen species, weakly bonded
oxygen and hydroxyl-like groups31-33.
Fe2p spectra have two peaks (Figure 4d) that can be attributed to the existence of Fe2p3/2
and Fe2p1/2. Satellite peaks are also noted at 719.8 eV and 733 eV. The positions of the two peaks
and their satellites at BE higher for 8eV indicate the Fe3+ oxidation state in the analyzed powder34.
Raman spectra of the synthesized ZnFe2O4 powder for two powers of 0.4 and 1W at the
sample are shown in Figure 5. In the measured spectra of ZnFe2O4 powder four first order modes are
clearly noticeable for both applied laser intensities. Zinc ferrite with a spinel structure (space group
Fd3m) has five active Raman modes (A1g+Eg+3F2g), but the first two modes (at lower frequencies) are
often not clearly noticeable for nanoparticle zinc ferrite35-37.

Acc
epte
d A
rtic
le
This article is protected by copyright. All rights reserved.
The width and shape (asymmetry) of the first order Raman peaks show participation of the
inverse spinel structure (space group P4322) besides the dominant spinel structure. This is further
confirmation of the existence of a mixed spinel structure, with Zn2+ and Fe3+ cations occupying both
tetrahedral and octahedral sites, as was noted by XRD and XPS analysis. For simplicity, modes in
Figure 5 for zinc-ferrite were assigned in accordance with the spinel structure. In nanocrystal
samples the origin of Raman peak asymmetry can be the confinement effect. The most expressed
zinc-ferrite mode (A1g) corresponds to symmetrical stretching vibrations of oxygen atoms along Fe-O
(at higher frequencies as part of the complex asymmetric peak) and Zn-O bonds (at lower
frequencies as part of the complex asymmetric peak) in tetrahedral coordination MO4, where M=Fe,
Zn31. Though some authors state that modes below 600 cm-1 generally originate from vibrations of
the octahedral group in the mixed spinel structure 35, 38, other literature data indicates F2g(2) and
F2g(3) modes. The Eg mode corresponds to symmetrical bending vibrations of oxygen in relation to
cations in a tetrahedral surrounding, while the F2g(1) mode corresponds to translational vibrations of
the whole tetrahedra 9.
The two strongest modes of remaining hematite can be noted weakly in zinc-ferrite spectra
confirming XRD analysis. The presence of the E2 (high) mode of remaining zinc-oxide is not so
obvious as it is overlapped with the F2g(3) mode of ZnFe2O4, but the presence of ZnO was previously
confirmed by XRD analysis. The wide peak at 1290-1300 cm-1 can partly originate from remaining
hematite, but also from multiphonon processes relating to zinc-ferrite (2A1g mode). The peak at
1050-1060 cm-1 corresponding to the 2F2g(3) mode can also be attributed to multiphonon processes
in zinc-ferrite39. The wide peak in the 1100-1130 cm-1 region increases with increase in laser
strength. This peak can be attributed to zinc-ferrite37.
The results of Hg porosimetry measurements are shown on Fig 6 as well as in Table II.
The bulk density obtained from the first run indicate the existence of loose powder organization that
is more pronounced in the tf-ZnFe2O4 sample (ρbl f-ZnFe2O4 < ρbl ZnFe2O4).

Acc
epte
d A
rtic
le
This article is protected by copyright. All rights reserved.
The difference in total cumulative volume (ΔVtot) between the two runs is an obvious feature of
measurements for both materials. This is not surprising taking into account that both materials
transferred to the sample holder for porosimetry measurements are powders. Therefore, in first
runs the applied pressure forced mercury to compact powders beside intrusion in pore system40,41.
The somewhat higher specific surface area of the tf-ZnFe2O4 sample compared to ZnFe2O4,
for any pair of cyclic measurement, indicates that a deagglomeration and rearrangement process of
fine particles occurs during the thick film paste preparation procedure.
Despite different values of Vtot obtained for the initial runs, ΔVtot for both materials is almost
equal (≈0.16 cm3/g). During the first run mercury penetrates pores and after relaxation of pressure
mercury withdraws enabling determination of the total volume of pores, while the second run
enables determination of the volume of intra-agglomerate pores42. Inter-agglomerate pores are
eliminated during the first penetration, but intra-agglomerate pores remain. If we compare the
porosity values obtained for ZnFe2O4 initial powder and tf-ZnFe2O4 the amount of intruded Hg
corresponding to intra-particle porosity during R-2 (true pore system of materials intact during R-1)
for tf-ZnFe2O4 is higher than for initial ZnFe2O4. Taking into account that Vtot-R2 of tf-ZnFe2O4 is
significantly higher than the corresponding value obtained for ZnFe2O4 it can be concluded that the
applied procedure of thick film paste prevented particle aggregation resulting in an increase in
porosity. This is consistent with the finding of Ito et al22 about the beneficial influence of acetic acid
acting as a dispersant in the process of fabrication of TiO2 screen-printing pastes.
The values obtained for the pore size distribution from two successive measurements of
both ZnFe2O4 materials to some extent reveals the particle arrangement and organization in the
analyzed ferrite materials, as well as the effect of the thick film preparation process on the
characteristics of tf-ZnFe2O4.

Acc
epte
d A
rtic
le
This article is protected by copyright. All rights reserved.
The PSD curve of Run 1 of the ZnFe2O4 powder sample obtained by solid state synthesis has
two broad regions with peaks around 2.6 μm and 120 nm (Fig. 6-left). Absence of a region with a
maximum of 2.6 μm on the PSD curve of Run 2 indicates that its origin on the PSD curve of Run 1 is
in association with very loose particles present in ZnFe2O4 powder, which cannot be maintained
during Hg intrusion in the first run. On the other hand, the almost identical distribution for both
measurement cycles in the region below 500 nm, (maxima around 120 nm) are proof the existence
of a permanent, rigid pore system maintained for all applied pressure.
The PSD curves of tf-ZnFe2O4 (Figure 6-right) also have a bimodal distribution, but both
regions are moved to slightly lower values of diameters with peaks at about 0.5 μm and 90 nm.
Comparison of curves for R1 measurements of both materials shows that there is a certain
redistribution of the pore system in tf-ZnFe2O4 in relation to ZnFe2O4 powder. However, the shape of
the Run 2 curve of tf-ZnFe2O4 is preserved in comparison with the Run 1 curve, which is certainly
the consequence of the applied thick film preparation. Overall, although there is a certain decrease
in porosity values of the tf-ZnFe2O4 sample for R2 measuring, its value is still high (almost 60%).
3.2 Humidity sensing analysis and mechanism
The measured impedance of ZnFe2O4 thick film samples decreased with increase in frequency at
both operating temperatures (25 and 50oC). Smaller electrode spacing (0.2 mm) of the test
electrodes gave better results in view of the change of impedance with humidity. The change of
impedance with frequency in the relative humidity (RH) range 30-90% for test electrodes with 0.2
mm spacing is shown in Figure 7. As the relative humidity increased the impedance also decreased,
that was more expressed for higher relative humidity, as shown in Figure 8. Thus, at 42 Hz the
measured impedance decreased 46 times from 38.7 MΩ at relative humidity (RH) of 30% to 0.83
Acc
epte
d A
rtic
le
This article is protected by copyright. All rights reserved.
MΩ at RH of 90% measured at 25oC, and at 50oC from 35.9 MΩ at RH of 30% to 0.77 MΩ at RH of
90%.
The sensor response (sensitivity - S) can be defined as the change in resistance of the material on
exposure to gas. It can be represented in different forms as: S = Ra/Rg; S = Rg/Ra; S = R/Rg or
S=R/Ra, where R=|Ra-Rg|, Ra is the sensor resistance in ambient air and Rg is the sensor resistance
in the target gas43. We determined the sensitivity as:
[1]
where |Z|LH is the impedance measured at the lowest analyzed humidity and |Z|H is the impedance
measured for different humidity values in the chamber. The calculated sensitivity using eq. [1] for
ZnFe2O4 thick film samples at 25 and 50oC measured in the relative humidity range 30-90% is shown
in Figure 8. With increase in humidity the sensitivity increases and this change is similar at both
room temperature (25oC) and the analyzed slightly elevated temperature of 50oC.
In the case of humidity sensing4, 5 at low humidity water molecules are chemisorbed onto
available active oxygen sites forming a monolayer of OH groups1. With increase in humidity water
molecules are physisorbed on the chemisorbed layer. Adsorbed water molecules are hydrogen-
bonded to two hydroxyl groups, making H3O+ the dominant surface charge carrier5. Further increase
in humidity levels leads to multi physisorbed layers and formation of a liquid-like multilayer film of
hydrogen-bonded water molecules. In this case low energy is required for hopping between
adjacent water molecules, resulting in an increase in ionic conductivity that can be explained by the
Grotthuss charge mechanism44: H2O + H3O+ → H3O+ + H2O. Electrical charge transport occurs through
a chemical chain reaction process2 with H3O+ releasing a proton to a nearby H2O molecule that is
ionized and forms another H3O+ resulting in hopping of protons from one water molecule to another.
Electrolytic conductivity becomes dominant at high humidity levels1.

Acc
epte
d A
rtic
le
This article is protected by copyright. All rights reserved.
In our case we obtained nanocrystalline ZnFe2O4 with a mixed spinel structure confirmed by
XRD, XPS and Raman measurements. The ferrimagnetic order in mixed spinel zinc-ferrite due to
changes in cation positioning showed besides room temperature magnetic behavior, improved gas
sensing properties compared to normal spinel zinc-ferrite1,28. This can be applied to humidity
sensing. Our powder also contained small amounts of unreacted ZnO and -Fe2O3 as impurities and
their presence also had an influence on change of impedance and sensitivity to humidity. Hematite is
a transition metal oxide with multivalent cations that are very sensitive and can be oxidized and
reduced by a change in oxidation state1. The presence of hematite could improve humidity sensing
properties. ZnO is a d10 oxide (Zn has a filled d10 shell) with localized donor levels in the bandgap
caused by oxygen vacancies and interstitial Zn atoms in the lattice44. This type of oxide can be
reduced by altering the d10 cation electron configuration, where cations can act as donors, acceptors
or interstitials1. Free charge carriers can be created when oxygen vacancies are formed. ZnO is a low
cost, stable and promising gas sensing material, but with drawbacks such as poor sensitivity and
selectivity1, 20. Improved gas sensing properties have been achieved for ZnFe2O4/ZnO
heterojunctions20,21, so the presence of ZnO in our powder could also contribute to improving
humidity sensing properties by increasing the number of oxygen vacancies that are active sites for
dissociation of the water molecule45. Obviously, the individual influence of hematite and zinc-oxide
needs to be investigated in detail, taking into account the separate influence of each material and
will be the subject of further research.
The response and sensitivity of humidity sensors is most often related to the morphology
and has focused on the specific surface area, grain size and porosity1. Water physisorption in spinel
ferrites can be further enhanced by the obtained porous structure, where pores of different sizes,
shape and connectivity can enhance water physisorption. As shown in SEM images of zinc ferrite
thick film samples in Figure 1 and Figure 9, the analyzed ZnFe2O4 thick film samples had a porous
structure consisting of agglomerated small nanocrystalline grains of ZnFe2O4 forming a porous
network of aggregated nanoparticles.

Acc
epte
d A
rtic
le
This article is protected by copyright. All rights reserved.
Analysis of Hg porosimetry measurements of the starting ZnFe2O4 powder and ZnFe2O4
powder obtained by peeling the thick film off the sensor substrate showed that there was a slight
increase in porosity in the thick film compared to the starting powder and even though there was a
slight decrease in porosity after two runs (1-2) the porosity values at about 60% remained relatively
high.The microstructure and porosity can further be improved by optimizing the powder synthesis
process, thick film composition and sintering temperature and this will be the subject of further
work.
3.3 Complex impedance analysis
Complex impedance plots obtained for ZnFe2O4 thick film samples are shown in Figure 9. With
increase in relative humidity the impedance decreased, starting with part of a depressed
semicircular arc at lower humidity, ending with a depressed semicircle at high humidity values.
Similar values were obtained for both analyzed operating temperatures, 25 (Figure 10a) and 50oC
(Figure 10b). Impedance data was analyzed with the EIS Spectrum Analyzer Software 46 using an
equivalent circuit consisting of a parallel resistance and constant phase element (CPE)
representing the dominant grain boundary influence. The CPE element was used to replace a
capacitor in order to compensate for the depressed semicircle as described in detail in47. Good
agreement between measured and analyzed spectra was obtained as shown in the example
presented on insets in Figure 10, with an average error of about 2%.
The determined grain boundary resistance was high for low RH and decreased rapidly with
the increase in RH as shown in Figure 11 left (starting with RH of 50% as for lower RH the
determined grain boundary resistance was above 1G and could not be precisely determined using
the applied EIS Spectrum Analyzer Software). The determined grain boundary relaxation frequency
increased with increase in RH (Figure 11 right). The determined grain boundary capacitance

Acc
epte
d A
rtic
le
This article is protected by copyright. All rights reserved.
maintained a relatively similar value with change in RH and was in the range 101-115 pF for both
analyzed operating temperatures (25 and 50oC).
4. CONCLUSION
In this work we have analyzed the change of impedance of ZnFe2O4 thick films in a humidity
chamber in the relative humidity range 30-90% at two operating temperatures – room temperature
(25oC) and a slightly increased temperature of 50oC. The measured impedance decreased with
increase in humidity and also frequency showing the most noticeable change of 46 times at 42 Hz,
indicating that there is potential for application as humidity sensors. ZnFe2O4 powder with small
amounts of residual unreacted zinc-oxide and hematite was obtained by solid state synthesis. The
nanocrystalline mixed spinel structure of the obtained powder was confirmed using XRD, XPS,
Raman spectroscopy, FESEM and TEM analysis. Thick films with a porous nanocrystalline structure
(confirmed by SEM and Hg porosimetry analysis) were obtained by screen printing thick film paste
on alumina substrates with test interdigitated PdAg electrodes. The measured complex impedance
was analyzed using an equivalent circuit confirming the dominant influence of grain boundaries.
ACKNOWLEDGEMENTS
The authors would like to express their gratitude to Dr. M. Mitrić for XRD measurements and
Dr. Obrad Aleksic for useful discussions. This work was performed as part of projects III45007 and
III45014 financed by the Ministry for Education, Science and Technological Development of the
Republic of Serbia.

Acc
epte
d A
rtic
le
This article is protected by copyright. All rights reserved.
REFERENCES
1. Sutka A. Gross K. A. Spinel ferrite semiconductor gas sensors. Sensors Actuators B 2016;
222:95-105.
2. Xu X. Xiao L. Haugen N. O. Wu Z. Jia Y. Zhong W. Zou J. High humidity response property of
sol-gel synthesized ZnFe2O4 films. Materials Letters 2016; 213:266-268.
3. Lipare A. Y. Vasambekar P. N. Vaingankar A. S. Dielectric behavior and a.c. resistivity study of
humidity sensing ferrites. Mat. Chem. Phys. 2003; 81:108-115.
4. Patil S. N. Pawar A. M. Tilekar S. K. Ladgaonkar B. P. Investigation of magnesium substituted
nano particle zinc ferrites for relative humidity sensors. Sens Actuators A 2016; 244:35-43.
5. Shrivastava R. Yadav B. C. Nanostructured ZnFe2O4 thick film as room temperature liquefied
petroleum gas sensor. Journal of Experimental Nanoscience 2015; 10:703-717.
6. Kamble R. B. Mathe V. L. Nanocrystalline nickel ferrite thick film as an efficient gas sensor at
room temperature. Sensors Actuators B 2008; 131:205-209.
7. Virlan C. Tudorache F. Pui A. Increased sensibility of mixed ferrite humidity sensors by
subsequent heat treatment. Int J Appl Ceram Technol 2017; 14:1174-1182.
8. Tudorache F. Investigations on microstructure, electrical and magnetic properties of copper
spinel ferrite with WO3 addition for applications in the humidity sensors. Superlattices and
Microstructures 2018; 116:131-140
9. Lazarevic Z. Z. Jovalekic C. Milutinovic A. Sekulic D. Recnik A. Cekic B. Romcevic N. Z.
Nanodimensional spinel NiFe2O4 and ZnFe2O4 ferrites prepared by soft mechanochemical
synthesis. J Appl Phys 2013; 113:187221.
10. Qin M. Shuai Q. Wu G. Zheng B. Wang Z. Wu H. Zinc ferrite composite material with
controllable morphology and its applications. Mat Sci Eng B 2017; 224:125-138.
11. Pradeep A. Priyadharsini P. Chandrasekaran G. Structural, magnetic and electrical properties
of nanocrystalline zinc ferrite. J Alloys Compd 2011; 509:3917-3923.

Acc
epte
d A
rtic
le
This article is protected by copyright. All rights reserved.
12. Yadav R. S. Kuritka I. Vilcakova J. Urbinek P. Machovsky M. Masar M. Holek M. Structural,
magnetic, optical, dielectric, electrical and modulus spectroscopic characteristics of ZnFe2O4
spinel ferrite nanoparticles synthesized via honey-mediated sol-gel combustion method. J
Phys Chem Solids 2017; 110:87-99.
13. Sharma R. K. Ghose R. Synthesis and characterization of nanocrystalline zinc ferrite spinel
powders by homogenous precipitation method. Ceram Int 2015; 41:14684-14691.
14. Dhiman M. Sharma R. Kumar V. Singhal S. Morphology controlled hydrothermal synthesis
and photocatalytic properties of ZnFe2O4 nanostructures. Ceram Int 2016; 42:12594-12605.
15. Yadav R. S. Havlica J. Masilko J. Tkacz J. Kuritka I. Vilcakova J. Anneal-tuned structural,
dielectric and electrical properties of ZnFe2O4 nanoparticles synthesized by starch-assisted
sol-gel auto-combustion method. J Mater Sci:Mater Electron 2016; 27:5992-6002.
16. Liu T. Liu J. Liu Q. Rumin L. Zhang H. Jing X. Shape-controlled fabrication and enhanced gas
sensing properties of uniform sphere-like ZnFe2O4 hierarchical architectures. Sensors
Actuators B 2017; 250:111-120.
17. Li L. Tan J. Dun M. Huang X. Porous ZnFe2O4 nanorods with net-worked nanostructure for
highly sensor response and fast response acetone gas sensor. Sensors Actuators B 2017;
248:85-91.
18. Liu Q. Cao F. Wu F. Tian W. Li L. Interface reacted ZnFe2O4 on -Fe2O3 nanoarrays for largely
improved photoelectrochemical activity. RSC Advances 2015; 5:79440-79446.
19. Wang S. Gao X. Yang J. Zhu Z. Zhang H. Wang Y. Synthesis and gas sensor application of
ZnFe2O4-ZnO composite hollow microspheres, RSC Advances 2014; 4:57967-57974
20. Li W. Wu X. Chen J. Gong Y. Han N. Chen Y. Abnormal n-p-n type conductivity transition of
hollow ZnO/ZnFe2O4 nanostructures during gas sensing process The role of ZnO-ZnFe2O4
hetero-interface. Sens. Actuators B 2017; 253:144-155.

Acc
epte
d A
rtic
le
This article is protected by copyright. All rights reserved.
21. Wang S. Zhang J. Yang J. Gao X. Zhang H. Wang Y. Zhu Z. Spinel ZnFe2O4 nanoparticle-
decorated rod-like ZnO nanoheterostructures for enhanced gas sensing performances. RSC
Advances 2015; 5:10048-10057.
22. Ito S. Chen P. Comte P. Nazeeruddin M. K. Liska P. Pechy P. Gratzel M. Fabrication of Screen-
Printing Pastes From TiO2 Powders for Dye-Sensitised Solar Cells. Progress Photovoltaics
2007; 15:603-612.
23. Nazeeruddin M. K. Péchy P. Renourd T. Zakeeruddin S.M. Humphry-Baker R. Compte P.
Engineering of efficient panchromatic sensitizers for nanocrystalline TiO2-based solar cells. J.
Am. Chem. Soc. 2001; 123:1613-1624.
24. Toby B. H. Von Dreele R. B. GSAS-II the genesis of a modern open-source all purpose
crystallography software package. J Appl Cryst 2013; 46:544-549.
25. Waerenborgh J. C. Figueredo M. O. Cabral J. M. P. Perreira L. C. J. Temperature and
composition dependence of the cation distribution in synthetic ZnFeyAl2-yO4 (0y1) spinels.
J Solid State Chem 1999; 111:300-309.
26. Shenoy S.D. Joy P.A. Anantharaman M.R. Effect of milling on the structural, magnetic and
dielectric properties of coprecipitated ultrafine zinc ferrite. J. Magn. Magn. Mater. 2009
269:217-226.
27. Lemine O.M. Bououdina M. Sajieddine M. Al-Saie A. M. Shafi M. Khatan A. Al-hilali M.
Heninin M. Synthesis, structural, magnetic and optical properties of nanocrystalline ZnFe2O4.
Physica B 2011; 406:1989-1994.
28. Sutka A. Parna R. Zamovskis M. Kisand V. Mezinkis G. Kleperis J. Maiorov M. Jakovlev D.
Effect of antisite defects on the magnetic properties of ZnFe2O4, Phys Status Solidi A 2013;
210:1892-1897.
29. Druska P. Steinike U. Surface structure of mechanically activated and of mechanosynthesized
zinc ferrite. J Solid State Chem 1999; 146:13-21.

Acc
epte
d A
rtic
le
This article is protected by copyright. All rights reserved.
30. Bera S. Prince A. A. M. Velmurugan S. Raghavan P. S. Gopalan R. G. Panneerselvam,
Narasimhan S. V. Formation of zinc ferrite by solid-state reaction and its characterization by
XRD and XPS. J Mater Sci 2001; 36:5379-5384.
31. Marco J. F. Gancedo J. R. Gracia M. M Gautier J. L. Rios E. Berry F. J. Characterization of the
nickel cobaltite NiCo2O4 prepared by several methods: an XRD, XANES, EXAFS and XPS study.
J Solid State Chem 2000; 153:74-81.
32. Tavares A. C. da Silva Pereira M. I. Mendon M. H. Nunes M. R. Costa F. M. Sa C. M. XPS and
voltammetric studies on Ni1-xCuxCo2O4 spinel oxide electrodes. J Electroanal Chem 1998;
449:91-100.
33. Fan Z. Guo H. Fang K. Sun Y. Efficient V2O5/TiO2 composite catalysys for dimethioxymethane
synthesis from methanol selective oxidation. RSC Adv 2015; 5:24795–24802.
34. Nappini S. Magnano E. Bondino F. Pis I. Barla A. Fantechi E. Pineider F. Sangregorio C. Vaccari
L. Venturelli L. Baglioni P. Surface charge and coating of CoFe2O4 nanoparticles: evidence of
preserved magnetic and electronic properties. J Phys Chem C 2015; 119:25529–25541.
35. Singh J. P. Srivastava R. C. Agrawal H. M. Kumar R. Micro-Raman investigation of nanosized
zinc-ferrite: effect of crystallite size and influence of irradiation. J Raman Spectroscopy 2011;
42:1510-1517.
36. Rivero M. del Campo A. Mayoral A. Mazario E. Sanchez-Marcos J. Munoz-Bonilla A. Synthesis
and structural characterization of ZnxFe3-xO4 ferrite nanoparticles obtained by an
electrochemical method. RSC Adv 2016; 6:40067-40076.
37. Peeters D. Taffa D. H. Kerrigan M. M. Ney A. Jöns N. Rogalla D. Cwik S. Becker H.W. Grafen
M. Ostendorf A. Winter C. H. Chakraborty S. Wark M. Devi A. Photoactive zinc-ferrites
fabricated via conventional CVD approach. ACS Sustainable Chem Eng 2017; 5:2917-2926.
38. Wang Z. Schiferl D. Zhao Y. O’Neill H. St. C. High pressure Raman spectroscopy of spinel-type
ferrite ZnFe2O4. J Phys Chem Solids 2003; 64:2517–2523.

Acc
epte
d A
rtic
le
This article is protected by copyright. All rights reserved.
39. Lazarević Z. Ž. Jovalekić Č. Ivanovski V. N. Rečnik A. Milutinović A. Cekić B. Romčević N. Ž.
Characterization of partially inverse spinel ZnFe2O4 with high saturation magnetization
synthesized via soft mechanochemically assisted route. J Phys Chem Solids 2014; 75:869–
877.
40. Lowell S. Shields J.E. Thomas M.A. Characterization of Porous Solids and Powders:
Surface Area, Pore Size and Density (Particle Technology Series), Matthias Thommes
Kluwer Academic Publishers, Dordrecht, 2004.
41. Finčur N. L. Krstić J. B. Šibul F. S. Šojić D. V. Despotović V. N. Banić N. D. Agbaba
J. R. Abramović B. F. Removal of alprazolam from aqueous solutions by
heterogeneous photocatalysis: Influencing factors, intermediates, and products.
Chemical Engineering Journal 2017; 3071105-1115.
42. Emeruwa E. Jarrige J Mexmain J. Bernardin M. Application of mercury porosimetry
to powder (UO2) analysis. J. Nuclear Mater 1991; 184:53-58
43. Mirzaei A. Hashemi B. Janghorban K. -Fe2O3 based nanomaterials as gas sensors. J Mater
Sci: Mater Electron 2016; 27:3109-3144.
44. Agmon N. The Grotthuss mechanism. Chem Phys Lett 1995; 244:456-462.
45. Erol A. Okur S. Comba B. Mermer O. Arikan M. C. Humidity sensing properties of ZnO
nanoparticles synthesized by sol-gel process. Sens. Actuators B. 2010; 145:174-180.
46. Bondarenko A. S. Ragoisha G. EIS Spectrum Analyzer, http://www.abc.chemistry.bsu.by
47. Nikolic M. V. Sekulic D. L. Vasiljevic Z. Z. Lukovic M. D. Pavlovic V. B. Aleksic O. S. Dielectric
properties, complex impedance and electrical conductivity of Fe2TiO5 nanopowder compacts
and bulk samples at elevated temperatures. J Mater Sci:Mater Electron 2017; 28 (2017)
4796-4806.

Acc
epte
d A
rtic
le
This article is protected by copyright. All rights reserved.
FIGURE CAPTIONS
FIGURE 1 Fabricated ZnFe2O4 thick film test sample on alumina substrate with interdigitated
electrodes (electrode spacing 0.25mm) and SEM images of thick film sample surface
FIGURE 2 XRD pattern of zinc-ferrite powder; refined patterns of zinc ferrite powder and thick film
using GSAS-II
FIGURE 3 FESEM and TEM images of obtained zinc-ferrite powder
FIGURE 4 XPS spectra of ZnFe2O4 powder (a), deconvoluted Zn2p (b), O1s (c) and Fe (d) spectra
FIGURE 5 Raman spectra of ZnFe2O4 powder using 0.4and 1W He-Ne laser power
FIGURE 6 Hg porosimetry measurements of the ZnFe2O4 powder (left) and ZnFe2O4 thick film peeled
off the sensor substrate (right)
FIGURE 7 Change of impedance of ZnFe2O4 thick films with frequency at 25 and 50oC
(inset) measured for relative humidity 30-90%

Acc
epte
d A
rtic
le
This article is protected by copyright. All rights reserved.
FIGURE 8 Change of impedance (left) and sensitivity (right) of ZnFe2O4 thick films with RH, frequency
42 Hz, at 25 and 50oC
FIGURE 9 SEM image of thick film sample surface
FIGURE 10 Change of impedance with RH measured at 25 (a) and 50oC (b), Insets: example of a fitted
curve at RH 70 (a) and 80% (b), respectively
FIGURE 11 Change of grain boundary resistance (left) and grain boundary relaxation frequency
(right) with relative humidity

Acc
epte
d A
rtic
le
This article is protected by copyright. All rights reserved.
TABLE 1 Structural parameters for ZnFe2O4 powder obtained by Rietveld refinement of XRD pattern,
wR=4.685% (values in brackets represent the calculation error for one or two decimals)
ZnFe2O4 (89.0 wt.%)
, a = 8.42742(20) Å, Crystallite size: 46 nm, Microstrain: 8.6(4)∙103
Atom Site x y z Uiso Occupancy
Zn1 8a 0.125 0.125 0.125 0.0523 0.6
Fe1 8a 0.125 0.125 0.125 0.0523 0.4
Zn2 16d 0.500 0.500 0.500 0.0751 0.2
Fe2 16d 0.500 0.500 0.500 0.0751 0.8
O 32e 0.2596(5) 0.2596 0.2596 0.0508 1
O-Zn1,Fe1 distance 1.9642(26) Å
O-Zn2,Fe2 distance 2.02943(18) Å
ZnO (9.8 wt.%)
P63mc, a =b =3.2437(6), c=5.1995(11) Å, Crystallite size: 44 nm, Microstrain: 9.6(22) )∙103
Fe2O3 (1.2 wt.%)
, a = b = 5.0677(11); c = 13.6604(20) Å, Microstrain: 3.2(25) )∙103

Acc
epte
d A
rtic
le
This article is protected by copyright. All rights reserved.
TABLE II Parameters calculated from Hg porosimetry measurements
ZnFe2O4 tf-ZnFe2O4
Run1 Run2 Run1 Run2
Total cumulative volume, (cm3/g) 0.330 0.169 0.467 0.310
Specific surface area, (m²/g) 6.8 4.9 7.6 5.7
Bulk density, (g/cm3) 1.89 2.72 1.47 1.91
Apparent density, (g/cm3) 5.06 5.06 4.66 4.66
Porosity, (%) 62.6 46.1 68.5 59.1

Acc
epte
d A
rtic
le
This article is protected by copyright. All rights reserved.

Acc
epte
d A
rtic
le
This article is protected by copyright. All rights reserved.

Acc
epte
d A
rtic
le
This article is protected by copyright. All rights reserved.

Acc
epte
d A
rtic
le
This article is protected by copyright. All rights reserved.

Acc
epte
d A
rtic
le
This article is protected by copyright. All rights reserved.

Acc
epte
d A
rtic
le
This article is protected by copyright. All rights reserved.

Acc
epte
d A
rtic
le
This article is protected by copyright. All rights reserved.

Acc
epte
d A
rtic
le
This article is protected by copyright. All rights reserved.

Acc
epte
d A
rtic
le
This article is protected by copyright. All rights reserved.
Acc
epte
d A
rtic
le
This article is protected by copyright. All rights reserved.

Acc
epte
d A
rtic
le
This article is protected by copyright. All rights reserved.

Acc
epte
d A
rtic
le
This article is protected by copyright. All rights reserved.

Acc
epte
d A
rtic
le
This article is protected by copyright. All rights reserved.

Acc
epte
d A
rtic
le
This article is protected by copyright. All rights reserved.

Acc
epte
d A
rtic
le
This article is protected by copyright. All rights reserved.

Acc
epte
d A
rtic
le
This article is protected by copyright. All rights reserved.