dry-season water quality in the san gabriel river watershed
TRANSCRIPT

Bulletin of the Southern California Academy of Sciences
Volume 104 | Issue 3 Article 2
2005
Dry-season Water Quality in the San Gabriel RiverWatershedDrew Ackerman
Eric D. Stein
Kenneth Schiff
Follow this and additional works at: https://scholar.oxy.edu/scas
Part of the Fresh Water Studies Commons, and the Hydrology Commons
This Article is brought to you for free and open access by OxyScholar. It has been accepted for inclusion in Bulletin of the Southern California Academyof Sciences by an authorized editor of OxyScholar. For more information, please contact [email protected].
Recommended CitationAckerman, Drew; Stein, Eric D.; and Schiff, Kenneth (2005) "Dry-season Water Quality in the San Gabriel River Watershed," Bulletinof the Southern California Academy of Sciences: Vol. 104: Iss. 3.Available at: https://scholar.oxy.edu/scas/vol104/iss3/2
125
Bull. Southern California Acad. Sci.104(3), 2005, pp. 125–145� Southern California Academy of Sciences, 2005
Dry-season Water Quality in the San Gabriel River Watershed
Drew Ackerman, Eric D. Stein, and Kenneth Schiff
Southern California Coastal Water Research Project, 7171 Fenwick Lane,Westminster, California 92683
Abstract.—Dry-season flow in the San Gabriel River system is comprised mostlyof discharges from water reclamation plants (WRPs), imported water, and stormdrains. Although the magnitude of dry-season discharge is generally known, thewater quality associated with most of these ‘‘introduced’’ discharges has not beencharacterized, nor has the associated in-stream response, particularly near stormdrain discharges. The goal of this study was to characterize the pattern and mag-nitude of storm drain and WRP inputs to the San Gabriel River system and theassociated in-stream response. To accomplish this, two synoptic dry-weather sur-veys were conducted, one in 2002 and the other in 2003 during which flow,metals, bacteria, and nutrient concentrations were measured from the WRPs, stormdrains, and in-stream locations at a single point in time. For bacteria and mostmetals, storm drains accounted for the majority of mass emissions to the river. Incontrast, WRPs were the primary source for nutrients. In-stream water qualityconcentrations generally reflected the main sources. For example, in-stream am-monia concentrations were highest downstream of WRP discharges. In-streambacteria concentrations were consistently high and showed no apparent spatialpattern, suggesting that storm drains or other in-stream sources are presentthroughout the watershed.
Urbanization has had many consequences on the hydrology of southern Cali-fornia’s coastal watersheds (Hamilton 1992; Schuler and Holland 2000; Roesnerand Bledsoe 2003). Streams historically convey seasonal storm flows and are dryfor large portions of the year. Today, large engineered channels have replacedmost large streams and rivers to accommodate increases in storm water runoff.In addition, the historical intermittent hydroperiod has been replaced by year-round baseflow.
In the San Gabriel watershed, the large engineered channels that predominatein the lower watershed receive dry-weather flow from a variety of ‘‘introduced’’sources, such as water reclamation plant (WRP) discharges, other National Pol-lutant Discharge Elimination System (NPDES) discharges, storm drain dischargesof non-point source runoff from the developed landscape, and imported water thatis conveyed seasonally through the San Gabriel River and its tributaries to spread-ing grounds located throughout the watershed.
Dry-season sources of water may include a suite of urban-generated constitu-ents that have the potential to affect surface water quality adversely. For example,storm drains have been found to be the primary source of pollutants in the neigh-boring Los Angeles River watershed (Ackerman et al. 2003). Also, Bay et al.(1996) found that dry-weather runoff to the Santa Monica Bay contained toxiclevels of certain constituents. Previously, documented concentrations of nutrients,
1
Ackerman et al.: Dry-season Water Quality in the San Gabriel River Watershed
Published by OxyScholar, 2005
126 SOUTHERN CALIFORNIA ACADEMY OF SCIENCES
metals, and bacteria have resulted in large portions of the lower San Gabrielwatershed being listed as impaired under Section 303(d) of the Clean Water Act.
Managing dry-season water quality requires an understanding of the water qual-ity associated with the primary sources of dry-weather flow (i.e., storm drainsand WRP discharges), and the relationship between these sources and in-streamwater quality. Although hundreds of storm drains discharge to the 303(d) listedportions of the San Gabriel River and its tributaries, the spatial and temporalpatterns of these inputs relative to those of the WRPs have not been quantified.Furthermore, the relative mass contribution of pollutants from storm drains andWRP discharges has not been investigated, nor has the response of in-stream waterquality to these mass loadings.
The goal of this study is to characterize storm drain and WRP inputs to theSan Gabriel River system and the associated in-stream response. The relativecontribution of non-point source (i.e., storm drain) and point source (i.e., WRP)inputs were quantified for bacteria, metals, and nutrients. The observed concen-trations also were compared to existing water quality standards in order to providemanagers with information that can be used in developing strategies to addresswater quality impairments.
Methods
This study is comprised of two parts. The first part consists of identifying andsampling the major inputs to the San Gabriel River and its major tributaries. Thesecond part is comprised of sampling the in-stream water quality to assess spatialwater quality patterns and the relationship between sources and in-stream waterquality. Two synoptic surveys were conducted approximately one year apart dur-ing which approximately 85 storm drains and 16 in-river sites were sampled twiceover a 2-day period each year.
Watershed
The 1,866 km2 San Gabriel River (SGR) watershed (Figure 1) is highly urban-ized in its lower portions, and predominantly undeveloped in the upper watershed.The reaches that are listed as having impaired water quality and are the focus ofthis study are San Gabriel River, Coyote Creek (CC), San Jose Creek (SJC), andWalnut Creek (WC) (Table 1). Any storm drains, channels, or other dischargesto these reaches were considered inputs to the system.
Flow through the SGR system is highly managed by diversions and concreteand rubber dams that route water to various infiltration areas. As a result, dry-weather flows are highly variable both within and between years (LACDPW2004). For example, in Water Year (WY) 2002–03, the Los Angeles CountyDepartment of Public Works (LACDPW) imported 1.02 � 108 m3 of water(LACDPW 2004) and conveyed much of that water through the SJC and WCsystems to spreading grounds. In that same year, 7.01 � 106 m3 of water fromthe San Jose Creek and Pomona WRPs was sent to spreading grounds, while 1.40� 107 m3 was allowed to pass to the ocean (LACDPW 2004). The earthen bottomportions of the SGR are used for infiltration; therefore, although physically con-nected, the WC and SJC are often hydrologically discontinuous from the SGRduring dry-weather conditions (Figure 2).
2
Bulletin of the Southern California Academy of Sciences, Vol. 104 [2005], Iss. 3, Art. 2
https://scholar.oxy.edu/scas/vol104/iss3/2

127SAN GABRIEL RIVER WATER QUALITY
Fig. 1. Map of the San Gabriel River watershed. Shown are the impaired streams, storm drainlocations during the two surveys, in-stream sampling points, stream gages and water reclamation plantdischarge locations.
Input Sampling
Inputs to the SGR watershed were sampled on September 29, 2002 and Sep-tember 14, 2003. Point source inputs included four WRPs that discharge tertiarytreated wastewater. The Los Coyotes WRP discharges to the SGR, the Long BeachWRP discharges to the CC, and the Pomona WRP discharges to the SJC. TheSan Jose Creek WRP discharges to both the SJC and SGR. The WRP effluentwas collected as a 4-hour composite sample and analyzed for the parameters listedin Table 2.
Inputs that convey non-point source discharge were sampled synoptically dur-ing each of the two sampling events. Non-point source inputs were classified aseither ‘‘small storm drain’’ discharges or ‘‘large NPS’’ discharges. The latter con-sisted mainly of open channels that drain to the impaired reaches that are thefocus of this study (Table 3). Prior to each sampling event, storm drains and largeNPSs were surveyed to identify those that flow during the dry season. At eachflowing storm drain or large NPS, flow was measured using either timed-volu-metric or depth-velocity methods (as appropriate, given the conditions at the lo-cation). Water quality samples were collected directly by filling the sample bottleor using a sterilized scoop to collect the water sample. Samples were placed onice and transported to the laboratories for analysis of the parameters listed in
3
Ackerman et al.: Dry-season Water Quality in the San Gabriel River Watershed
Published by OxyScholar, 2005

128 SOUTHERN CALIFORNIA ACADEMY OF SCIENCES
Table 1. List of stream impairments and their lengths for the San Gabriel Watershed.
Length (km) Impairment
San Gabriel River 41 Algae, coliform, dissolved copper, lead,dissolved zinc, toxicity, abnormal fishhistology
Coyote Creek 21 Algae, coliform, dissolved copper, dis-solved lead, total selenium, dissolvedzinc, toxicity, abnormal fish histology
San Jose Creek 32 Algae, coliformWalnut Creek 19 Toxicity, pH
Fig. 2. In-stream flow variability for the 2002 sampling survey by stream.
4
Bulletin of the Southern California Academy of Sciences, Vol. 104 [2005], Iss. 3, Art. 2
https://scholar.oxy.edu/scas/vol104/iss3/2
129SAN GABRIEL RIVER WATER QUALITY
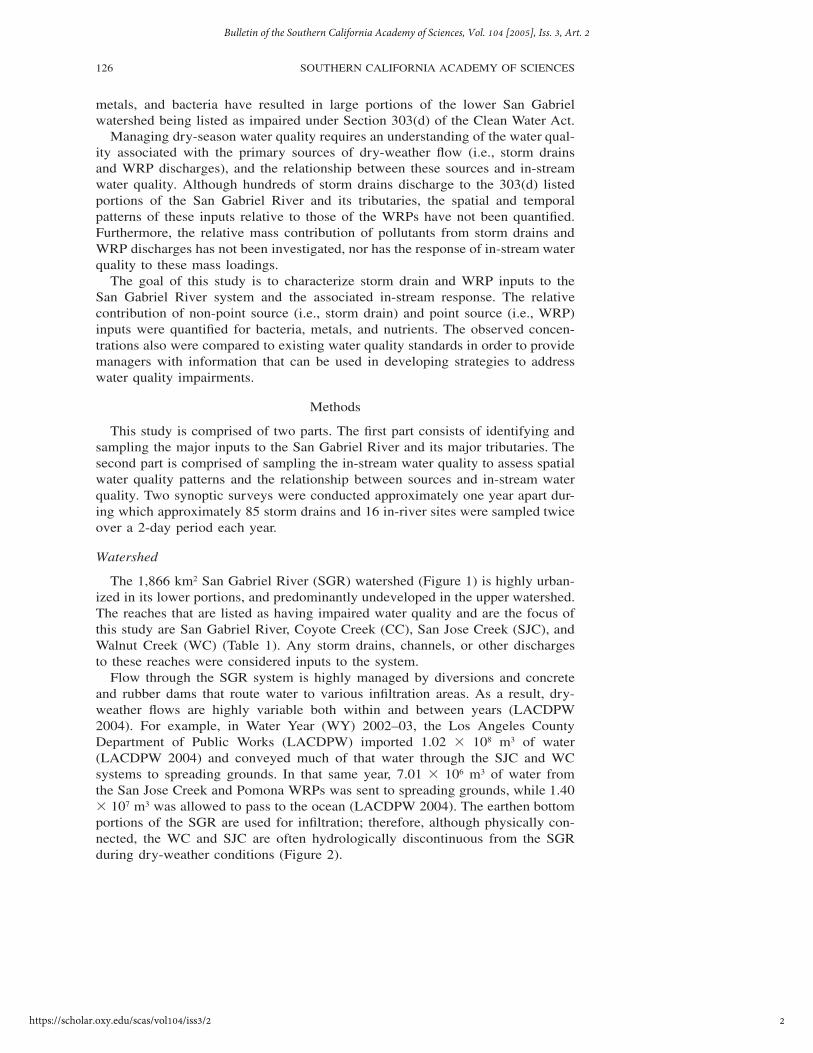
Table 2. Constituents sampled during each survey along with the analytical method used and thereporting limit.
Analytical Method Reporting Limit
Bacteria Enterococcus Quanti-Tray 10 MPN/100mLE Coli Quanti-Tray (2003) 10 MPN/100mLFecal Coliform Membrane Filtration (2002) 10 MPN/100mLTotal Coliform Quanti-Tray 10 MPN/100mL
Generals Hardness EPA 130.2 - titration 2 mg/LpH EPA 150.1 N/ATSS EPA 160.2 - GF/C filtration 2 mg/L
Metals Aluminum EPA 200.7 - ICP/AES 50 ug/LArsenic SM 3114 B4d - hydride generation 1 ug/LCadmium EPA 213.2 - Stabilized temperature
platform furnace0.4 ug/L
Chromium EPA 200.7 - ICP/AES 10 ug/LCopper EPA 200.7 - ICP/AES 8 ug/LIron EPA 200.7 - ICP/AES 50 ug/LLead EPA 239.2 - Stabilized temperature
platform furnace2 ug/L
Nickel EPA 200.7 - ICP/AES 20 ug/LSelenium SM 3114 B - hydride generation 1 ug/LZinc EPA 200.7 - ICP/AES 10 ug/L
Nutrients Ammonia SM 4500 NH3E - titrimetric distil-lation
100 ug/L
Nitrate-Nitrite EPA300.0/SM 4500NO2 B - ionchromotography
50 ug/L
TKN SM 4500 NorgB - organic N diges-tion � titrimetric distillation
100 ug/L
Dissolved Phosphorus EPA 365.3 - spectrophotometric 50 ug/LTotal Phosphorus EPA 365.3 - spectrophotometric 50 ug/L
Pesticides Diazinon ELISA 0.05 ug/L
Table 2. The analytical methods and reporting limits for each constituent are listedin Table 2.
In-stream Sampling
The day after the storm drain sampling (September 30, 2002 and September15, 2003), in-stream water quality samples were taken from each of the four studystreams. Samples were taken at the upstream boundary of each reach, at the mostdownstream point, and at points between to characterize water quality changes(14 locations in total) (Figure 1). Six additional sites were added in 2003 to betterresolve longitudinal in-stream water quality. Composite samples were collectedby taking three grab samples over a 10-min period. A second composite samplewas collected 20 min later, and a third composite was collected 40 min after theinitial composite. The three samples were analyzed separately to characterize theshort-term in-stream variability. Flow information was obtained from existingflow gages maintained by the Los Angeles County Department of Public Works.
Data Analysis
Flow and water quality data were analyzed for spatial and temporal patterns.Means and ranges of flow and concentration for all locations were analyzed by
5
Ackerman et al.: Dry-season Water Quality in the San Gabriel River Watershed
Published by OxyScholar, 2005
130 SOUTHERN CALIFORNIA ACADEMY OF SCIENCES
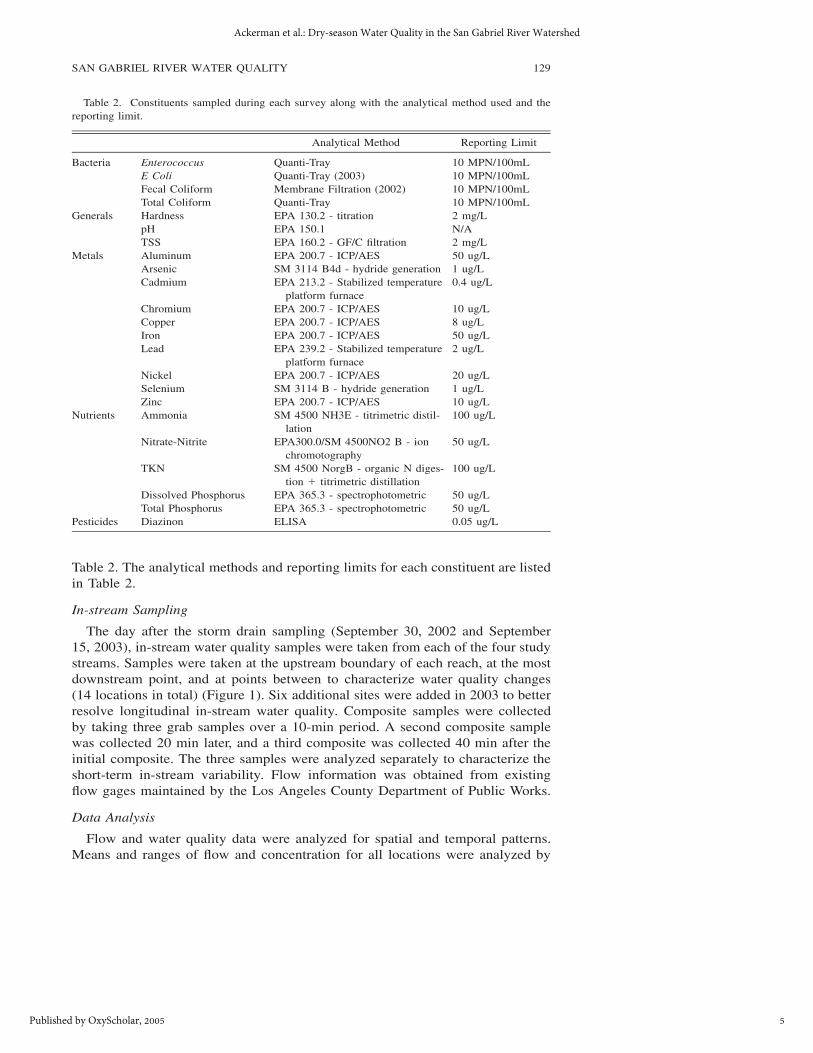
Table 3. Large non-point source (NPS) discharges to the impaired reaches of the San Gabriel RiverWatershed.
Receiving Water Reach Large NPS Discharge
Coyote Creek Carbon CreekBrea CreekFullerton CreekLa Mirada Wash
San Jose Creek Lemon CreekDiamond Bar WashPuente Creek
Walnut Creek Big Dalton Wash (includes San Dimas and Little Dalton Wash)
Table 4. Measured flows (106 L d�1) and number of samples by stream reach and source category.
2002
Coyote
Flow 106 Ld�1 N
San Gabriel
Flow 106 Ld�1 n
San Jose
Flow 106 Ld�1 N
Walnut
Flow 106 Ld�1 n
Total
Flow 106 Ld�1 n
Storm DrainsLarge NPSWRPsTOTAL
26.020.3
0.146.3
1541
20
7.5—
238.5246.0
1902
21
35.02.5
142.7180.1
3213
36
3.014.7—
17.7
910
10
71.437.4
381.2490.1
7566
87
2003
Coyote
Flow 106 Ld�1 n
San Gabriel
Flow 106 Ld�1 N
San Jose
Flow 106 Ld�1 N
Walnut
Flow 106 Ld�1 n
Total
Flow 106 Ld�1 n
Storm DrainsLarge NPSWRPsTOTAL
29.018.245.893.0
1641
21
3.9—
255.5259.4
1002
12
33.016.3
213.5259.4
3313
37
4.29.6—
13.8
1310
14
70.144.0
514.8629.0
7266
84
individual sampling date and compared between sampling dates. Constituent loadswere calculated by multiplying flow times concentration for each sample, as de-scribed in Schiff (1997):
Load � F C� i i
where Fi was the flow and Ci was the constituent concentration at location i.When multiple samples were averaged, results are presented as means � the 95%confidence interval. In all cases, nondetectable results were assigned a value ofzero.
Results
One hundred storm drains and eight large NPS discharges were sampled overthe two sampling periods. During the 2002 survey, 87 storm drains were sampledand the majority of those storm drains were in the SJC (Table 4). In 2003, 84storm drains were sampled, with 58 of those drains being the same as the onessampled in 2002. The same 6 large NPS discharges were sampled in both 2002and 2003.
6
Bulletin of the Southern California Academy of Sciences, Vol. 104 [2005], Iss. 3, Art. 2
https://scholar.oxy.edu/scas/vol104/iss3/2

131SAN GABRIEL RIVER WATER QUALITY
Fig. 3. Distribution of observed storm drain flows by sampled stream (A) and by survey for allflowing storm drains sampled in the SGR watershed (B).
Flow
Nearly 80% of measured flow in the SGR watershed was from the WRPs duringboth surveys (Table 4). The majority originated from the San Jose Creek WRP,and discharged either to the confluence of San Jose Creek and San Gabriel Riveror through a pipeline that discharged to the San Gabriel River 16 km downstreamof the confluence. Over 80% of the storm drains and large NPS discharges carriedflows less than 28 L s�1 (1 cfs) (Figure 3). Flows over 5 L s�1 comprised the top30% of the flowing drains and were comparable between the two surveys. Higherproportions of storm drains had small flows (i.e., below 5 L s�1) in 2002 ascompared to 2003. These differences at storm drains with very low flow may bedue to true interannual variability, but could also be an artifact of the inherent
7
Ackerman et al.: Dry-season Water Quality in the San Gabriel River Watershed
Published by OxyScholar, 2005

132 SOUTHERN CALIFORNIA ACADEMY OF SCIENCES
Tab
le5.
Mea
nof
obse
rved
conc
entr
atio
nsan
d95
thpe
rcen
tco
nfide
nce
inte
rval
byso
urce
.G
eom
etri
cm
eans
are
repo
rted
for
bact
eria
sam
ples
;ar
ithm
etic
mea
nsar
ere
port
edfo
ral
lot
her
cons
titu
ents
.N
onde
tect
able
sam
ples
wer
eas
sum
edto
beze
ro.
Not
eth
atin
2002
Fec
alC
olif
orm
sw
ere
mea
sure
d,w
here
asin
2003
E.
coli
was
mea
sure
d.
2002
Res
ults
MD
L
Sto
rmD
rain
s
Ave
rage
95%
C.I
.
Lar
geN
PS
Dis
char
ges
Ave
rage
95%
C.I
.
WR
Ps
Ave
rage
95%
C.I
.
Bac
teri
a
Ent
eroc
occu
sF
ecal
Col
ifor
ms
Tot
alC
olif
orm
s
MP
N/1
00m
LM
PN
/100
mL
MP
N/1
00m
L
10 10 10
17,6
001,
210
177,
000
15,3
001,
290
198.
000
29,4
002,
990
1,02
0,00
0
55,4
0020
,500
2,46
0,00
0
ND 0.
262.
13
— 0.72
4.89
Met
als
Har
dnes
sC
hrom
ium
Cop
per
Iron
Lea
dN
icke
lZ
inc
mg/
Lug
/Lug
/Lug
/Lug
/Lug
/Lug
/L
2 10 8 50 2 20 10
356 0.
1415
.057
2 2.60
7.39
134
39.1 0.28
7.36
281 1.
214.
7183
.1
368 1.
677.
001,
940 3.
00N
D28
.3
84.2 3.27
6.52
3,36
0 2.15
—-
22.3
199
ND
ND 44
.2N
DN
D 45.0
21.7
— — 30.4
— — 8.39
Nut
rien
ts
Am
mon
ia-N
Nit
rate
-Nit
rite
TK
NT
otal
Pho
spha
te-P
mg/
Lm
g/L
mg/
Lm
g/L
0.01
0.03
0.02
0.05
0.77
3.36
3.16
0.50
0.47
1.53
1.21
0.10
0.05
0.49
1.62
0.08
0.07
0.54
0.53
0.06
8.01
3.00
9.41
0.72
3.01
1.26
3.15
0.27
8
Bulletin of the Southern California Academy of Sciences, Vol. 104 [2005], Iss. 3, Art. 2
https://scholar.oxy.edu/scas/vol104/iss3/2
133SAN GABRIEL RIVER WATER QUALITY
Tab
le5.
Con
tinu
ed.
2003
Res
ults
MD
L
Sto
rmD
rain
s
Ave
rage
95%
C.I
.
Lar
geN
PS
Dis
char
ges
Ave
rage
95%
C.I
.
WR
Ps
Ave
rage
95%
C.I
.
Bac
teri
a
Ent
eroc
ocus
E.
coli
Tot
alC
olif
orm
s
MP
N/1
00m
lM
PN
/100
mL
MP
N/1
00m
L
10 10 10
650
10,4
0021
,800
658
9,07
021
,400
1,66
09,
080
29,9
00
363
4,50
011
,400
ND 0.
93N
D
— 5.09
—
Met
als
Har
dnes
sC
hrom
ium
Cop
per
Iron
Lea
dN
icke
lZ
inc
mg/
Lug
/Lug
/Lug
/Lug
/Lug
/Lug
/L
2 10 8 50 2 20 10
343
ND
8.00
394 1.
570.
6999
.3
4.09
—3.
3013
8 0.63
1.36
22.7
408
ND
3.00
453 1.
92N
D57
.1
80.2
—3.
1020
3 1.12
—-
13.3
190
ND
ND 36
.84
ND
ND 72
.4
18.9
— — 36.0
— — 7.08
Nut
rien
ts
Am
mon
ia-N
Nit
rate
-Nit
rite
TK
NT
otal
Pho
spha
te-P
mg/
Lm
g/L
mg/
Lm
g/L
0.01
0.03
0.02
0.05
0.33
2.87
1.86
0.45
0.34
1.53
0.59
0.11
0 1.96
1.67
0.10
—2.
550.
560.
05
1.40
3.00
2.62
0.43
0.35
0.73
0.46
0.16
Dia
zino
nng
/L50
122
77.6
83.9
38.7
No
data
avai
labl
e
9
Ackerman et al.: Dry-season Water Quality in the San Gabriel River Watershed
Published by OxyScholar, 2005

134 SOUTHERN CALIFORNIA ACADEMY OF SCIENCES
variability associated with measuring storm drain flows, which increases dramat-ically in drains with low discharge.
Water Quality
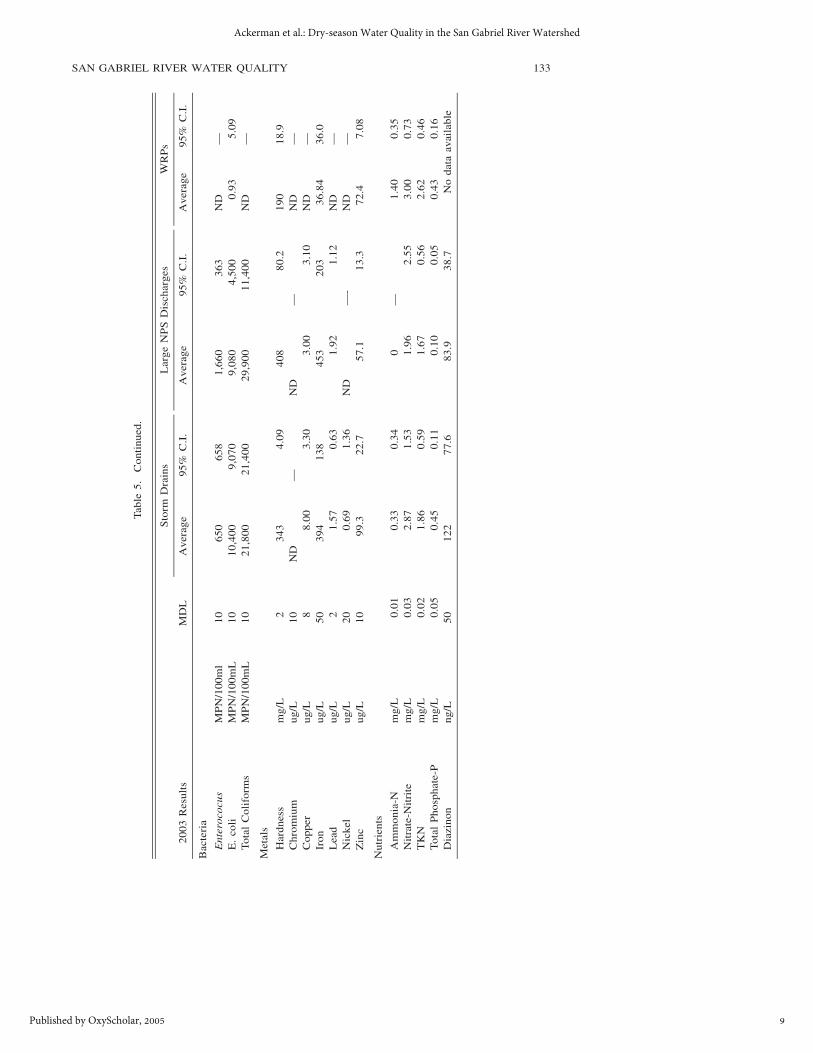
The mean concentration of water quality constituents varied by source (Table5). The WRPs had the highest nutrient concentrations (e.g. 3.0 mg/L of nitrate-nitrite vs. 0.03 mg/L for storm drains). Storm drains and large NPS dischargeshad the highest bacteria concentrations (e.g. 104–105 MPN/100 ml of total coli-forms vs. �101 MPN/100ml for WRPs). Metal concentrations were generallyhigher in the storm drain and large NPS discharges than from WRPs, but therewere some differences based on individual metals. In general, metals concentra-tions were lower in large NPS discharge tributaries than in small storm drains.
Concentrations and loads from WRP and non-point source inputs generallywere higher in 2002 than in 2003. For example, total coliform concentrationsfrom storm drains and large NPS discharges were between 10 and 30 times higherin 2002 than in 2003, while loads were between 9 and 50 times higher in 2002(Figure 4). Similarly, fecal coliform loads in 2002 were up to 40 times higherthan E. coli loads in 2003. Assuming fecal coliforms are comprised of approxi-mately 80% E. coli, the loads would still have been more than 30% higher in2002 than in 2003. Metals concentrations were also higher in 2002 (with theexception of zinc), but were typically within the same order of magnitude duringboth surveys. Overall, daily loads of copper were 2 times higher in 2002 than in2003; however, in 2002 small storm drains accounted for a substantially lowerproportion of copper relative to large NPS discharges than in 2003 (Figure 4).Bacteria and metals data were approximately the same for the WRPs between thetwo surveys. However, nutrient concentrations were generally 50% lower duringthe 2003 survey, due to operational changes at the WRPs.
Source Comparison to Standards
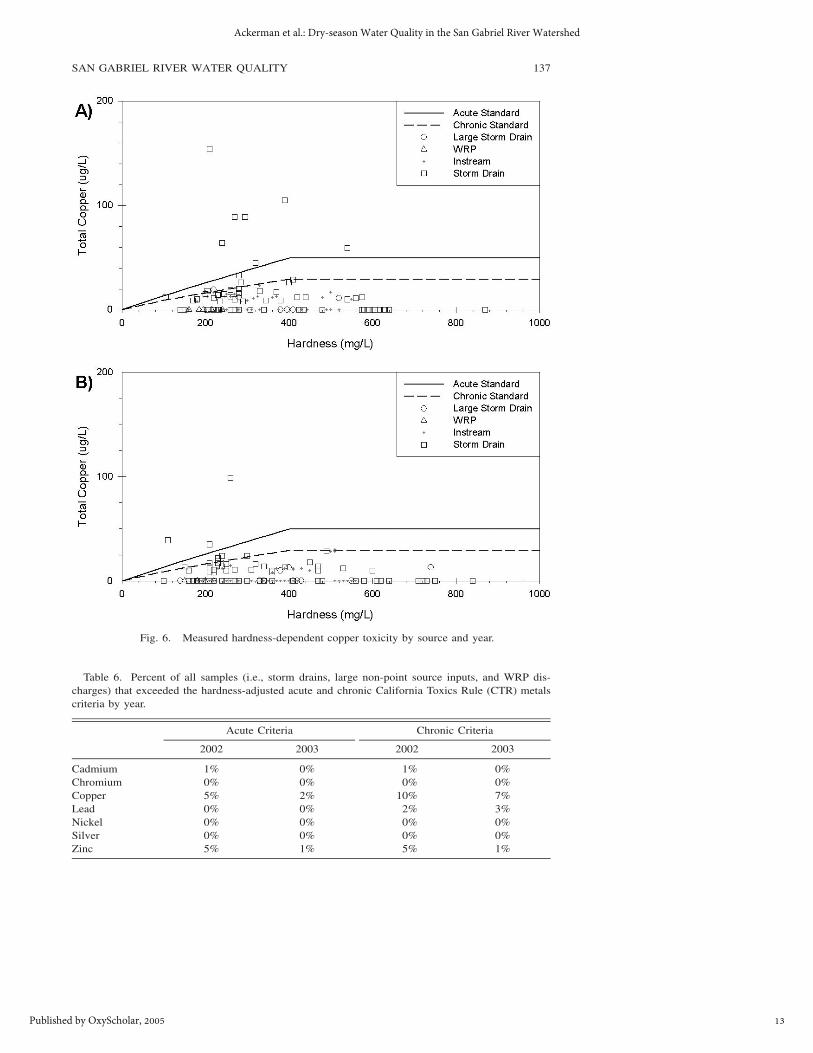
Water quality from the storm drains frequently exceeded water quality standardsfor bacteria. The bacteria levels observed in storm drain flows (Figure 5) exceededwater quality standards in 98% of the sampled drains. In contrast, in-river metalsconcentrations never exceeded the hardness-adjusted acute water quality standardsunder the California Toxics Rule (CTR; Figure 6). Although the CTR generallyapplies only to receiving waters and not to storm drain or NPS discharges, sucha comparison is instructive for identifying potentially problematic discharges. Ingeneral, storm drain and large NPS discharges were also below CTR standards,except for copper, which exceeded acute CTR standards in 4% to 8% of the stormdrain and large NPS inputs; and zinc, which exceeded chronic CTR standards in2% to 8% of the storm drain and large NPS inputs (Figures 5 and 6, Table 6).
Mass Emission
The major pollutant sources to the SGR watershed differed by constituent (Ta-ble 7). The WRPs contributed approximately 90% or more of the nutrient massloadings to the system. In contrast, almost all bacteria loading was contributedby storm drains and large NPS discharges. In 2002, the eight large NPS dischargesaccounted for over twice as much bacteria load to the system as the small stormdrains, despite having less flow. In contrast, in 2003, the bacteria load from large
10
Bulletin of the Southern California Academy of Sciences, Vol. 104 [2005], Iss. 3, Art. 2
https://scholar.oxy.edu/scas/vol104/iss3/2

135SAN GABRIEL RIVER WATER QUALITY
Fig. 4. Comparison of daily loads between 2002 and 2003 for bacteria (top) and metals (bottom).Values are in magnitude difference. Bars below the line indicate higher loads in 2002; bars above theline indicate higher loads in 2003.
11
Ackerman et al.: Dry-season Water Quality in the San Gabriel River Watershed
Published by OxyScholar, 2005

136 SOUTHERN CALIFORNIA ACADEMY OF SCIENCES
Fig. 5. Distribution of observed storm drain water quality concentrations by year.
NPS discharges was lower than that from small storm drains. The relative massemission of trace metals varied by source and by metal. In 2002, the large NPSdischarges accounted for twice as much copper, iron, and lead relative to the smallstorm drains; in 2003, copper and iron emissions were higher in small storm drainsthan in the large NPS discharges. In both years, loadings of copper, lead, andnickel from the WRPs was minimal; however, the WRPs contributed the majorityof zinc loading and between 12% and 51% of lead loading.
Coyote Creek and the San Gabriel/San Jose Creek confluence area received thegreatest mass loadings of pollutants of the four streams (Table 8). The largebacteria loading to Coyote Creek reflected the large storm drain volumetric inputs(Table 4). Large nutrient loadings in the SJC corresponded to large volumetricdischarges from the San Jose WRP (214 � 106 L d�1 in 2002). Walnut Creekreceived no WRP input and had volumetric loadings less than half of the CC andSJC. Despite its low flow relative to other portions of the system, bacteria loadings
12
Bulletin of the Southern California Academy of Sciences, Vol. 104 [2005], Iss. 3, Art. 2
https://scholar.oxy.edu/scas/vol104/iss3/2
137SAN GABRIEL RIVER WATER QUALITY
Fig. 6. Measured hardness-dependent copper toxicity by source and year.
Table 6. Percent of all samples (i.e., storm drains, large non-point source inputs, and WRP dis-charges) that exceeded the hardness-adjusted acute and chronic California Toxics Rule (CTR) metalscriteria by year.
Acute Criteria
2002 2003
Chronic Criteria
2002 2003
CadmiumChromiumCopperLeadNickelSilverZinc
1%0%5%0%0%0%5%
0%0%2%0%0%0%1%
1%0%
10%2%0%0%5%
0%0%7%3%0%0%1%
13
Ackerman et al.: Dry-season Water Quality in the San Gabriel River Watershed
Published by OxyScholar, 2005

138 SOUTHERN CALIFORNIA ACADEMY OF SCIENCES
Table 7. Total mass emission by source for the two dry-weather sampling events. Samples withnon-detectable values are treated as zero.
ConsituentTotal MassEmissions Units
Percent Contribution
StormDrains
Large NPSDischarges WRPs
2002
Bacteria
Fecal ColiformsEnterococcusTotal Coliforms
1,800948
48,300
(109) hr�1
(109) hr�1
(109) hr�1
34%35%28%
66%65%72%
0%0%0%
Metals
CopperIronLeadNickelZinc
0.02857.940.00830.00230.79
kg hr�1
kg hr�1
kg hr�1
kg hr�1
kg hr�1
38%30%29%
100%14%
62%58%71%
0%8%
0%12%
0%0%
78%
Nutrients
Ammonia-NNitrate-NitriteTKNTotal Phosphorous
87.669.1
1137.67
kg hr�1
kg hr�1
kg hr�1
kg hr�1
1%5%3%8%
0%1%2%1%
99%94%95%90%
2003
Bacteria
E. coliEnterococcusTotal Coliforms
8001,1102,090
(109) hr�1
(109) hr�1
(109) hr�1
91%58%68%
9%42%32%
0%0%0%
Metals
CopperIronLeadNickelZinc
0.0142.810.00600.00031.74
kg hr�1
kg hr�1
kg hr�1
kg hr�1
kg hr�1
100%33%25%
100%11%
0%16%75%
0%7%
0%51%
0%0%
82%
Nutrients
Ammonia-NNitrate-NitriteTKNTotal Phosphorous
26.666.657.9
7.19
kg hr�1
kg hr�1
kg hr�1
kg hr�1
1%8%7%6%
0%2%3%4%
99%90%89%89%
from Walnut Creek in 2003 nearly equaled those in the CC and SJC. High load-ings in WC are attributed mainly to high in-stream concentrations, which are morethan 200% higher than those of the other streams.
In-stream Concentrations
The spatial distribution of pollutants throughout the four reaches in the SGRwatershed reflects the influence of major mass emission sources (Figures 7–9). Fornutrients, in-stream ammonia levels in the SJC and the SGR were markedly higherdownstream of the Pomona, San Jose Creek, and Los Coyotes WRPs (Figure 7).Where storm drains were the only inputs; i.e., upper Coyote Creek and Walnut
14
Bulletin of the Southern California Academy of Sciences, Vol. 104 [2005], Iss. 3, Art. 2
https://scholar.oxy.edu/scas/vol104/iss3/2

139SAN GABRIEL RIVER WATER QUALITY
Table 8. Total mass emission by creek for the two dry-weather sampling events.
ConsituentTotal MassEmissions Units
Percent Contribution
CoyoteCreek
San GabrielRiver
San JoseCreek
WalnutCreek
2002
Bacteria
Fecal ColiformsEnterococcusTotal Coliforms
1,800948
48,300
(109) hr�1
(109) hr�1
(109) hr�1
66%62%62%
5%20%14%
17%10%16%
12%7%8%
Metals
CopperIronLeadNickelZinc
0.02857.940.00830.00230.79
kg hr�1
kg hr�1
kg hr�1
kg hr�1
kg hr�1
22%58%55%
9%8%
12%9%
14%50%53%
20%31%
8%36%36%
46%2%
24%0%3%
Nutrients
Ammonia-NNitrate-NitriteTKNTotal Phosphorous
87.669.1
1137.67
kg hr�1
kg hr�1
kg hr�1
kg hr�1
0%2%2%5%
55%67%55%54%
45%31%42%41%
0%0%1%0%
2003
Bacteria
E. coliEnterococcusTotal Coliforms
3151,1102,090
(109) hr�1
(109) hr�1
(109) hr�1
36%40%33%
0%4%2%
28%44%49%
35%11%15%
Metals
CopperIronLeadNickelZinc
0.0142.810.00600.00031.74
kg hr�1
kg hr�1
kg hr�1
kg hr�1
kg hr�1
49%13%11%
0%16%
2%27%
1%0%
43%
29%50%39%
100%38%
20%10%50%
0%3%
Nutrients
Ammonia-NNitrate-NitriteTKNTotal Phosphorous
26.666.657.9
7.19
kg hr�1
kg hr�1
kg hr�1
kg hr�1
10%10%14%21%
63%53%53%46%
27%36%31%31%
0%1%2%3%
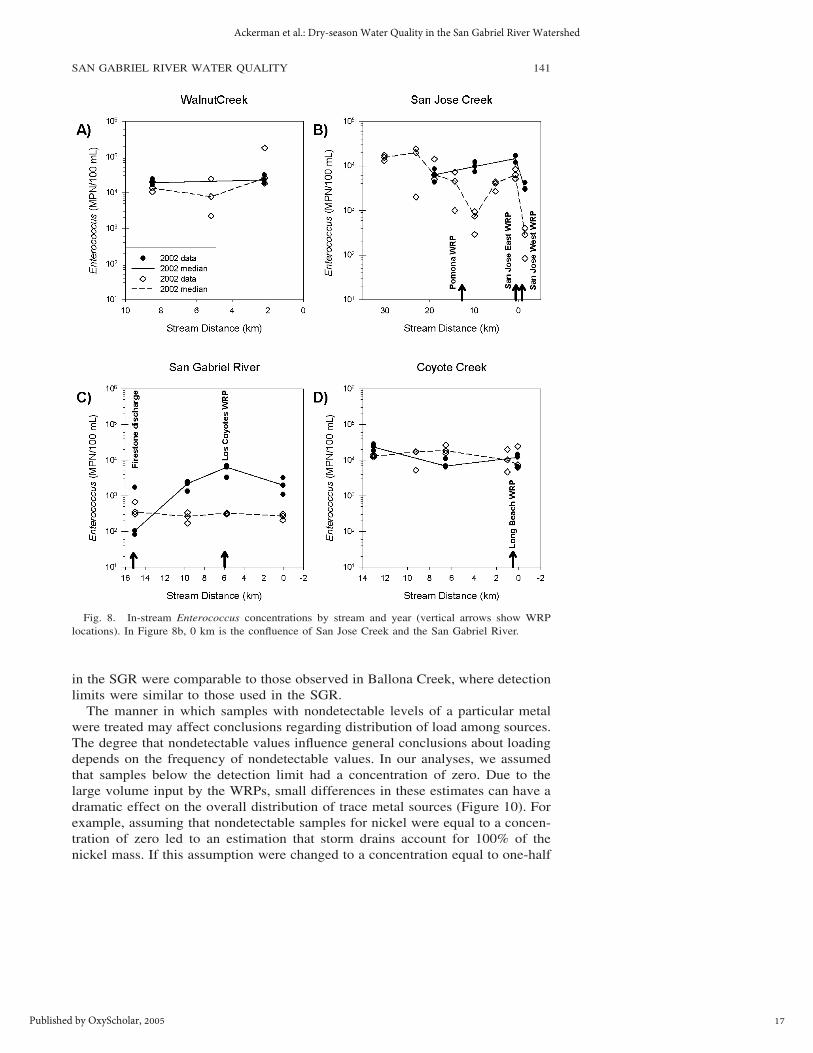
Creek, nutrient concentrations were consistently low. Bacteria concentrations weregenerally high throughout all stream reaches, with no apparent spatial pattern (Fig-ure 8). In some cases, metals concentrations appeared to reflect the locations oflarge inputs. For example, the 2002 in-stream copper concentrations were highernear the locations where large storm drains discharged (Figure 8).
Discussion
The characteristics and patterns of dry-season water quality observed in theSGR watershed are comparable to those seen in the neighboring urbanized wa-tersheds, such as the Los Angeles River (LAR) watershed (Ackerman et al. 2003)and Ballona Creek watershed (Stein and Tiefenthaler 2004). Similar to the LAR,
15
Ackerman et al.: Dry-season Water Quality in the San Gabriel River Watershed
Published by OxyScholar, 2005

140 SOUTHERN CALIFORNIA ACADEMY OF SCIENCES
Fig. 7. In-stream ammonia concentrations by stream and year (vertical arrows show WRP loca-tions). In Figure 7b, 0 km is the confluence of San Jose Creek and the San Gabriel River.
the WRPs were determined to be the major source of flow and nutrients (thereare no WRP discharges into Ballona Creek). Non-point source discharges are themajor source of bacteria in all three watersheds. Similar to the LAR watershed,the source of metals loading varied by individual metal, with storm drains beingthe predominant source of most metals. In both the LAR and the SGR, WRPswere the predominant source of zinc. Unlike the LAR watershed, however, copperloading resulted primarily from storm drains in the SGR. This difference is likelydue to higher detection limits used in the LAR study (e.g. in the LAR study, leadand iron detection limits were 10 and 200 ug/L, respectively and in this study 2and 50 ug/L), which resulted in many more storm drain samples having ‘‘non-detect’’ values, causing the WRPs to appear to be the major source of copper.This conclusion is further supported by the fact that storm drain concentrations
16
Bulletin of the Southern California Academy of Sciences, Vol. 104 [2005], Iss. 3, Art. 2
https://scholar.oxy.edu/scas/vol104/iss3/2
141SAN GABRIEL RIVER WATER QUALITY
Fig. 8. In-stream Enterococcus concentrations by stream and year (vertical arrows show WRPlocations). In Figure 8b, 0 km is the confluence of San Jose Creek and the San Gabriel River.
in the SGR were comparable to those observed in Ballona Creek, where detectionlimits were similar to those used in the SGR.
The manner in which samples with nondetectable levels of a particular metalwere treated may affect conclusions regarding distribution of load among sources.The degree that nondetectable values influence general conclusions about loadingdepends on the frequency of nondetectable values. In our analyses, we assumedthat samples below the detection limit had a concentration of zero. Due to thelarge volume input by the WRPs, small differences in these estimates can have adramatic effect on the overall distribution of trace metal sources (Figure 10). Forexample, assuming that nondetectable samples for nickel were equal to a concen-tration of zero led to an estimation that storm drains account for 100% of thenickel mass. If this assumption were changed to a concentration equal to one-half
17
Ackerman et al.: Dry-season Water Quality in the San Gabriel River Watershed
Published by OxyScholar, 2005
142 SOUTHERN CALIFORNIA ACADEMY OF SCIENCES
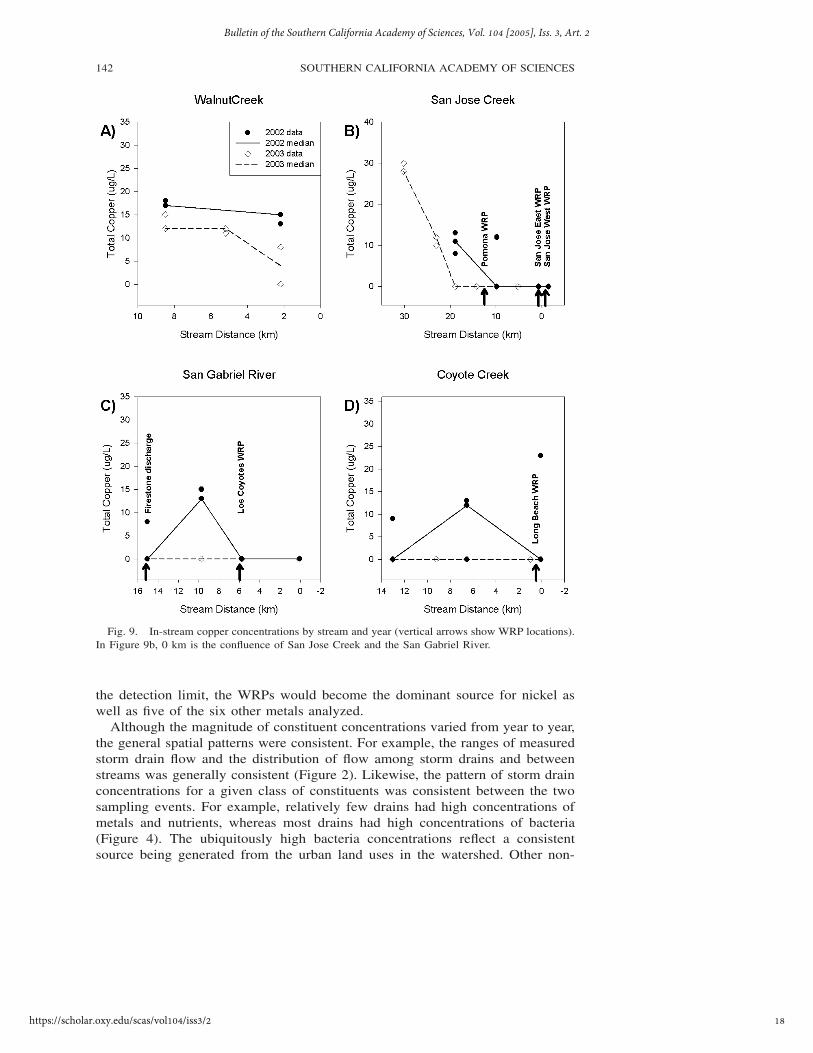
Fig. 9. In-stream copper concentrations by stream and year (vertical arrows show WRP locations).In Figure 9b, 0 km is the confluence of San Jose Creek and the San Gabriel River.
the detection limit, the WRPs would become the dominant source for nickel aswell as five of the six other metals analyzed.
Although the magnitude of constituent concentrations varied from year to year,the general spatial patterns were consistent. For example, the ranges of measuredstorm drain flow and the distribution of flow among storm drains and betweenstreams was generally consistent (Figure 2). Likewise, the pattern of storm drainconcentrations for a given class of constituents was consistent between the twosampling events. For example, relatively few drains had high concentrations ofmetals and nutrients, whereas most drains had high concentrations of bacteria(Figure 4). The ubiquitously high bacteria concentrations reflect a consistentsource being generated from the urban land uses in the watershed. Other non-
18
Bulletin of the Southern California Academy of Sciences, Vol. 104 [2005], Iss. 3, Art. 2
https://scholar.oxy.edu/scas/vol104/iss3/2

143SAN GABRIEL RIVER WATER QUALITY
Fig. 10. The effect of detection limits on the aggregated trace metal loadings using data from bothsampling events.
human sources, such as horses, birds, and dogs, and in-channel growth likely alsocontribute to the high levels observed. In general, spatial patterns of in-streamwater quality correspond to the locations of dominant discharges for each con-stituent. For example, in-stream nutrient concentrations were highest downstreamof WRP discharges, whereas in-stream metals concentrations were highest down-stream of areas where storm drains with high metals concentrations discharged.The consistently high bacteria concentrations throughout the system make estab-
19
Ackerman et al.: Dry-season Water Quality in the San Gabriel River Watershed
Published by OxyScholar, 2005

144 SOUTHERN CALIFORNIA ACADEMY OF SCIENCES
lishing linkages between sources and receiving water concentrations more diffi-cult. In addition, potential in-stream sources of bacteria (e.g., birds or regrowth)were not evaluated in this study. Nevertheless, the patterns observed in this studywere consistent with those observed in the LAR and Ballona watersheds andgenerally indicate a direct link between source inputs and in-river concentrations.
Inter-annual variability in metals concentrations was similar to or slightly lessthan the typical ranges seen in Ballona Creek and LAR (Ackerman et al. 2003).However, inter-annual variations in bacteria concentrations were higher than typ-ically seen in other systems. This may be due to the lack of replication in thisstudy, which would serve to amplify the inherently large fluctuations often seenin bacteria concentrations. Because the goal of this study was to provide a syn-optic view of water quality, increased spatial coverage of samples was prioritizedover replication at individual locations. Inclusion of such replication would havelikely reduced inter-annual variability in bacteria concentrations. Nevertheless, thepattern of high concentration of bacteria in both source inputs and receiving wa-ters was consistent between years.
In contrast, differences in nutrient loading from the WRPs between 2002 and2003 (and the resultant in-stream concentrations) were a result of changes intreatment practices (Figures 6b and 6c). In the interval between the two surveys,nitrification and denitrification facilities were installed at the WRPs. Decreases inmeasured average ammonia concentrations in the WRP effluent from 8.01 to 1.40mg/L between 2002 and 2003 reflect this additional level of treatment. Similarly,in-stream concentrations downstream of the WRP discharges also decreased from2002 to 2003. For example, the median ammonia concentration downstream ofthe San Jose Creek WRP decreased from 5.3 to 0.6 mg/L. This significant de-crease in ammonia further demonstrates the influence of this source on in-streamwater quality.
Conclusions
The results from this study are similar to those seen in the Los Angeles River.Storm drains were the primary source of bacteria and most metals, while theWRPs the main source of nutrients. The instream water quality reflects theseinputs and was consistent between the two samplings. The storm drain waterquality concentrations and flow were highly variable; however, but variability wassimilar between the two surveys.
Acknowledgements
This study was funded by the Los Angeles Regional Water Quality ControlBoard, the Los Angeles County Sanitation Districts, the Los Angeles CountyDepartment of Public Works, the City of Downey, and the Southern CaliforniaCoastal Water Research Project (SCCWRP). The authors would like to acknowl-edge the assistance of the Los Angeles/San Gabriel Rivers Watershed Council,Friends of the San Gabriel River, and U.S. EPA Region IX. The authors aregreatly indebted to the many citizen volunteers who volunteered for a day oftraining and a day of sample collection for each survey. Without their participa-tion, the comprehensive characterization of the watershed would not have beennearly as complete.
20
Bulletin of the Southern California Academy of Sciences, Vol. 104 [2005], Iss. 3, Art. 2
https://scholar.oxy.edu/scas/vol104/iss3/2

145SAN GABRIEL RIVER WATER QUALITY
Literature Cited
Ackerman, D., K. Schiff, H. Trim and M. Mullin. 2003. Characterization of water quality in the LosAngeles River. Bulletin of the Southern California Academy of Sciences 102: 17–25.
Bay, S.M., D.J. Greenstein, S.-L. Lau, M.K. Stenstrom and C.G. Kelley. 1996. Toxicity of dry weatherflow from the Santa Monica Bay Watershed. Bulletin of Southern California Academy of Sci-ences 95: 33–45.
Hamilton, D.M. 1992. Hydrologic Assessment for Riparian Restoration Projects. Paper presented atthe Environmental Engineering, Saving a Threatened Resource in Search of Solutions, Pro-ceedings of Environmental Engineering Sessions Water Forum ’92, Baltimore, Maryland.
LACDPW. Los Angeles County Department of Public Works. 2004. Imported and Reclaimed WaterData 2002–2003 Final. �http://www.ladpw.org/wrd/spreadingground/watercon/, April 29, 2004.
Roesner, L.A. and B.P. Bledsoe. 2003. Physical Effects of Wet Weather Flows on Aquatic Habitats:Present Knowledge and Reasearch Needs. Water Environment Research Foundation. Fort Col-lins, CO.
Schiff, K. 1997. Review of existing stormwater monitoring programs for estimating Bight-wide massemissions from urban runoff. pp. 44–55 in: D. Hallock (ed.), Southern California Coastal WaterResearch Project Annual Report 1995–96. Westminster, CA.
Schueler, T.R. and H.K. Holland. 2000. The Practice of Watershed Protection. Center for WatershedProtection. Ellicott City, MD.
Stein, E.D. and L.L Tiefenthaler. 2004. Characterization of dry weather metals and bacteria in BallonaCreek. Southern California Coastal Water Research Project Technical Report #427.
Accepted for publication 22 December 2004.
21
Ackerman et al.: Dry-season Water Quality in the San Gabriel River Watershed
Published by OxyScholar, 2005