dynamic positioning conference october 13-14,...
TRANSCRIPT
DYNAMIC POSITIONING CONFERENCEOctober 13-14, 2015
RISK
Risk Analysis of DP Operations for CAT-D Drilling Unit in the Troll Field
Haibo Chen Lloyds Register Consulting
Leif Johannes Sætre, Bjørn Tom JahnsenStatoil ASA

Working togetherfor a safer world
DYNAMIC POSITIONING CONFERENCEOctober 13-14, 2015
CAT-D Drilling UnitRisk Analysis of DP Operations in the Troll Field
Haibo Chen 1, Leif Johannes Sætre 2, Bjørn Tom Jahnsen 2
1) Lloyd’s Register Consulting2) Statoil ASA
©Lloyd’s Register Consulting
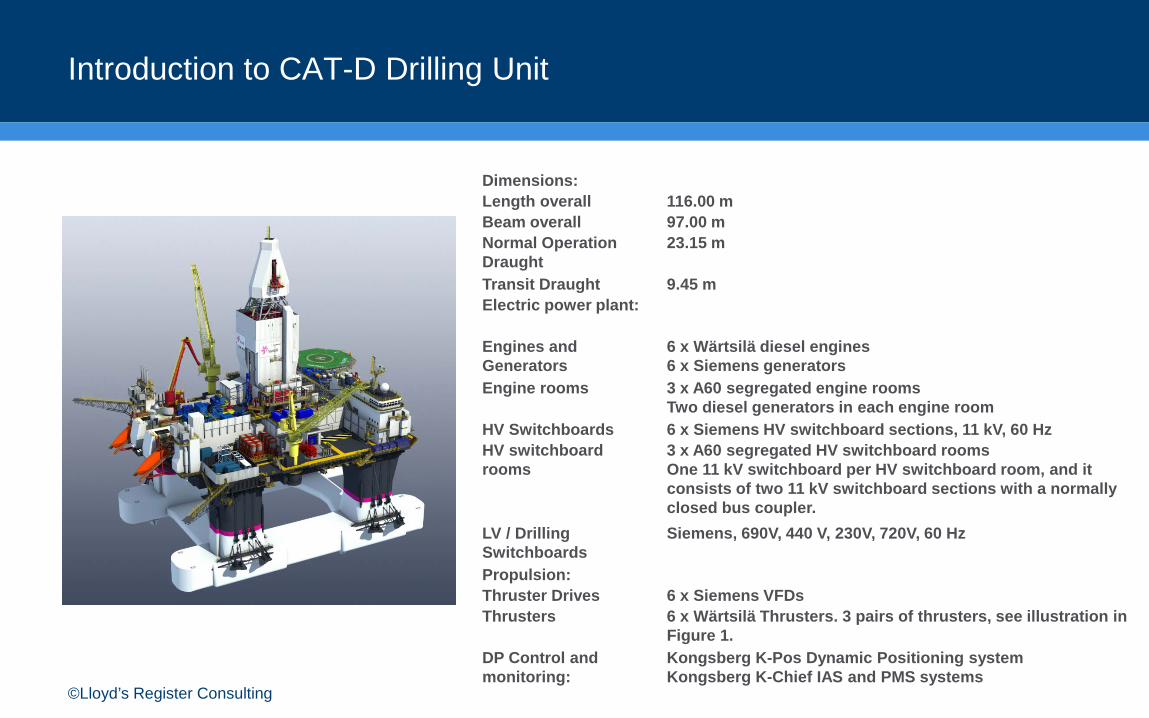
Introduction to CAT-D Drilling Unit
Dimensions:Length overall 116.00 mBeam overall 97.00 mNormal Operation Draught
23.15 m
Transit Draught 9.45 mElectric power plant:
Engines and Generators
6 x Wärtsilä diesel engines 6 x Siemens generators
Engine rooms 3 x A60 segregated engine roomsTwo diesel generators in each engine room
HV Switchboards 6 x Siemens HV switchboard sections, 11 kV, 60 HzHV switchboard rooms
3 x A60 segregated HV switchboard roomsOne 11 kV switchboard per HV switchboard room, and it consists of two 11 kV switchboard sections with a normally closed bus coupler.
LV / Drilling Switchboards
Siemens, 690V, 440 V, 230V, 720V, 60 Hz
Propulsion:Thruster Drives 6 x Siemens VFDsThrusters 6 x Wärtsilä Thrusters. 3 pairs of thrusters, see illustration in
Figure 1. DP Control and monitoring:
Kongsberg K-Pos Dynamic Positioning systemKongsberg K-Chief IAS and PMS systems
©Lloyd’s Register Consulting
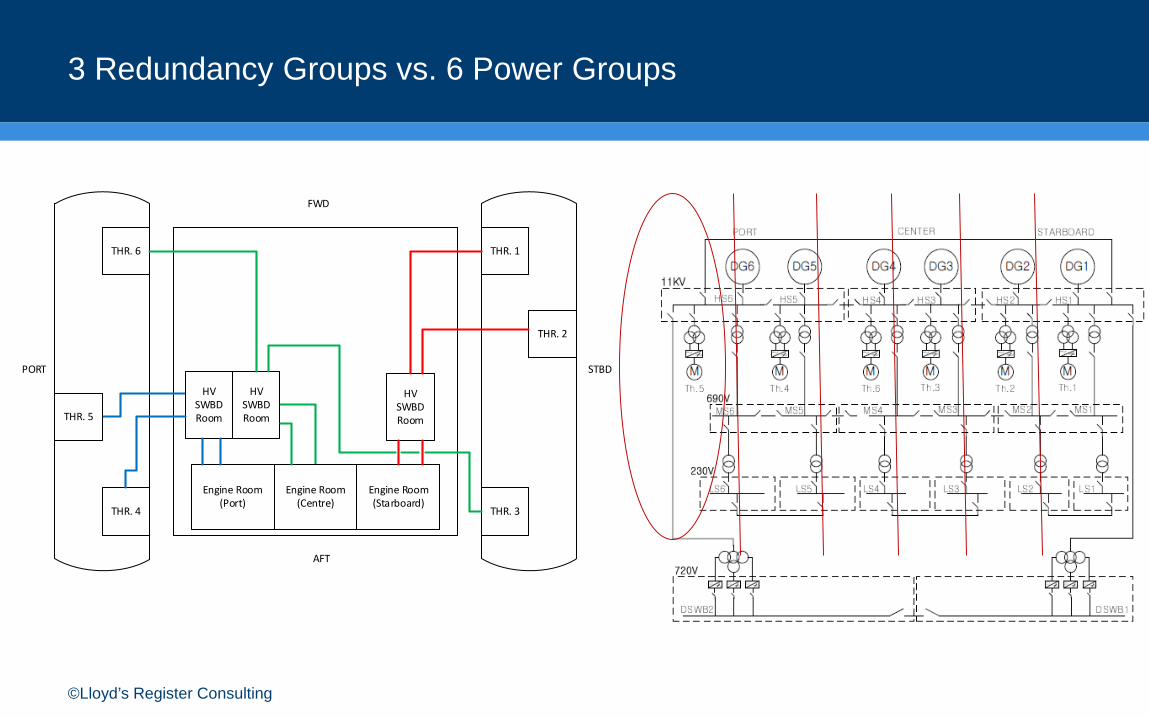
3 Redundancy Groups vs. 6 Power Groups
Engine Room(Port)
HV SWBD Room
AFT
FWD
STBDPORT
THR. 1
THR. 2
THR. 3
Engine Room (Centre)
Engine Room (Starboard)
HV SWBD Room
HV SWBD Room
THR. 6
THR. 4
THR. 5
©Lloyd’s Register Consulting
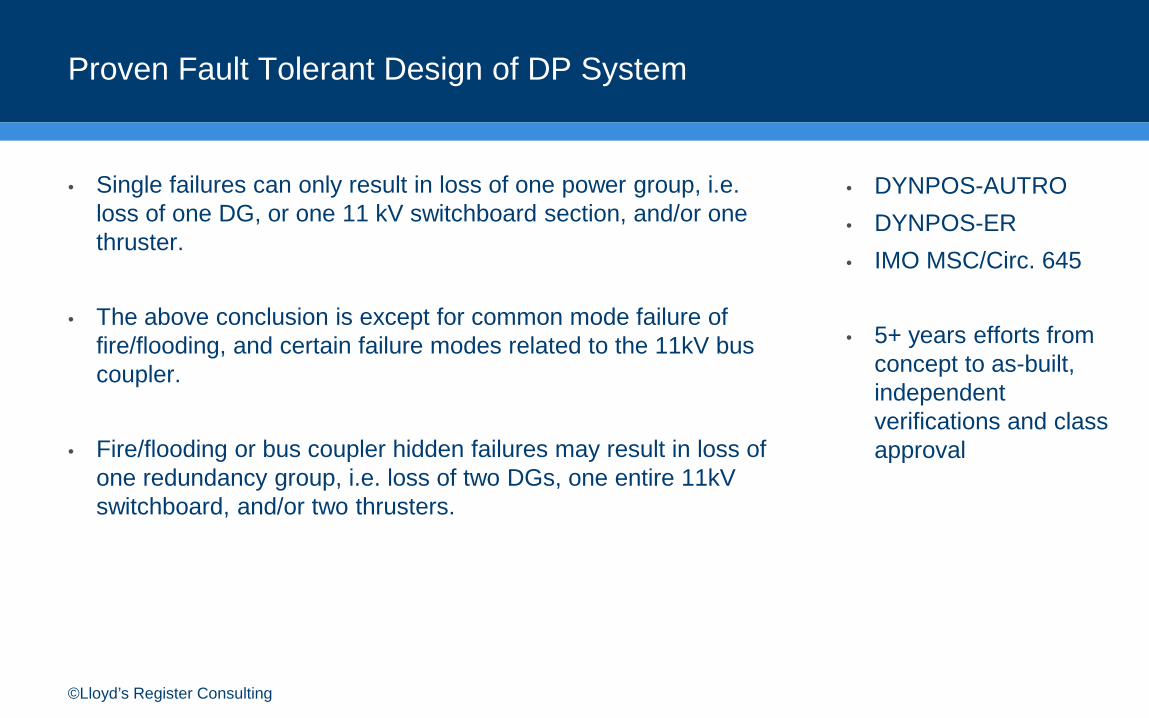
Proven Fault Tolerant Design of DP System
• Single failures can only result in loss of one power group, i.e. loss of one DG, or one 11 kV switchboard section, and/or one thruster.
• The above conclusion is except for common mode failure of fire/flooding, and certain failure modes related to the 11kV bus coupler.
• Fire/flooding or bus coupler hidden failures may result in loss of one redundancy group, i.e. loss of two DGs, one entire 11kV switchboard, and/or two thrusters.
• DYNPOS-AUTRO• DYNPOS-ER• IMO MSC/Circ. 645
• 5+ years efforts from concept to as-built, independent verifications and class approval
©Lloyd’s Register Consulting
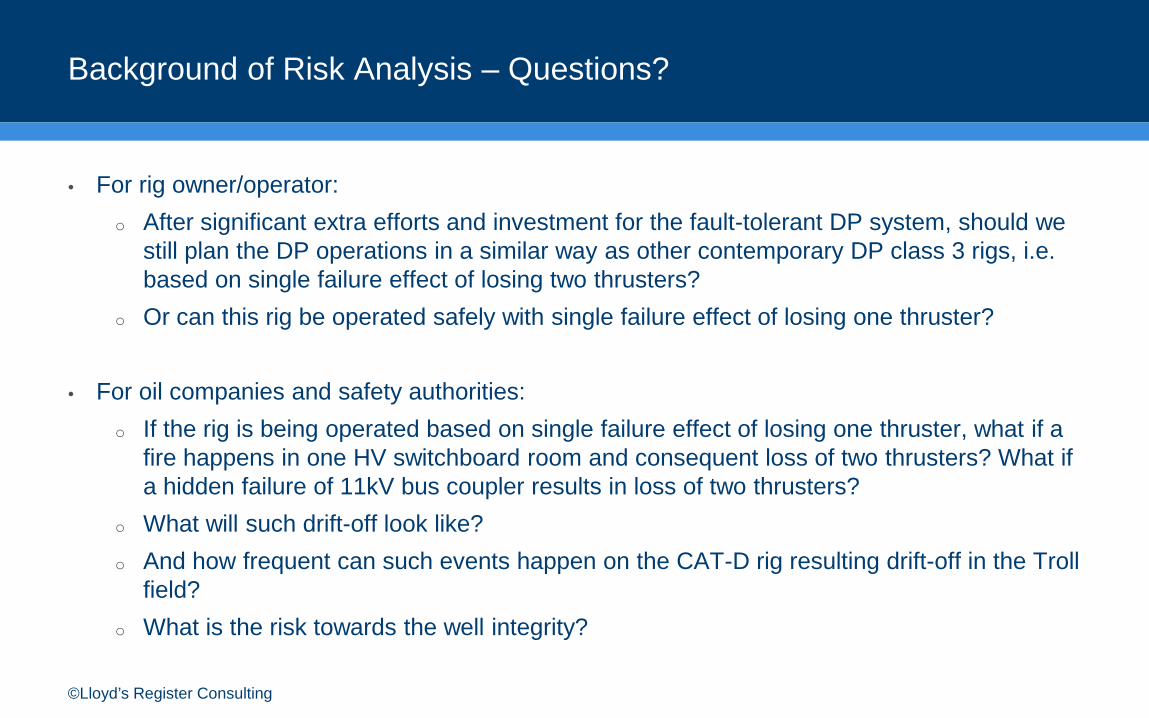
Background of Risk Analysis – Questions?
• For rig owner/operator: o After significant extra efforts and investment for the fault-tolerant DP system, should we
still plan the DP operations in a similar way as other contemporary DP class 3 rigs, i.e. based on single failure effect of losing two thrusters?
o Or can this rig be operated safely with single failure effect of losing one thruster?
• For oil companies and safety authorities: o If the rig is being operated based on single failure effect of losing one thruster, what if a
fire happens in one HV switchboard room and consequent loss of two thrusters? What if a hidden failure of 11kV bus coupler results in loss of two thrusters?
o What will such drift-off look like? o And how frequent can such events happen on the CAT-D rig resulting drift-off in the Troll
field? o What is the risk towards the well integrity?
©Lloyd’s Register Consulting
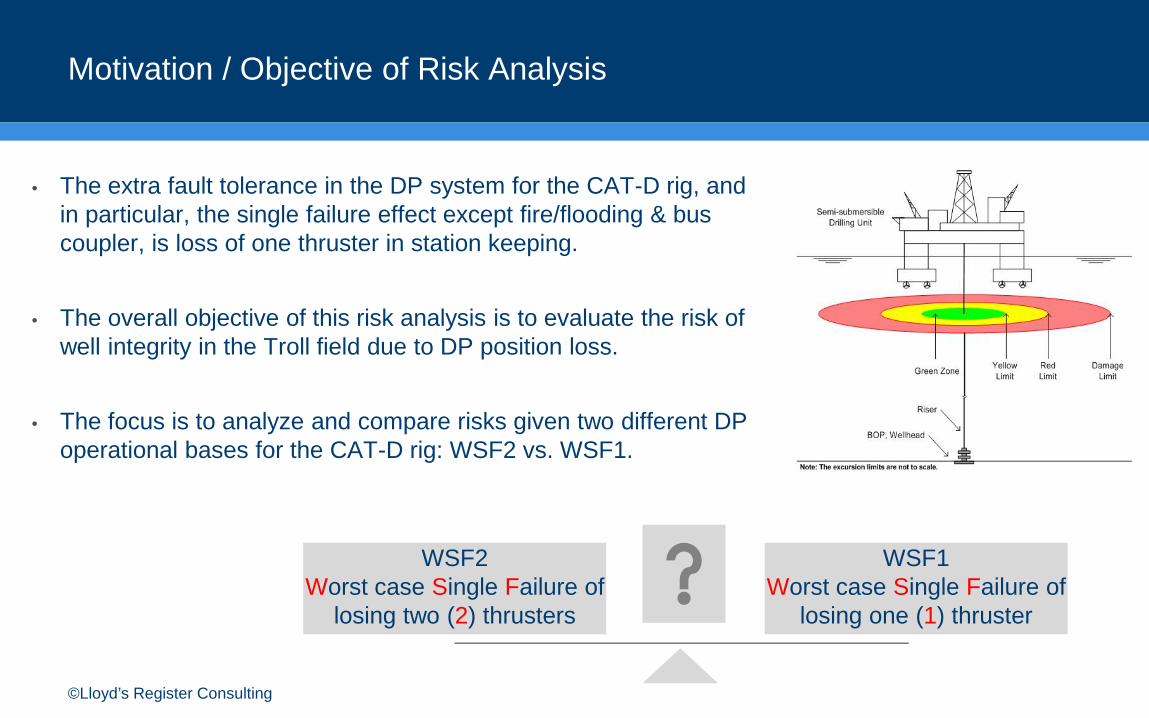
Motivation / Objective of Risk Analysis
• The extra fault tolerance in the DP system for the CAT-D rig, and in particular, the single failure effect except fire/flooding & bus coupler, is loss of one thruster in station keeping.
• The overall objective of this risk analysis is to evaluate the risk of well integrity in the Troll field due to DP position loss.
• The focus is to analyze and compare risks given two different DP operational bases for the CAT-D rig: WSF2 vs. WSF1.
WSF2Worst case Single Failure of
losing two (2) thrusters
WSF1Worst case Single Failure of
losing one (1) thruster
©Lloyd’s Register Consulting
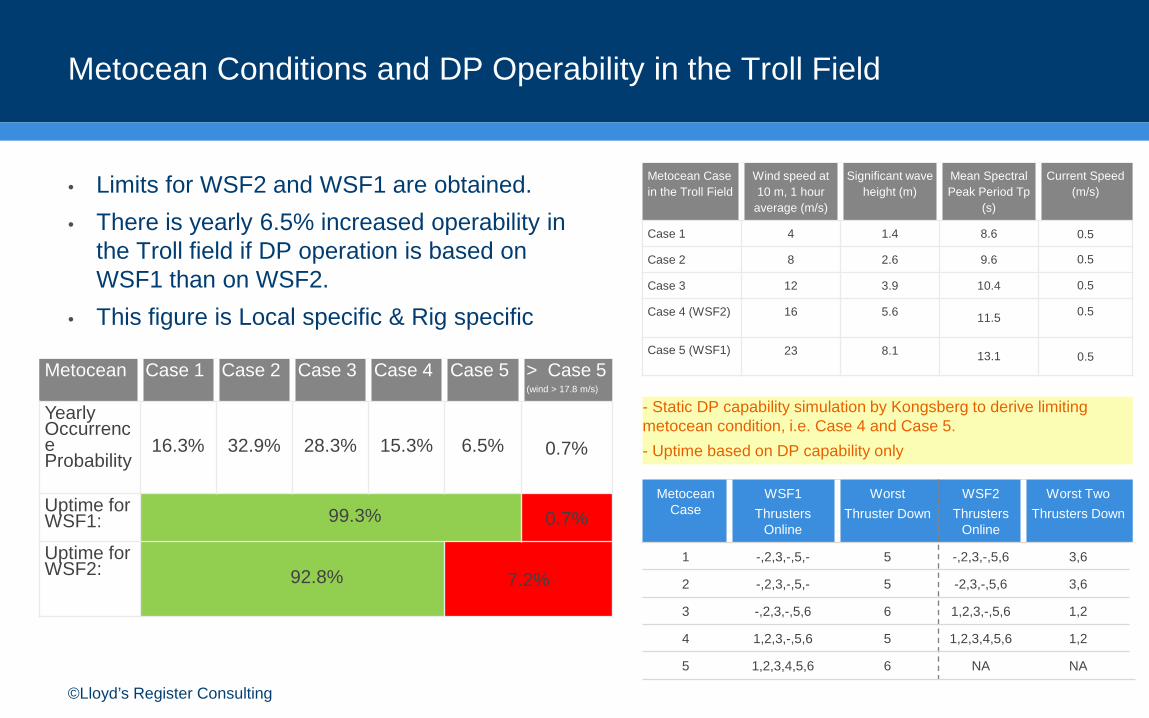
Metocean Conditions and DP Operability in the Troll Field
• Limits for WSF2 and WSF1 are obtained.• There is yearly 6.5% increased operability in
the Troll field if DP operation is based on WSF1 than on WSF2.
• This figure is Local specific & Rig specific
Metocean Case in the Troll Field
Wind speed at 10 m, 1 hour
average (m/s)
Significant wave height (m)
Mean Spectral Peak Period Tp
(s)
Current Speed (m/s)
Case 1 4 1.4 8.6 0.5
Case 2 8 2.6 9.6 0.5
Case 3 12 3.9 10.4 0.5
Case 4 (WSF2) 16 5.6 11.5 0.5
Case 5 (WSF1) 23 8.1 13.1 0.5
- Static DP capability simulation by Kongsberg to derive limitingmetocean condition, i.e. Case 4 and Case 5. - Uptime based on DP capability only
Metocean Case
WSF1Thrusters
Online
Worst Thruster Down
WSF2Thrusters
Online
Worst TwoThrusters Down
1 -,2,3,-,5,- 5 -,2,3,-,5,6 3,6
2 -,2,3,-,5,- 5 -2,3,-,5,6 3,6
3 -,2,3,-,5,6 6 1,2,3,-,5,6 1,2
4 1,2,3,-,5,6 5 1,2,3,4,5,6 1,2
5 1,2,3,4,5,6 6 NA NA
Metocean Case 1 Case 2 Case 3 Case 4 Case 5 > Case 5 (wind > 17.8 m/s)
Yearly Occurrence Probability
16.3% 32.9% 28.3% 15.3% 6.5% 0.7%
Uptime for WSF1: 99.3% 0.7%
Uptime for WSF2: 92.8% 7.2%
©Lloyd’s Register Consulting
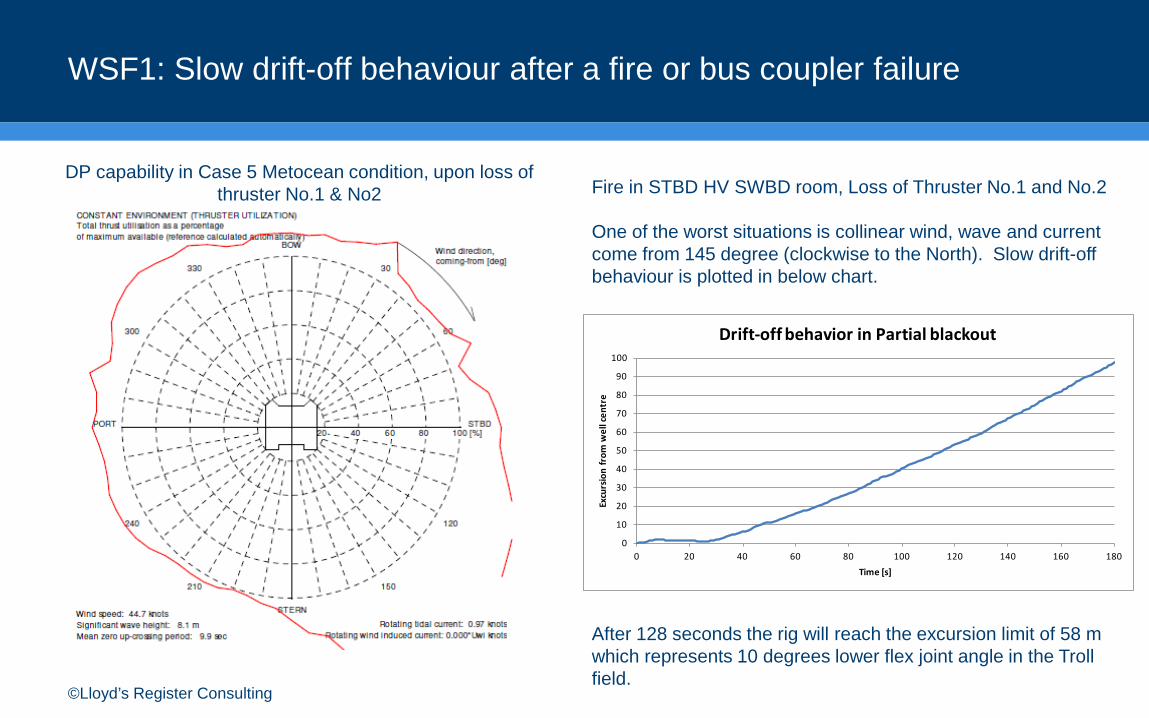
WSF1: Slow drift-off behaviour after a fire or bus coupler failure
DP capability in Case 5 Metocean condition, upon loss of thruster No.1 & No2 Fire in STBD HV SWBD room, Loss of Thruster No.1 and No.2
One of the worst situations is collinear wind, wave and current come from 145 degree (clockwise to the North). Slow drift-off behaviour is plotted in below chart.
After 128 seconds the rig will reach the excursion limit of 58 m which represents 10 degrees lower flex joint angle in the Troll field.
0
10
20
30
40
50
60
70
80
90
100
0 20 40 60 80 100 120 140 160 180
Excu
rsio
n fr
om w
ell c
entr
e
Time [s]
Drift-off behavior in Partial blackout

©Lloyd’s Register Consulting
Shallow Water Drilling in the Troll Field
• 330 m water depth, 10 degrees of lower flex joint angle gives max. 58 m excursion limit.
• Barriers for well integrity:1. Manual EDS2. Auto EDS3. ADS system
Seabed
Marine Drilling Riser
Lower Flex Joint
Water Depth
Sea surface
Height of BOP Stack &Wellhead
Physical Excursion Limit
Note: The figure is illustrative and not to scale.
Height of Upper Flex Joint
10˚
©Lloyd’s Register Consulting
A practical formulation of Risk Model for DP Operations
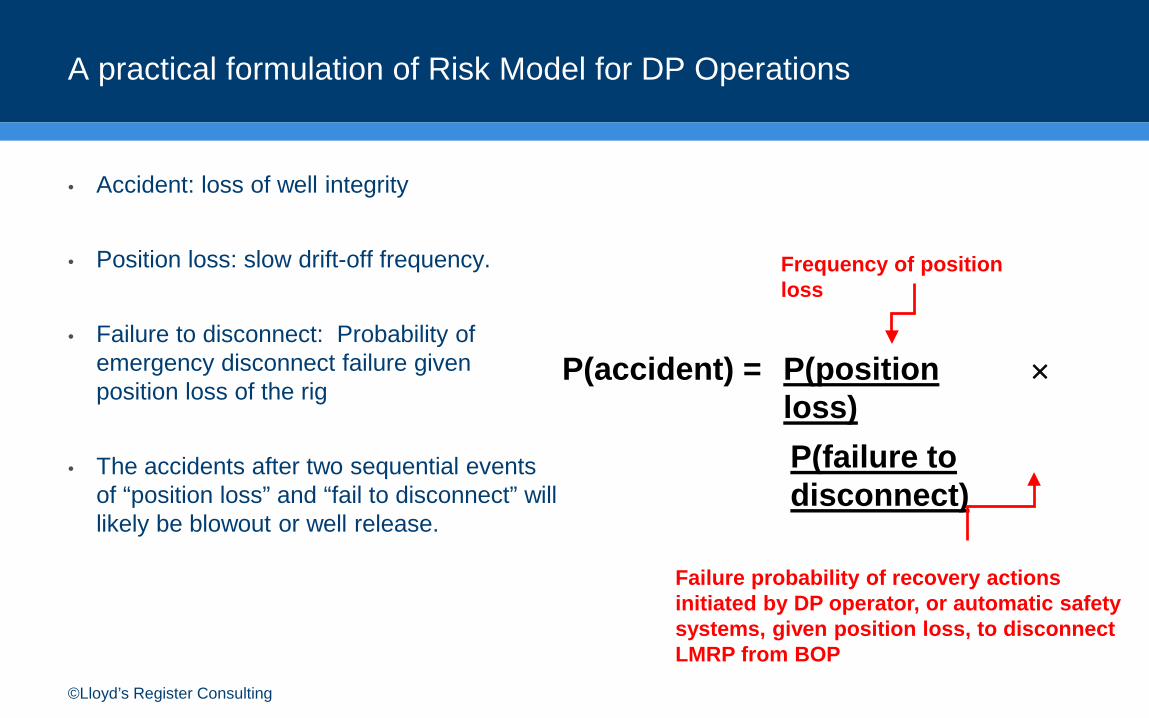
• Accident: loss of well integrity
• Position loss: slow drift-off frequency.
• Failure to disconnect: Probability of emergency disconnect failure given position loss of the rig
• The accidents after two sequential events of “position loss” and “fail to disconnect” will likely be blowout or well release.
P(position loss)P(failure to disconnect)
×P(accident) =
Frequency of position loss
Failure probability of recovery actions initiated by DP operator, or automatic safety systems, given position loss, to disconnect LMRP from BOP
©Lloyd’s Register Consulting
Incident Data Sources
• IMCA annual station keeping incident reports, from 1998 to 2010 in Each Year.
• DP incidents on drilling and intervention units on the Norwegian Continental Shelf, from late 1990s to early 2004 (Reference: Scandpower: “Safety of DP Operations on MODUs on the NCS – Report 1: DP Incident Data Collection and Analysis”, 27.740.114/R1, Final, 28 Dec. 2005.)
• DNV, WOAD database (1998 - 2009)
• IHS Fairplay Accident database (1998 - 2012)
• Other possible data sources, e.g. UK H&SE, OGP, MTS DP conference proceedings, IMCA DP seminar and workshops (via open publications)
©Lloyd’s Register Consulting
Fire / Flooding on DP MODUs resulted in Position Loss: 4 Events
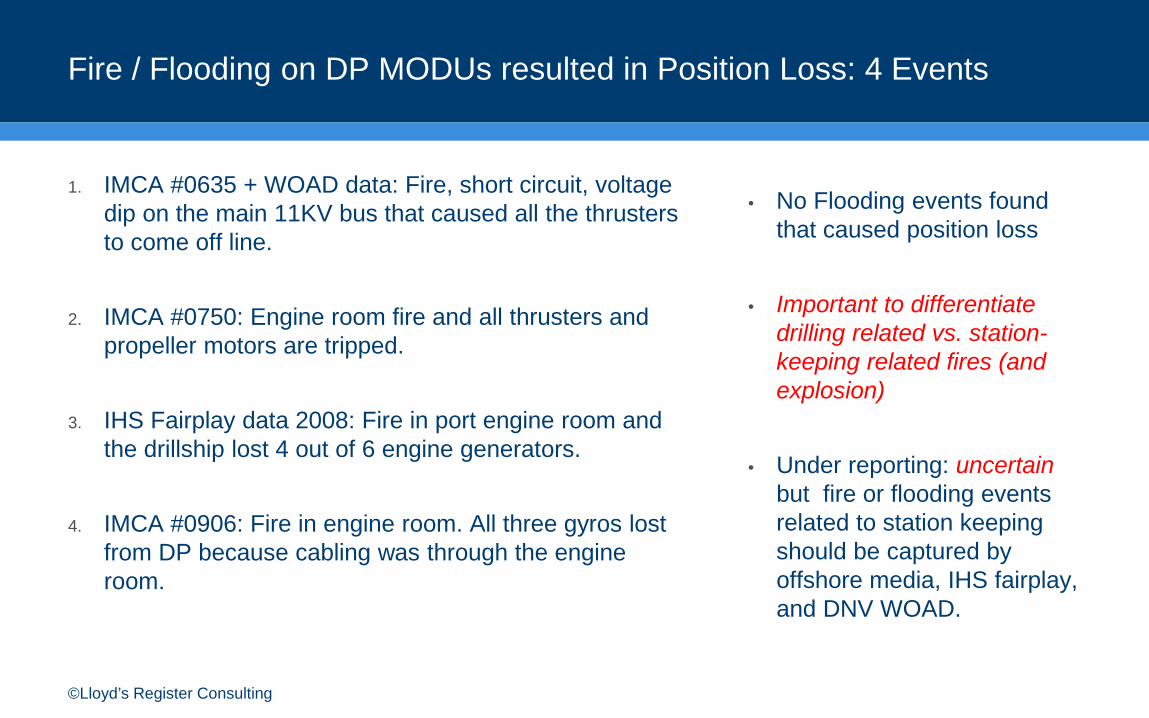
1. IMCA #0635 + WOAD data: Fire, short circuit, voltage dip on the main 11KV bus that caused all the thrusters to come off line.
2. IMCA #0750: Engine room fire and all thrusters and propeller motors are tripped.
3. IHS Fairplay data 2008: Fire in port engine room and the drillship lost 4 out of 6 engine generators.
4. IMCA #0906: Fire in engine room. All three gyros lost from DP because cabling was through the engine room.
• No Flooding events found that caused position loss
• Important to differentiate drilling related vs. station-keeping related fires (and explosion)
• Under reporting: uncertain but fire or flooding events related to station keeping should be captured by offshore media, IHS fairplay, and DNV WOAD.
©Lloyd’s Register Consulting
DP MODU’s Worldwide during 1998 – 2010: 651 DP Years
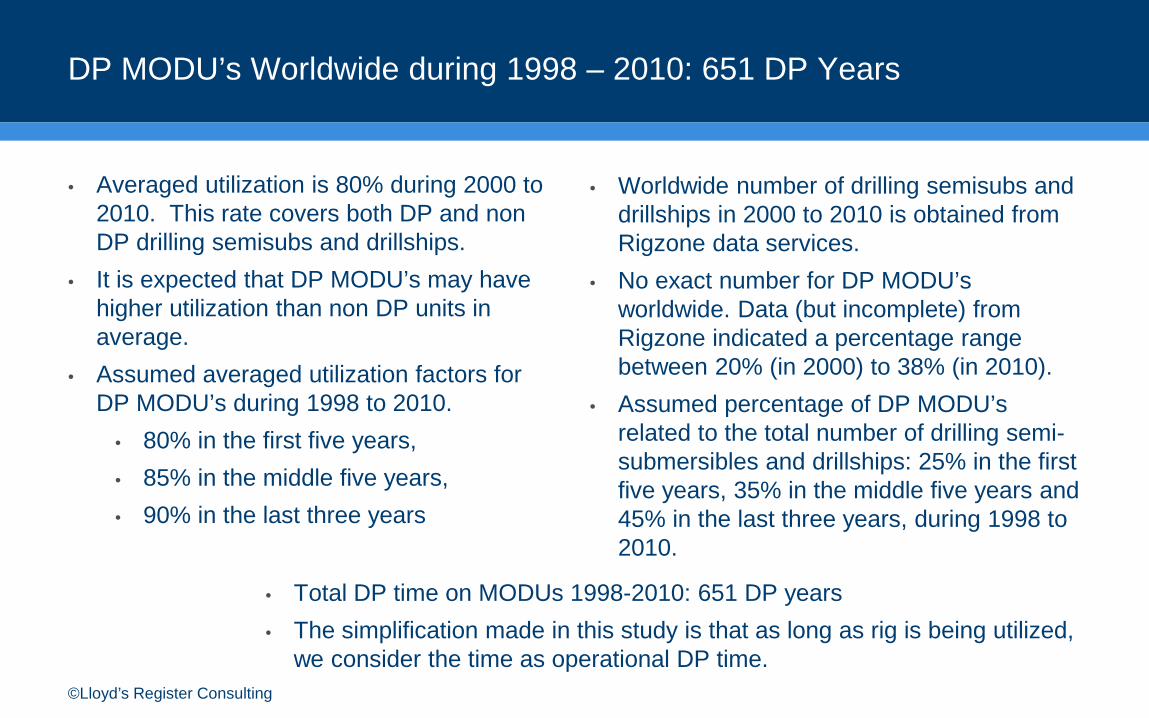
• Worldwide number of drilling semisubs and drillships in 2000 to 2010 is obtained from Rigzone data services.
• No exact number for DP MODU’s worldwide. Data (but incomplete) from Rigzone indicated a percentage range between 20% (in 2000) to 38% (in 2010).
• Assumed percentage of DP MODU’s related to the total number of drilling semi-submersibles and drillships: 25% in the first five years, 35% in the middle five years and 45% in the last three years, during 1998 to 2010.
• Averaged utilization is 80% during 2000 to 2010. This rate covers both DP and non DP drilling semisubs and drillships.
• It is expected that DP MODU’s may have higher utilization than non DP units in average.
• Assumed averaged utilization factors for DP MODU’s during 1998 to 2010.
• 80% in the first five years, • 85% in the middle five years, • 90% in the last three years
• Total DP time on MODUs 1998-2010: 651 DP years• The simplification made in this study is that as long as rig is being utilized,
we consider the time as operational DP time.
©Lloyd’s Register Consulting
Historical Frequency for Fire in Compartments: 9.2E-03 per DP year
• We assume 50% underreporting factor for the fire event. • Once a fire event happened, e.g. in engine room, it would likely be captured by offshore media and
news. IHS Fairplay database and WOAD database would likely be able include such happenings. The chance of under reporting is small.
• Fire frequency: (1 + 50%) x 4 / 651 = 9.2E-03 per DP year • 75% fire in engine room: 6.9E-03 per DP year• 25% fire in other compartments: 2.3E-03 per DP year
• These historical frequencies are representative to generic DP MODU’s which consist of a mix of DP class 2 and class 3 semi-submersibles and drillships worldwide.
©Lloyd’s Register Consulting
P(position loss) – Frequency of Slow Drift-off in WSF1
• Frequency of fire in compartments on CAT-D rig: 9.2E-03 per DP year. • Frequency of fire in engine room on CAT-D rig is: 9.3E-03 × 75% = 6.9E-03 per DP year. • 1/3 of time in 3-split mode vs. 2/3 time in closed ring bus mode. Fire in engine room causing
loss of two thrusters: 6.9E-03 × 1/3 = 2.3E-03 per DP year. • Fire in HV switchboard room: 25% × 9.2E-03 × 50% = 1.2E-03 per DP year• 6.5% of yearly time to encounter environment beyond Metocean Case 4 but within Case 5. • All weather in Metocean Case 5 will trigger the slow drift-off • Frequency of bus coupler failures that can result in loss of two thrusters for the CAT-D rig:
5.2E-04 per year• Frequency of slow drift-off situation: (2.3E-03 + 1.2E-03 + 5.2E-04) × 6.5% × 1.0 = 2.6E-04
per DP year.

©Lloyd’s Register Consulting
• Human operator should be able to activate EDS after confirmed fire in one compartment, and see the slowly drift-off situation and loss of two thrusters, irrespective to Auto EDS function or not. Ample time to disconnect based on drift-off simulation: 443 s to reach excursion limit of 58 m. This minus the 30 s needed for the EDS, gives 413 s to activate EDS after loss of two thrusters. A conservative human error probability of 0.5 is assumed in this study as the base case. Two sensitivity cases, i.e. 0.1 and 1.0 are also analyzed. These represent lower and upper band of this human error probability.
P(fail to disconnect)
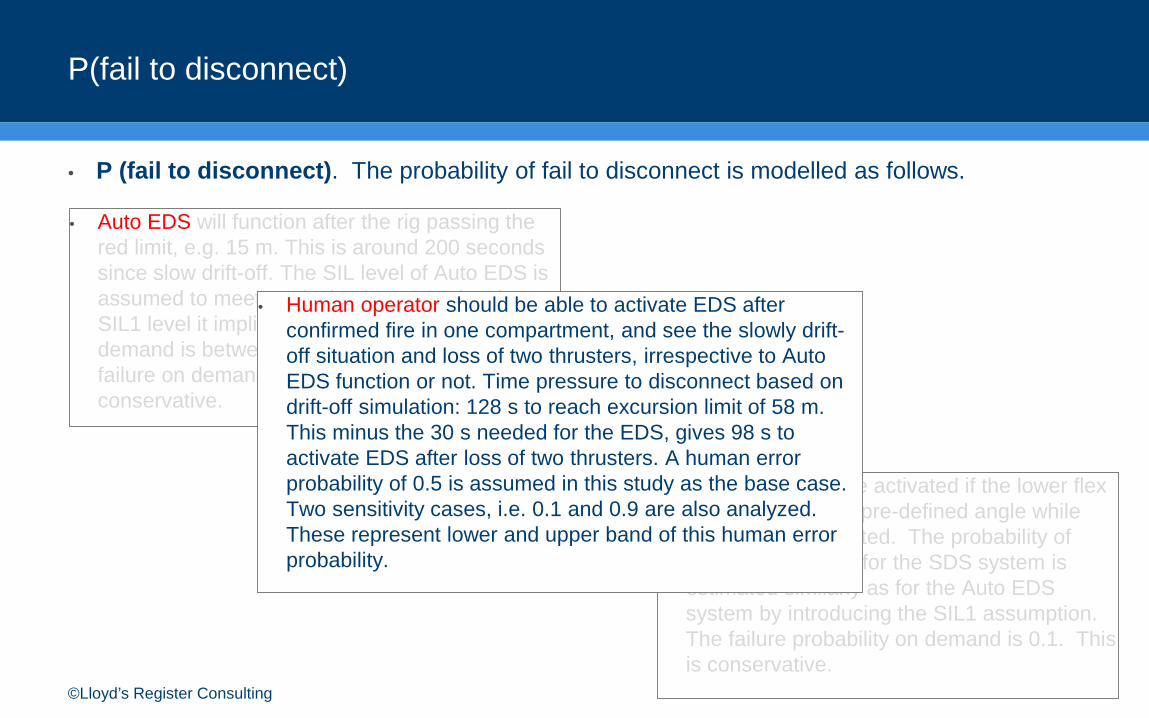
• P (fail to disconnect). The probability of fail to disconnect is modelled as follows.
• SDS system will be activated if the lower flex angle reaches the pre-defined angle while EDS is not completed. The probability of failure on demand for the SDS system is estimated similarly as for the Auto EDS system by introducing the SIL1 assumption. The failure probability on demand is 0.1. This is conservative.
• Auto EDS will function after the rig passing the red limit, e.g. 15 m. This is around 200 seconds since slow drift-off. The SIL level of Auto EDS is assumed to meet equivalently to SIL1 level. For SIL1 level it implies probability of failure on demand is between 0.1 to 0.01. We consider failure on demand for Auto EDS is 0.1. This is conservative.
©Lloyd’s Register Consulting
P(fail to disconnect)
• P (fail to disconnect). The probability of fail to disconnect is modelled as follows.
• SDS system will be activated if the lower flex angle reaches the pre-defined angle while EDS is not completed. The probability of failure on demand for the SDS system is estimated similarly as for the Auto EDS system by introducing the SIL1 assumption. The failure probability on demand is 0.1. This is conservative.
• Auto EDS will function after the rig passing the red limit, e.g. 15 m. This is around 200 seconds since slow drift-off. The SIL level of Auto EDS is assumed to meet equivalently to SIL1 level. For SIL1 level it implies probability of failure on demand is between 0.1 to 0.01. We consider failure on demand for Auto EDS is 0.1. This is conservative.
• Human operator should be able to activate EDS after confirmed fire in one compartment, and see the slowly drift-off situation and loss of two thrusters, irrespective to Auto EDS function or not. Time pressure to disconnect based on drift-off simulation: 128 s to reach excursion limit of 58 m. This minus the 30 s needed for the EDS, gives 98 s to activate EDS after loss of two thrusters. A human error probability of 0.5 is assumed in this study as the base case. Two sensitivity cases, i.e. 0.1 and 0.9 are also analyzed. These represent lower and upper band of this human error probability.
©Lloyd’s Register Consulting
P(fail to disconnect)
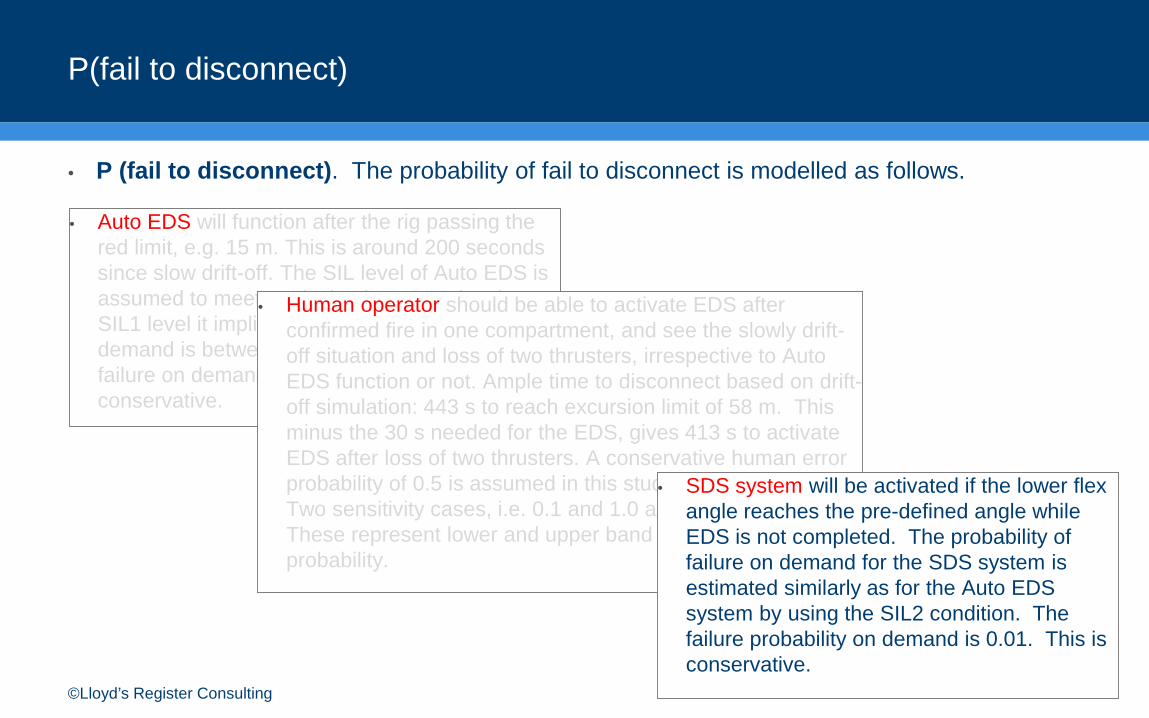
• P (fail to disconnect). The probability of fail to disconnect is modelled as follows.
• Auto EDS will function after the rig passing the red limit, e.g. 15 m. This is around 200 seconds since slow drift-off. The SIL level of Auto EDS is assumed to meet equivalently to SIL1 level. For SIL1 level it implies probability of failure on demand is between 0.1 to 0.01. We consider failure on demand for Auto EDS is 0.1. This is conservative.
• Human operator should be able to activate EDS after confirmed fire in one compartment, and see the slowly drift-off situation and loss of two thrusters, irrespective to Auto EDS function or not. Ample time to disconnect based on drift-off simulation: 443 s to reach excursion limit of 58 m. This minus the 30 s needed for the EDS, gives 413 s to activate EDS after loss of two thrusters. A conservative human error probability of 0.5 is assumed in this study as the base case. Two sensitivity cases, i.e. 0.1 and 1.0 are also analyzed. These represent lower and upper band of this human error probability.
• SDS system will be activated if the lower flex angle reaches the pre-defined angle while EDS is not completed. The probability of failure on demand for the SDS system is estimated similarly as for the Auto EDS system by using the SIL2 condition. The failure probability on demand is 0.01. This is conservative.
©Lloyd’s Register Consulting
Impairment Frequency of Well Integrity
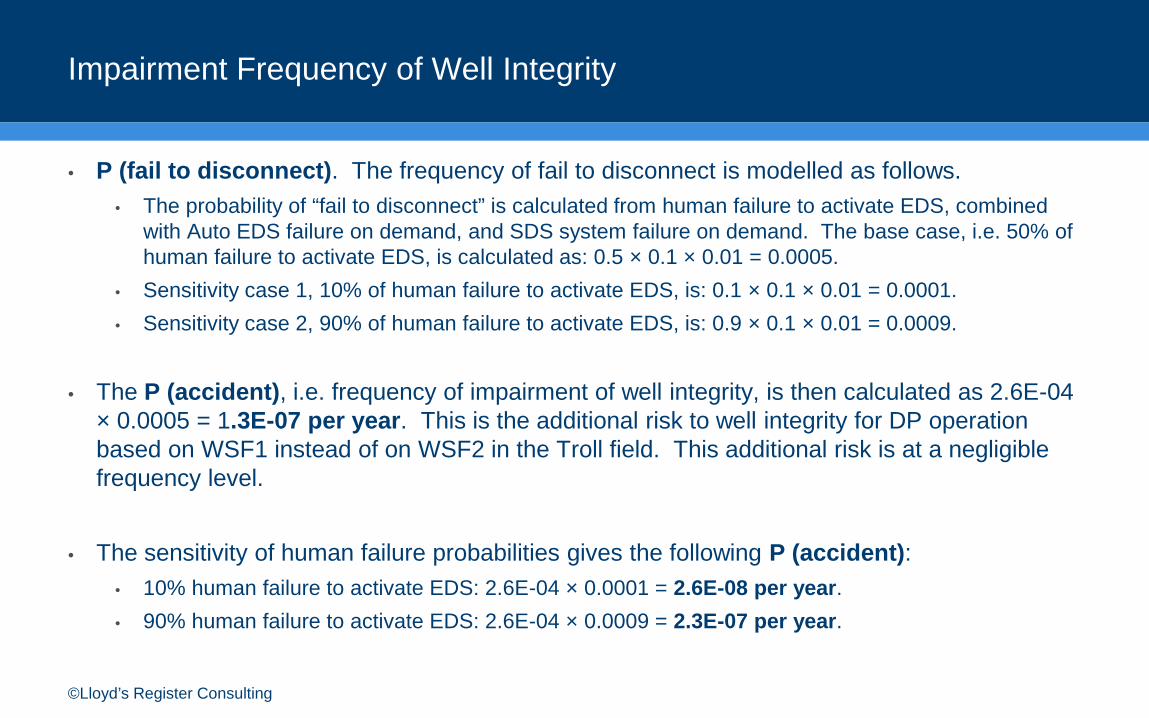
• P (fail to disconnect). The frequency of fail to disconnect is modelled as follows. • The probability of “fail to disconnect” is calculated from human failure to activate EDS, combined
with Auto EDS failure on demand, and SDS system failure on demand. The base case, i.e. 50% of human failure to activate EDS, is calculated as: 0.5 × 0.1 × 0.01 = 0.0005.
• Sensitivity case 1, 10% of human failure to activate EDS, is: 0.1 × 0.1 × 0.01 = 0.0001. • Sensitivity case 2, 90% of human failure to activate EDS, is: 0.9 × 0.1 × 0.01 = 0.0009.
• The P (accident), i.e. frequency of impairment of well integrity, is then calculated as 2.6E-04 × 0.0005 = 1.3E-07 per year. This is the additional risk to well integrity for DP operation based on WSF1 instead of on WSF2 in the Troll field. This additional risk is at a negligible frequency level.
• The sensitivity of human failure probabilities gives the following P (accident):• 10% human failure to activate EDS: 2.6E-04 × 0.0001 = 2.6E-08 per year. • 90% human failure to activate EDS: 2.6E-04 × 0.0009 = 2.3E-07 per year.

©Lloyd’s Register Consulting
Conclusion: Risk of Fire and Bus Coupler Failures: WSF1 vs. WSF2
• Fire or bus coupler failure events may cause loss of two thrusters on the CAT-D rig.
• WSF2 DP operation: No position loss given fire in one compartment. No impairment of well integrity.
• WSF1 DP operation: such fire situation may escalate into a slow drift-off, in Case 5 metocean condition. Such slow drift-off is 2.6E-04 per year in the Troll field.
• The frequency of impairment of well integrity given such slow drift-off is 1.3E-07 per year. It is negligible. The frequency may vary to 2.3E-07 per year given uncertainties of human action failure.
• Conclusion: the additional risk of impairment of well integrity is negligible, given DP operation based on WSF1 instead of WSF2 in the Troll field.
©Lloyd’s Register Consulting
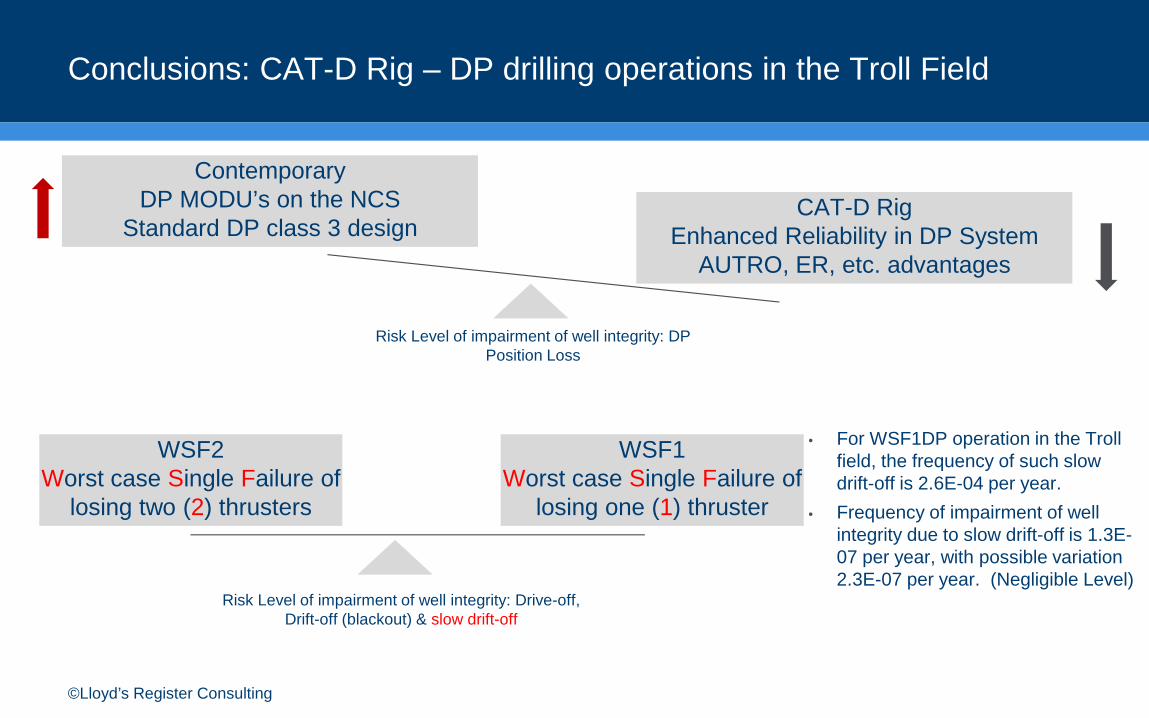
Conclusions: CAT-D Rig – DP drilling operations in the Troll Field
• For WSF1DP operation in the Troll field, the frequency of such slow drift-off is 2.6E-04 per year.
• Frequency of impairment of well integrity due to slow drift-off is 1.3E-07 per year, with possible variation 2.3E-07 per year. (Negligible Level)
WSF2Worst case Single Failure of
losing two (2) thrusters
WSF1Worst case Single Failure of
losing one (1) thruster
ContemporaryDP MODU’s on the NCS
Standard DP class 3 designCAT-D Rig
Enhanced Reliability in DP SystemAUTRO, ER, etc. advantages
Risk Level of impairment of well integrity: DP Position Loss
Risk Level of impairment of well integrity: Drive-off,Drift-off (blackout) & slow drift-off
©Lloyd’s Register Consulting
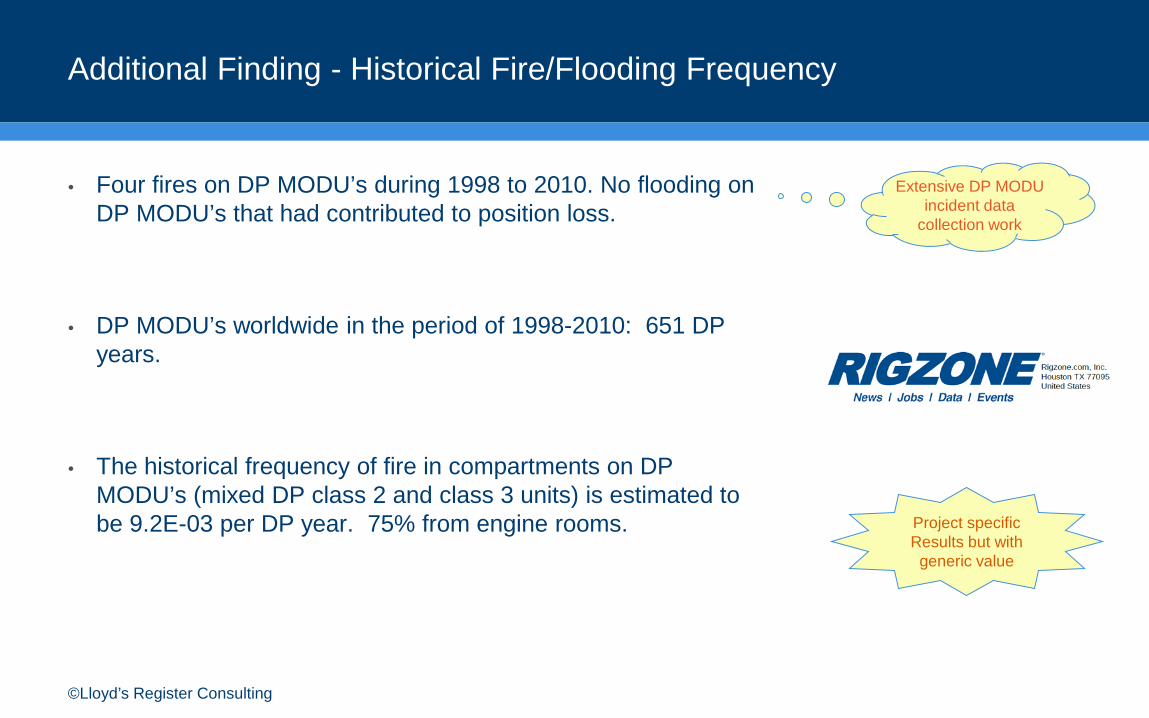
Additional Finding - Historical Fire/Flooding Frequency
• Four fires on DP MODU’s during 1998 to 2010. No flooding on DP MODU’s that had contributed to position loss.
• DP MODU’s worldwide in the period of 1998-2010: 651 DP years.
• The historical frequency of fire in compartments on DP MODU’s (mixed DP class 2 and class 3 units) is estimated to be 9.2E-03 per DP year. 75% from engine rooms.
Extensive DP MODUincident data
collection work
Project specific Results but with
generic value
©Lloyd’s Register Consulting
Recommendations from Risk Analysis
• The risk analysis results demonstrate that DP operation based on WSF1 has equivalent well safety level as DP operation based on WSF2 in the Troll field.
• DP operation in the Troll field for CAT-D rig based on WSF1, i.e. worst case single failure of losing one thruster, meets the intention of The Activities Regulations from the Petroleum Safety Authority of Norway (Chapter XVI Maritime Operations, Section 90 Positioning) and its Guideline.
• It is also recommended that the technical and operational information and assumptions used in the risk analysis for the CAT-D rig be revisited prior to the operations in the Troll field. This is to ensure validity of the risk analysis and no hidden errors in this study.
©Lloyd’s Register Consulting
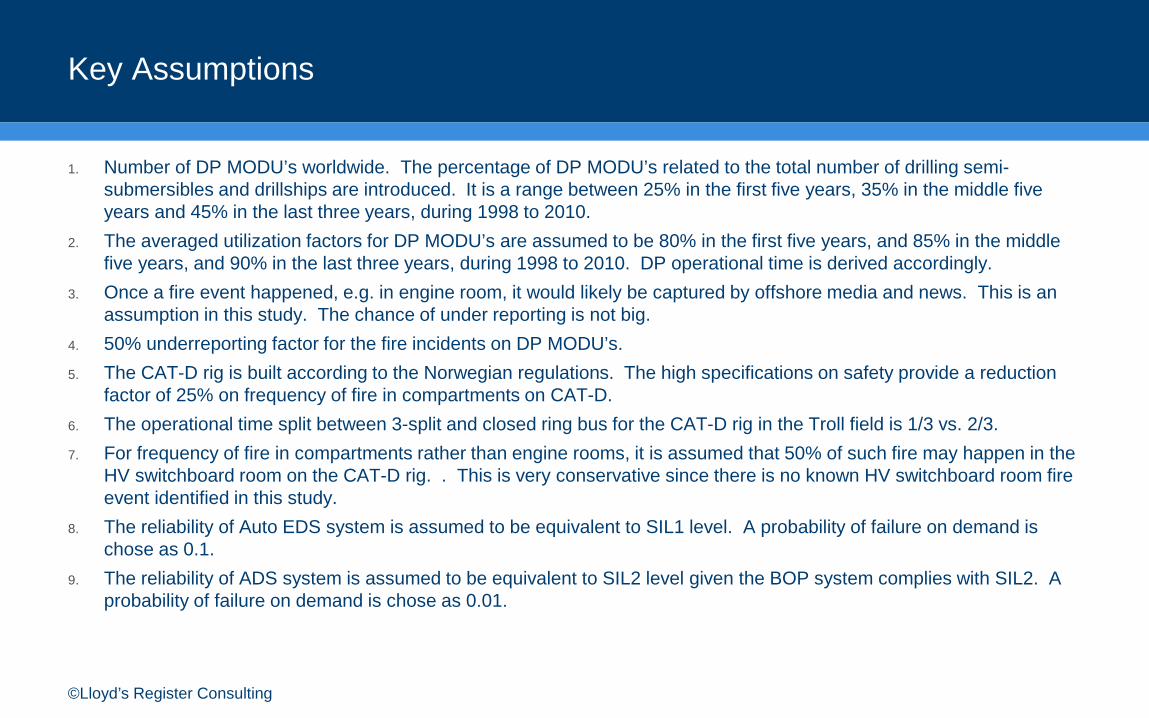
Key Assumptions
1. Number of DP MODU’s worldwide. The percentage of DP MODU’s related to the total number of drilling semi-submersibles and drillships are introduced. It is a range between 25% in the first five years, 35% in the middle five years and 45% in the last three years, during 1998 to 2010.
2. The averaged utilization factors for DP MODU’s are assumed to be 80% in the first five years, and 85% in the middle five years, and 90% in the last three years, during 1998 to 2010. DP operational time is derived accordingly.
3. Once a fire event happened, e.g. in engine room, it would likely be captured by offshore media and news. This is an assumption in this study. The chance of under reporting is not big.
4. 50% underreporting factor for the fire incidents on DP MODU’s. 5. The CAT-D rig is built according to the Norwegian regulations. The high specifications on safety provide a reduction
factor of 25% on frequency of fire in compartments on CAT-D. 6. The operational time split between 3-split and closed ring bus for the CAT-D rig in the Troll field is 1/3 vs. 2/3. 7. For frequency of fire in compartments rather than engine rooms, it is assumed that 50% of such fire may happen in the
HV switchboard room on the CAT-D rig. . This is very conservative since there is no known HV switchboard room fire event identified in this study.
8. The reliability of Auto EDS system is assumed to be equivalent to SIL1 level. A probability of failure on demand is chose as 0.1.
9. The reliability of ADS system is assumed to be equivalent to SIL2 level given the BOP system complies with SIL2. A probability of failure on demand is chose as 0.01.

©Lloyd’s Register Consulting
Key Assumptions
10. In a slow drift-off scenario due to DP operation based on WSF1 and fire incident causing loss of two thrusters, human failure to activate EDS manually is assumed to be 0.5. This is based on the available time window to perform such action (1.5 minutes) which is not long, and commercial pressure of EDS decision. It should be noted that there are clear indications on the rig to recognize such slow drift-off scenario.
11. In drive-off scenario, the human intervention is simplified to occur at 60 seconds after drive-off, and the action is to stop all thrusters and turn the drive-off into a drift-off. This is to generate representative drive-off behaviour for comparison between WSF1 and WSF2.
©Lloyd’s Register Consulting
Acknowledgement
The following individuals have also contributed to the technical work in this study, or provided technical comments to this study: Mr. Lars Adamsen and Mr. Leon Strongman in Songa Offshore, Mr. Torbjørn Hals in Kongsberg Maritime, Mr. Aleks Karlsen in DNVGL, Mr. Rune B. Andersen and Mr. Stig Olav Settemsdal in Siemens AS, and Mr. Tony Gjerde in Lloyd’s Register Consulting. The authors would like to sincerely thank them for their valuable contributions. Statoil’s permission of publication of this paper is also appreciated.
Lloyd’s Register and variants of it are trading names of Lloyd’s Register Group Limited, its subsidiaries and affiliates.Copyright © Lloyd’s Register Consulting. 2013. A member of the Lloyd’s Register group.
Working togetherfor a safer world
Haibo ChenManaging Director AsiaT +86 1380-132-0200 E [email protected]
Lloyd’s Register Consultingwww.lr.org/consulting