echi da berlino - pmi-nic.org · linear scheduling methods: a relevant alternative for all project...
TRANSCRIPT
Linear Scheduling Methods:A Relevant Alternative for All Project Managers
Maria Cristina Barbero, Director of Project Management Center of Excellence, Engineering Ingegneria Informatica
Echi da Berlino25 giugno 2018

Linear Scheduling Methods:
A Relevant Alternative for All Project Managers
May the 7th, 2018 | 11:30 AM
Maria Cristina Barbero, CSM, MBA, PMP, PMI-ACP, PMO-CP, Engineering Ingegneria Informatica
Hagit Landman, MBA, PMP, PMI-SP, H. Landman Consulting
PMI® EMEA Congress 2018
#PMIEMEA18
3
Maria Cristina Barbero
Project Manager & Consultant
Engineering Ingegneria Informatica / Nexen since 2005
Head of Center of Excellence of Project Management
Leads a team of 40 PMO-Specialists
Engaged in supporting IT organizations
Graduated in Mathematics
Background as system developer
Professor at University of Padova
Trainer of 400 Italian PMPs
PMI-ACP and CSM certified
Member of PMI Standards MAG since January 2016

4

5
Hagit Landman
Project Manager & Consultant
Over 25 years of experience in multy disciplicanry proejcts in various industries, PMO, Project management, Project managemet tools
Complex scheduling expert in various industries
Written the book - Enterprise Project Management Using Microsoft® Office Project Server 2007 Best Practices for Implementing an EPM Solution
MBA, B.Sc – Industrial Engineering
PMI’s – PMP and PMI-SP certified
Member of PMI Standards MAG since January 2014

Why a session on Linear Scheduling Method?
6
• Not just in construction
• It can be an alternative to the Critical Path Method
• Less widespread due to the diffusion of Microsoft
Office tools
• There are benefits it can bring
• Conditions under which it can be used must be known

Learning Objectives
Apply Linear Scheduling Method to a software
project or in general to a generic project
7
11
“Software Project” = Projects to develop new software and to modify existing software
(Software Extension to the PMBOK® Guide Fifth Edition)

Learning Objectives
Describe benefits of Linear Scheduling Methods
(especially) to resource management
8
22
What do I have
to do today?

Contents
9
History: Linear Scheduling Methods in construction
Theory: Main LSM characteristics and conditions
Examples and tools
A generic project (borrowed from SW industry, MS Project)
A manual representation of LSM
Import of MS Project example
Transposition of CPM representation to LSM representation
Benefits
Conclusions

History
10
Line of Balance (LOB) Scheduling Technique
Originated by the Goodyear
Company in the early 1940's and
developed by the U.S. Navy in
the early 1950's
Developed for industrial
manufacturing and production
control

History
11
Line of Balance (LOB) Scheduling Technique
Time is on one axis
Some measure of production is
on the other axis
Later in 1970 C. Jotin Khisty
applied LOB technique to the
construction industry
1
2
3
History
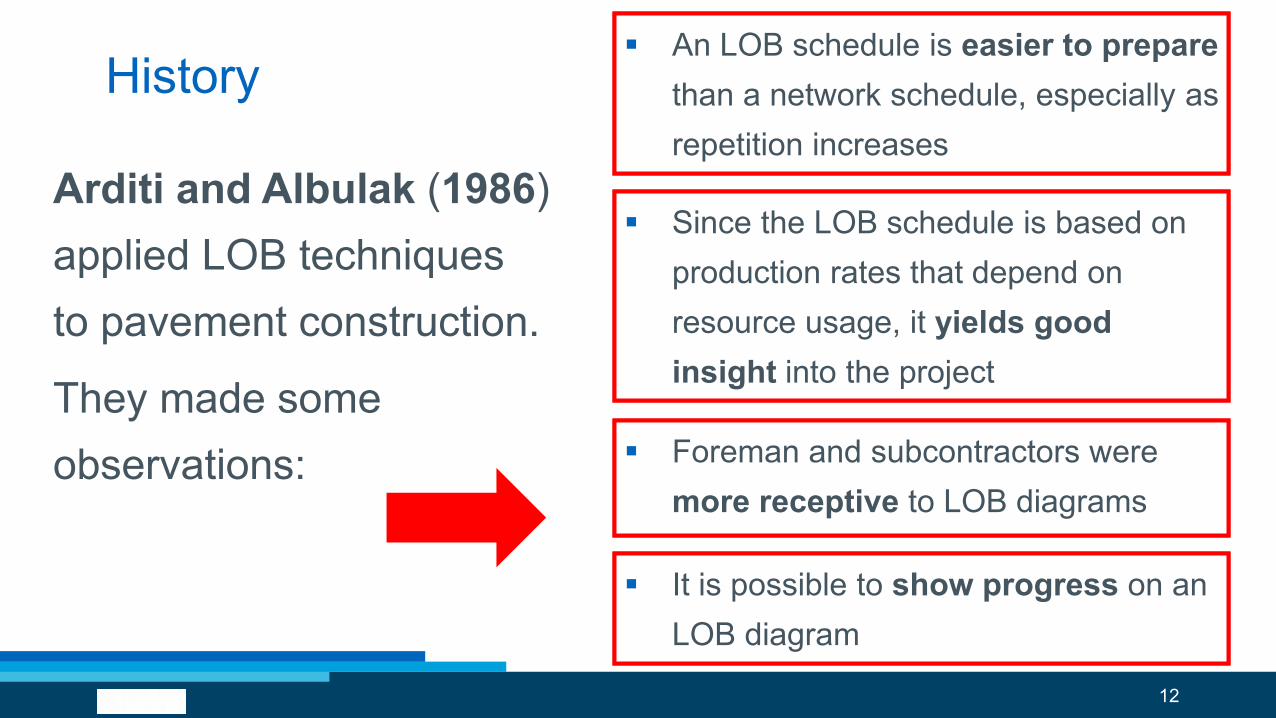
Arditi and Albulak (1986)
applied LOB techniques
to pavement construction.
They made some
observations:
An LOB schedule is easier to prepare
than a network schedule, especially as
repetition increases
An LOB schedule is easier to prepare
than a network schedule, especially as
repetition increases
Since the LOB schedule is based on
production rates that depend on
resource usage, it yields good
insight into the project
Since the LOB schedule is based on
production rates that depend on
resource usage, it yields good
insight into the project
Foreman and subcontractors were
more receptive to LOB diagrams
Foreman and subcontractors were
more receptive to LOB diagrams
It is possible to show progress on an
LOB diagram
It is possible to show progress on an
LOB diagram
12

Contents
13
History: Linear Scheduling Methods in construction
Theory: Main LSM characteristics and conditions
Examples and tools
A generic project (borrowed from SW industry, MS Project)
A manual representation of LSM
Import of MS Project example
Transposition of CPM representation to LSM representation
Benefits
Conclusions

Theory
1
2
4
3
5
6
7
14

Exercise
You have to build a «museum guide» document
where every page is a form explaining an exposed
piece made by an artist. Forms are 40. Pages are 40.
You have two teams, one of writers and one of
reviewers/validators.
Writers deliver 10 forms in 2 days.
After that, reviewers can start validating. Validation
activity on 10 forms takes 1 day.
15

Exercise
40 pages
2 teamswriters reviewers
2 days to write 10 pages 1 day to validate them

Exercise
team writers
reviewers
1-10 pages
11-20 pages
21-30 pages
31-40 pages
Day 1 Day 2 Day 3 Day 4 Day 5 Day 6 Day 7 Day 8 Day 9 Day 10
team writers
reviewers
Writing
Validating
Day 1 Day 2 Day 3 Day 4 Day 5 Day 6 Day 7 Day 8 Day 9 Day 10
17

team writers
reviewers
day 10
day 9
day 8
day 7
day 6
day 5
day 4
day 3
day 2
day 1
10 pages 20 pages 30 pages 40 pages
Exercise
18

Exerciseteam writers
reviewers
day 10
day 9
day 8
day 7
day 6
day 5
day 4
day 3
day 2
day 1
10 pages 20 pages 30 pages 40 pages
team writers
reviewers
day 10
day 9
day 8
day 7
day 6
day 5
day 4
day 3
day 2
day 1
10 pages 20 pages 30 pages 40 pages
19
Theory
We cannot recap here all what could be said on Linear
Scheduling Method
We took the work done in 1995 by David John Harmelink at
Iowa State University in collaboration with the Iowa Department
of Transportation, as the basis for our considerations
For experts, what we are going to say can seem semplicistic: we
wanted to have you all able to follow the reasoning
20

Theory – LSM graphical entities
Linear activity: an activity
that progresses along a
physical path
Duration
The activity goes slower in
its second part
21

Theory – LSM graphical entities
Block activity: an activity that
occupies an area on the
project for a period of time
Bar activity: An activity or
group of activities that occur at
a particular location
22

Theory Milestone
23

Theory – Conditions
Activities express the production of something
The rate of production is constant for a single activity until it
changes its slope
Effective when the project has few types of activities even with
several production rates (slopes)
24

Contents
25
History: Linear Scheduling Methods in construction
Theory: Main LSM characteristics and conditions
Examples and tools
A generic project (borrowed from SW industry, MS Project)
A manual representation of LSM
Import of MS Project example
Transposition of CPM representation to LSM representation
Benefits
Conclusions


27
http://www.turbo-chart.com/930 Activities
1
2
4
35 3

Contents
28
History: Linear Scheduling Methods in construction
Theory: Main LSM characteristics and conditions
Examples and tools
A generic project (borrowed from SW industry, MS Project)
A manual representation of LSM
Import of MS Project example
Transposition of CPM representation to LSM representation
Benefits
Conclusions
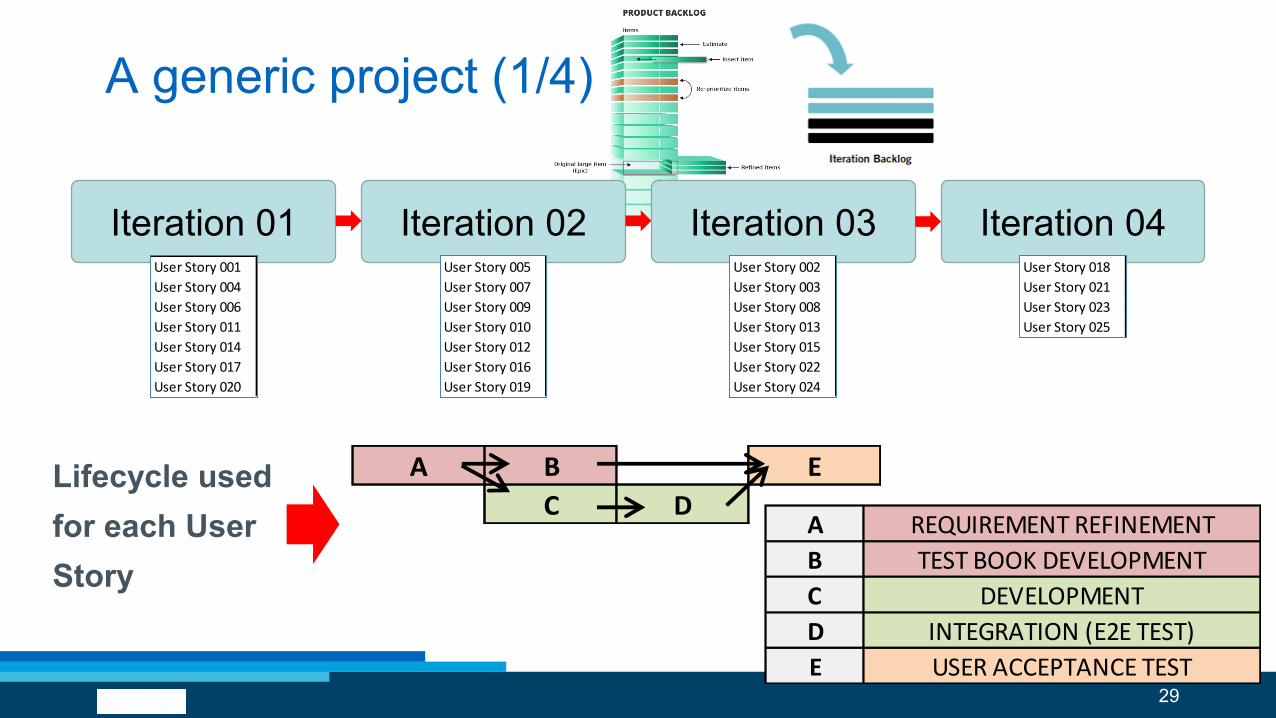
A generic project (1/4)
Iteration 01 Iteration 02 Iteration 03 Iteration 04User Story 001
User Story 004
User Story 006
User Story 011
User Story 014
User Story 017
User Story 020
User Story 001
User Story 004
User Story 006
User Story 011
User Story 014
User Story 017
User Story 020
User Story 005
User Story 007
User Story 009
User Story 010
User Story 012
User Story 016
User Story 019
User Story 005
User Story 007
User Story 009
User Story 010
User Story 012
User Story 016
User Story 019
User Story 002
User Story 003
User Story 008
User Story 013
User Story 015
User Story 022
User Story 024
User Story 002
User Story 003
User Story 008
User Story 013
User Story 015
User Story 022
User Story 024
User Story 018
User Story 021
User Story 023
User Story 025
User Story 018
User Story 021
User Story 023
User Story 025
Lifecycle used
for each User
Story
A B E
C D
29
A REQUIREMENT REFINEMENT
B TEST BOOK DEVELOPMENT
C DEVELOPMENT
D INTEGRATION (E2E TEST)
E USER ACCEPTANCE TEST

A B C D E 71,5 125,0 36,0 232,5
ITERATION USER STORY REQ REF TEST DES DEV I TEST UAT DAYS T1 DAYS T2 DAYS T3 DAYS % %
IT 01 User Story 001 2,0 0,5 3,0 1,5 1,0 2,5 4,5 1,0 8,0 31% 56%
IT 01 User Story 004 2,5 1,0 4,0 2,0 2,0 3,5 6,0 2,0 11,5 30% 52%
IT 01 User Story 006 3,0 1,0 4,5 2,5 2,0 4,0 7,0 2,0 13,0 31% 54%
IT 01 User Story 011 3,0 1,0 4,5 2,5 2,0 4,0 7,0 2,0 13,0 31% 54%
IT 01 User Story 014 1,0 0,5 1,5 1,0 1,0 1,5 2,5 1,0 5,0 30% 50%
IT 01 User Story 017 1,0 0,5 1,5 1,0 1,0 1,5 2,5 1,0 5,0 30% 50%
IT 01 User Story 020 1,0 0,5 1,5 1,0 1,0 1,5 2,5 1,0 5,0 30% 50%
A generic project (2/4)
30
TEAM 1 SIZE 1 FTE
TEAM 2 SIZE 2 FTE
TEAM 3 SIZE 1 FTE11
22 Evaluation in manday for every user story
A REQUIREMENT REFINEMENT
B TEST BOOK DEVELOPMENT
C DEVELOPMENT
D INTEGRATION (E2E TEST)
E USER ACCEPTANCE TEST

A generic project (3/4)
31
A REQUIREMENT REFINEMENT
B TEST BOOK DEVELOPMENT
C DEVELOPMENT
D INTEGRATION (E2E TEST)
E USER ACCEPTANCE TEST
1 2 3 4 5 6 7 8 9 10 11 12 13 14 15 16 17 18 19 20 21 22 23 24 25
IT 01 User Story 001
IT 01 User Story 004
IT 01 User Story 006
A B C D E 71,5 125,0 36,0 232,5
ITERATION USER STORY REQ REF TEST DES DEV I TEST UAT DAYS T1 DAYS T2 DAYS T3 DAYS % %
IT 01 User Story 001 2,0 0,5 3,0 1,5 1,0 2,5 4,5 1,0 8,0 31% 56%
IT 01 User Story 004 2,5 1,0 4,0 2,0 2,0 3,5 6,0 2,0 11,5 30% 52%
IT 01 User Story 006 3,0 1,0 4,5 2,5 2,0 4,0 7,0 2,0 13,0 31% 54%
IT 01 User Story 011 3,0 1,0 4,5 2,5 2,0 4,0 7,0 2,0 13,0 31% 54%
IT 01 User Story 014 1,0 0,5 1,5 1,0 1,0 1,5 2,5 1,0 5,0 30% 50%
IT 01 User Story 017 1,0 0,5 1,5 1,0 1,0 1,5 2,5 1,0 5,0 30% 50%
IT 01 User Story 020 1,0 0,5 1,5 1,0 1,0 1,5 2,5 1,0 5,0 30% 50%
A B E
C D

32
Contents
33
History: Linear Scheduling Methods in construction
Theory: Main LSM characteristics and conditions
Examples and tools
A generic project (borrowed from SW industry, MS Project)
A manual representation of LSM
Import of MS Project example
Transposition of CPM representation to LSM representation
Benefits
Conclusions

34

Team Planner
35

36
37
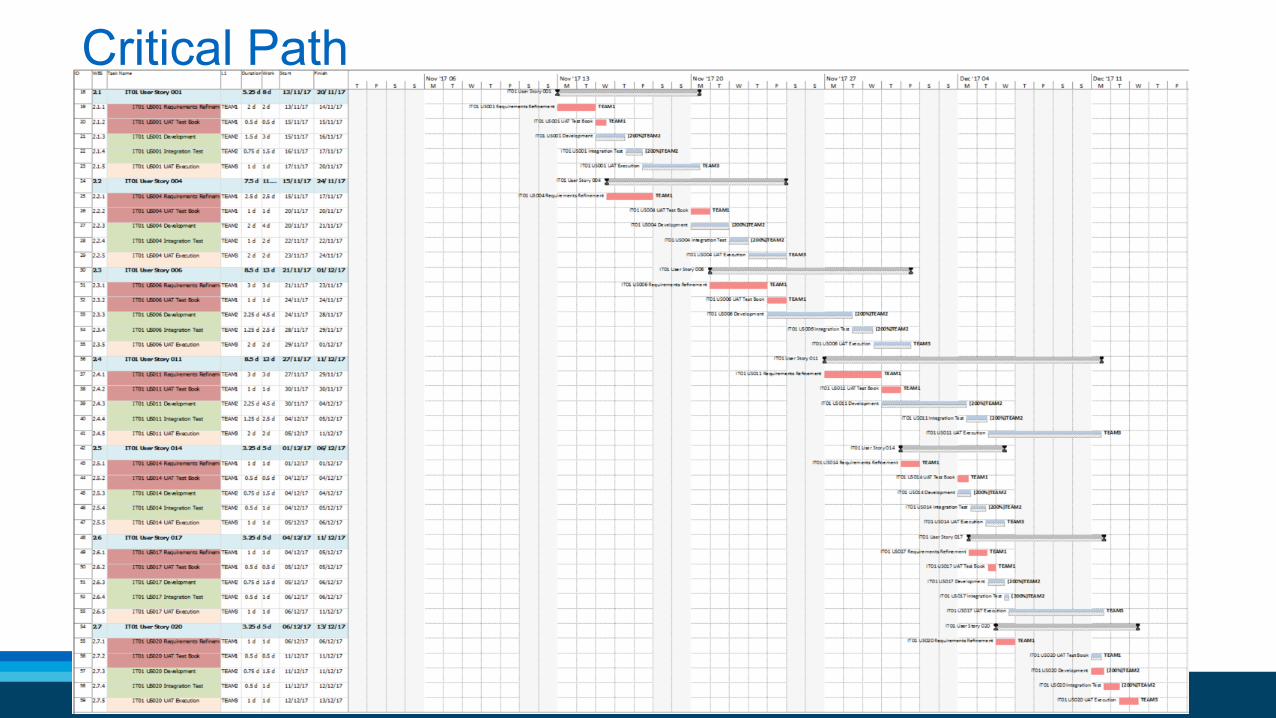
Critical Path

38

CPM Scheduling vs Linear Scheduling
39
CPM-based scheduling
Has evolved over the past several
decades
Unable to accurately model
projects consisting of linear work
The only means by which a linear
activity can be modeled by CPM is
to artificially break the activity up
Number of activity and relationships
becomes so complicated tht the
value-added by the schedule is
significantly impacted
Linear Scheduling
Have been in existence long before
Linear scheduling provides a means
of modeling linear activities as a
continuous set of points on a line
rather than discrete events
Productivity can vary in any way
necessary to accurately model the
expected productivity of an activity
The non-linear rate and the affect it
has on subsequent linear activities is
impossible to model using CPM

Contents
40
History: Linear Scheduling Methods in construction
Theory: Main LSM characteristics and conditions
Examples and tools
A generic project (borrowed from SW industry, MS Project)
A manual representation of LSM
Import of MS Project example
Transposition of CPM representation to LSM representation
Benefits
Conclusions

Benefits
41
• Visualization
• Goal is to optimize the productivity and minimize idleness of the
teams, reduce project duration
• Traditional CPM schedules and network diagrams fail to provide
visual connection between the resources and the activities
• Useful tool for project managers and team leaders for planning
• Supports Matrix resource planning

Conclusions
Focus on deliverable/products more than time - Any point
along the activity path defines the activity in terms of product
and time. Conversely in CPM activity only has start-end time
Focus on productivity rate - The activity’s slope shows
productivity at any point in time
Focus on resources / team allocation – Linear Scheduling
graphes are readable and give evidence to idle time
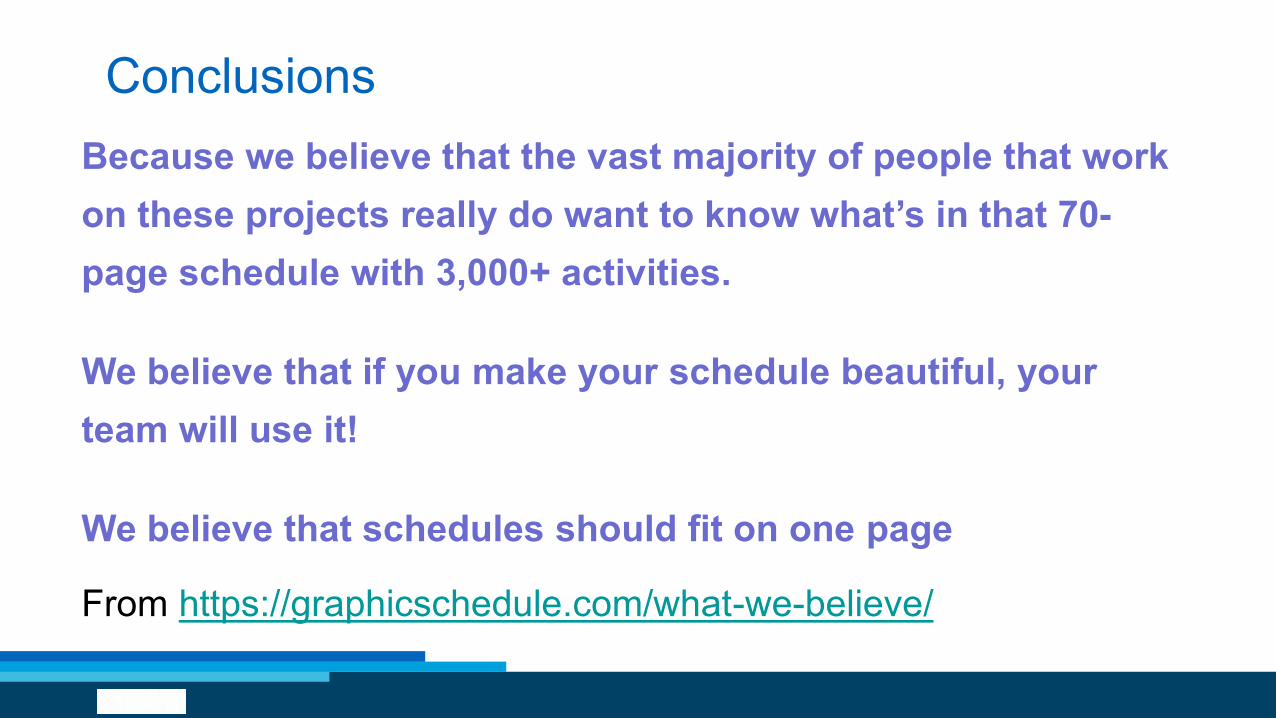
Conclusions
Because we believe that the vast majority of people that work
on these projects really do want to know what’s in that 70-
page schedule with 3,000+ activities.
We believe that if you make your schedule beautiful, your
team will use it!
We believe that schedules should fit on one page
From https://graphicschedule.com/what-we-believe/

Recap: Back to learning objectives
44
Apply Linear Scheduling Method to a software
project or in general to a generic project
11
Describe benefits of Linear Scheduling Methods
(especially) to resource management
22
Evaluate this Session!
45
Provide your feedback via the event mobile app by completing a
brief evaluation!
If you bookmarked/added this session to your Personal
Agenda… a link to the survey is now in your activity feed! Tap the
post to get started.
Or, to access the survey:
• Select Agenda
• Select session
• Tap Take Survey at the bottom of the screen.
#PMIEMEA18

Back up
46

History
47
LOB Diagram schedules
or records the cumulative
events of unit completion
versus time
LOB Diagram

History C. Jotin Khisty, 1970
A SIMPLE, AND
EFFECTIVE MEANS OF
CONTROL IS THE "LINE
OF BALANCE"
TECHNIQUE, WHICH CAN
BE APPLIED TO A WIDE
VARIETY OF
CONSTRUCTION
PROGRAMS

History
Al Sarraj (1990) & others presented a formal development
of LOB method and the required algorithms to put the
technique on a mathematical basis By using the developed
program it is possible to find the project duration, the actual delivery schedule,
and all related information regardless of the size of the project.
David John Harmelink 1995 – Linear Scheduling Model: the
development of a LS Model with micro computer applications for
highway construction project control
Yi Su; Gunnar Lucko; 2015 - Comparison and Renaissance of Classic
Line-of-Balance and Linear Schedule Concepts for Construction Industry
Mattila and Park 2003 - Comparison of linear scheduling model and
repetitive scheduling method
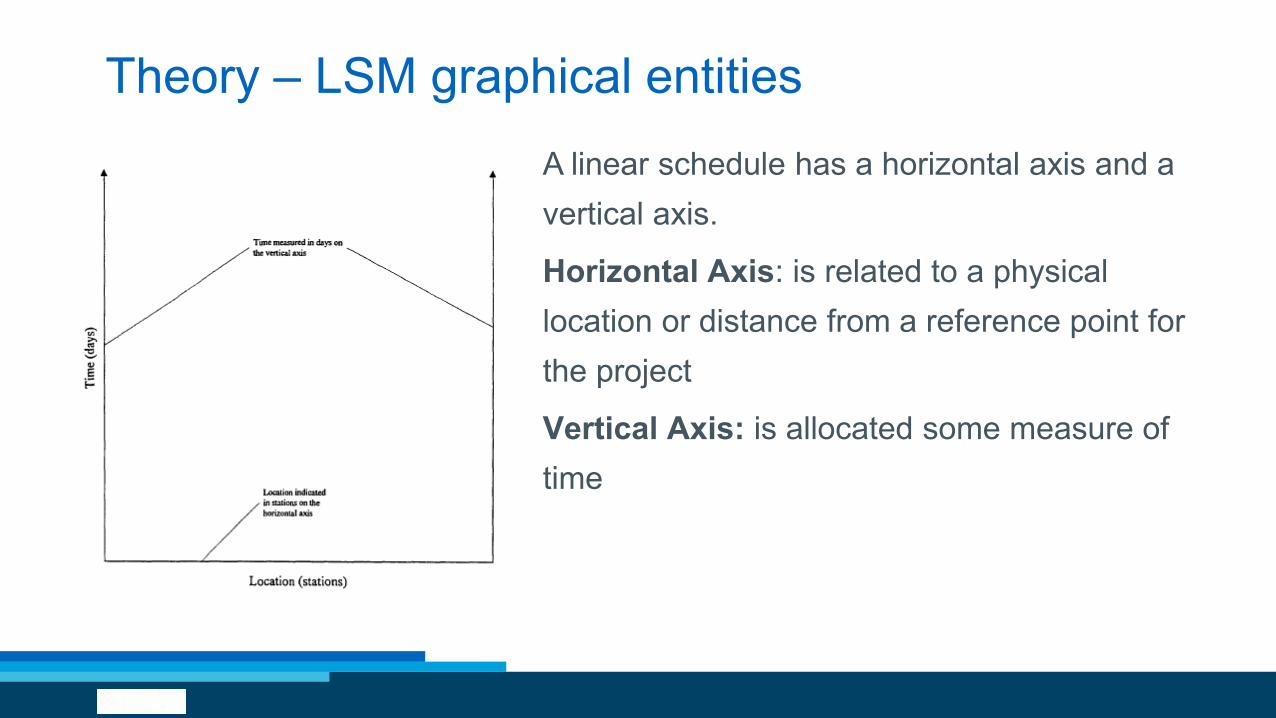
Theory – LSM graphical entities
A linear schedule has a horizontal axis and a
vertical axis.
Horizontal Axis: is related to a physical
location or distance from a reference point for
the project
Vertical Axis: is allocated some measure of
time

Theory - Sequencing

Disclaimer
• The views and opinions expressed in the following PowerPoint
slides are those of the individual presenter.
• These PowerPoint slides are protected under the copyright laws
of the United States of America and other countries. Used by
permission. All rights reserved. Project Management Institute
and PMI are registered trademarks. All other trademarks are the
property of their respective owners.
• The PowerPoint slides are for registered attendees of PMI
EMEA Congress.
52