eco-ideation and eco-selection of r&d projects portfolio
TRANSCRIPT
HAL Id: hal-01186346https://hal.archives-ouvertes.fr/hal-01186346
Submitted on 24 Aug 2015
HAL is a multi-disciplinary open accessarchive for the deposit and dissemination of sci-entific research documents, whether they are pub-lished or not. The documents may come fromteaching and research institutions in France orabroad, or from public or private research centers.
L’archive ouverte pluridisciplinaire HAL, estdestinée au dépôt et à la diffusion de documentsscientifiques de niveau recherche, publiés ou non,émanant des établissements d’enseignement et derecherche français ou étrangers, des laboratoirespublics ou privés.
Eco-ideation and eco-selection of R&D projects portfolioin complex systems industries
François Cluzel, Bernard Yannou, Dominique Millet, Yann Leroy
To cite this version:François Cluzel, Bernard Yannou, Dominique Millet, Yann Leroy. Eco-ideation and eco-selection ofR&D projects portfolio in complex systems industries. Journal of Cleaner Production, Elsevier, 2016,112 (5), pp.4329-4343. �10.1016/j.jclepro.2015.08.002�. �hal-01186346�
1
Eco-ideation and eco-selection of R&D projects portfolio in complex
systems industries
François Cluzel1, Bernard Yannou1, Dominique Millet2, Yann Leroy1
1CentraleSupélec, Laboratoire Genie Industriel, Grande Voie des Vignes, 92290 Chatenay-Malabry, France
Phone: +33 (0)1 41 13 13 28
Fax: +33 (0)1 41 13 12 72
Email: [email protected]
2Université de Toulon, Seatech-Supméca, 83000 Toulon, France
Abstract: Eco-innovation methodologies and tools are being applied in companies to an increasing extent. None
of them, however, are particularly adapted to complex systems industries, where the eco-design requirements
are highly specific. These systems are characterized by large size and mass, and relatively long and uncertain
life cycles. The associated organization is also complex as there are multiple highly specialized experts, who
rarely collaborate, and much less so on environmental aspects. In this paper, an adapted eco-innovation process
based on the eco-design strategy wheel is proposed for use with a working group of internal technical experts. A
first phase involves generating a high number of potential eco-innovative R&D projects that are then analyzed
and assessed using an appropriate multi-criteria grid. Three structured filters enable an informed selection of
the most promising projects that will then make up a balanced R&D project portfolio. The whole process has
been successfully applied at Alstom Grid on large electrical stations used in the primary aluminium industry.
Keywords: Eco-design, eco-innovation, complex industrials system, R&D project portfolio, creativity.
1. Introduction
With heightening awareness of the impact of human activities on the environment, environmental concerns have
become increasingly important. In companies, this has resulted in a need to respond to new environmental
requirements and regulations (Bey et al., 2013). From this perspective, eco-design allows us to consider, manage
and improve the environmental performance of products, processes and services (ISO 14006:2011).
However, if this approach is now recognized and well deployed in competitive mass-consumer goods producers
(Business to Consumer, B to C), the situation is not so advanced in B to B (Business to Business) industries, in
2
particular for complex industrial systems. They are characterized by a long and uncertain life cycle, involving a
high number of subsystems and components or strong interactions with their environment (Cluzel et al., 2012).
The technological and regulatory constraints associated with these systems may slow down the ability to
innovate, as reliable technologies proven over the long-term are often favored. Nevertheless, the need for eco-
innovation is clearly present, as these systems are linked to substantial environmental impacts.
However, eco-innovation on complex industrial systems is a challenging task. R&D projects in complex systems
industries are often driven by technological, not environmental, considerations. These projects need to be
identified fairly early in the design process, with little information available. On the other hand, it is generally
agreed that environmental-oriented R&D (Research & Development) projects are necessary, but the complexity
of the products and organization makes it tricky to introduce an eco-innovation approach. This type of
organization is characterized by multiple highly-specialized experts, who rarely communicate together.
Furthermore, only a few are trained in eco-design or Life Cycle Assessment (LCA). This is why a simple and
effective eco-innovation method is necessary, requiring little preliminary environmental knowledge. This would
make the collaboration between multidisciplinary experts possible.
This paper proposes one such intuitive eco-innovation methodology to answer to the following research
question: how to generate and select an adapted portfolio of eco-innovative R&D projects for a complex
industrial system? From a classical ideation phase, based on the eco-design strategy wheel (Brezet and Van
Hemel, 1997), and a simple scoring model taking five dimensions into consideration - including potential
environmental benefits - a powerful portfolio of eco-innovative R&D projects is identified via three successive
filters using limited resources. The whole eco-innovation process is then deployed at Alstom Grid on complex
electrical substations.
Section 2 presents a literature review of eco-innovation and R&D project evaluation and selection for complex
industrial systems. In section 3, an adapted methodology is introduced. Section 4 deals with the application of
this process at Alstom Grid. Section 5 tests the robustness of the model and discusses the validity of the results.
Concluding remarks and perspectives are presented in section 6.

3
2. Literature review
2.1 Complex industrial systems
This paper focuses on complex industrial systems whose specificities have yet to be taken into account in eco-
design and eco-innovation: these are industrial systems where complexity induces major issues in terms of
modelling, prediction or configuration. From the systems engineering domain (Blanchard and Fabrycky, 2011),
we define a complex industrial system in the eco-design vein as (Cluzel et al., 2012):
A large-scale system in terms of sub-systems and components, mass and resource usage;
A system whose life cycle is unpredictable at the design level in the long-term, in particular with regard
to its lifetime, upgrades, maintenance and end-of-life;
A system whose sub-systems may have different life cycles and different obsolescence times;
A system which is in close interaction with its environment (e.g. super system, geographic site);
A system which is supervised by human decisions and management.
Concerning eco-innovation, the main problem of such systems is that the customers’ specifications or the
regulations and standards severely limit the ability to radically innovate, as only long-term proven technologies
are used. Thus, the challenge associated with an eco-innovation approach is how to identify a set of reliable
incremental eco-innovative projects, and/or to be able to make radical eco-innovations possible which are
acceptable to customers.
2.2 Eco-innovation
Eco-innovation is an emerging field, for which there are numerous definitions and tools in the literature.
2.2.1 Definition
Eco-innovation has been associated with numerous definitions in recent years. Carrillo-Hermosilla et al. (2010)
list, for example, 16 different definitions, before proposing the following: an eco-innovation is “an innovation
that improves environmental performance, in line with the idea that the reduction in environmental impacts
(whether intentional or not) is the main distinguishing feature of eco-innovation”. This specifically includes
innovations where the reduction in environmental impacts is a side-effect, and not the main or initial goal. More
importantly, it also includes radical and incremental innovations.
4
For other authors, an eco-innovation is necessarily radical. This is highlighted by Tyl (2011), and also clearly
expressed by Collado-Ruiz and Ostad-Ahmad-Ghorabi (2010). But Pujari (2006) also shows that few eco-
innovations are really radical with regards to mass-consumer goods. In some other definitions, an eco-innovative
product is significantly less environmentally harmful than the existing ones, but O’Hare (2010) highlights the
fact that “different companies may have different opinions as to what constitutes a ‘significant’ improvement in
environmental performance”.
Given the hierarchical nature of complex industrial systems, as well as the fact that radical changes are rarely
acceptable for customers in complex system industries, the eco-innovation framework defined by Carrillo-
Hermosilla et al. is well adapted to complex industrial systems: “Eco-innovations, particularly when they are
radical and require techno-institutional system-level changes, are difficult to achieve because the prevailing
system may act as a barrier to the creation and diffusion of a new system” (Carrillo-Hermosilla et al., 2010).
2.2.2 Eco-ideation tools
An eco-innovation approach indicates two major activities: eco-ideation, defined as the generation of ideas that
reduce environmental impacts throughout the product life cycle of products (Bocken et al. 2011), and the
evaluation and selection of the most promising ideas (Jones et al., 2001). This paragraph studies eco-ideation and
the associated methods and tools. Section 2.3 deals with the evaluation and selection of R&D projects, a field as
will be seen below that it extends beyond eco-innovation. Indeed Byggeth and Hochschorner (2006) state for
example that eco-design and eco-innovation tools usually lack strategic planning considerations.
Regarding the eco-ideation process itself, expert groups are widely used through creativity sessions (Bocken et
al., 2011). Pujari (2006) shows that multidisciplinarity in the working group is a key factor for success in eco-
innovation. Finally, eco-ideation processes in companies are often performed as classical creativity sessions
supported by an eco-innovation tool. Different eco-ideation tools are well known or regularly referred to in the
literature, such as the eco-design strategy wheel (Brezet and Van Hemel, 1997; van Hemel and Cramer, 2002),
also known as the LiDS (Life cycle Design Strategy) wheel, Eco-compass (Fussler and James, 1997), Product
Ideas Tree (Jones et al., 2001), BEC (Business-Environment-Customer) synergy diagram (O’Hare et al., 2007),
or TRIZ-based tools (TRIZ is the Russian acronym for Theory of Inventive Problem Solving). Baumann et al.
(2002) and Bovea and Pérez-Belis (2012) classify eco-design and eco-innovation tools.
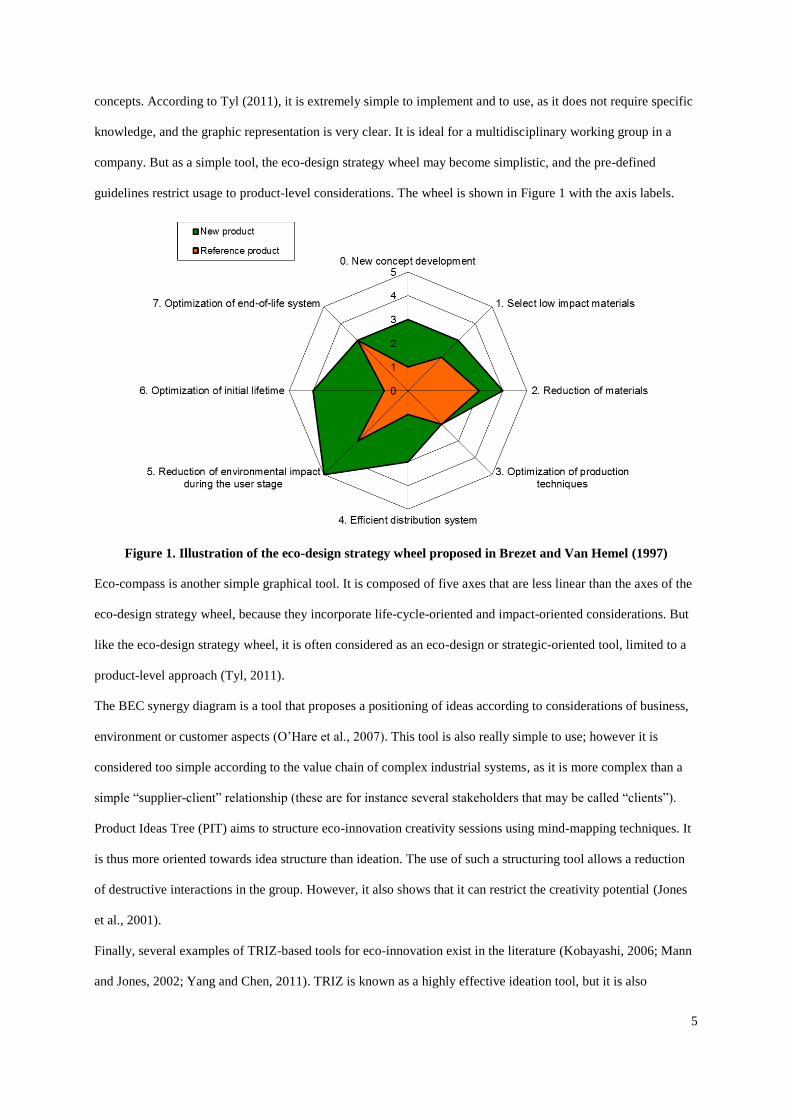
The eco-design strategy wheel is a simple tool that proposes eco-design guidelines divided into eight axes on a
graphic wheel. Seven axes cover the life cycle of the product, whereas the last one aims at identifying new
5
concepts. According to Tyl (2011), it is extremely simple to implement and to use, as it does not require specific
knowledge, and the graphic representation is very clear. It is ideal for a multidisciplinary working group in a
company. But as a simple tool, the eco-design strategy wheel may become simplistic, and the pre-defined
guidelines restrict usage to product-level considerations. The wheel is shown in Figure 1 with the axis labels.
Figure 1. Illustration of the eco-design strategy wheel proposed in Brezet and Van Hemel (1997)
Eco-compass is another simple graphical tool. It is composed of five axes that are less linear than the axes of the
eco-design strategy wheel, because they incorporate life-cycle-oriented and impact-oriented considerations. But
like the eco-design strategy wheel, it is often considered as an eco-design or strategic-oriented tool, limited to a
product-level approach (Tyl, 2011).
The BEC synergy diagram is a tool that proposes a positioning of ideas according to considerations of business,
environment or customer aspects (O’Hare et al., 2007). This tool is also really simple to use; however it is
considered too simple according to the value chain of complex industrial systems, as it is more complex than a
simple “supplier-client” relationship (these are for instance several stakeholders that may be called “clients”).
Product Ideas Tree (PIT) aims to structure eco-innovation creativity sessions using mind-mapping techniques. It
is thus more oriented towards idea structure than ideation. The use of such a structuring tool allows a reduction
of destructive interactions in the group. However, it also shows that it can restrict the creativity potential (Jones
et al., 2001).
Finally, several examples of TRIZ-based tools for eco-innovation exist in the literature (Kobayashi, 2006; Mann
and Jones, 2002; Yang and Chen, 2011). TRIZ is known as a highly effective ideation tool, but it is also

6
perceived as a complex approach. Tyl (2011) also states that the TRIZ innovative principles do not adequately fit
the eco-innovation principles and need to be reworked. He proposes a TRIZ-based tool, EcoASIT, which offers
good performance in the eco-ideation phase. In this paper, we focus more on the project selection phase, and that
is why a very simple and appropriable tool is adopted later.
These tools are able to support an eco-ideation process. However, they do not ensure an effective and multi-
criteria evaluation and selection step of the most promising ideas. Currently “there are more opportunities and
concepts than can be supported with the funding available within the company” (O’Hare, 2010). The next
section considers general methods in the field.
2.3 Evaluation and selection of R&D projects
Once eco-innovation projects have been generated, it is then necessary to identify the optimal mix of R&D
projects to undertake. Indeed the number of projects selected by a working group may be too high compared to
the available resources in the company. It is crucial to feed the management decisions with accurate data and
adapted tools to select an optimal R&D project portfolio. Related methods are considered in the next paragraph.
2.3.1 Overview of the methods
Some interesting methods to select eco-innovative alternatives exist in the eco-design field. Bocken et al. (2012)
propose the pain/gain tool to evaluate options. However, evaluating the environmental benefits of options
requires being able to define those options. In this paper, eco-innovative propositions concern wider R&D fields
it would be interesting to investigate rather than detailed options. That is why the field of R&D project
evaluation and selection and R&D portfolio management are considered.
A significant panel of methods and tools have been produced during recent decades. Mikkola (2001) notes that
“portfolio techniques are powerful tools in that they allow products and R&D projects to be analysed in a
systematic manner, providing an opportunity for the optimization of a company’s long term growth and
sustainability”. Methods such as Weighted Objectives Method, Analytical Hierarchy Process (AHP) or QFD
matrix are not considered in this paper as they are not particularly well-adapted to assessing the (eco-)innovation
potential of ideas (Justel et al., 2007).
Cooper et al. (1999) propose a classification of portfolio management techniques. The authors distinguish
between financial models, strategic approaches, scoring models and checklists, analytical hierarchy approaches,
behavioural approaches and mapping approaches (or bubble diagrams). Cooper et al. (1999) also state that

7
mathematical models are not really deployed in companies, because they need a large amount of precise data and
they are difficult to manage and to use for managers. Another point highlighted by Bitman and Sharif (2008) or
Lawson et al. (2006) is that the methods based only on financial aspects do not yield the best results.
Finally, Cooper et al. (1999) show that a sound method should allow for:
Identifying the right number of projects;
Avoiding gridlocks in the portfolio;
Highlighting high value projects;
Ensuring a balanced portfolio (for instance long term versus short term);
Being aligned with company strategy.
Among all the methods, scoring models are well-known and popular, mainly because they are easy to use and
give acceptable results. They are also in line with previous success criteria. The next paragraph focuses on these
models.
2.3.2 Scoring models
Scoring “is the process of assigning ordinal scale values to R&D projects for the purpose of ranking the projects
with respect to some criteria” (Henriksen and Palocsay, 2008). Scoring models are simple, direct, effective and
flexible (Bitman and Sharif, 2008). They show a balanced ratio between rigor and the time spent on the study
(Henriksen and Palocsay, 2008). Projects are rated and scored according to several qualitative or quantitative
indicators. Henriksen et al. define scoring as “the process of assigning ordinal scale value to R&D projects for
the purpose of ranking the projects with respect to some criteria” (Henriksen and Palocsay, 2008). The
weighting of the criteria enables a customization of the model for special needs (Cooper et al., 1999).
One of the main advantages of a scoring model is its ability to be easily implemented in companies. In fact, and
contrary to mathematical or financial models, the use of qualitative scales allows wide diffusion of the tools, for
example through an Excel sheet or a questionnaire. Examples of such approaches are given in (Henriksen and
Palocsay, 2008) and in (Apperson et al., 2005).
However, the success of a scoring approach is clearly linked to the selection of sound variables and indicators
(Mikkola, 2001). References from the existing literature often propose some categories to consider. For Coldrick
et al. (2005), information concerning markets, customer needs, competitors and regulatory and environmental
concerns need to be taken into account. In addition to ‘classical’ financial factors, Apperson et al. (2005)
consider four general areas: external forces (including environmental impacts), marketing, company dynamics,

8
and technical capabilities. However, among these different categories, environmental aspects are sometimes
mentioned, but never analysed in depth.
A research gap is thus emerging from both the literature and the industrial diagnosis. On one hand, companies
dealing with complex industrial systems need eco-innovation methods and tools. But on the other hand, existing
methods and tools, in the eco-innovation filed or in the evaluation and selection of R&D projects field, are not
adapted to this particular context, or they cover only partially the R&D development process. That is why the
authors ask the following research question: how to generate and select an adapted portfolio of eco-innovative
R&D projects for a complex industrial system? Based on the literature review, an adapted eco-innovation
methodology for complex industrial systems is proposed in the next section.
3. Methodology
An industrial audit was conducted over a period of several months at Alstom Grid (see Section 4). We propose
that an adapted and effective eco-innovation methodology for complex industrial systems should:
Consider the different system levels (components, subsystems, system, etc.), as incremental innovations
that are constantly made at a component or subsystem level, while radical innovations are more likely to
appear at a system level (new unexpected architecture),
Be very simple, as multidisciplinary knowledge is required to consider all the aspects of such a large-
scale system, i.e. the process mainly involves non-environmental experts,
Be flexible, implantable within a short time-frame with limited resources, and easily accepted by the
management and the experts involved,
Be very efficient, reaching the best possible ratio between resources used and results,
Build a strong basis for future eco-design work, both to maximize the learning potential of the process
and to maximize the success rate of the identified R&D projects,
Take into account multi-criteria aspects, by considering technical, economic and marketing dimensions,
to be easily accepted,
Provide strong proof in terms of feasibility and interest for the customers, so as to be successful on the
markets.
Considering these requirements and due to the fact that a significant number of eco-design tools are built and
not fully tested in real conditions (Baumann et al., 2002), our methodology is based on a pre-existing eco-
ideation tool. However, it does not seem possible to give in-depth training to the working group, whether it

9
concerns eco-design or creativity tools. The ideal tool to assist creativity should give predefined stimuli based on
checklists or guidelines. The eco-design strategy wheel is chosen according to its simplicity and the good
adequation of the axes’ contents with complex industrial systems. This choice is in line with the requirements
summarized by O’Hare to increase the industrial adoption of design tools, one of which is for instance to
“decrease the level of effort required to apply the tool or the complexity of the tool” (O’Hare, 2010).
However, the eco-design strategy wheel does not propose any post-processing treatment of the generated ideas,
i.e. there is no process to evaluate and select the most promising ideas. R&D projects associated with complex
industrial systems may be long-term studies, and they would probably be too numerous for available resources.
It is thus essential to build an adapted portfolio of R&D projects through multi-criteria assessment of each
project, even if it is based mainly on qualitative evaluations. The participation of a multidisciplinary working
group appears to be the best way to obtain complete knowledge of the system.
The next paragraph proposes an adapted eco-innovation process for complex industrial systems, based on a
multidisciplinary working group, supported by the eco-design strategy wheel and using an original scoring
model for R&D project evaluation and selection.
3.1 Prerequisites and general approach
The eco-innovation process for complex industrial systems presented is this paper is part of a larger
methodology described in (Cluzel et al., 2012) and built on the following hypotheses:
Eco-innovation is deployed in a company providing complex industrial systems, but with no specific
knowledge in eco-design/eco-innovation;
The approach is supported by at least one eco-design expert;
An environmental evaluation (Life Cycle Assessment or simplified LCA) has identified high impacting
elements (materials, components, subsystems, life cycle phases) of the complete system life cycle.
Moreover, as expressed widely in research, one major success factor is the support of the management of the
company (McAloone, 1998; O’Hare, 2010). This ensures in particular the ability to build a multidisciplinary
working group, if department managers give their acceptance to include their experts in the working group.
The choice of a collaborative approach as opposed to an individual one is justified by the fact that the global
vision of a complex industrial system is necessarily shared by several persons with different knowledge (product,
life cycle, technical aspects, design process, customers etc.). That is why the main departments of the company
need to be represented: R&D, engineering, commercial & marketing, sourcing…. 6 to 10 participants is

10
generally perceived as the optimal number for an efficient creativity process. The eco-design expert required to
support the approach is the leader of the creativity sessions.
The objective of the eco-innovation process is to identify a set of pertinent environmental improvement projects
(incremental or radical eco-innovations) ready to be assessed by the decision-makers. This portfolio needs to be
composed of powerful individual projects, but also to have global coherence. This is also a way to prepare the
company for the future and further extended eco-design work, as the members of the working group will be able
to act as eco-design ‘ambassadors’ in their respective departments.
Figure 2. Overview of the global process including the three filters
Once the working group has been defined, the eco-innovation consists of two main steps: eco-ideation, and eco-
innovation R&D projects evaluation and selection. The building of an adapted portfolio of eco-innovative
projects is performed through three successive filters that cover these two steps. This process is described in
Figure 2 and also mentioned in Figure 7 to clearly position them in the whole process, and it is detailed below.
3.2 Eco-innovative projects generation and preselection
The eco-ideation phase is divided into three sessions, supported by the eco-design strategy wheel from (Brezet
and Van Hemel, 1997).
The first session is called the ‘introductory session’. As the members of the working group are predominantly
unfamiliar with environmental concerns and eco-design principles, this session aims at introducing the main eco-
design concepts, previous environmental assessments, as well as the eco-innovation approach (including the eco-
design strategy wheel). As Collado-Ruiz and Ostad-Ahmad-Ghorabi (2010) state, the diffusion of ‘soft’
Eco-innovative
project
generation
Set of projects
selected for
development
First filter
Preselection
(manual)
Second filter
Selection
(Multicriteria
assessment)
Set of
powerful
projects
Third filter
Balance
control
(Multicriteria
assessment)
Final portfolio

11
environmental information is favored. They have in fact highlighted a contradiction between the need for
environmental information to focus on the impacting elements and the creativity limitation induced by data being
too precise. Adding to this statement that most of the working group members are not experts in the
environmental field, only general LCA data and high-level eco-innovation principles are communicated to them
during a short meeting (1 to 2 hours). This first session allows a common language between group members to
be shared.
The second session is called the ‘creativity session’ and may be performed as a half-day meeting. A short
introduction is first necessary to recall the objectives and the scope of the study. It also permits a short icebreaker
game to foster a creative atmosphere. Then a divergent creativity phase is launched, following the classical
creativity rules. During this phase, only environmental considerations are taken into account (technical,
economic or customer aspects are voluntarily omitted). Each of the eight axes of the eco-design strategy wheel is
considered separately during a short workshop (15 to 30 minutes) in a two-step approach:
A brainwriting phase, where each participant individually generates a maximum number of ideas in
accordance with the considered axis (for example ‘Optimization of initial lifetime’) answering the
following issue: “Improving the environmental performance of the system considering stimuli provided
by Axis XX”,
Following this, there is a common phase where all ideas are read by the animator and grouped. The
participants are encouraged to orally propose new ideas. All the ideas are stuck on the wall on pre-
defined supports.
The divergent phase is followed by a convergent phase, where all ideas are discussed and sorted out.
Technical, economic or customer aspects are now considered. The objective of this phase is to identify
a first set of promising ideas or idea groups which are from now called eco-innovative projects. This
transition from ideas to projects is performed by grouping closed or complementary ideas dealing with
the same R&D theme.
This convergent phase is illustrated in Figure 3. It represents the first filter that permits preselection of the most
promising projects, thus building a powerful R&D project portfolio. Each project is discussed. If at least one
working group member is opposed to project rejection, it is selected for the next step. If the selected projects are
too numerous (i.e. their number exceeds the number of projects N that can reasonably be developed according to
the available resources) they are analysed once more to consensually reject the least powerful ones. This first

12
filter is based solely on the members’ expertise and experience to quickly identify a reasonable set of projects
that will be developed. The rejected projects are capitalized for future use.
Figure 3. First filter: preselection of projects
The selected eco-innovative projects are then synthesised on standardized sheets that include:
a description of the project,
the objectives of the project,
the potential environmental benefits,
technical feasibility,
economic feasibility.
Such a sheet may be completed in a few hours based on expert knowledge and a short documentary study. This
information remains unknown at this step, so only qualitative or estimated data are available. The standardized
sheets are then developed over a few weeks by sharing them out between the working group members according
to their own competencies. The standardized sheets are then updated with the new information.
The last session is called ‘synthesis session’. It consists of a discussion on each eco-innovative project in order to
clarify the different design aspects and to ensure that a common vision emerges for each project.
For each
project
For each
project
Generation of
candidate projects
Project
capitalization
for future use
Project
selection for
development
Yes
Yes
No
No
Is the project
unanimously
rejected?
Is the project
predominantly
rejected and the
number of
projects > N?
Number of
projects > N?
Yes
No
N = number of
projects acceptable
for deepening

13
At the end of this eco-ideation process, a first set of promising eco-innovative projects has been identified. But
they are generally too numerous for all of them to be considered as R&D projects, due to a lack of resources.
Moreover, and even if some qualitative elements have been synthesised in the standardized sheets, it remains
hard to compare the projects to make an optimal choice. Thus the next step of the eco-innovation approach
concerns the prioritization of the projects thanks to a multi-criteria assessment.
3.3 Project selection based on a multi-criteria assessment
This paragraph proposes an assessment grid based on four dimensions, that is assimilated to a simple scoring
model without any prioritization of the projects and where no global score is calculated. Two other dimensions
are taken into account in the decision process, but as they are not judged debatable and inherent in the contents
of each project, they are not included in the assessment grid. As Bitman and Sharif (2008) showed that a two-
level structure is preferable, each of these dimensions is divided into several indicators. They come from
different literature or company sources:
Potential environmental benefits: the environmental benefits of the project are compared to the
environmental performance of the existing solution thanks to the eco-design strategy wheel (Brezet and
Van Hemel, 1997) on a six-level qualitative scale (0 to 5, see Table 1). The existing solution is
arbitrarily positioned at 2 on each wheel axis and the relative position of the eco-innovative project is
determined by the user thanks to the qualitative scale. A final score on 20 points is then calculated
(average score on the eight axes), but the detail of the 8 axes is preserved, as the average score may hide
important benefits on a particular life cycle aspect.
Score Description
0 The project highly deteriorates the environmental performance of the current solution.
1 The project significantly deteriorates the environmental performance of the current solution.
2 The project does not bring any benefit or damage compared to the current solution.
3 The benefits brought by the project are minimal.
4 The benefits brought by the project are significant.
5 The benefits brought by the project are very important.
Table 1. Example of a qualitative scale to measure potential environmental benefits on each axis of the
eco-design strategy wheel. (The scales used for the other dimensions are based on the same principle but
not detailed in this paper)

14
Feasibility: this dimension explores both the technical and the economic feasibility with the use of 4
indicators proposed by an expert discussion at Alstom Grid: ease of implementation in terms of time
and resources, financial return of investment, technical feasibility in terms of knowledge, internal level
of control (is the company able to internally manage the entire project?). Each indicator is assessed
using a six-level qualitative scale (0 to 5) that permits to obtain a final feasibility on 20 points,
calculated as the sum of the four scores.
Customers’ value: this dimension assesses the benefits for the customers associated with each project.
It uses 4 indicators proposed by (Kondoh et al., 2006): cost reduction, avoidance of risks, improvement
of service quality, improvement of image. Each indicator is assessed using a six-level comparative and
qualitative scale (0 to 5), where 2 is a neutral score (the existing and the new solutions are equivalent).
The final customers’ value on 20 points is calculated as the sum of the four scores.
Time horizon: this fourth dimension gives information concerning the term timescale of the studies
associated to each project (and so the term where the potential benefits could be perceived), which is
often considered as important to get a balanced project portfolio (Cooper et al., 1999). It simply consists
of a four-level textual indicator: short term, middle term, long term and prospective (i.e. at a very long
term and with high uncertainties).
Project perimeter: this dimension concerns the system level considered in each project. It also consists
of a four-level textual indicator inspired by Carrillo-Hermosilla et al.’s typology (Carrillo-Hermosilla et
al., 2010): component, subsystem, system, super system (involving more than the system considered in
the project). This dimension is not included in the assessment grid as it is assumed that each project is
clearly linked to one level without ambiguity.
Project nature: this last dimension allows the nature of projects to be identified: methodological,
organizational, and/or technological, as a project may have several natures. This dimension is not
included in the assessment grid as it is assumed that each project is clearly linked to one level without
ambiguity.
Moreover for each project an expertise level indicator, self-evaluated by the users, has been added with four
possible levels (from non-expert to expert). The first four dimensions are represented in an evaluation sheet, and
each member of the working group evaluates each eco-innovative project. By weighting each evaluation with the
member’s level of expertise, greater value is given to the assessments performed by an expert rather than by a
15
non-expert. Finally an average score is obtained on the five dimensions and for each project. The process to
calculate the global thematic (environmental, feasibility, customers’ value) scores is detailed in the appendix.
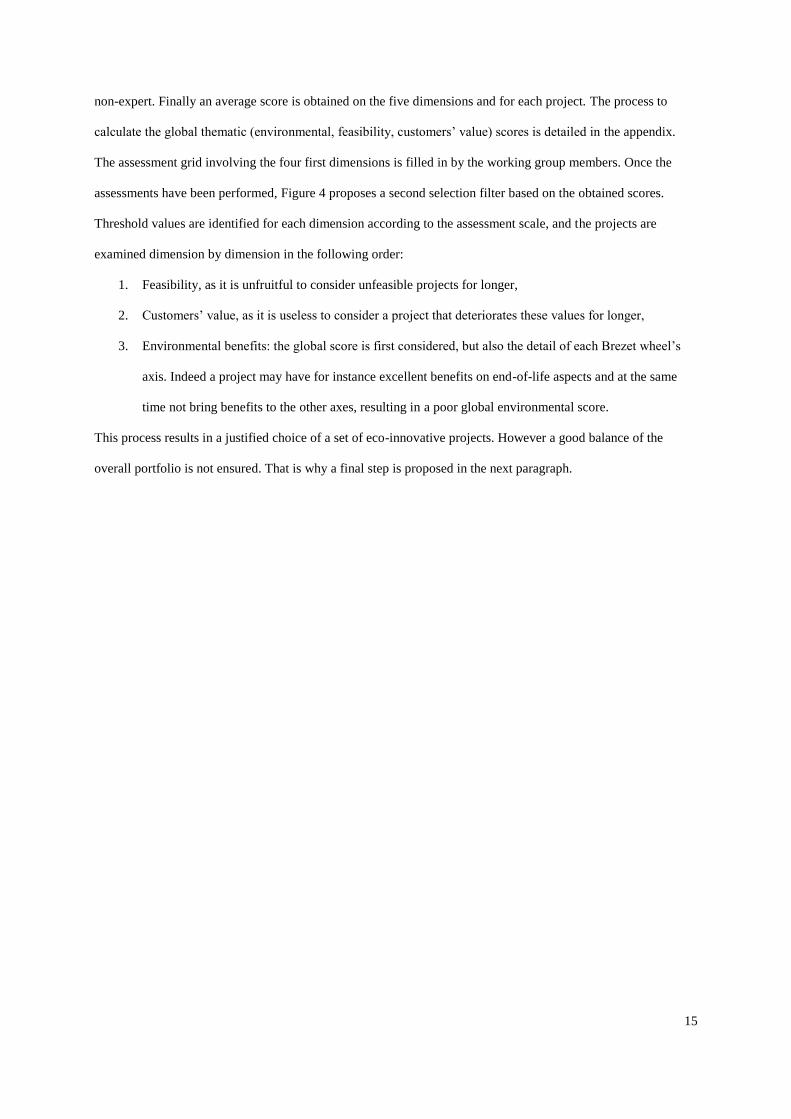
The assessment grid involving the four first dimensions is filled in by the working group members. Once the
assessments have been performed, Figure 4 proposes a second selection filter based on the obtained scores.
Threshold values are identified for each dimension according to the assessment scale, and the projects are
examined dimension by dimension in the following order:
1. Feasibility, as it is unfruitful to consider unfeasible projects for longer,
2. Customers’ value, as it is useless to consider a project that deteriorates these values for longer,
3. Environmental benefits: the global score is first considered, but also the detail of each Brezet wheel’s
axis. Indeed a project may have for instance excellent benefits on end-of-life aspects and at the same
time not bring benefits to the other axes, resulting in a poor global environmental score.
This process results in a justified choice of a set of eco-innovative projects. However a good balance of the
overall portfolio is not ensured. That is why a final step is proposed in the next paragraph.

16
Figure 4. Second filter: selection of projects
3.4 Portfolio balance control
The individual selection of R&D projects enables a portfolio to be built. However it does not ensure that the
combination of these projects is optimal. It has indeed been shown in a previous part of this paper that the
balance of such a portfolio is essential to ensure the success of the approach and to offer strong and sustainable
improvements.
As this eco-innovation approach aims at being easily applicable, a third and final filter based on a qualitative
assessment of the overall portfolio is proposed. This filter is described in Figure 5. The last three dimensions
expressed in section 3.3 are used to check that the combination of projects is well balanced. First the temporal
horizon dimension is considered, as an ideal portfolio includes short-, middle- and long- term projects. Secondly
the project nature is considered, in order to progress on the three axes of the dimension: organizational,
methodological and technological. Finally, the distribution of the projects according to their perimeter is
observed, in order to work on different levels: component, subsystem, system, and even super system.
Projects assessment
by the working group
Project selection for
development
Projects inclusion in
the portfolio
Project
capitalization
for future use
Yes
Yes
Yes
Yes
No
No
No
No
Is the project
feasible? F > F
th
Is the customers’
value preserved? C > C
th
Is the global
environmental
score significant? E > E
th
Is the env. score
on each axis
significant? E
i > E
i,th
For each project

17
For each dimension it is necessary to ask whether or not the portfolio is well balanced. It is assumed that this
questioning clearly depends on the strategic positioning of the company and that there is neither a good nor bad
answer. That is why no general rule is proposed.
If the portfolio is considered to be poorly balanced on some aspects, a new one needs to be found by returning to
the previous stages of the approach, with different and adjusted threshold values. If it is not possible to define a
best portfolio, the current one is validated with its weakness borne in mind.
The final steps of the approach then consist in identifying the time and the resources that need to be associated
with the R&D projects, as in a classical project management methodology. The final portfolio is proposed to the
top-level managers for a final validation, and then planned and realized.
The management may of course limit the number of projects according to the available resources and the
strategy of the company, and different graphical representations, from classical mapping models to more specific
diagrams, may be useful. It is indeed necessary to give the right information to the decision-makers to ensure the
best choices can be made upstream.
At this step, the descriptive project sheets are transmitted to the decision makers. The presentation of the overall
performance of the portfolio is performed through different possible diagrams. Two of them are presented in
Section 4:
Monodimensional diagrams including the uncertainty ranges are also useful to easily visualize the
positioning of the projects and its eventual overlaps.
Finally, partial ordering graphs allow easy identification if a project is outranked by another on the three
dimensions (considering the uncertainty ranges). This is an alternative to the previous monodimensional
diagrams, and has the advantage of being easier to read but the disadvantage of losing quantitative
information.
These different diagrams present essentially the same information. Furthermore propositions 3 and 4 include
uncertainty aspects, but several graphs are necessary.
In the current approach, it is proposed to show these different visualization possibilities to the decision-makers,
as they all present pros and cons, and they may be more or less adapted to some people and situations.
Considering these synthesis graphs and the project sheets, the decision-makers should have the right amount of
data to make the right decisions.

18
Figure 5. Third filter: balance of the project portfolio
3.5 Project realization
Once the project portfolio has been selected by the decision-makers, and the projects planned as usual, they may
be realized following the general eco-design process for complex industrial systems proposed in (Cluzel et al.,
2012).
The project realization may be spaced out over several months or years. Once the whole portfolio or the selected
projects have been performed, the full approach may be reiterated by considering the new system as the system
of reference.
3.6 Validation criteria
The validation of such a process is not easy, because it involves subjective and qualitative elements.
Project inclusion in
the portfolio
Is the portfolio
well balanced in
terms of project
nature?
Identification of time
and resources
Projects
planification and
realization
Yes
No Is the portfolio
well balanced in
terms of temporal
horizon?
Is the portfolio
well balanced in
terms of project
perimeter?
Strategic validation
by top managers
Yes
Yes
Return to the
previous stage with
different thresholds
Is it possible to
define a better
portfolio?
No
No
No
Yes

19
The four criteria proposed by Shah et al. (2003), who add variety and novelty to quantity and quality of generated
ideas, are of interest here. Novelty concerns what is unusual or unexpected. Variety measures the size of the
explored solution space. Quantity is the total number of ideas generated. Finally, quality corresponds to the
feasibility of an idea and its proximity to the initial requirements. To validate the eco-innovation approach, we
propose associating the following indicators with these criteria:
Novelty: two questions are added in the assessment grid given for each project to the members of the
working group: 1) Do you think that this project has already implicitly existed, before the introduction
of the eco-innovation approach, in the mind of one or several persons in the company? 2) Do you think
that this project would have emerged, been formalized and seriously considered by the decision-makers
without the eco-innovation process?
Variety: different indicators are considered: the balance between short/middle/long term and
prospective projects, the balance between component/subsystem/system/super system related projects,
and the balance of the nature of the projects (technical, organizational, methodological projects, etc.).
Quantity is assessed by the total number of ideas generated during the divergent creativity phase and
the total number of eco-innovative projects proposed after the convergent phase. The time spent on the
different phases of the eco-innovation process is also taken into account.
Quality is assessed thanks to the three dimensions: potential environmental benefits, feasibility and
customers’ value.
These four criteria will facilitate assessment of the global performance of the eco-innovation process proposed in
this paper. In the next section, a case study performed at Alstom Grid on a complex industrial system is
proposed.
4. Results
The methodology outlined above was applied at Alstom Grid on AC/DC conversion substations for the
aluminium industry. This case study is described in the next paragraphs.
20
4.1 AC/DC conversion substations for the aluminium industry
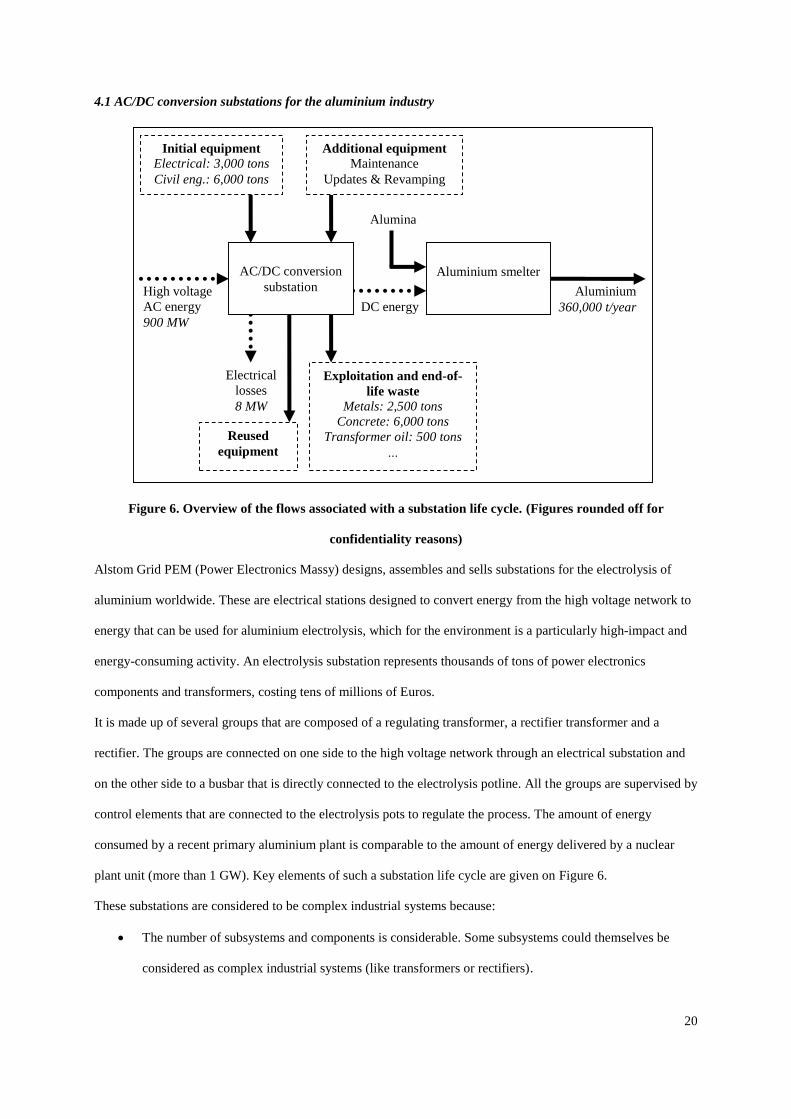
Figure 6. Overview of the flows associated with a substation life cycle. (Figures rounded off for
confidentiality reasons)
Alstom Grid PEM (Power Electronics Massy) designs, assembles and sells substations for the electrolysis of
aluminium worldwide. These are electrical stations designed to convert energy from the high voltage network to
energy that can be used for aluminium electrolysis, which for the environment is a particularly high-impact and
energy-consuming activity. An electrolysis substation represents thousands of tons of power electronics
components and transformers, costing tens of millions of Euros.
It is made up of several groups that are composed of a regulating transformer, a rectifier transformer and a
rectifier. The groups are connected on one side to the high voltage network through an electrical substation and
on the other side to a busbar that is directly connected to the electrolysis potline. All the groups are supervised by
control elements that are connected to the electrolysis pots to regulate the process. The amount of energy
consumed by a recent primary aluminium plant is comparable to the amount of energy delivered by a nuclear
plant unit (more than 1 GW). Key elements of such a substation life cycle are given on Figure 6.
These substations are considered to be complex industrial systems because:
The number of subsystems and components is considerable. Some subsystems could themselves be
considered as complex industrial systems (like transformers or rectifiers).
Aluminium smelter
AC/DC conversion
substation High voltage
AC energy
900 MW
Electrical
losses
8 MW
DC energy
Alumina
Aluminium
360,000 t/year
Initial equipment
Electrical: 3,000 tons
Civil eng.: 6,000 tons
Additional equipment
Maintenance
Updates & Revamping
Exploitation and end-of-
life waste
Metals: 2,500 tons
Concrete: 6,000 tons
Transformer oil: 500 tons
…
Reused
equipment
21
The lifetime of a substation is considerable, up to 35 or 40 years. Many uncertainties exist for the use
and end-of-life phases. No end-of-life scenario is clearly known.
The substation is only a part of the aluminium plant. Their processes are closely connected and
interdependent.
No standard design exists: the substation is tailor-made for each customer, even though the general
design is often the same. Substations are considered as a product family.
In this context, Alstom Grid PEM wishes to minimise the environmental impacts of its products to conform to
Alstom’s environmental policy and to be differentiated from competitors. A first global Life Cycle Assessment
has already been performed on an entire substation (Cluzel et al., 2012). This LCA is the basis for the eco-
innovation process described below.
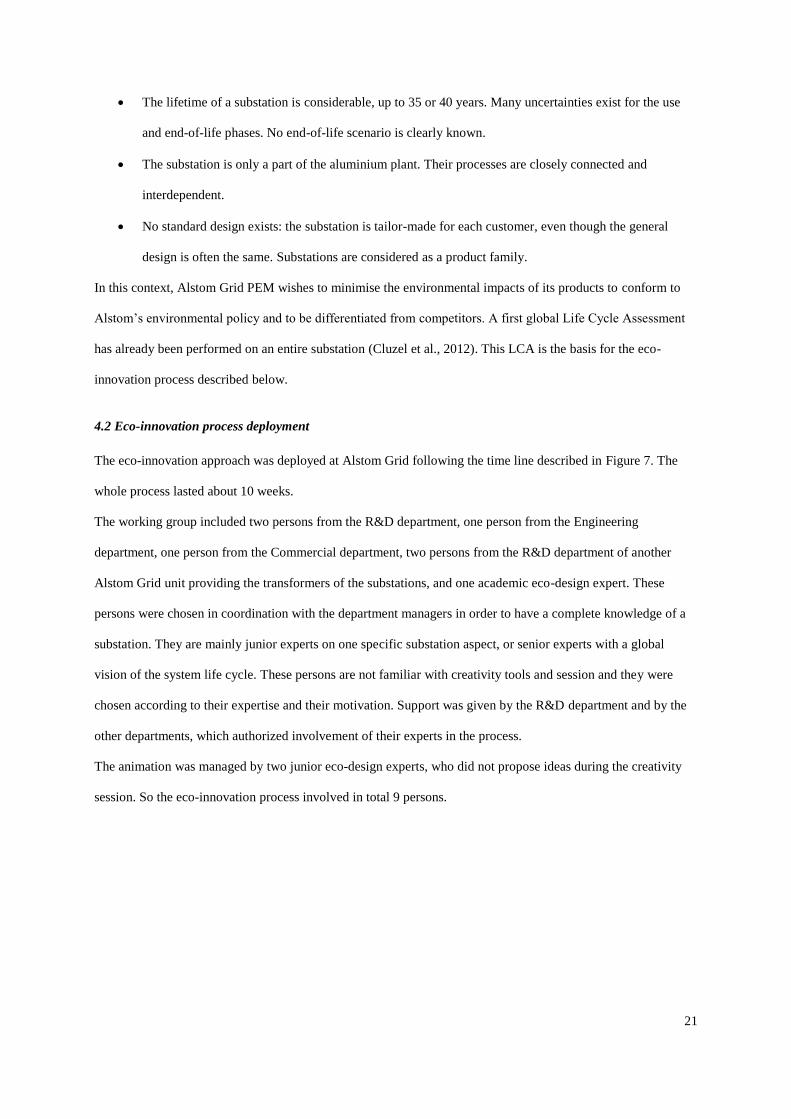
4.2 Eco-innovation process deployment
The eco-innovation approach was deployed at Alstom Grid following the time line described in Figure 7. The
whole process lasted about 10 weeks.
The working group included two persons from the R&D department, one person from the Engineering
department, one person from the Commercial department, two persons from the R&D department of another
Alstom Grid unit providing the transformers of the substations, and one academic eco-design expert. These
persons were chosen in coordination with the department managers in order to have a complete knowledge of a
substation. They are mainly junior experts on one specific substation aspect, or senior experts with a global
vision of the system life cycle. These persons are not familiar with creativity tools and session and they were
chosen according to their expertise and their motivation. Support was given by the R&D department and by the
other departments, which authorized involvement of their experts in the process.
The animation was managed by two junior eco-design experts, who did not propose ideas during the creativity
session. So the eco-innovation process involved in total 9 persons.

22
Figure 7. Time line of the eco-innovation process at Alstom Grid PEM
Soft environmental information was given to the working group during the introduction session, in the form of a
short description of the main environmental issues, certain eco-design principles and examples, and the main
conclusions of the first LCA study on substations. Three weeks were then given to the working group to
‘assimilate the information.
The creativity session was divided into three parts. First, some reminders of the introduction session, the
creativity rules and the eco-design strategy wheel were presented during a short introduction
Then during the divergent phase each axis of the eco-design strategy wheel was considered during a 15-minute
session. Two axes of the eco-design strategy wheel were not processed during the creativity session
(‘Optimization of production techniques’ and ‘Optimization of distribution system’) as the members did not have
competencies in these fields, and production is carried out by subcontractors.
Creativity session
Working group creation
Introduction session
Introduction
Divergent phase
Individual development of the 16 projects
Presentation of the assessment grid
Evaluation by the WG members
Synthesis session
Eco-ideation
Phase Activity
3 weeks
-
1 hour 30 minutes
4 hours
15 minutes
1 hour 45 minutes
2 hours Convergent phase (Filter #1)
5 weeks
3 hours
1 hour
10 days
Duration
Results analysis
Identification of an adapted R&D projects
portfolio (Filters #2 and #3)
2 weeks
2 hours
R&D projects
evaluation &
selection
23
16 eco-innovative projects were then selected at the conclusion of the convergent phase, where each idea was
reconsidered according to Figure 3. These projects were developed over a five-week period and synthetized in
predefined sheets during the synthesis session. Projects deal for example with a long-term optimization of
transformers (200 tons of metals and mineral oil each), heat loss recovery or material substitution.
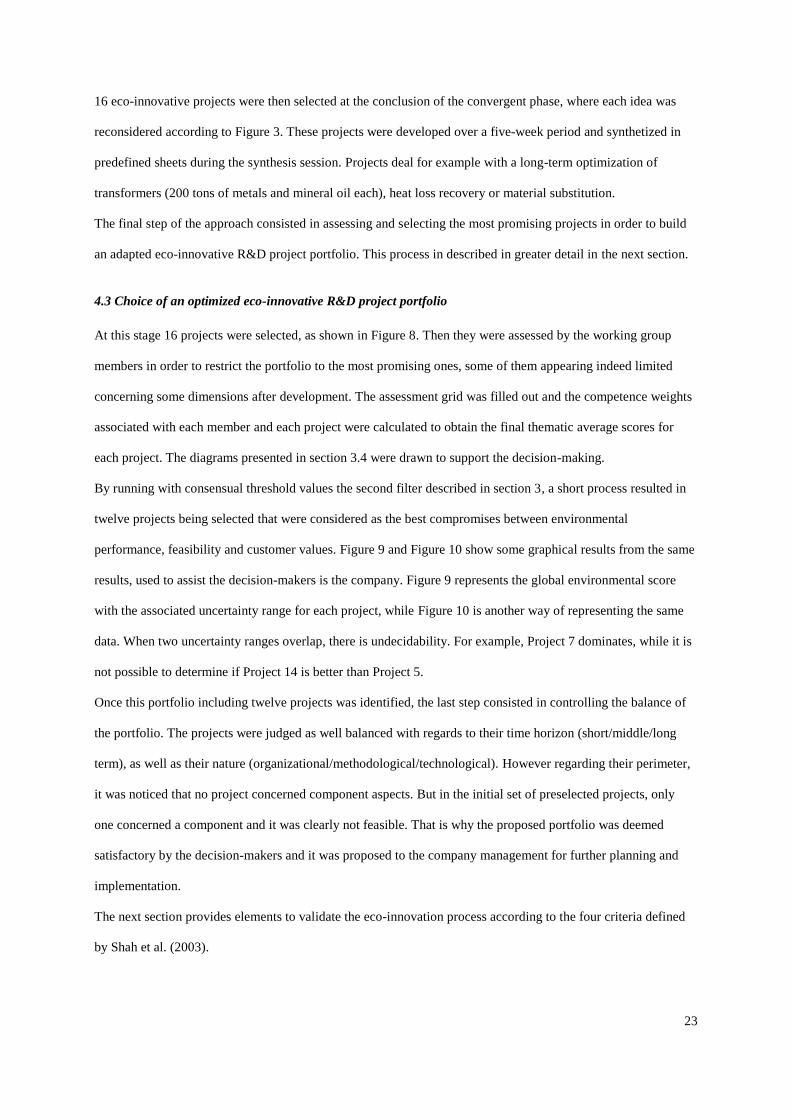
The final step of the approach consisted in assessing and selecting the most promising projects in order to build
an adapted eco-innovative R&D project portfolio. This process in described in greater detail in the next section.
4.3 Choice of an optimized eco-innovative R&D project portfolio
At this stage 16 projects were selected, as shown in Figure 8. Then they were assessed by the working group
members in order to restrict the portfolio to the most promising ones, some of them appearing indeed limited
concerning some dimensions after development. The assessment grid was filled out and the competence weights
associated with each member and each project were calculated to obtain the final thematic average scores for
each project. The diagrams presented in section 3.4 were drawn to support the decision-making.
By running with consensual threshold values the second filter described in section 3, a short process resulted in
twelve projects being selected that were considered as the best compromises between environmental
performance, feasibility and customer values. Figure 9 and Figure 10 show some graphical results from the same
results, used to assist the decision-makers is the company. Figure 9 represents the global environmental score
with the associated uncertainty range for each project, while Figure 10 is another way of representing the same
data. When two uncertainty ranges overlap, there is undecidability. For example, Project 7 dominates, while it is
not possible to determine if Project 14 is better than Project 5.
Once this portfolio including twelve projects was identified, the last step consisted in controlling the balance of
the portfolio. The projects were judged as well balanced with regards to their time horizon (short/middle/long
term), as well as their nature (organizational/methodological/technological). However regarding their perimeter,
it was noticed that no project concerned component aspects. But in the initial set of preselected projects, only
one concerned a component and it was clearly not feasible. That is why the proposed portfolio was deemed
satisfactory by the decision-makers and it was proposed to the company management for further planning and
implementation.
The next section provides elements to validate the eco-innovation process according to the four criteria defined
by Shah et al. (2003).

24
Figure 8. Evolution of the ideas number according to the process stages
Figure 9. Positioning of the 16 projects and their uncertainty grade according to their global
environmental score. The threshold value was fixed at 10 according to the strategy of the company and the
global distribution of the projects.
Figure 10. Outranking diagram of the 16 projects according to their global environmental score.
4.4 Methodology validation
4.4.1 Quantity
109 ideas were generated during the creativity sessions. Each axis of the eco-design strategy wheel provided
between 10-23% of these ideas. Each active member of the working group proposed between 8 and 35 ideas.
Relative to the time spent in the divergent session (1 hour and 45 minutes), this result is considered as highly
satisfactory.
After the convergent session, 16 eco-innovative projects were identified, and a final portfolio comprised of 12
projects was proposed to the top management of the company. These numbers were consistent with company
requirements and it was also judged as satisfactory.
7 3
14
5
4
15 16
6
9 2
1
8
13 12 10 11
Time
Number of ideas
12
16
109
0 1. Ideas
generation 2. Preselection 3. Selection 3. Balance
control
25
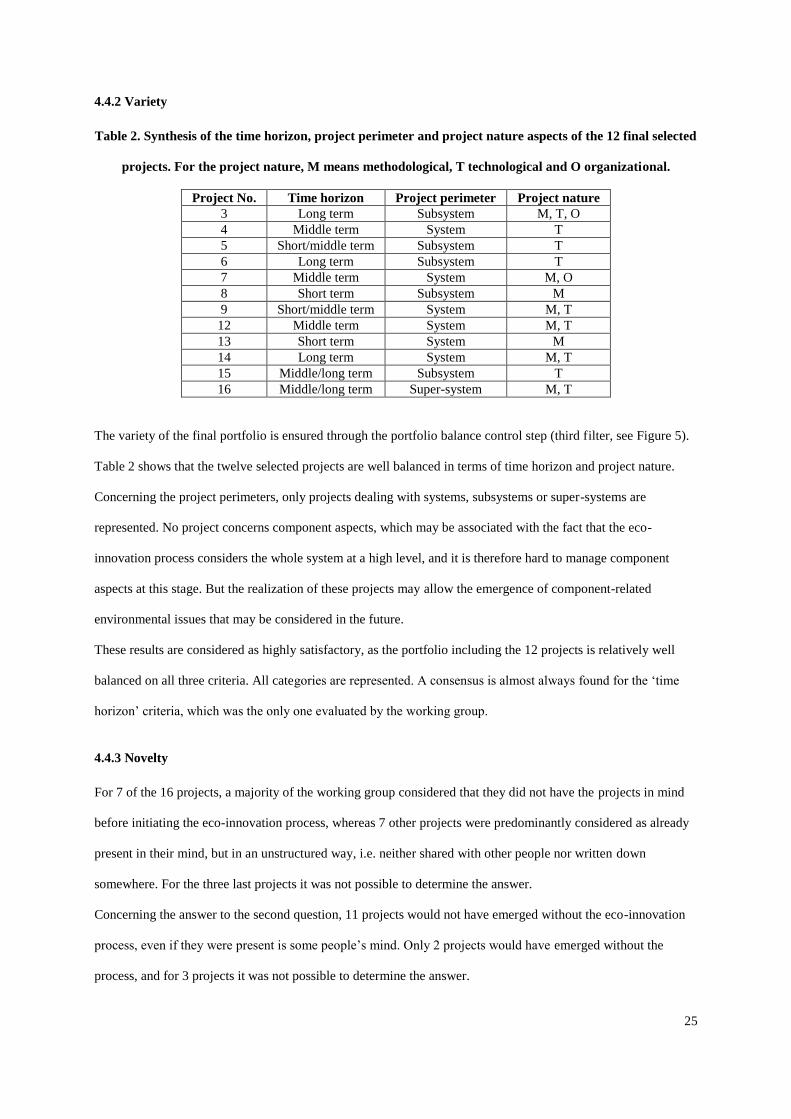
4.4.2 Variety
Table 2. Synthesis of the time horizon, project perimeter and project nature aspects of the 12 final selected
projects. For the project nature, M means methodological, T technological and O organizational.
Project No. Time horizon Project perimeter Project nature
3 Long term Subsystem M, T, O
4 Middle term System T
5 Short/middle term Subsystem T
6 Long term Subsystem T
7 Middle term System M, O
8 Short term Subsystem M
9 Short/middle term System M, T
12 Middle term System M, T
13 Short term System M
14 Long term System M, T
15 Middle/long term Subsystem T
16 Middle/long term Super-system M, T
The variety of the final portfolio is ensured through the portfolio balance control step (third filter, see Figure 5).
Table 2 shows that the twelve selected projects are well balanced in terms of time horizon and project nature.
Concerning the project perimeters, only projects dealing with systems, subsystems or super-systems are
represented. No project concerns component aspects, which may be associated with the fact that the eco-
innovation process considers the whole system at a high level, and it is therefore hard to manage component
aspects at this stage. But the realization of these projects may allow the emergence of component-related
environmental issues that may be considered in the future.
These results are considered as highly satisfactory, as the portfolio including the 12 projects is relatively well
balanced on all three criteria. All categories are represented. A consensus is almost always found for the ‘time
horizon’ criteria, which was the only one evaluated by the working group.
4.4.3 Novelty
For 7 of the 16 projects, a majority of the working group considered that they did not have the projects in mind
before initiating the eco-innovation process, whereas 7 other projects were predominantly considered as already
present in their mind, but in an unstructured way, i.e. neither shared with other people nor written down
somewhere. For the three last projects it was not possible to determine the answer.
Concerning the answer to the second question, 11 projects would not have emerged without the eco-innovation
process, even if they were present is some people’s mind. Only 2 projects would have emerged without the
process, and for 3 projects it was not possible to determine the answer.

26
These results clearly show that new ideas may emerge from the proposed eco-innovation process. They also
show that this process seems to be an excellent way to formalize preexisting ideas that would not have emerged
otherwise. The approach is thus satisfactory on the novelty potential too.
4.4.4 Quality
The quality of the process is assessed using the designer’s evaluation of the 16 projects according to three
criteria (environmental benefits, feasibility, client’s value).
The results for the environmental benefits show that the average score is 10.8 (out of 20), but with a low
standard deviation (0.98). This means that the 16 projects propose environmental improvements on some axes of
the eco-design strategy wheel, but no generalized environmental improvements. This clearly characterizes
incremental eco-innovations. But it also shows that the environmental qualitative scales are not sensitive enough
to accurately assess the differences between the projects.
For the feasibility criteria, the average score is 12.1 and the standard deviation is considerably higher (2.76). The
projects show a good range on the scale (from 4.1 to 15.9) showing that the proposed qualitative indicators are
sufficient to distinguish the projects.
Finally, the results for the client’s value criterion show that the average score reaches 11.0 with a standard
deviation at 1.42. As for environmental benefits, it is more difficult to distinguish between the 16 projects. But
considering that only incremental eco-innovations have been identified, it could be explained by the fact that the
projects would only bring little benefit for the client’s value.
5. Discussion
The definition and the use of the third formalized filters thus appear relevant to ensure good performances of the
process according to the four criteria proposed by Shah et al. (2003): quantity, variety, novelty and quality. But
beyond the previous validation of the proposed eco-innovation process, it is useful to go further by testing the
robustness of the model.
Concerning the first filter, the discussion may concern the number of projects to preselect for the second filter. In
the case study presented in this paper, if 32 projects had been selected instead of 16, the amount of work to develop
these projects would have been too large for the capacity of the working group. The number of projects clearly
needs to be defined by the company from the available resources and to be aligned with its strategy. This is the
best way to adjust the process to its organization. On the contrary, if only 8 projects had been selected when about

27
15 projects were required by the company, the problem would again have been different. Indeed it means that no
consensus has been identified in the working group, and it shows the poor quality of the initial ideas. One possible
answer here consists in adopting a more adapted and specific, but maybe more complex ideation tool than the eco-
design strategy wheel, meeting one previous comment made in section 3.
A second assessment of the environmental performance of the projects (corresponding to the second filter) was
performed with a group of four eco-design experts that were not part of the working group. They are Alstom Grid
experts from units other than PEM, working on other large electrical systems and products. One of these experts
is the sustainable development director of Alstom Grid, and another one the eco-design director of Alstom Grid.
The two other experts are eco-design engineers. These four experts only assessed the environmental aspects of the
16 preselected projects as they do not have a lot of available time and the assessment of the feasibility and customer
aspects would have required a lot of additional information.
Contrary to the first experiment with the working group, where the results obtained on the environmental
dimension do not clearly rank the projects, the distribution of the 16 preselected projects with the external experts
is much more readable. The average score is 11.1, with a standard deviation reaching 1.95. The order of the projects
is different from the working group results, but global tendencies are shared. The external experts have good eco-
design skills but no specific knowledge of the technical aspects of substations. This is another point of view, which
adds a richer dimension to the initial results.
By running the third filters with the environmental assessments of the external experts instead of the assessments
of the working group, with the same rules, a portfolio of 9 projects is obtained. These 9 projects are included in
the first portfolio of 12 projects defined in section 4.4 from the working group results. For the other three projects,
significant differences were noticed between the two groups, but these projects were clearly not included in the
first ones. As a conclusion to this test, the multi-criteria model shows a satisfactory robustness concerning the
evaluation of the environmental performance of the project, which is the key objective of the eco-innovation
process. But as the assessment of the environmental benefits of the project with the working group could be
improved (see section 4.4.4), it was suggested to the company to combine the evaluations of the working group
with the evaluations of the external experts, leading to a final portfoli of 9 projects. The eco-innovation process
has thus been improved with the contribution of an expert point of view. The environmental pertinence of the
selected projects is justified by both internal and external decision-makers, with a significant robustness of the
approach.

28
As a conclusion, the proposed methodology brings to complex systems industries the ability to develop and plan
an ambitious R&D program based on eco-innovative projects. Contrary to existing eco-innovation methods and
tools, this methodology is not centred on the identification of eco-innovative solutions. It aims at identifying
promising areas to investigate in order to develop a balanced eco-innovative R&D projects portfolio, when the
system complexity implies long term developments and knowledge and skills broken up between numerous people
and departments. One main limitation of this work concerns the relatively weak ability of the eco-design strategy
wheel to generate radical eco-innovations. More powerful tools do exist, but the constraint is to keep the same
level of simplicity to make the process accessible for non eco-design experts. The application of the methodology
in only one industrial context is another limitation that should be considered for future research.
6. Conclusions and perspectives
Starting from the statement that eco-innovation methods are not adapted to complex industrial and technological
systems, an adapted eco-innovation process based on a simple tool has been proposed. This process includes two
main stages:
An eco-ideation phase involving a multidisciplinary working group and a creativity session based on
the eco-design strategy wheel proposed in (Brezet and Van Hemel, 1997).
A multi-criteria assessment phase performed by the working group, considering not only environmental
aspects, but also technical and economic feasibility, client’s value, project perimeter and time horizon.
This process was applied at Alstom Grid on large electrical substations. The results were very satisfactory as this
method enabled a high number of ideas with limited time and resources to be obtained. From these ideas, a
balanced eco-innovative R&D project portfolio was identified, mainly composed of ideas that would not have
emerged without the method, but also of some new ideas. The assessment grid seems satisfactory for the
feasibility and client aspects. However, the sensitivity of the environmental indicators was not sufficient to
assess the projects, as the constraints associated with complex industrial systems favored incremental eco-
innovations.
Further work has been completed, taking into account the contribution of external eco-design experts in order to
obtain more accurate results for environmental aspects. A final portfolio of 9 projects was proposed to the
company management, and the first projects will probably be implemented in the coming months.
Two perspectives may be considered for future work:

29
This paper focused on the overall eco-innovation process and how to assess and select the best ideas,
rather than on the ideation phase itself. The eco-design strategy wheel offers acceptable performance,
but it is not particularly adapted for radical innovations. Further research could, for example, apply the
proposed eco-innovation process with other eco-ideation tools, like Eco-ASIT (Tyl, 2011).
It could also be interesting to develop the robustness analysis by applying the approach in different
companies and on a different complex industrial system, for example in the aeronautic, automotive or
energy generation industries.
Acknowledgements
We are grateful to Joël Devautour and François Puchar from Alstom Grid for their full support, as well as
Frankie Rico Sanz and all the working group members for their contribution.
References
Apperson, C., Farid Arefzadeh, Dinsmore, A., Grabowski, R., May, D., Morandi, K., Tawney, B., White, K.P.,
2005. Project selection for technology investment, in: Proceedings of the 2005 IEEE Systems and
Information Engineering Design Symposium. IEEE, pp. 151– 157. doi:10.1109/SIEDS.2005.193251
Baumann, H., Boons, F., Bragd, A., 2002. Mapping the green product development field: engineering, policy
and business perspectives. Journal of Cleaner Production 10, 409–425. doi:10.1016/S0959-
6526(02)00015-X
Bey, N., Hauschild, M.Z., McAloone, T.C., 2013. Drivers and barriers for implementation of environmental
strategies in manufacturing companies. CIRP Annals - Manufacturing Technology 62, 43–46.
doi:10.1016/j.cirp.2013.03.001
Bitman, W.R., Sharif, N., 2008. A Conceptual Framework for Ranking R&D Projects. IEEE Transactions on
Engineering Management 55, 267–278. doi:10.1109/TEM.2008.919725
Blanchard, B.S., Fabrycky, W.J., 2011. Systems engineering and analysis, Fifth Edition. ed, Prentice Hall
International series in industrial and systems engineering. Pearson Prentice Hall, Upper Saddle River
N.J., USA.
Bocken, N.M.P., Allwood, J.M., Willey, A.R., King, J.M.H., 2011. Development of an eco-ideation tool to
identify stepwise greenhouse gas emissions reduction options for consumer goods. Journal of Cleaner
Production 19, 1279–1287. doi:10.1016/j.jclepro.2011.04.009
Bocken, N.M.P., Allwood, J.M., Willey, A.R., King, J.M.H., 2012. Development of a tool for rapidly assessing
the implementation difficulty and emissions benefits of innovations. Technovation 32, 19–31.
doi:10.1016/j.technovation.2011.09.005
Bovea, M.D., Pérez-Belis, V., 2012. A taxonomy of ecodesign tools for integrating environmental requirements
into the product design process. Journal of Cleaner Production 20, 61–71.
doi:10.1016/j.jclepro.2011.07.012
Brezet, H., Van Hemel, C., 1997. Ecodesign: A Promising Approach to Sustainable Production and
Consumption. UNEP, Paris, France.
Byggeth, S., Hochschorner, E., 2006. Handling trade-offs in Ecodesign tools for sustainable product
development and procurement. Journal of Cleaner Production, EcoDesign: What’s happening? 14,
1420–1430. doi:10.1016/j.jclepro.2005.03.024
Carrillo-Hermosilla, J., del Río, P., Könnölä, T., 2010. Diversity of eco-innovations: Reflections from selected
case studies. Journal of Cleaner Production 18, 1073–1083. doi:10.1016/j.jclepro.2010.02.014
Cluzel, F., Yannou, B., Leroy, Y., Millet, D., 2012. Proposition for an Adapted Management Process to Evolve
from an Unsupervised Life Cycle Assessment of Complex Industrial Systems Towards an Eco-
Designing Organisation. Concurrent Engineering: Research and Applications 20, 111–126.
doi:10.1177/1063293X12446663
30
Coldrick, S., Longhurst, P., Ivey, P., Hannis, J., 2005. An R&D options selection model for investment
decisions. Technovation 25, 185–193. doi:10.1016/S0166-4972(03)00099-3
Collado-Ruiz, D., Ostad-Ahmad-Ghorabi, H., 2010. Influence of environmental information on creativity.
Design Studies 31, 479–498. doi:10.1016/j.destud.2010.06.005
Cooper, R.G., Edgett, S.J., Kleinschmidt, E.J., 1999. New product portfolio management: practices and
performance. Journal of Product Innovation Management 16, 333–351. doi:10.1016/S0737-
6782(99)00005-3
De Graan, J.G., 1980. Extensions to the multiple criteria analysis of T. L. Saaty (Report of the National Institute
of Water Supply). The Nertherlands.
Fussler, C., James, P., 1997. Driving Eco-Innovation: A Breakthrough Discipline for Innovation and
Sustainability. Financial Times Prentice Hall.
Henriksen, A.D.P., Palocsay, S.W., 2008. An Excel-Based Decision Support System For Scoring And Ranking
Proposed R&D Projects. International Journal of Information Technology & Decision Making 7, 529–
546.
International Organization for Standardization, 2011. ISO 14006:2011 - Environmental management systems -
Guidelines for incorporating ecodesign (ISO Standard), Environmental management.
Jones, E., Stanton, N.., Harrison, D., 2001. Applying structured methods to Eco-innovation. An evaluation of the
Product Ideas Tree diagram. Design Studies 22, 519–542. doi:10.1016/S0142-694X(01)00007-2
Justel, D., Vidal, R., Arriaga, E., Franco, V., Val-Jauregi, E., 2007. Evaluation Method for Selecting Innovative
Product Concepts With Greater Potential Marketing Succes, in: Proceedings of International
Conference on Engineering Design, ICED’07. Presented at the International Conference on Engineering
Design, ICED’07, Paris, France.
Kobayashi, H., 2006. A systematic approach to eco-innovative product design based on life cycle planning.
Advanced Engineering Informatics 20, 113–125. doi:10.1016/j.aei.2005.11.002
Kondoh, S., Kurakwa, K., Kato, S., Umeda, Y., Takata, S., 2006. Analysis of key success factors for eco-
business through case studies in Japan, in: Proceedings of the 13th CIRP International Conference on
Life Cycle Engineering, LCE2006. Leuven, Belgium.
Lawson, C.P., Longhurst, P.J., Ivey, P.C., 2006. The application of a new research and development project
selection model in SMEs. Technovation 26, 242–250. doi:10.1016/j.technovation.2004.07.017
Limayem, F., Yannou, B., 2002. Handling Imprecision in Pairwise Comparison - For Better Group Decisions in
Weighting, in: Integrated Design and Manufacturing in Mechanical Engineering. Chedmail P., Cognet
G., Fortin C., Mascle C. , Pegna J., Kluwer Academic Publishers, Dordrecht/Boston/London, pp. 43–52.
Lootsma, F.A., 1981. Performance evaluation of nonlinear optimization methods via multi-criteria decision
analysis and via linear model analysis, in: Nonlinear Optimization Vol. 1. Powell, M.J.D., Press A,
London, UK, pp. 419–453.
Mann, D., Jones, E., 2002. Sustainable Services & Systems (3s) through systematic innovation methods. The
Journal of Sustainable Product Design 2, 131–139. doi:10.1023/B:JSPD.0000031025.45698.79
McAloone, T.C., 1998. Industry experiences of environmentally conscious design integration: an exploratory
study (PhD Thesis). Cranfield University, Cranfield, UK.
Mikkola, J.H., 2001. Portfolio management of R&D projects: implications for innovation management.
Technovation 21, 423–435. doi:10.1016/S0166-4972(00)00062-6
O’Hare, J., Dekoninck, E., Liang, H., Turnbull, A., 2007. An Empirical Study of how Innovation and the
Environment are Considered in Current Engineering Design Practise, in: Takata, S., Umeda, Y. (Eds.),
Advances in Life Cycle Engineering for Sustainable Manufacturing Businesses. Springer London, pp.
213–218.
O’Hare, J.A., 2010. Eco-innovation tools for the early stages: an industry-based investigation of tool
customisation and introduction (PhD Thesis). University of Bath, University of Bath, UK.
Pujari, D., 2006. Eco-innovation and new product development: understanding the influences on market
performance. Technovation 26, 76–85. doi:10.1016/j.technovation.2004.07.006
Shah, J.J., Smith, S.M., Vargas-Hernandez, N., 2003. Metrics for measuring ideation effectiveness. Design
Studies 24, 111–134. doi:10.1016/S0142-694X(02)00034-0
Tyl, B., 2011. L’apport de la créativité dans les processus d’éco-innovation - Proposition de l’outil EcoASIT
pour faciliter l’éco-idéation de systèmes durables (PhD Thesis). Université Bordeaux 1, Bordeaux,
France.
Van Hemel, C., Cramer, J., 2002. Barriers and stimuli for ecodesign in SMEs. Journal of Cleaner Production,
Integrating greener product development perspectives 10, 439–453. doi:10.1016/S0959-
6526(02)00013-6
31
Yang, C.J., Chen, J.L., 2011. Accelerating preliminary eco-innovation design for products that integrates case-
based reasoning and TRIZ method. Journal of Cleaner Production 19, 998–1006.
doi:10.1016/j.jclepro.2011.01.014
Appendix
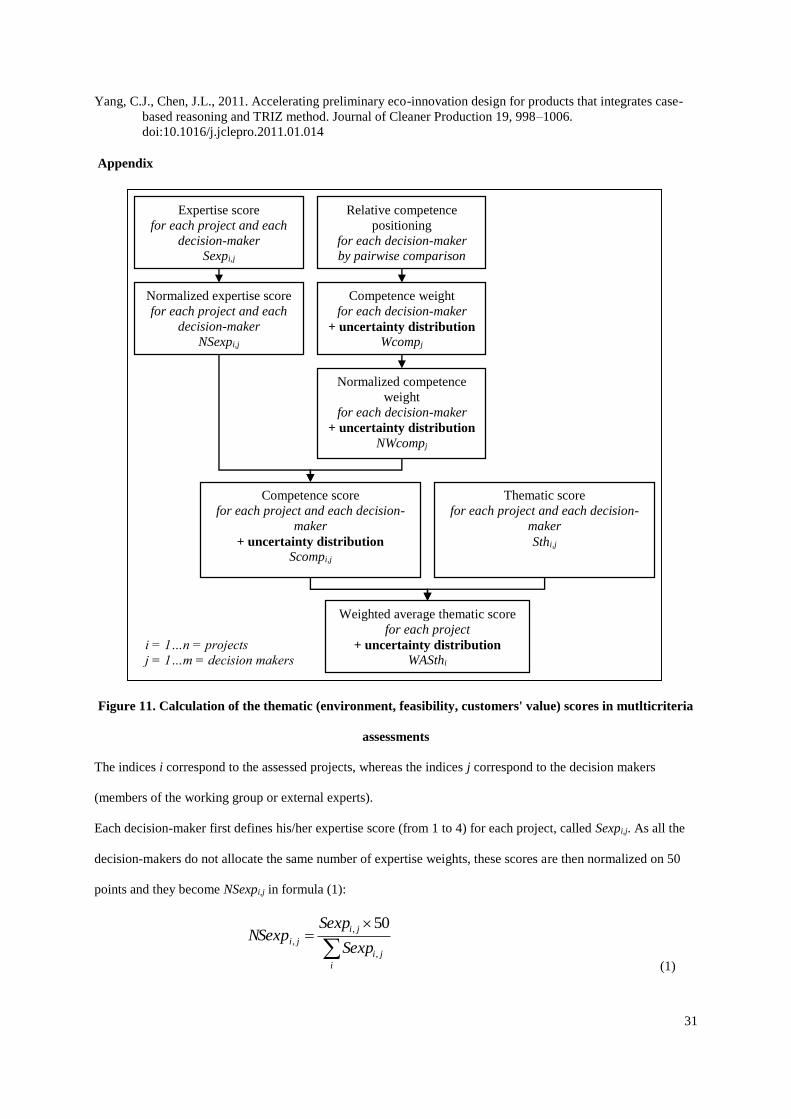
Figure 11. Calculation of the thematic (environment, feasibility, customers' value) scores in mutlticriteria
assessments
The indices i correspond to the assessed projects, whereas the indices j correspond to the decision makers
(members of the working group or external experts).
Each decision-maker first defines his/her expertise score (from 1 to 4) for each project, called Sexpi,j. As all the
decision-makers do not allocate the same number of expertise weights, these scores are then normalized on 50
points and they become NSexpi,j in formula (1):
(1)
i
ji
ji
jiSexp
SexpNSexp
,
,
,
50
Expertise score
for each project and each
decision-maker
Sexpi,j
Normalized expertise score
for each project and each
decision-maker
NSexpi,j
Relative competence
positioning
for each decision-maker
by pairwise comparison
Competence weight
for each decision-maker
+ uncertainty distribution
Wcompj
Competence score
for each project and each decision-
maker
+ uncertainty distribution
Scompi,j
Thematic score
for each project and each decision-
maker
Sthi,j
Weighted average thematic score
for each project
+ uncertainty distribution
WASthi
Normalized competence
weight
for each decision-maker
+ uncertainty distribution
NWcompj
i = 1…n = projects
j = 1…m = decision makers
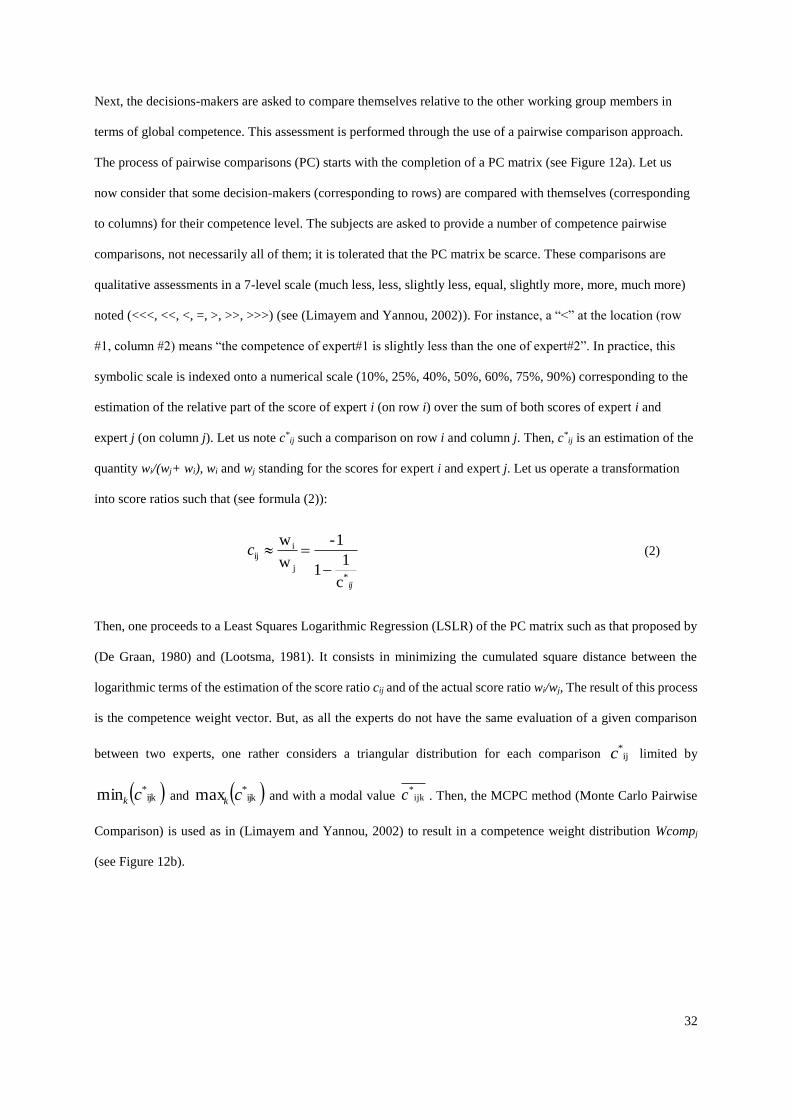
32
Next, the decisions-makers are asked to compare themselves relative to the other working group members in
terms of global competence. This assessment is performed through the use of a pairwise comparison approach.
The process of pairwise comparisons (PC) starts with the completion of a PC matrix (see Figure 12a). Let us
now consider that some decision-makers (corresponding to rows) are compared with themselves (corresponding
to columns) for their competence level. The subjects are asked to provide a number of competence pairwise
comparisons, not necessarily all of them; it is tolerated that the PC matrix be scarce. These comparisons are
qualitative assessments in a 7-level scale (much less, less, slightly less, equal, slightly more, more, much more)
noted (<<<, <<, <, =, >, >>, >>>) (see (Limayem and Yannou, 2002)). For instance, a “<” at the location (row
#1, column #2) means “the competence of expert#1 is slightly less than the one of expert#2”. In practice, this
symbolic scale is indexed onto a numerical scale (10%, 25%, 40%, 50%, 60%, 75%, 90%) corresponding to the
estimation of the relative part of the score of expert i (on row i) over the sum of both scores of expert i and
expert j (on column j). Let us note c*ij such a comparison on row i and column j. Then, c*
ij is an estimation of the
quantity wi/(wj+ wi), wi and wj standing for the scores for expert i and expert j. Let us operate a transformation
into score ratios such that (see formula (2)):
(2)
Then, one proceeds to a Least Squares Logarithmic Regression (LSLR) of the PC matrix such as that proposed by
(De Graan, 1980) and (Lootsma, 1981). It consists in minimizing the cumulated square distance between the
logarithmic terms of the estimation of the score ratio cij and of the actual score ratio wi/wj, The result of this process
is the competence weight vector. But, as all the experts do not have the same evaluation of a given comparison
between two experts, one rather considers a triangular distribution for each comparison limited by
and and with a modal value . Then, the MCPC method (Monte Carlo Pairwise
Comparison) is used as in (Limayem and Yannou, 2002) to result in a competence weight distribution Wcompj
(see Figure 12b).
ij
c
*j
iij
c
11
1-
w
w
ij*c
ijk*min ck ijk
*max ck ijk*c
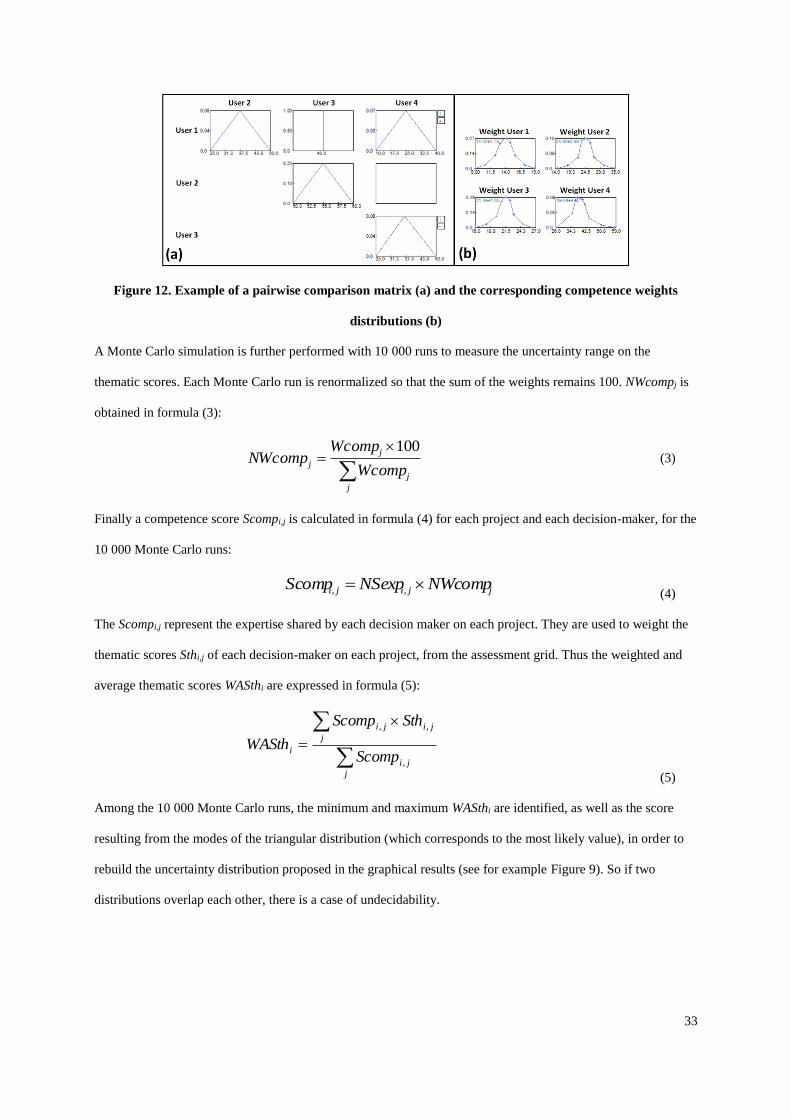
33
Figure 12. Example of a pairwise comparison matrix (a) and the corresponding competence weights
distributions (b)
A Monte Carlo simulation is further performed with 10 000 runs to measure the uncertainty range on the
thematic scores. Each Monte Carlo run is renormalized so that the sum of the weights remains 100. NWcompj is
obtained in formula (3):
(3)
Finally a competence score Scompi,j is calculated in formula (4) for each project and each decision-maker, for the
10 000 Monte Carlo runs:
(4)
The Scompi,j represent the expertise shared by each decision maker on each project. They are used to weight the
thematic scores Sthi,j of each decision-maker on each project, from the assessment grid. Thus the weighted and
average thematic scores WASthi are expressed in formula (5):
(5)
Among the 10 000 Monte Carlo runs, the minimum and maximum WASthi are identified, as well as the score
resulting from the modes of the triangular distribution (which corresponds to the most likely value), in order to
rebuild the uncertainty distribution proposed in the graphical results (see for example Figure 9). So if two
distributions overlap each other, there is a case of undecidability.
j
j
j
jWcomp
WcompNWcomp
100
jjiji NWcompNSexpScomp ,,
j
ji
j
jiji
iScomp
SthScomp
WASth,
,,