economic and social development: the new learning files/20140926 - porter prize india... · this...
TRANSCRIPT

This presentation draws on ideas from Professor Porter’s articles and books, in particular, The Competitive Advantage of Nations (The Free Press, 1990), “Building the Microeconomic
Foundations of Competitiveness,” in The Global Competitiveness Report (World Economic Forum), “Clusters and the New Competitive Agenda for Companies and Governments” in On
Competition (Harvard Business School Press, 2008), “Creating Shared Value” (Harvard Business Review, Jan 2011), the Social Progress Index Report (Social Progress Imperative)
and ongoing related research. No part of this publication may be reproduced, stored in a retrieval system, or transmitted in any form or by any means - electronic, mechanical,
photocopying, recording, or otherwise - without the permission of Michael E. Porter. For further materials, see the website of the Institute for Strategy and Competitiveness
(www.isc.hbs.edu), FSG (www.fsg.org) and the Social Progress Imperative (www.socialprogressimperative.org).
Economic and Social Development:
The New Learning
Professor Michael E. Porter
Harvard Business School
Porter Prize India Boston, MA / New Delhi, India
09/26/2014

Copyright 2014 © Professor Michael E. Porter 2 20140926—Porter Prize India Development Presentation—FINAL
The Dual Challenges of Development
Social
Development
Economic
Development
GDP per
capita

Copyright 2014 © Professor Michael E. Porter 3 20140926—Porter Prize India Development Presentation—FINAL
The Dual Challenges of Development
• There is a powerful connection between economic and social
development, that goes in both directions
• Successful development requires improving the economic and social
context simultaneously
Social
Development
Economic
Development
GDP per
capita

Copyright 2014 © Professor Michael E. Porter 4 20140926—Porter Prize India Development Presentation—FINAL
Economic Performance Selected Countries
Note: Luxembourg omitted from OECD average.
Source: EIU (2014), authors calculations
Australia
Austria
Belgium
Brazil
Canada
Chile
China (+9.7%, $10,459)
Czech Republic
Denmark
Estonia
Finland
France
Germany
Greece
Hungary
Iceland
India Indonesia
Ireland
Israel
Italy
Japan
Malaysia
Mexico
Netherlands
New Zealand
Norway
Philippines
Poland
Portugal
Russia
Slovakia Slovenia
South Korea
Spain
Sweden
Switzerland
Taiwan
Thailand
Turkey
United Kingdom
United States
Vietnam
$0
$5,000
$10,000
$15,000
$20,000
$25,000
$30,000
$35,000
$40,000
$45,000
$50,000
-2% -1% 0% 1% 2% 3% 4% 5% 6%
PPP-Adjusted Real GDP per Capita, 2013 ($USD
at 2005 prices)
Growth in Real GDP per Capita (PPP $US at 2005 prices), CAGR, 2003-2013
OECD Average Prosperity Growth: +1.3%
OECD Average Real
GDP per Capita: $29,380

Copyright 2014 © Professor Michael E. Porter 5 20140926—Porter Prize India Development Presentation—FINAL
• Competitiveness depends on the long-run productivity and efficiency of a
location as a place to do business
- The productivity of existing firms and workers
- The ability to achieve high participation of citizens in the workforce
• Competitiveness is not:
- Low wages
- A weak currency
- Jobs per se
A nation or region is competitive to the extent that firms operating there are able
to compete successfully in the regional and global economy while maintaining
or improving wages and living standards for the average citizen
Economic Development Depends on Competitiveness

Copyright 2014 © Professor Michael E. Porter 6 20140926—Porter Prize India Development Presentation—FINAL
Endowments
What Determines Competitiveness?
• Endowments, including natural resources, geographical location, population, and land area, create a
foundation for prosperity, but true prosperity arises from productivity in the use of endowments

Copyright 2014 © Professor Michael E. Porter 7 20140926—Porter Prize India Development Presentation—FINAL
Endowments
Macroeconomic Competitiveness
Human Development
and Effective
Political Institutions
Sound Monetary
and Fiscal Policies
What Determines Competitiveness?
• Macroeconomic competitiveness sets the economy-wide context for productivity to emerge, but is not
sufficient to ensure productivity
• Endowments, including natural resources, geographical location, population, and land area, create a
foundation for prosperity, but true prosperity arises from productivity in the use of endowments

Copyright 2014 © Professor Michael E. Porter 8 20140926—Porter Prize India Development Presentation—FINAL
Macroeconomic Competitiveness
Microeconomic Competitiveness
Sophistication
of Company
Operations and
Strategy
Quality of the
Business
Environment
State of Cluster
Development
Endowments
Human Development
and Effective
Political Institutions
Sound Monetary
and Fiscal Policies
What Determines Competitiveness?
• Productivity ultimately depends on improving the microeconomic capability of the economy and the
sophistication of local competition revealed at the level of firms, clusters, and regions
• Macroeconomic competitiveness sets the economy-wide context for productivity to emerge, but is not
sufficient to ensure productivity
• Endowments, including natural resources, geographical location, population, and land area, create a
foundation for prosperity, but true prosperity arises from productivity in the use of endowments

Copyright 2014 © Professor Michael E. Porter 9 20140926—Porter Prize India Development Presentation—FINAL
Massachusetts Life Science Cluster

Copyright 2014 © Professor Michael E. Porter 10 20140926—Porter Prize India Development Presentation—FINAL
Geographic Influences on Competitiveness
Neighboring Countries
Regions and Cities
Nation
• Regions are the most important economic unit for competitiveness in larger countries,
especially countries beyond subsistence development
Copyright 2014 © Professor Michael E. Porter 11 20140926—Porter Prize India Development Presentation—FINAL
Marine
Equipment
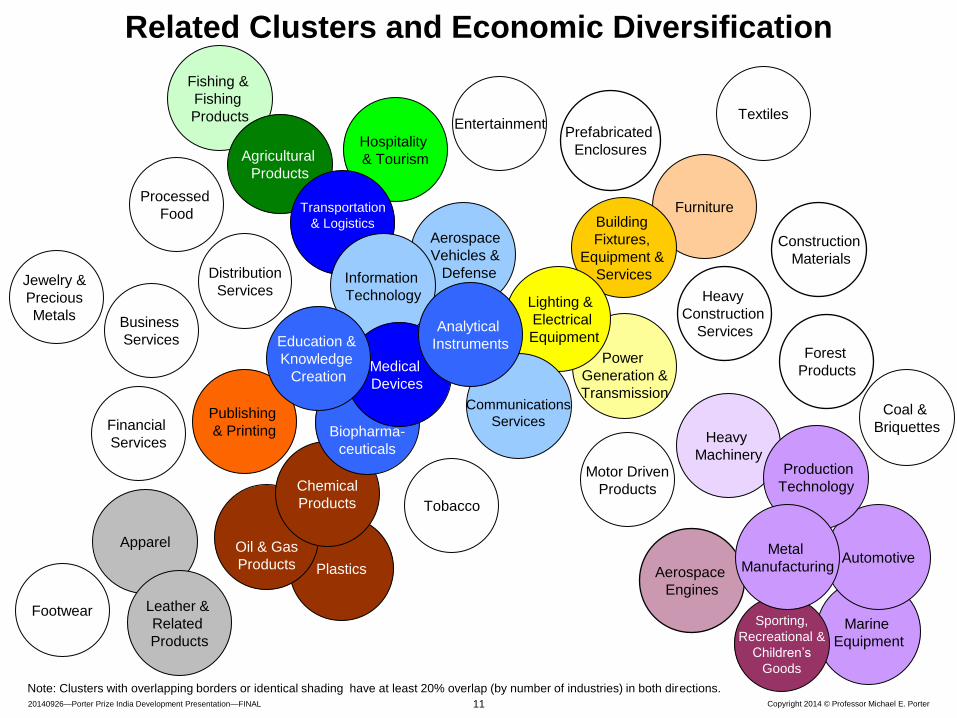
Related Clusters and Economic Diversification
Furniture Building
Fixtures,
Equipment &
Services
Fishing &
Fishing
Products
Hospitality
& Tourism Agricultural
Products
Transportation
& Logistics
Plastics
Oil & Gas
Products
Chemical
Products
Biopharma-
ceuticals
Power
Generation &
Transmission
Aerospace
Vehicles &
Defense
Lighting &
Electrical
Equipment
Financial
Services
Publishing
& Printing
Entertainment
Information
Technology
Aerospace
Engines
Business
Services
Distribution
Services
Forest
Products
Heavy
Construction
Services
Construction
Materials
Prefabricated
Enclosures
Heavy
Machinery
Automotive
Sporting,
Recreational &
Children’s
Goods
Production
Technology Motor Driven
Products
Metal
Manufacturing
Jewelry &
Precious
Metals
Textiles
Footwear
Processed
Food
Tobacco
Medical
Devices
Analytical
Instruments Education &
Knowledge
Creation
Apparel
Leather &
Related
Products
Note: Clusters with overlapping borders or identical shading have at least 20% overlap (by number of industries) in both directions.
Communications
Services Coal &
Briquettes

Copyright 2014 © Professor Michael E. Porter 12 20140926—Porter Prize India Development Presentation—FINAL
The Need to Go Beyond GDP
• There has been a growing recognition that we need to move beyond
measuring only the economic performance of countries:
“In an increasingly performance-oriented society, metrics matter. What we
measure affects what we do. If we have the wrong metrics, we will strive for
the wrong things”
Jean-Paul Fitoussi, Amartya Sen, Joseph Stiglitz, Mismeasuring Our Lives
• Starting with the Human Development Index, there have been a
number of efforts to add additional measures
• More recently, there has also been a focus on life
satisfaction/happiness
• The Social Progress Index builds on these efforts to broaden
measurement of national performance to social factors

Copyright 2014 © Professor Michael E. Porter 13 20140926—Porter Prize India Development Presentation—FINAL
Social Progress Index: Design Principles
13
Outcomes – not inputs
Actionability
Relevant to all countries
Exclusively social and
environmental indicators

Copyright 2014 © Professor Michael E. Porter 14 20140926—Porter Prize India Development Presentation—FINAL
What is Social Progress?
Social progress is the capacity of a society to meet the basic
human needs of its citizens, establish the building blocks
that allow citizens and communities to enhance and sustain
the quality of their lives, and create the conditions for all
individuals to reach their full potential.
A holistic framework is needed
Copyright 2014 © Professor Michael E. Porter 15 20140926—Porter Prize India Development Presentation—FINAL
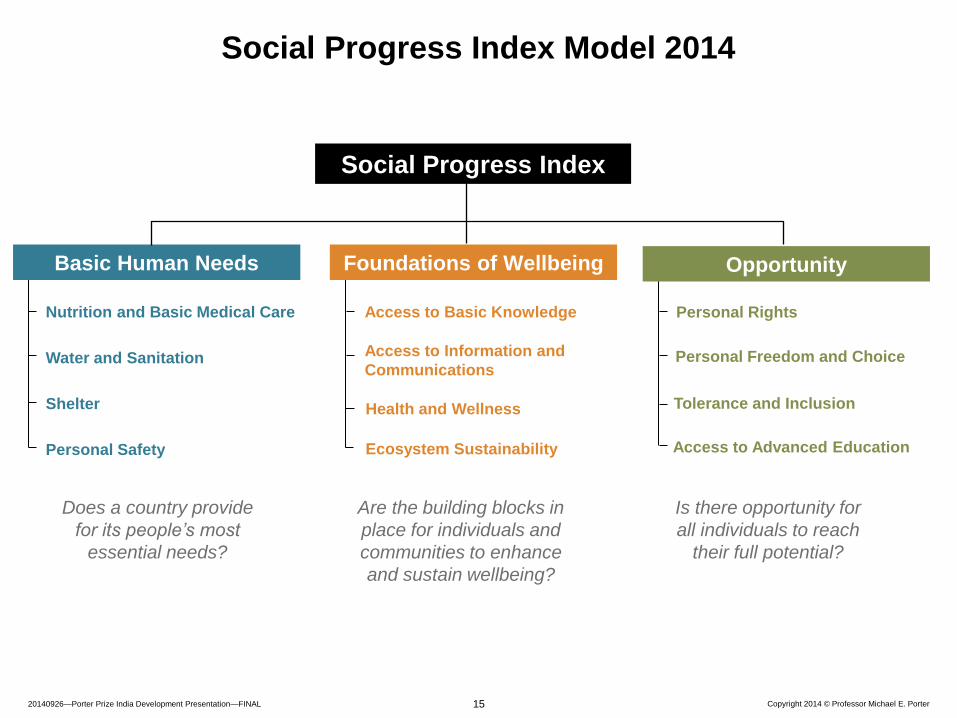
Social Progress Index Model 2014
Social Progress Index
Nutrition and Basic Medical Care
Water and Sanitation
Shelter
Personal Safety
Access to Basic Knowledge
Access to Information and
Communications
Health and Wellness
Ecosystem Sustainability
Personal Rights
Access to Advanced Education
Personal Freedom and Choice
Tolerance and Inclusion
Does a country provide
for its people’s most
essential needs?
Are the building blocks in
place for individuals and
communities to enhance
and sustain wellbeing?
Is there opportunity for
all individuals to reach
their full potential?
Opportunity Foundations of Wellbeing Basic Human Needs

Copyright 2014 © Professor Michael E. Porter 16 20140926—Porter Prize India Development Presentation—FINAL
The Social Progress Index 2014
Note: *GDP per capita 2011 (Constant, 2011 International $)

Copyright 2014 © Professor Michael E. Porter 17 20140926—Porter Prize India Development Presentation—FINAL
Social Progress Index vs. GDP per Capita (PPP)*
* (constant 2011 international $)
So
cia
l P
rog
ress In
de
x 2
01
4
GDP per capita (PPP, constant 2011 international $)
IND

Copyright 2014 © Professor Michael E. Porter 18 20140926—Porter Prize India Development Presentation—FINAL
Social Progress Performance India Vs. Peer Countries
• India is currently under-
performing on Social
Progress relative to its level
of economic development
So
cia
l P
rog
ress In
de
x S
co
re
GDP per capita (PPP, constant 2011 international $)

Copyright 2014 © Professor Michael E. Porter 19 20140926—Porter Prize India Development Presentation—FINAL
Social Progress Index Rank: 102
GDP per capita rank: 93 INDIA
Uzbekistan; Nigeria; Congo, Republic of; Bolivia; Honduras; Laos; Pakistan; Nicaragua; Swaziland; Moldova; Philippines; Guyana;
Yemen; Ghana; and Georgia
Score Rank Score Rank Score Rank
BASIC HUMAN NEEDS 54.48 100 N FOUNDATIONS OF WELLBEING 56.84 108 N OPPORTUNITY 39.39 109 N
Nutrition and Basic Medical Care 75.69 97 N Access to Basic Knowledge 77.80 95 N Personal Rights 54.27 70 N
Undernourishment 17.50 97 N Adult literacy rate 62.8 114 W Political rights 2.0 37 S
Depth of food deficit 125 97 N Primary school enrollment 93.3 70 N Freedom of speech 1.0 14 N
Maternal mortality rate 200 94 N Lower secondary school enrollment 86.5 89 N Freedom of assembly/association 0.0 95 W
Stillbirth rate 22 100 N Upper secondary school enrollment 54.8 91 N Freedom of movement 3.0 67 N
Child mortality rate 56 101 N Gender parity in secondary enrollment 0.9 95 N Private property rights 50.0 36 S+
Deaths from infectious diseases 363 97 N
Water and Sanitation 51.85 100 N Access to Information and Communications 39.87 110 W Personal Freedom and Choice 54.52 118 W
Access to piped water 25 97 N Mobile telephone subscriptions 69.9 106 N Freedom over life choices 57.0 99 N
Rural vs. urban access to improved water source 6.8 64 N Internet users 12.6 105 N Freedom of religion 2.0 93 N
Access to improved sanitation facilities 35.1 108 N Press Freedom Index 41.2 95 N Modern slavery, human trafficking, child marriage 30.8 130 W-
Satisfied demand for contraception 80.0 75 N
Corruption 36.0 74 S
Shelter 39.77 102 N Health and Wellness 68.98 95 N Tolerance and Inclusion 21.54 131 W-
Availability of affordable housing 47 57 N Life expectancy 66.0 98 N Women treated with respect 61.0 68 N
Access to electricity 75.0 96 N Non-communicable disease deaths between 30 and 70 27.0 90 N Tolerance for immigrants 30.0 126 W-
Quality of electricity supply 3.2 90 N Obesity rate 1.9 4 S+ Tolerance for homosexuals 11.0 85 N
Indoor air pollution attributable deaths 124.5 109 W- Outdoor air pollution attributable deaths 14.0 71 N Discrimination and violence against minorities 8.2 112 W
Suicide rate 25.2 126 W- Religious tolerance 1.0 118 W
Community safety net 51.0 129 W-
Personal Safety 50.64 95 N Ecosystem Sustainability 40.72 100 N Access to Advanced Education 27.24 91 N
Homicide rate 2.0 41 S Greenhouse gas emissions 618.1 2 N Years of tertiary schooling 0.2 80 N
Level of violent crime 3.0 56 N Water withdrawals as a percent of resources 3.6 113 W Women's average years in school 5.6 104 N
Perceived criminality 4.0 91 W Biodiversity and habitat 39.2 99 N Inequality in the attainment of education 0.4 103 W
Political terror 4.0 117 W Number of globally ranked universities 3.0 12 S+
Traffic deaths 18.9 84 N
Relative Strength Neutral Relative Weakness
Note: Strengths and weaknesses are relative to 15 countries of similar GDP:
Uzbekistan; Nigeria; Congo, Republic of; Bolivia; Honduras; Laos; Pakistan; Nicaragua; Swaziland; Moldova; Philippines; Guyana; Yemen; Ghana; and Georgia

Copyright 2014 © Professor Michael E. Porter 20 20140926—Porter Prize India Development Presentation—FINAL
• Only business can create economic prosperity, through meeting
needs at a profit
• Societies everywhere are facing significant social, environmental
and economic development challenges
• Government and NGO’s lack sufficient resources and
capabilities to fully meet these challenges alone
• Corporate social responsibility efforts are greater than ever, but the
legitimacy of business has fallen
We need a new approach
The Role of Business in Society
Copyright 2014 © Professor Michael E. Porter 21 20140926—Porter Prize India Development Presentation—FINAL
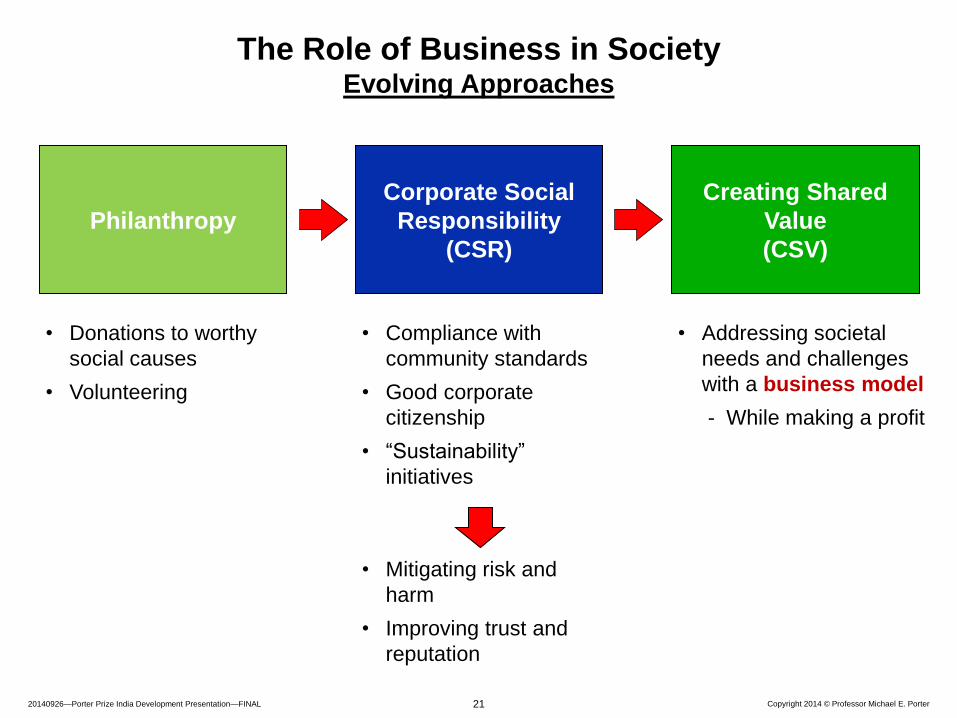
The Role of Business in Society Evolving Approaches
Corporate Social
Responsibility
(CSR)
Creating Shared
Value
(CSV)
Philanthropy
• Donations to worthy
social causes
• Volunteering
• Compliance with
community standards
• Good corporate
citizenship
• “Sustainability”
initiatives
• Mitigating risk and
harm
• Improving trust and
reputation
• Addressing societal
needs and challenges
with a business model
- While making a profit

Copyright 2014 © Professor Michael E. Porter 22 20140926—Porter Prize India Development Presentation—FINAL
Levels of Shared Value
I. Reconceiving needs, products, and customers
– Meeting societal needs through products and services
– Serving unserved or underserved customers
II. Redefining productivity in the value chain
– Utilizing resources, energy, suppliers, logistics, and employees differently
and better
III. Improving the local and regional business environment
– Improving skills, the supplier base, the regulatory environment, and the
supporting institutions that affect the business
– Strengthening the cluster on which the company depends
– Improving consumer education and local infrastructure
• Shared value strengthens the link between company success and
community success
Copyright 2014 © Professor Michael E. Porter 23 20140926—Porter Prize India Development Presentation—FINAL
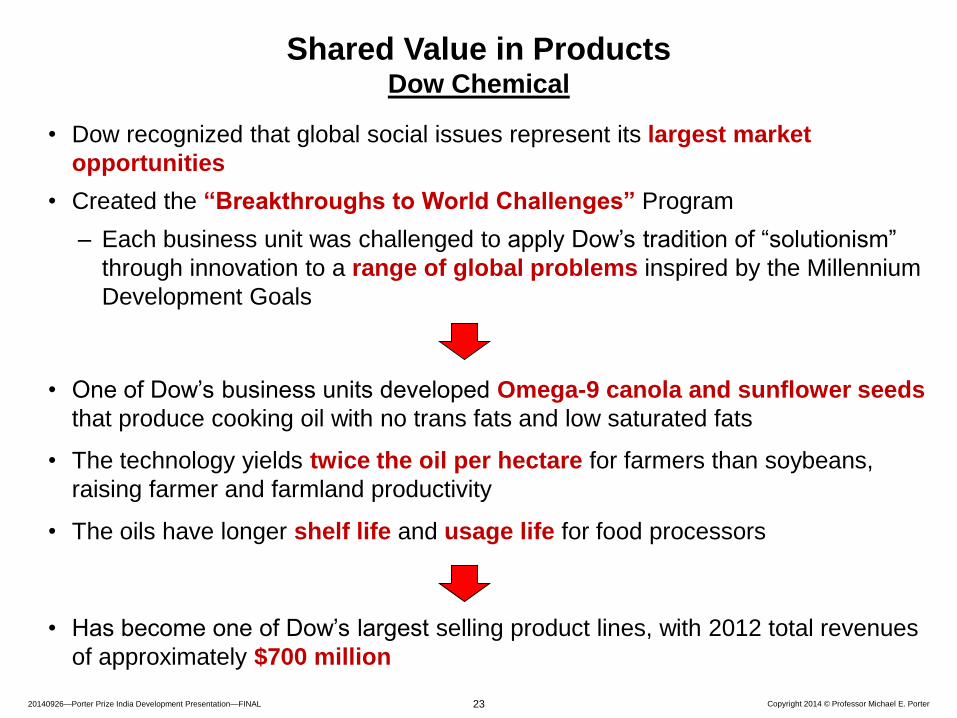
Shared Value in Products Dow Chemical
• Dow recognized that global social issues represent its largest market
opportunities
• Created the “Breakthroughs to World Challenges” Program
– Each business unit was challenged to apply Dow’s tradition of “solutionism”
through innovation to a range of global problems inspired by the Millennium
Development Goals
• One of Dow’s business units developed Omega-9 canola and sunflower seeds
that produce cooking oil with no trans fats and low saturated fats
• The technology yields twice the oil per hectare for farmers than soybeans,
raising farmer and farmland productivity
• The oils have longer shelf life and usage life for food processors
• Has become one of Dow’s largest selling product lines, with 2012 total revenues
of approximately $700 million

Copyright 2014 © Professor Michael E. Porter 24 20140926—Porter Prize India Development Presentation—FINAL
Shared Value in the Value Chain Fibria, Brazil
• Fibria, the world’s leading manufacturer of chemical pulp, utilizes planted
eucalyptus trees and integration of native habitat to dramatically reduce the
land required and sustainability in wood fiber cultivation
• The company also encourages small-scale producers near its mills to plant
eucalyptus in conjunction with other crops, assisting them with technical
training and inputs
• Fibria achieves far greater land and water efficiency versus traditional
plantation methods
• Small scale producers currently contribute 27% of the raw material volume
utilized in Fibria mills, improving efficiency
• Over 4000 households have significantly increased employment and incomes

Copyright 2014 © Professor Michael E. Porter 25 20140926—Porter Prize India Development Presentation—FINAL
Shared Value Through Cluster Development ITO EN, Japanese Tea Cluster
• ITO EN is the world's leading producer and marketer of loose leaf and bottled green tea. The
company sources 100% locally-grown green tea leaves
• ITO EN partners with farmers, government and other stakeholders to establish small and large
scale plantations using abandoned agricultural land
• The company purchases entire crops produced through this program, lowering sales costs
• The company provides assistance in modern farm management practices and technology,
working with growers to raise tea quality to meet ITO EN standards
• The program motivates and trains young people to take over tea growing when older farmers
retire
• Farmer incomes have risen due to increased quality and efficiency
• Land abandoned by retiring farmers has been restored to production, creating jobs and assuring
cluster sustainability by attracting young people
• Tea volume has expanded by 13% to date, providing ITO EN with adequate volume, consistent
quality, and reduced production costs
Copyright 2014 © Professor Michael E. Porter 26 20140926—Porter Prize India Development Presentation—FINAL
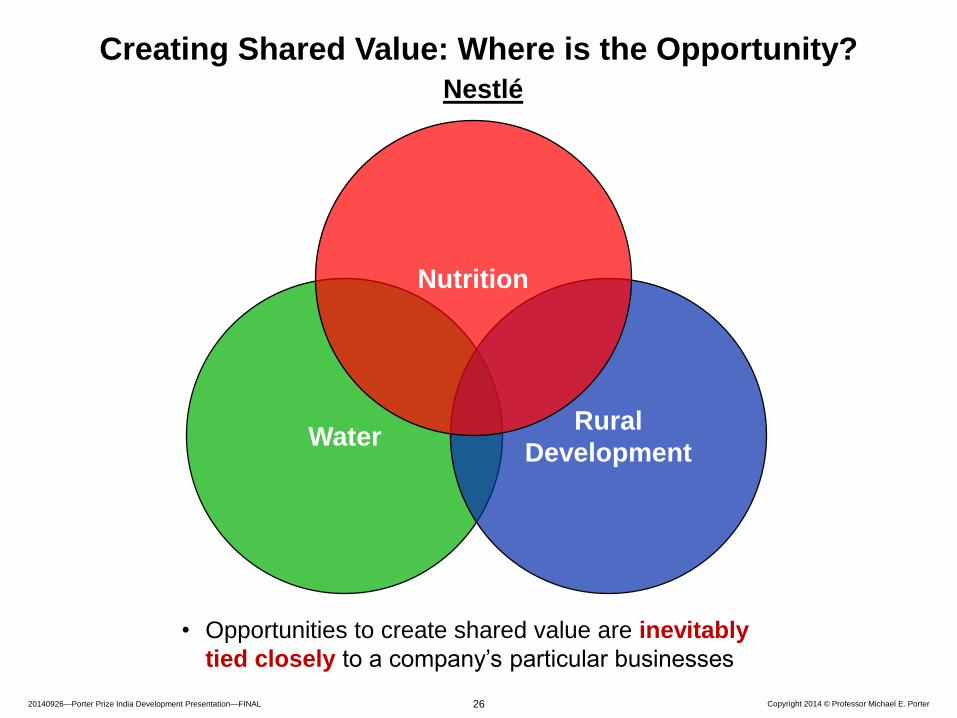
Creating Shared Value: Where is the Opportunity?
Nestlé
Water Rural
Development
Nutrition
• Opportunities to create shared value are inevitably
tied closely to a company’s particular businesses

Copyright 2014 © Professor Michael E. Porter 27 20140926—Porter Prize India Development Presentation—FINAL
The Purpose of Business
• The purpose in business is to create economic value while creating shared
value for society
• Businesses acting as businesses, not as charitable givers, are arguably the
most powerful force for addressing many of the pressing issues facing our
society
• Shared value will give rise to far broader opportunities for strategy and
economic value creation and will drive the next wave of innovation,
productivity, and economic growth
• A transformation of business practice around shared value will give purpose to
the corporation