effectiveness and performance of high friction … · 2016-09-01 · skid resistance is the ability...
TRANSCRIPT

Draft
EFFECTIVENESS AND PERFORMANCE OF HIGH FRICTION
SURFACE TREATMENTS AT A NATIONAL SCALE
Journal: Canadian Journal of Civil Engineering
Manuscript ID cjce-2016-0132.R1
Manuscript Type: Article
Date Submitted by the Author: 23-May-2016
Complete List of Authors: Li, Qiang; Oklahoma State University, School of Civil & Environmental Engineering Yang, Guangwei; Oklahoma State University Stillwater, Civil Engineering Wang, Kelvin; Oklahoma State University, Civil Engineering Zhan , You (Jason); Oklahoma State University Stillwater, Civil Engineering Merritt, David ; The Transtec Group, Inc.
Wang, Chaohui; Chang\'an University, Highway Engineering
Keyword: High Friction Surface Treatment (HFST), Friction Prediction, Multivariate Analyses
https://mc06.manuscriptcentral.com/cjce-pubs
Canadian Journal of Civil Engineering

Draft
1
EFFECTIVENESS AND PERFORMANCE OF HIGH FRICTION SURFACE
TREATMENTS AT A NATIONAL SCALE
Qiang Joshua Li (Corresponding Author)
School of Civil and Environmental Engineering
Oklahoma State University, Stillwater, OK
Telephone: 405-744-4638
Guangwei Yang
School of Civil and Environmental Engineering
Oklahoma State University, Stillwater, OK
Kelvin C.P. Wang
School of Civil and Environmental Engineering
Oklahoma State University, Stillwater, OK
You Zhan
School of Civil and Environmental Engineering
Oklahoma State University, Stillwater, OK
David Merritt
The Transtec Group, Inc., Austin, Texas
Chaohui Wang
School of Highway Engineering
Chang’an University, Xi’an, China
3,488 words + 8 figures (2, 000 words) + 3 tables (750 words) = 6,238 words
Page 1 of 30
https://mc06.manuscriptcentral.com/cjce-pubs
Canadian Journal of Civil Engineering

Draft
2
ABSTRACT
Although High Friction Surface Treatment (HFST) has been widely installed in recent
years, validation efforts considering various materials, installation ages, environmental
conditions, and traffic levels are missing primarily due to lacking of high-speed data
collection instruments. Utilizing laser imaging technology and fixed-slip friction tester,
this study collects comprehensive pavement surface data at 21 HFST sites in 11 states at
highway speeds. Measurements on HFST and untreated pavements are compared to
determine the effectiveness of HFST. Multivariate analyses are conducted to investigate
the impacts of factors on HFST friction. Average temperature and installation age are
identified as the significant factors. HFST sites constructed using calcined bauxite
aggregates exhibit better friction performance than those using flints. Subsequently,
friction models are developed to aid highway agencies in managing HFST.
Keywords: High Friction Surface Treatment (HFST), Effectiveness, Multivariate
Analysis, Friction Models
Page 2 of 30
https://mc06.manuscriptcentral.com/cjce-pubs
Canadian Journal of Civil Engineering
Draft
3
INTRODUCTION
High Friction Surfacing Treatments (HFST) were firstly applied in the United Kingdom
in 1960s to maintain pavement skid resistance and reduce the fatalities and injuries from
crashes that occur at or near horizontal curves (Brimley and Carlson 2012). Recently, the
Federal Highway Administration (FHWA) Office of Pavement Technology has
implemented the Surface Enhancements At Horizontal Curves program and Every Day
Counts 2 program to install HFST at numerous horizontal curves throughout the U.S. due
to higher friction demand of vehicles on curves and intersections than that on other
pavement sections (The Trans Tec Group 2015). Through various HFST projects, the
effectiveness of HFST in improving skid resistance and reducing crashes has been
demonstrated (Bledsoe 2015, Moravec 2013, State of South Dakota Department of
Transportation 2015, Bischoff 2008, Izeppi et al. 2010 and Waters 2011).
Generally pavement friction and macro-texture are tested before and after HFST
installation to quantify the changes in surface skid resistance. Pavement friction is
measured primarily using the Dynamic Friction Testers and agency-owned locked-wheel
skid testers, while macro-texture is measured using stationary or low speed devices such
as the Circular Track Meter, ASTM E 965 “Sand Patch” Method, or RoboTex (Moravec
2013 and Izeppi et al. 2010). Most of these devices require lane closure to perform the
tests, and highway agencies must perform multiple data collection processes to gather
different pavement surface characteristics. These limitations have constrained continuous
evaluation of the surface characteristics of installed HFST sites in the longer term after
they are opened to traffic. In addition, according to the authors' knowledge, no study has
Page 3 of 30
https://mc06.manuscriptcentral.com/cjce-pubs
Canadian Journal of Civil Engineering
Draft
4
been conducted to evaluate HFST performance at a national scale under various traffic
conditions, environments, and HFST materials.
This research applies the state-of-the-art 3D laser imaging based technology
named PaveVision3D Ultra with necessary software tools for data collection and
subsequent surface characterization for 21 HFST demonstration sites in 11 states as
instructed by FHWA. The PaveVision3D Ultra system is capable of automatically
conducting comprehensive pavement survey at full-lane coverage at 1mm resolution in
three dimensions at highway speed up to 60 mph, measuring pavement surface cracking,
profiling, texture, geometric parameters, and reconstructing 3D virtual pavement (Wang
2011). This single-pass and complete lane coverage platform provides an ideal solution to
evaluate the surface characteristics of HFST without interrupting traffic. In addition,
pavement friction data on HFST is collected using the FHWA continuous fixed-slip
friction tester, which uses a standardized smooth-tread test tire to measure friction in
terms of a uniteless friction number, Mu. Statistical data analysis is conducted to compare
the measured surface characteristics before, after, and on the HFST to determine the
effectiveness of the HFST. Multivariate analysis is included to identify the significant
levels of potential influencing factors on HFST friction performance. Subsequently,
pavement friction prediction models are developed for HFST.
HFST DATA COLLECTION AND SURFACE CHARACTERIZATION
HFST Data Collection
The data collection effort described herein includes testing of 21 HFST sites in 11 states
as instructed by FHWA. The locations of the HFST sites are shown in FIG. 1.
Page 4 of 30
https://mc06.manuscriptcentral.com/cjce-pubs
Canadian Journal of Civil Engineering

Draft
5
Considering the directions and number of lanes at each site, 41 data collections are
conducted, with each PaveVision3D data collection covering a full traffic lane. With the
exception of pavement friction data which are collected separately using FHWA's fixed-
slip friction tester, surface characteristics, including pavement rutting and macro-texture,
are measured for each HFST site using the 1mm PaveVision3D Ultra technology at
posted highway speed without interfering the traffic. To determine the effectiveness of
HFST in improving surface properties, all the data sets are collected beginning 300 ft to
500 ft before and through 300 ft to 500 ft after each HFST section.
Pavement Rutting
Rutting is defined as the permanent traffic-associated deformation within pavement
layers. The recent provisionally-approved AASHTO Designation PP69-10 (AASHTO
2013) has been implemented into the PaveVision3D system for rutting characterization
and cross slope measurements. Rutting in the left and right wheelpaths are averaged into
average rutting in inches for each image frame with a dimension of 6.7ft (2, 048mm) in
length and 13.4ft (4, 096mm) in width for each data collection. Rutting data are not
calculated for rigid pavement sections, which are represented with zero rutting values.
Pavement Friction
Skid resistance is the ability of the pavement surface to prevent the loss of tire traction.
The friction value from the HFST was reported every 1 ft over the length of the section
tested in order to show any variations in friction. Example friction data plots are shown in
FIG. 2. Some sites show clear improvements of skid resistance (as shown in FIG. 2.a)
and the differentiation of the HFST section from abutting pavement, while others don't
Page 5 of 30
https://mc06.manuscriptcentral.com/cjce-pubs
Canadian Journal of Civil Engineering

Draft
6
show any trend (as shown in FIG. 2.b), in part because they are older HFST installations
which may loss friction over time.
Pavement Macro-texture
The methodologies for texture measurement can be grouped into two categories: static
and high-speed methods. Traditionally the measurement of pavement macro-texture at
high-speed is based on single longitudinal or line-of-sight profile in the wheelpath. Mean
Profile Depth (MPD) is one of the widely used texture indices. Example MPD data plots
from the PaveVision3D Ultra system are shown in FIG. 3. Similar to friction data, some
sites show much higher MPD values on HFST surface in contrast to the abutting
pavement, while others don't show noticeable differences.
EVALUATION OF HFST EFFECTIVENESS
The 1mm 3D data are collected 300ft to 500ft before and/or after each HFST section so
that the measured surface characteristics before, after, and on the HFST sites can be
compared and statistical analyses performed to determine the effectiveness of the HFST
sites in improving surface characteristics. The beginning and end locations of each HFST
section are determined based on “event markers” from the field friction data collection,
and visually from collected 3D data sets. A paired t-test with equal variance is performed
for each HFST site. The t-test investigates the difference between the means of the non-
HFST and HFST treatment sections. At 95% confidence interval, if P-value is smaller
than 0.05, the null hypothesis is rejected and the mean of the two groups are significantly
different.
Page 6 of 30
https://mc06.manuscriptcentral.com/cjce-pubs
Canadian Journal of Civil Engineering
Draft
7
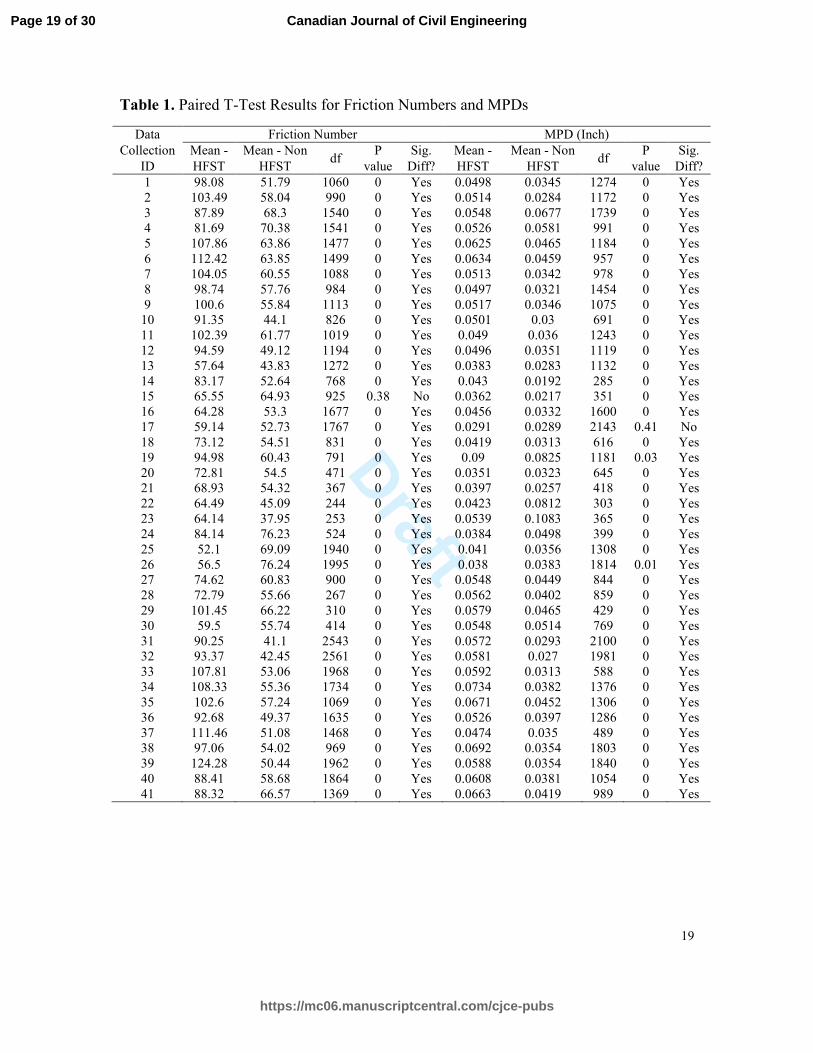
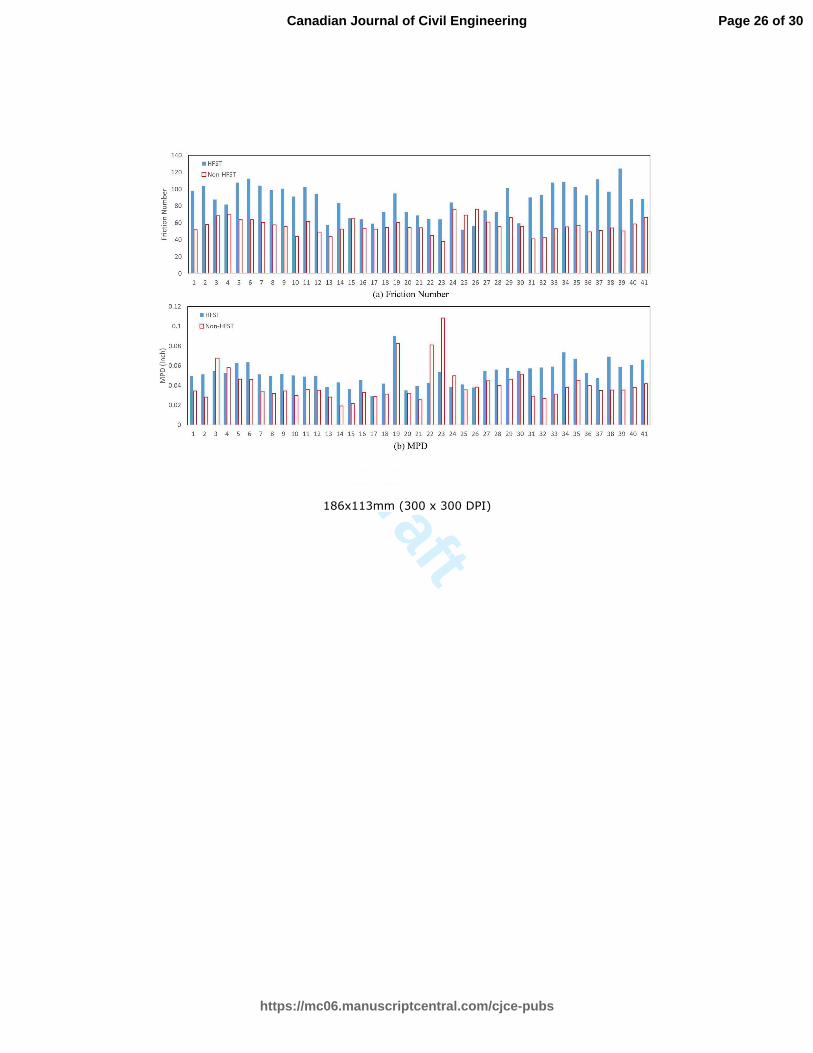
The friction and MPD data are reported at 1.0 ft interval. The t-test results for
friction number and MPD for each data collection are summarized in Table 1. It is
evident that HFST surfaces have significantly different friction numbers (with an average
P = 0.01 for all the HFST sites) and surface texture MPD values (with an average P =
0.01 for all the HFST sites) than those on the abutting pavement. The average friction
number of all HFST sites is 86.76, while the friction of non-HFST surface has an average
of 56.56. The average MPD of all HFST sites is 0.0522 inches (1.32 mm), while the
MPD of non-HFST surface has an average of 0.0410 inches (1.04 mm).
FIG. 4 shows the difference between the two means of friction numbers and
MPDs for each HFST data collection. The majority of the HFST sites have much larger
friction numbers and MPD values comparing to the non-HFST surfaces. However, there
are several exceptions. Sites 25 and 26 have smaller friction numbers on HFST surfaces
than those on the non-HFST surfaces. The deicer materials observed on the two HFST
locations during data collection may result in the lower friction numbers of the sites.
Approximately identical friction numbers are observed for Site 15 on HFST and non-
HFST surfaces. In addition, the friction on HFST of Site 30 is slightly higher than that on
the non-HFST surface even though the treatment was applied only one year prior to data
collection. For MPD, 5 out of 41 collections report smaller MPDs on HFST surfaces,
such sections including Sites 3, 4, 22, 23, and 24.
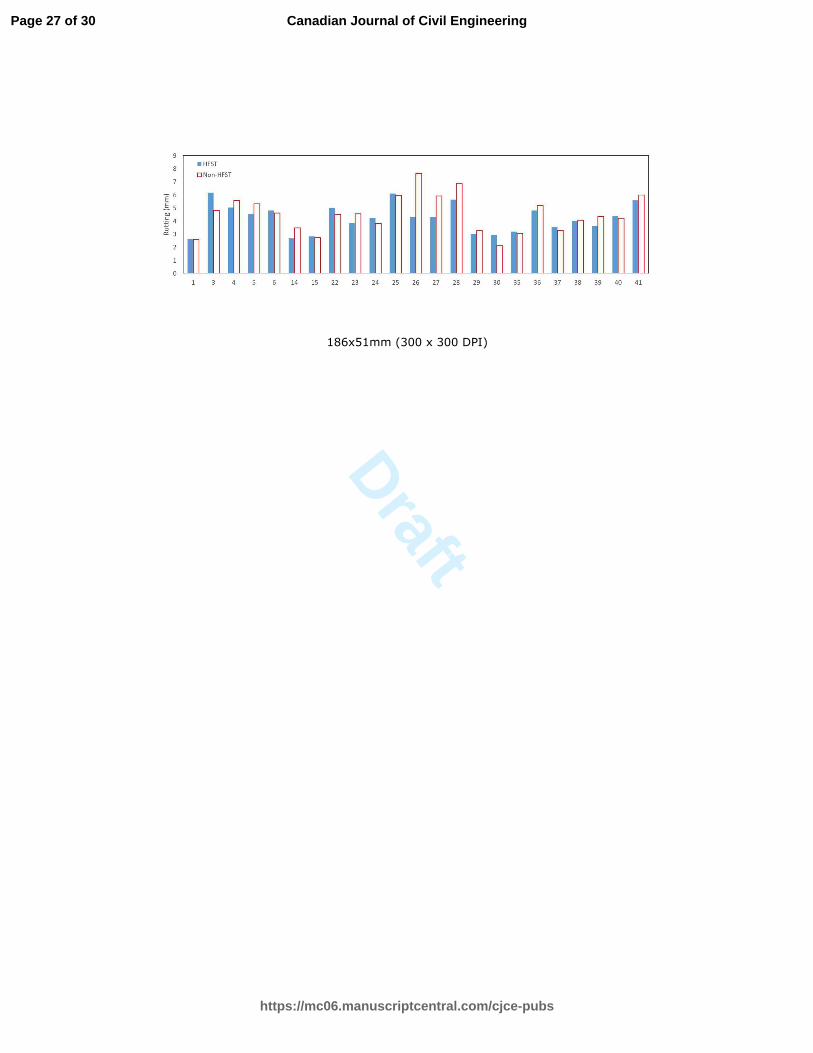
The comparisons of the average rutting on HFST and non-HFST of asphalt
pavement surfaces are shown in FIG. 5. No consistent statistical conclusion can be made
based on the t-test results: some sections have significantly different rutting while others
Page 7 of 30
https://mc06.manuscriptcentral.com/cjce-pubs
Canadian Journal of Civil Engineering
Draft
8
don't between HFST and non-HFST segments. This is logical since HFST treatments do
not correct rutting problems on existing pavement surfaces. The rutting on an HFST
surface is dependent on the pavement condition before the treatment. The average rutting
are 4.24 mm and 4.53 mm for HFST and non-HFST respectively. The average P-value is
0.14, which indicates that on average no significant difference is observed for rutting on
non-HFST versus HFST surfaces.
HFST FRICTION PERFORMANCE
Potential Influencing Factors
Influencing factors relating to pavement friction are generally categorized as pavement
surface characteristics, vehicle operational parameters, tire properties, and environmental
factors (Hall et al. 2009). The influence of asphalt mixture type and Portland cement
concrete surface textures on pavement friction has been widely researched (Asi 2007,
Ahammed and Tighe 2008). Several pavement friction models has been developed, some
of which are established based on macro- and micro-texture of mix aggregates (Ergun et
al. 2005). Operational factors including water film thickness, test speed, or temperature
are found to affect friction measurement (Flintsch et al. 2012 and Henry 2000). Studies
also find that temperature could affect pavement friction in short-term and long-term
(Ahammed and Tighe 2010, Luo 2003, and Fuents 2009).
Based on data availability in this study, precipitation, average temperature, HFST
installation age, aggregate type, and annual average daily traffic (AADT) for each HFST
site are identified as the potential influencing factors to evaluate the HFST friction
performance in the long-term and at a wider scale. Precipitation and average temperature
Page 8 of 30
https://mc06.manuscriptcentral.com/cjce-pubs
Canadian Journal of Civil Engineering

Draft
9
data are obtained from the climate station close to each HFST site. Two indicators,
friction number on HFST (FNHFST) and the ratio of friction number (FN Ratio) are used
to evaluate HFST pavement friction performance. Herein, FN Ratio is the friction number
on HFST (FNHFST) divided by the friction number on Non-HFST (FNNon-HFST).
FNRatio =�� ��
������ �� (1)
The potential influencing factors and corresponding friction information for each
data collection are provided in Table 2. FN Ratio, FNHFST, and FNNon-HFST for each data
collection are evaluated considering the aforementioned factors:
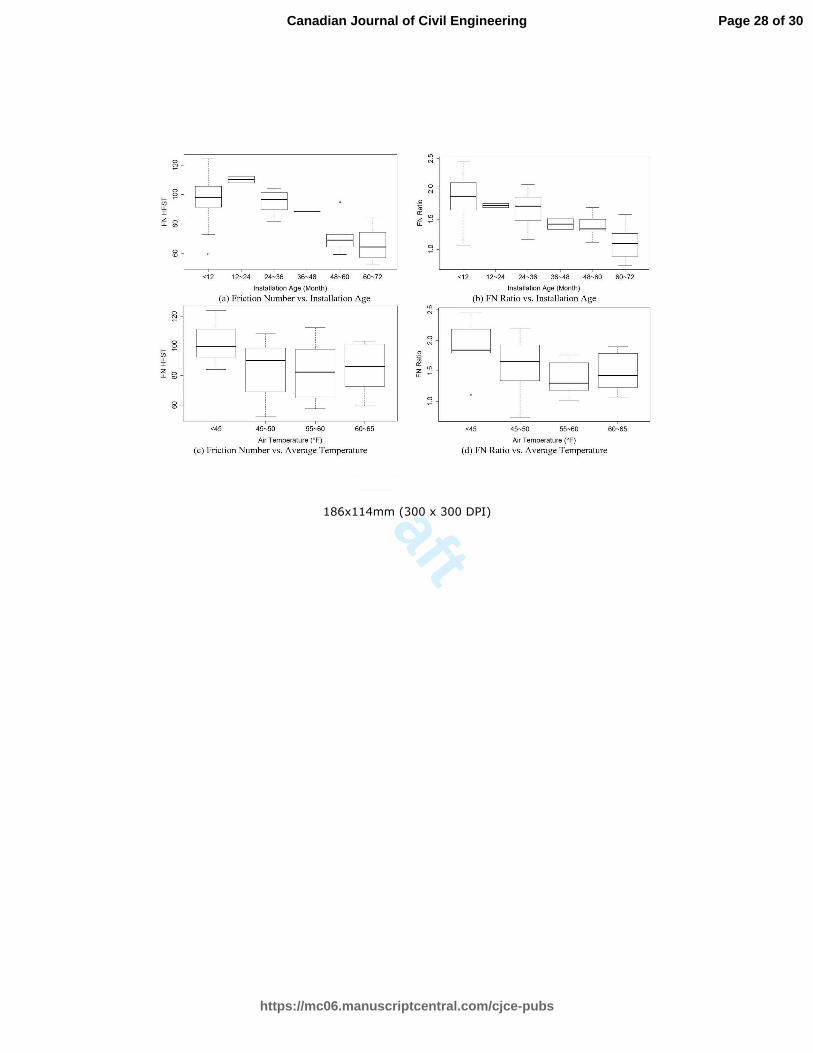
• As shown in FIG. 6, FN Ratio and FNHFST show decreasing trends with the
increase of HFST installation age and average temperature.
• For HFST sites with more than 60 month of installation age, FN Ratio in FIG.
6(b) approaches approximately 1.0, which indicates that the average life of a
HFST surface is around 5 years and the benefit of HFST in friction
effectiveness is nearly lost by that time.
• HFST sites installed with calcined bauxite aggregates exhibit better friction
performance than those with flints (FIG. 7).
• No trend is observed between friction performance (FN Ratio and FNHFST)
and precipitation, AADT respectively, neither does the accumulated traffic
volume (which is AADT times 365 days and HFST installation age).
• There is no obvious relationship between FNNon-HFST and the five influencing
factors.
Page 9 of 30
https://mc06.manuscriptcentral.com/cjce-pubs
Canadian Journal of Civil Engineering
Draft
10
Even though HFST sections in colder regions experience more frequent snow
plowing and deicing activities, it demonstrates that the effect of winter maintenance on
HFST performance has been minimal. On the contrary, higher temperature seems to
cause a softening effect on the HFST resin and possibly the underlying asphalt binder,
which would allow HFST aggregate to penetrate into the softened surface with reduced
macro-texture or lead to the loss of aggregate due to reduced bonding strength. As a
result, lower FN Ratio and FNHFST are measured on HFST sections in warmer regions. In
addition, HFST is subject to deterioration through climate and traffic wear, and therefore
older HFST sections show lower FN Ratio and FNHFST.
Intuitively, AADT should have an impact on pavement friction development since
pavement wears and friction values decrease with repetitive traffic applications. However,
majority of the HFST sites are located either on ramps or multiple-lane highways.
Detailed traffic data on ramps and for each lane of multiple-lane sections are not
available and the AADT values have to be estimated based on engineering judgment.
With more accurate traffic data, the relationship between AADT and friction may be
better revealed. It should also be noted that only one data collection was performed for
each HFST site and no time-series comparisons are available for each site. Most sites on
ramps are older in age but with much lower estimated AADT values, while sites on
mainline highways are younger in age but with higher traffic volumes. As a result, the
accumulated traffic volumes of HFST sites on ramps are less than that of the sites
installed more recently on mainline roads. Therefore, the friction number does not
decrease with the increase of accumulated traffic volume if various levels of traffic
Page 10 of 30
https://mc06.manuscriptcentral.com/cjce-pubs
Canadian Journal of Civil Engineering
Draft
11
volumes on all the tested HFST sites are considered simultaneously in the analysis. When
time-series data are available, the deterioration of friction for each site should be
noticeable as the site ages and carries more accumulate traffic.
Multivariate Analysis Results
Multivariate analysis is conducted to analyze the effect of the influencing variables on
FN Ratio, FNHFST, and FNNon-HFST. Precipitation, average temperature, HFST installation
age, AADT are continuous independent variables, while aggregate type is a categorical
variable and should be properly coded and quantified before multivariate analysis could
be performed. Herein bauxite aggregate is represented as ‘1’ while flint is coded as ‘0’ in
data preparation of model development. P-value is used to evaluate the significant level
of each influencing variable on the dependent outcomes (which are the two friction
performance measures). The multivariate analysis result is shown in Table 3.
At 95% confidence interval, if P-value is smaller than 0.05, the corresponding
variable has significant effect on the dependent variables. The P-values for average
temperature and HFST installation age are much smaller than 0.05, which means they
have significant effect on FN Ratio and FNHFST. The corresponding coefficient of those
two dependent variables are negative, which indicates that FN Ratio and FNHFST decrease
as those two variables increase. P-value of aggregate type (larger than 0.05) shows that it
is not a significant factor for FN Ratio and FNHFST. However the corresponding
coefficients of aggregate type are positive, which implies HFST using bauxite (coded as
‘1’) will add a positive number into the predicted FN Ratio or FNHFST while HFST using
flint (coded as ‘0’) doesn’t include such positive contribution to friction numbers. This
Page 11 of 30
https://mc06.manuscriptcentral.com/cjce-pubs
Canadian Journal of Civil Engineering

Draft
12
statistic results support the data shown in FIG. 7 that FN Ratio and FNHFST for HFST
using bauxite are generally greater than those using flint. For FNNon-HFST, P-values for all
the five variables are greater than 0.05, which indicates that the independent variables
have insignificant impacts on pavement friction for non-HFST sections.
Subsequently, multivariate analysis considering only the two significant
influencing factors (average temperature and installation age) is conducted and the results
are appended in Table 3. Both factors remain to be significant for the prediction of FN
Ratio. However, the P-value of average temperature on FNHFST is larger than 0.05, which
indicates that the impact of average temperature on FNHFST is not as significant as that of
installation age, which supports the data shown in FIG. 6(c) that FNHFST decreasing trend
is not as significant as that of installation age. The multiple linear regression models are
therefore developed as shown in Equation (2) to predict FN Ratio and FNHFST:
������� = 2.912 − 0.019 ∗ "#$%�&$'$()$%��*%$ − 0.013 ∗ "&$
��,-. = 130.027 − 0.507 ∗ "#$%�&$'$()$%��*%$ − 0.575 ∗ "&$ (2)
The predicted and measured FN Ratio and FNHFST for all the 41 data collections
are plotted in FIG. 8. The predictions follow similar development trend as the actual
measured FN Ratio and FNHFST, and the R-squared values are 0.55 and 0.50 respectively.
There are several potential reasons may cause the moderate R-squared values. Several
factors of many HFST sites may take the same values, which reduces the variability of
the data sets. For example, if HFST sites are close to each other in distance, the climate
data for these sites are obtained from one weather station and the same values of
precipitation and average temperature are used. For HFST sites with multiple lanes,
Page 12 of 30
https://mc06.manuscriptcentral.com/cjce-pubs
Canadian Journal of Civil Engineering

Draft
13
AADT data remains the same for the site for all lanes. More detailed and accurate data
could result in better friction prediction models with higher R-squared values.
CONCLUSIONS
This project applies the 3D laser imaging based PaveVision3D Ultra technology with
necessary software tools for data collection and subsequent surface characterization and
evaluation of the HFST demonstration sites. The 1mm 3D data for 21 HFST sites in 11
states with a total of 41 sections are collected for each traffic lane at the posted highway
speeds. Pavement rutting and macro-texture data are calculated from collected 1mm 3D
data sets, while pavement friction data are collected using FHWA's continuous fixed-slip
friction tester.
The measured surface characteristics on the HFST sites and untreated existing
pavements are compared and paired t-tests are performed to determine the effectiveness
of the HFST sites in improving surface characteristics. Strong evidence is found that the
HFST surfaces have statistically significant higher friction numbers and surface macro-
texture MPD values than those on the adjacent pavements without HFST. There exist
several exceptions to such trend, 2 sections for friction data and 5 sections for MPD data,
probably due to the long installation age and use of winter maintenance. Subsequently,
multivariate analysis are conducted to investigate the impacts of five independent
variables: precipitation, average temperature, HFST installation age, aggregate type, and
AADT, on HFST friction performance. Average temperature and HFST installation age
are identified to have significantly impact on friction number on HFST (FNHFST) and the
ratio of friction on HFST to that on non-HFST (FN Ratio). Based on the trend between
Page 13 of 30
https://mc06.manuscriptcentral.com/cjce-pubs
Canadian Journal of Civil Engineering
Draft
14
FN Ratio and installation age, the benefit of HFST in friction effectiveness is lost after
approximate 60 months (5 years) of service. HFST sites using calcined bauxite
aggregates exhibit higher friction performance than those using flints. The regressional
friction prediction models are therefore developed for HFST, which can be used to
predict the service life of HFST installation and aid decision making within a highway
agency. However, it should be noted that the models don’t consider the pavement
conditions before HFST application and HFST construction quality variations as the
dependent variables due to the unavailability of data. In addition, detailed traffic data for
ramps and each lane of sites with multiple lanes are not available and have to be
estimated during the model development.
ACKNOWLEDGEMENTS
This paper was prepared under research project, “3D Laser Imaging based Real Time
Pavement Surface Evaluation for High Friction Surfacing Treatments (HFST)”,
sponsored by the Federal Highway Administration (FHWA). The author would like to
thank Mr. Justin Thweatt and Mr. Rob Whirledge for collecting filed data for this project.
The opinions expressed in the paper are those of the authors, who are responsible for the
accuracy of the facts and data herein, and do not necessarily reflect the official policies of
the sponsoring agencies. This paper does not constitute a standard, regulation, or
specification.
References
AASTHO. 2013. Standard Practice for Determining Pavement Deformation Parameters
and Cross Slope from Collected Transverse Profiles. AASHTO Designation: PP69-
Page 14 of 30
https://mc06.manuscriptcentral.com/cjce-pubs
Canadian Journal of Civil Engineering

Draft
15
10. American Association of State Highway and Transportation Officials.
Washington, D.C.
Ahammed M.A. and Tighe S.L. 2008. Concrete Pavement Surface Textures and
Multivariables Frictional Performance Analysis: a North American Case Study.
Canadian Journal of Civil Engineering, 35(7): 727-738.
Ahammed M.A. and Tighe S.L. 2010. Effect of Short-term and Long-term Weather on
Pavement Surface Friction. International Journal of Pavement Research and
Technology, 3(6): 295-302.
Asi I. M. 2007. Evaluating Skid Resistance of Different Asphalt Concrete Mixes.
Building and Environment, 42: 325-329.
Bledsoe J. 2015. Missouri Demonstration Project: The Use of High-Friction Surface
Treatments on Missouri Highways. FHWA, U.S. Department of Transportation.
Available from
http://plan4operations.dot.gov/hfl/summary/pdf_2/Missouri%20High%20Friction%2
0Report%20draft%20Final.pdf [accessed 30 June 2015].
Bischoff D. 2008. Investigative Study of the Italgrip TM System. WI-04-08. Wisconsin
Department of Transportation, Madison, WI. Available from
http://wisdotresearch.wi.gov/wp-content/uploads/wi-04-08italgrip.pdf [accessed 20
June 2015].
Brimley B. and Carlson P. 2012. Using High Friction Surface Treatments to Improve
Safety at Horizontal Curves. Texas Transportation Institute. Available from
Page 15 of 30
https://mc06.manuscriptcentral.com/cjce-pubs
Canadian Journal of Civil Engineering

Draft
16
http://d2dtl5nnlpfr0r.cloudfront.net/tti.tamu.edu/documents/TTI-2012-8.pdf
[accessed 25 June 2015].
Ergun M., Iyinam S., and Iyinam A.F. 2005. Prediction of Road Surface Friction
Coefficient Using Only Macro- and Microtexture Measurements. Journal of
Transportation Engineering, 131(4): 311-319.
Flintsch G.W. et al. 2012. The Little Book of Tire Pavement Friction. Pavement Surface
Properties Consortium. Available from
https://secure.hosting.vt.edu/www.apps.vtti.vt.edu/1-
pagers/CSTI_Flintsch/The%20Little%20Book%20of%20Tire%20Pavement%20Fric
tion.pdf [accessed 1 May 2015].
Fuents L. G. 2009. Investigation of the Factors Influencing Skid Resistance and the
International Friction Index. PhD. Thesis, University of South Florida, Tampa, FL.
Hall J. W. et al. 2009. NCHRP Web Document 108: Guide for Pavement Friction. TRB,
National Research Council, Washington, D.C. Available from
http://onlinepubs.trb.org/onlinepubs/nchrp/nchrp_w108.pdf [accessed 14 May
2015].
Henry, J. J. 2000. NCHRP Synthesis 291: Evaluation of Pavement Friction
Characteristics. TRB, National Research Council, Washington, D.C.
Izeppi E., Flintsch G. and McGhee K. 2010. Field Performance of High Friction
Surfaces. Publication FHWA/VTRC 10-CR6. FHWA, U.S. Department of
Transportation. Available from
Page 16 of 30
https://mc06.manuscriptcentral.com/cjce-pubs
Canadian Journal of Civil Engineering

Draft
17
http://www.virginiadot.org/vtrc/main/online_reports/pdf/10-cr6.pdf [accessed 15
June 2015].
Luo Y. 2003. Effect of Pavement Temperature on Frictional Properties of Hot-Mix-
Asphalt Pavement Surfaces at the Virginia Smart Road. M.S. Thesis, Virginia
Polytechnic Institute and State University, Blacksburg, Va.
Moravec M. 2013. High Friction Surface Treatments at High-Crash Horizontal Curves.
Arizona Pavements/Materials Conference, Phoenix, AZ. Available from
http://www.intrans.iastate.edu/events/midcon2013/documents/presentation-
submissions/3-C_61_08142013.pdf [accessed 30 June 2015].
South Dakota Department of Transportation (SDDOT). 2015. Accelerated Innovation
Deployment (AID) Demonstration Project: High Friction Surface Treatment.
Available from
http://www.fhwa.dot.gov/accelerating/grants/pdfs/SD_2014_AID_Grant.pdf
[accessed 11 June 2015]
The Trans Tec Group, INC. 2015. Welcome to High Friction Roads. Available from
http://www.highfrictionroads.com [accessed 25 June 2015]
Wang Kelvin C. P. 2011. Elements of Automated Survey of Pavements and a 3D
Methodology. Journal of Modern Transportation, 19(1): 51-57.
Waters J. 2011. High Friction Surfacing Failure Mechanisms. 3rd International Surface
Friction Conference, Safer Road Surfaces – Saving Lives, Gold Coast, Australia.
Page 17 of 30
https://mc06.manuscriptcentral.com/cjce-pubs
Canadian Journal of Civil Engineering

Draft
18
LIST OF TABLES
Table 1. Paired T-Test Results for Friction Numbers and MPDs
Table 2. Potential Influencing Factors of HFST Friction Performance
Table 3. Multivariate Analysis Results
Page 18 of 30
https://mc06.manuscriptcentral.com/cjce-pubs
Canadian Journal of Civil Engineering
Draft
19
Table 1. Paired T-Test Results for Friction Numbers and MPDs
Data Friction Number MPD (Inch)
Collection Mean - Mean - Non df
P Sig. Mean - Mean - Non df
P Sig.
ID HFST HFST value Diff? HFST HFST value Diff?
1 98.08 51.79 1060 0 Yes 0.0498 0.0345 1274 0 Yes
2 103.49 58.04 990 0 Yes 0.0514 0.0284 1172 0 Yes
3 87.89 68.3 1540 0 Yes 0.0548 0.0677 1739 0 Yes
4 81.69 70.38 1541 0 Yes 0.0526 0.0581 991 0 Yes
5 107.86 63.86 1477 0 Yes 0.0625 0.0465 1184 0 Yes
6 112.42 63.85 1499 0 Yes 0.0634 0.0459 957 0 Yes
7 104.05 60.55 1088 0 Yes 0.0513 0.0342 978 0 Yes
8 98.74 57.76 984 0 Yes 0.0497 0.0321 1454 0 Yes
9 100.6 55.84 1113 0 Yes 0.0517 0.0346 1075 0 Yes
10 91.35 44.1 826 0 Yes 0.0501 0.03 691 0 Yes
11 102.39 61.77 1019 0 Yes 0.049 0.036 1243 0 Yes
12 94.59 49.12 1194 0 Yes 0.0496 0.0351 1119 0 Yes
13 57.64 43.83 1272 0 Yes 0.0383 0.0283 1132 0 Yes
14 83.17 52.64 768 0 Yes 0.043 0.0192 285 0 Yes
15 65.55 64.93 925 0.38 No 0.0362 0.0217 351 0 Yes
16 64.28 53.3 1677 0 Yes 0.0456 0.0332 1600 0 Yes
17 59.14 52.73 1767 0 Yes 0.0291 0.0289 2143 0.41 No
18 73.12 54.51 831 0 Yes 0.0419 0.0313 616 0 Yes
19 94.98 60.43 791 0 Yes 0.09 0.0825 1181 0.03 Yes
20 72.81 54.5 471 0 Yes 0.0351 0.0323 645 0 Yes
21 68.93 54.32 367 0 Yes 0.0397 0.0257 418 0 Yes
22 64.49 45.09 244 0 Yes 0.0423 0.0812 303 0 Yes
23 64.14 37.95 253 0 Yes 0.0539 0.1083 365 0 Yes
24 84.14 76.23 524 0 Yes 0.0384 0.0498 399 0 Yes
25 52.1 69.09 1940 0 Yes 0.041 0.0356 1308 0 Yes
26 56.5 76.24 1995 0 Yes 0.038 0.0383 1814 0.01 Yes
27 74.62 60.83 900 0 Yes 0.0548 0.0449 844 0 Yes
28 72.79 55.66 267 0 Yes 0.0562 0.0402 859 0 Yes
29 101.45 66.22 310 0 Yes 0.0579 0.0465 429 0 Yes
30 59.5 55.74 414 0 Yes 0.0548 0.0514 769 0 Yes
31 90.25 41.1 2543 0 Yes 0.0572 0.0293 2100 0 Yes
32 93.37 42.45 2561 0 Yes 0.0581 0.027 1981 0 Yes
33 107.81 53.06 1968 0 Yes 0.0592 0.0313 588 0 Yes
34 108.33 55.36 1734 0 Yes 0.0734 0.0382 1376 0 Yes
35 102.6 57.24 1069 0 Yes 0.0671 0.0452 1306 0 Yes
36 92.68 49.37 1635 0 Yes 0.0526 0.0397 1286 0 Yes
37 111.46 51.08 1468 0 Yes 0.0474 0.035 489 0 Yes
38 97.06 54.02 969 0 Yes 0.0692 0.0354 1803 0 Yes
39 124.28 50.44 1962 0 Yes 0.0588 0.0354 1840 0 Yes
40 88.41 58.68 1864 0 Yes 0.0608 0.0381 1054 0 Yes
41 88.32 66.57 1369 0 Yes 0.0663 0.0419 989 0 Yes
Page 19 of 30
https://mc06.manuscriptcentral.com/cjce-pubs
Canadian Journal of Civil Engineering

Draft
20
Table 2. Potential Influencing Factors of HFST Friction Performance
ID
Precipitation Air Data Installation
Aggregate AADT
FN
(Inch) Temperature Collection Age FNHFST FNNon-HFST Ratio
(°F) Speed (MPH) (Month)
1 34.6 51.3 40 30 Bauxite 14167 104.05 60.55 1.72
2 34.6 51.8 40 30 Bauxite 14167 98.74 57.76 1.71
3 34.6 51.9 40 30 Bauxite 14167 100.6 55.84 1.8
4 34.6 51.4 40 30 Bauxite 14167 91.35 44.1 2.07
5 34.6 52.3 40 30 Bauxite 14167 102.39 61.77 1.66
6 34.6 51.8 40 30 Bauxite 14167 94.59 49.12 1.93
7 37.7 86.2 40 30 Bauxite 13500 87.89 68.3 1.29
8 37.7 85.2 40 30 Bauxite 13500 81.69 70.38 1.16
9 12.8 38.5 30 63 Flint 2760 84.14 76.23 1.1
10 14 39 40 63 Flint 5955 52.1 69.09 0.75
11 14 38.5 40 63 Flint 5955 56.5 76.24 0.74
12 35.5 33.9 40 64 Flint 26165 57.64 43.83 1.32
13 35.5 33.7 30 64 Flint 1717 83.17 52.64 1.58
14 35.5 33.8 30 64 Flint 1717 65.55 64.93 1.01
15 34.3 36.5 40 64 Flint 6350 64.28 53.3 1.21
16 27.2 50 40 4 Bauxite 400 102.6 57.24 1.79
17 27.2 50.9 40 4 Bauxite 400 92.68 49.37 1.88
18 27.2 50.7 40 4 Bauxite 400 111.46 51.08 2.18
19 27.2 37.5 40 4 Bauxite 1720 97.06 54.02 1.8
20 27.2 37.8 40 4 Bauxite 1720 124.28 50.44 2.46
21 26.4 31.4 40 4 Bauxite 8420 90.25 41.1 2.2
22 26.4 32.1 40 4 Bauxite 8420 93.37 42.45 2.2
23 26.4 32.4 40 4 Bauxite 8420 107.81 53.06 2.03
24 26.4 31.9 40 4 Bauxite 8420 108.33 55.36 1.96
25 48.4 53.1 30 4 Bauxite 6400 98.08 51.79 1.89
26 48.4 51.7 30 4 Bauxite 9810 103.49 58.04 1.78
27 55.4 43.8 40 17 Bauxite 2100 107.86 63.86 1.69
28 55.4 44 40 17 Bauxite 2100 112.42 63.85 1.76
29 30.7 44.5 30 51 Flint 10510 59.14 52.73 1.12
30 34 50.8 30 51 Flint 4291 73.12 54.51 1.34
31 30.2 41.7 30 51 Bauxite 3300 94.98 60.43 1.57
32 30.2 44.3 30 51 Bauxite 3400 72.81 54.5 1.34
33 30.2 44.2 30 51 Bauxite 3400 68.93 54.32 1.27
34 30.2 49.4 20 51 Bauxite 2750 64.49 45.09 1.43
35 30.2 45.1 20 51 Bauxite 2750 64.14 37.95 1.69
36 44 58.6 30 9 Bauxite 1300 74.62 60.83 1.23
37 44 58.6 30 9 Bauxite 1300 72.79 55.66 1.31
38 44 55.8 30 9 Bauxite 1300 101.45 66.22 1.53
39 44 55.3 30 9 Bauxite 1300 59.5 55.74 1.07
40 36.8 47 40 39 Bauxite 15500 88.41 58.68 1.51
41 36.8 46.3 40 39 Bauxite 15500 88.32 66.57 1.33
Page 20 of 30
https://mc06.manuscriptcentral.com/cjce-pubs
Canadian Journal of Civil Engineering

Draft
21
Table 3. Multivariate Analysis Results
Variables FN Ratio FN HFST FN Non-HFST
Coefficients P-value Coefficients P-value Coefficients P-value
Considering All Five Independent Factors
Intercept 3.113 0.000 146.258 0.000 40.368 0.012
Precipitation
(Inch) 0.016 0.074 1.027 0.020 -0.210 0.495
Average
Temperature
(°F)
-0.037 0.003 -1.626 0.005 0.459 0.250
Installation
Age (Month) -0.011 0.000 -0.473 0.001 0.061 0.523
Aggregate 0.064 0.684 1.978 0.791 -1.517 0.780
AADT 0.000 0.265 0.000 0.462 0.000 0.619
Considering only the Two Independent Factors that have Significant Influence
Intercept 2.912 2.62E-10 130.027 2.07E-09 42.056 0.000
Average
Temperature
(°F)
-0.019 0.006 -0.507 0.111 0.229 0.272
Installation
Age (Month) -0.013 1.05E-07 -0.575 4.07E-07 0.094 0.141
Page 21 of 30
https://mc06.manuscriptcentral.com/cjce-pubs
Canadian Journal of Civil Engineering
Draft
22
LIST OF FIGURES
FIG. 1. HFST Sites
FIG. 2. Example Friction Data
FIG. 3. Example MPD Data
FIG. 4. Average Friction Numbers and MPDs for HFST Sites
FIG. 5. Average Rutting for HFST Sites
FIG. 6. HFST Friction Performance vs. Installation Age and Average Temperature
FIG. 7. HFST Friction Performance vs. Aggregate Type
FIG. 8. HFST Friction Performance Prediction
Page 22 of 30
https://mc06.manuscriptcentral.com/cjce-pubs
Canadian Journal of Civil Engineering

Draft
175x95mm (300 x 300 DPI)
Page 23 of 30
https://mc06.manuscriptcentral.com/cjce-pubs
Canadian Journal of Civil Engineering

Draft
93x111mm (300 x 300 DPI)
Page 24 of 30
https://mc06.manuscriptcentral.com/cjce-pubs
Canadian Journal of Civil Engineering

Draft
91x111mm (300 x 300 DPI)
Page 25 of 30
https://mc06.manuscriptcentral.com/cjce-pubs
Canadian Journal of Civil Engineering
Draft
186x113mm (300 x 300 DPI)
Page 26 of 30
https://mc06.manuscriptcentral.com/cjce-pubs
Canadian Journal of Civil Engineering
Draft
186x51mm (300 x 300 DPI)
Page 27 of 30
https://mc06.manuscriptcentral.com/cjce-pubs
Canadian Journal of Civil Engineering
Draft
186x114mm (300 x 300 DPI)
Page 28 of 30
https://mc06.manuscriptcentral.com/cjce-pubs
Canadian Journal of Civil Engineering

Draft
98x115mm (300 x 300 DPI)
Page 29 of 30
https://mc06.manuscriptcentral.com/cjce-pubs
Canadian Journal of Civil Engineering

Draft
184x114mm (300 x 300 DPI)
Page 30 of 30
https://mc06.manuscriptcentral.com/cjce-pubs
Canadian Journal of Civil Engineering