effects of tunnelling on pile foundations - geomarc 2014.pdf · effects of tunnelling on pile...
TRANSCRIPT
Effects of tunnelling on pile foundations
Francesco Basilen
Geomarc Ltd., Via G. Bruno 106, 98123 Messina, Italy
Received 21 June 2012; received in revised form 14 May 2013; accepted 14 November 2013Available online 9 May 2014
Abstract
An efficient analysis method is presented for estimating the effects induced by tunnelling on existing pile foundations. The method is based ona two-stage procedure: (1) an estimate of the free-field ground movements caused by the tunnel excavation, and (2) an analysis of the pile groupsubjected to the computed free-field ground movements. The first step may be carried out using alternative approaches, ranging from empiricalmethods to 3D numerical analyses. The second step is performed by PGROUPN, a computer program for pile-group analysis based on a non-linear boundary element solution. The validity of the approach is assessed by comparing it with alternative numerical solutions and fieldmeasurements. The results indicate that the method is capable of generating reasonable predictions of pile response for many cases of practicalinterest, thus offering substantial cost savings over a complete 3D analysis of tunnel–soil–pile interaction.& 2014 The Japanese Geotechnical Society. Production and hosting by Elsevier B.V. All rights reserved.
Keywords: Piles; Pile groups; Tunnels
1. Introduction
Tunnelling in soft grounds inevitably causes ground move-ments, both vertical and lateral, which may have an impact onexisting pile foundations. In such cases, at least two importantaspects must be considered by the designer:
(1) The movements of the piles caused by the ground move-ments in order to ensure structural serviceability;
(2) The additional forces and/or bending moments induced in
the piles by the ground movements in order to ensurestructural integrity of the piles.
Current analysis methods to evaluate the effects of tunnel-ling on existing pile foundations belong to two categories:
(a) Simplified two-stage approaches involving the initial separa-tion of the soil and the piles so that the soil movements arefirst computed and then imposed on the piles;
(b) Complete numerical analyses including simultaneous mod-elling of the piles, the soil, and the tunnel excavation.
The latter category is generally based on three-dimensionalfinite element (FEM) or finite difference (FDM) analyseswhich provide a complete solution to the tunnel–soil–pileinteraction (e.g., Mroueh and Shahrour, 2002; Zhang andZhang, 2013). While such solutions are the most powerful
The Japanese Geotechnical Society
www.sciencedirect.comjournal homepage: www.elsevier.com/locate/sandf
Soils and Foundations
http://dx.doi.org/10.1016/j.sandf.2014.04.0040038-0806/& 2014 The Japanese Geotechnical Society. Production and hosting by Elsevier B.V. All rights reserved.
nTel.: þ39 090 2939038; mobile: þ39 338 7038381;fax: þ39 090 2926576.
E-mail address: [email protected] review under responsibility of The Japanese Geotechnical Society.
Soils and Foundations 2014;54(3):280–295
numerical tools currently available, they are very expensivein terms of data preparation (pre- and post-processing) andcomputational time. The cost of such analyses may becomeprohibitively high if non-linear soil behaviour and compli-cated construction sequences are to be taken into account.In addition to the computational requirements, complete 3Dnumerical analyses are complex when use for design purposes,particularly when non-linear behaviour is to be considered.Major difficulties are related to the construction and theinterpretation of the 3D model (modelling errors are easilyoverlooked), the high mesh dependency, the uncertainty inassigning mechanical properties to the pile–soil interfaceelements, the interaction with adjacent structures, and themodelling of the excavation sequence (e.g., Poulos, 2001;Brinkgreve and Broere, 2003). Thus, a complete 3D analysis ismore suitable for obtaining the benchmark solutions (againstwhich simpler analyses can be checked) or for obtaining thefinal design solution for major projects, than for use as apractical tool for less demanding problems or in the prelimin-ary design stages (in which multiple tunnel configurations andscenarios have to be examined).
In order to overcome the above shortcomings, simplifiedapproaches have emerged (e.g., Chen et al., 1999; Xu andPoulos, 2001; Loganathan et al., 2001; Kitiyodom et al., 2005;Surjadinata et al., 2006). Such approaches are based on a two-stage procedure:
(1) evaluation of the free-field ground movements caused bythe tunnel excavation;
(2) analysis of the piles subjected to the computed free-fieldground movements.
In simplified approaches, the tunnelling-induced groundmovements are generally evaluated in free-field conditions, i.e., in the absence of piles. This generally is a conservativeassumption as the presence of piles increases the soil stiffness,thereby reducing the induced ground movements, as demon-strated numerically by Mroueh and Shahrour (2002).
1.1. Estimation of soil movements
Estimation of tunnelling-induced ground movements can becarried out using alternative procedures, namely, empiricalmethods, analytical expressions, and numerical analyses. Eachmethod has its own strengths and weaknesses.
Empirical methods are based on a Gaussian error function(Peck, 1969; Mair et al., 1996) and are widely employed inengineering practice. The main limitations are related to theirapplicability to different tunnel geometries, ground conditions,and construction techniques, and in the limited informationthey provide about horizontal movements and subsurfacesettlements.
In light of the above limitations, a number of closed-formanalytical solutions have been proposed (Sagaseta, 1987;Verruijt and Booker, 1996). In particular, the analyticalexpressions developed by Loganathan and Poulos (1998)
for the estimation of surface settlements, subsurface verticalmovements, and subsurface horizontal movements, eventhough strictly valid for a linear elastic half-space, have theadvantage of being able to take into account the variousconstruction methods and the non-linear ground movements(due to an oval-shaped gap) around the tunnel–soil interface.Such expressions allow the rapid estimation of grounddeformations by using a simple soil parameter (i.e., thePoisson's ratio), and their applicability has been successfullyverified through comparison with a number of case histories.While empirical and analytical methods provide a simple
and practical means of estimating tunnelling-induced groundmovements, numerical analyses (generally based on FEM orFDM) provide the most powerful tool for carrying out suchpredictions because of their ability to consider such factors asground heterogeneity, soil nonlinearity, advanced soil models,3D effects, complex tunnel geometries, the interaction withsurrounding structures, and the tunnel construction method andsequence. In addition, numerical analyses allow for considera-tion of the near-field ground response around the tunnel (say inthe region within one tunnel diameter) where the effect offactors, such as plastic strain, stress–path dependence, con-solidation or the excavation method, becomes prominent.However, even though favourable comparisons with measuredground movements have been reported (e.g., Lee et al., 1994;Surjadinata et al., 2006), finite element models are oftenknown to overpredict the width and to underpredict thegradient of the settlement trough (e.g., Chen et al., 1999;Pound, 2003). To obtain better predictions, it is oftennecessary to use advanced soil models and to carefully selectthe corresponding model parameters. Moreover, the designershould bear in mind the complexity and high computationalcosts involved, particularly if non-linear soil behaviour and 3Deffects have to be taken into account.
1.2. Analysis of pile response
The second step of the procedure is usually carried out via acontinuum-based or Winkler spring analysis of the pilessubjected to the vertical and lateral tunnelling-induced soilmovements evaluated using any of the methods describedabove. Current analysis methods are mainly restricted to purelyelastic analyses or to single isolated piles (e.g., Chen et al.,1999; Xu and Poulos, 2001; Kitiyodom et al., 2005). It isindeed generally assumed that the effects of group interactionare beneficial to the pile response as compared to singleisolated piles, i.e., group effects lead to a reduction in thedeformations, forces, and moments induced in the piles.
2. PGROUPN analysis
The proposed analysis is based on the two-step approachdescribed above and is carried out with PGROUPN (Basile,2003, 2010), a computer program for pile-group analysis whichis commonly adopted in pile design through the software Repute(Geocentrix Ltd., 2012). The main feature of the program lies inits capability to provide a 3D non-linear boundary element
F. Basile / Soils and Foundations 54 (2014) 280–295 281
(BEM) solution of the soil continuum while incurring negligiblecomputational costs. Use of a non-linear soil model is of basicimportance in the design, as it enables the avoidance of theexaggeration of stress at the pile group corners (a commonlimitation of purely linear models), thereby reducing consequenthigh loads and moments. Further, compared to FEM or FDManalyses, BEM provides a complete problem solution in termsof boundary values only, specifically at the pile–soil interface.This leads to a drastic reduction in unknowns to be solved,thereby resulting in substantial savings in computing time anddata preparation effort.
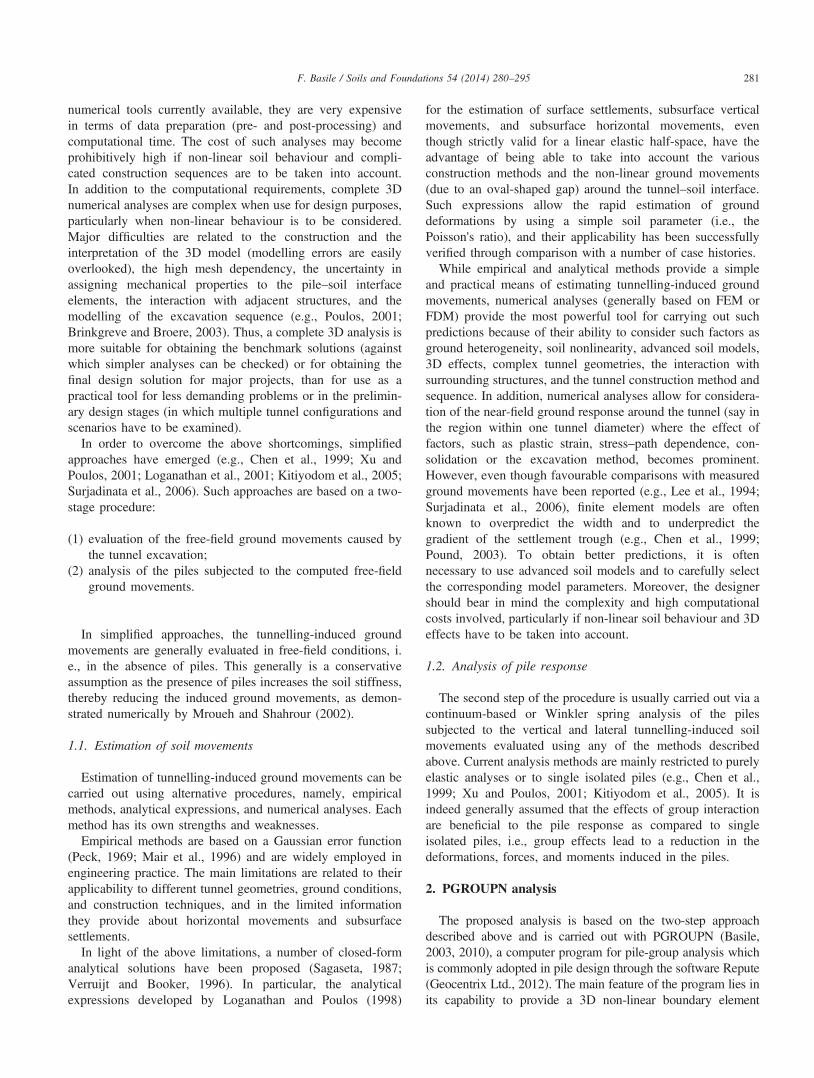
The analysis involves the discretisation of only the pile–soilinterface into a number of cylindrical boundary elements,while the base is represented by a circular (disc) element, asillustrated in Fig. 1. The behaviour of each element isconsidered at a node (located at the mid-height of the elementon the centre line of the pile), with the distributions of thestress components at the pile–soil interface which are assumedto be uniform over each element. The analysis takes intoaccount the simultaneous influence of all elements of all pilesin the group, i.e., the “complete” solution of the soil continuumis adopted. Pile-group effects are therefore evaluated as amatter of course, thereby overcoming the approximations ofthe traditional interaction factor approach and the fundamentallimitations of the Winkler models (based on empirical multi-pliers to account for group action). In addition, by retainingsoil continuity, the input soil parameters required byPGROUPN have a clear physical meaning (e.g., the soil'sYoung's modulus and strength properties) and can be measureddirectly in a soil investigation. This aspect represents asignificant advantage over Winkler approaches (such as thet–z and p–y curve methods) which disregard soil continuity,and therefore, have to rely on empirical parameters (e.g., themodulus of subgrade reaction).
The main capabilities of the PGROUPN program aresummarised below:
� based on 3D complete BEM solution of the soil continuum;� models all relevant interactions (i.e., pile–soil, pile–pile,
raft–soil, and pile–raft);� piles in any configuration and having different character-
istics within the same group (e.g., stiffness, length, rake,shaft, and base diameter);
� piles connected by rigid and, if appropriate, ground-contacting cap;
� non-homogeneous and layered soil profiles;� linear or non-linear continuum-based soil model;� general 3D loading conditions, including any combination
of vertical, horizontal, moment, and torsional loading;� output includes the distribution of displacements, stress,
forces, and moments along the piles, plus the normal stress,displacements, and rotations of the pile cap.
In this paper, the PGROUPN analysis, originally developedfor direct applied loading at the pile cap level, has beenextended to deal with externally imposed ground movementswhich may be acting in the vertical and two orthogonalhorizontal directions. The analysis is able to consider the casein which the vertical and horizontal soil movements acttogether, thereby simultaneously affecting both the axial andthe lateral response of the pile group. This feature represents anadvance over previous work in which the axial and the lateralpile responses are computed separately. It is noted that theextended PGROUPN analysis may be employed not only inthe tunnelling case described herein, but in many circum-stances in which pile foundations are subjected to “passive”loadings arising from vertical and horizontal movements of thesurrounding ground. Examples include slope movement,excavation, the consolidation of clay, the swelling or shrinkingof expansive clay, cavity development, the construction ofadjacent piles or buildings, and kinematic effects induced byearthquakes (Basile, 2012).A detailed description of the theoretical formulation of the
PGROUPN analysis for the case of direct applied (“active”)loading has been presented elsewhere (Basile, 1999, 2003).The modelling of the pile–soil interaction problem due to“active” and “passive” loading is quite similar, and hence, onlya brief outline of the passive case is given below. The methodemploys a sub-structuring technique in which the piles and thesurrounding soil are initially considered separately and thencoupled by imposing the displacement compatibility (us=up)and stress equilibrium (ts=� tp) conditions at the pile–soilinterface.
2.1. Soil domain
Assuming purely linear elastic soil behaviour, the soildisplacements, arising from both the stress caused by thepile–soil interaction and the external source of the groundmovements, may be expressed as (e.g., Poulos, 1989)
fusg ¼ ½Gs�ftsgþfueg ð1Þwhere us are the soil displacements, ts is the soil stress, Gs isthe soil flexibility matrix obtained from Mindlin's (1936)solution, and ue are the external soil movements. It is notedthat Mindlin's solution is rigorously applicable to homoge-neous soil conditions. In practice, however, this limitation isnot strictly adhered to, and multi-layered soil profiles are oftentreated using the averaging procedure adopted by Poulos
Tunnel
H
Vertical and horizontal profiles of free-field ground movements caused by tunnel excavation
.
.
.
.
.
.
.
.
.
.
.
.
.
.
.
.
.
.
Elementnodes
Rigid cap
M V
. ..
Fig. 1. BEM schematisation of the problem.
F. Basile / Soils and Foundations 54 (2014) 280–295282
(1979, 1990, 2009), i.e., in the evaluation of the influence ofone loaded element on another, the value of the soil modulus istaken as the mean of the values at the two elements.
2.2. Pile domain
If the piles are assumed to act as simple (elastic) beam-columns, which are fixed at their heads to a pile cap, the piledisplacements may then be written as
fupg ¼ ½Gp�ftpg ð2Þwhere up are the pile displacements, tp is the pile stress, and Gp
is a matrix of coefficients obtained from the elementary(Bernoulli–Euler) beam theory.
2.3. Limiting stress and non-linear soil behaviour
The foregoing procedure is based on the assumption that thesoil behaviour is linear elastic. However, it is essential toensure that the stress state at the pile–soil interface does notviolate the yield criteria. This can be achieved by specifyingthe limiting stress at the pile–soil interface, using the classicalequations for the ultimate skin friction, the end bearingcapacity, and the lateral pressure (e.g., Basile, 2003).In addition, non-linear soil behaviour is modelled, in anapproximate manner, by assuming that the tangent soil'sYoung's modulus (Etan) varies with the pile–soil interfacestress (t) according to the common hyperbolic stress–strainlaw:
E tan ¼ Ei 1� Rf t
tlim
� �2
ð3Þ
where Ei is the initial soil modulus, Rf is the hyperbolic curve-fitting constant, and tlim is the limiting value of the pile–soilstress. Thus, the soil and the pile equations described above forthe linear response are solved incrementally using the modifiedvalues of the soil's Young's modulus of Eq. (3) within the soilmatrix [Gs], while enforcing the conditions of yield, equili-brium, and compatibility at the pile–soil interface (Poulos,1989; Basile, 1999).
3. Numerical results
The validity of the approach is verified through a compar-ison with published results from alternative numerical ana-lyses. Attention will be focused on the effects of groupinteraction and soil nonlinearity.
3.1. Comparison with Kitiyodom et al. (2005)
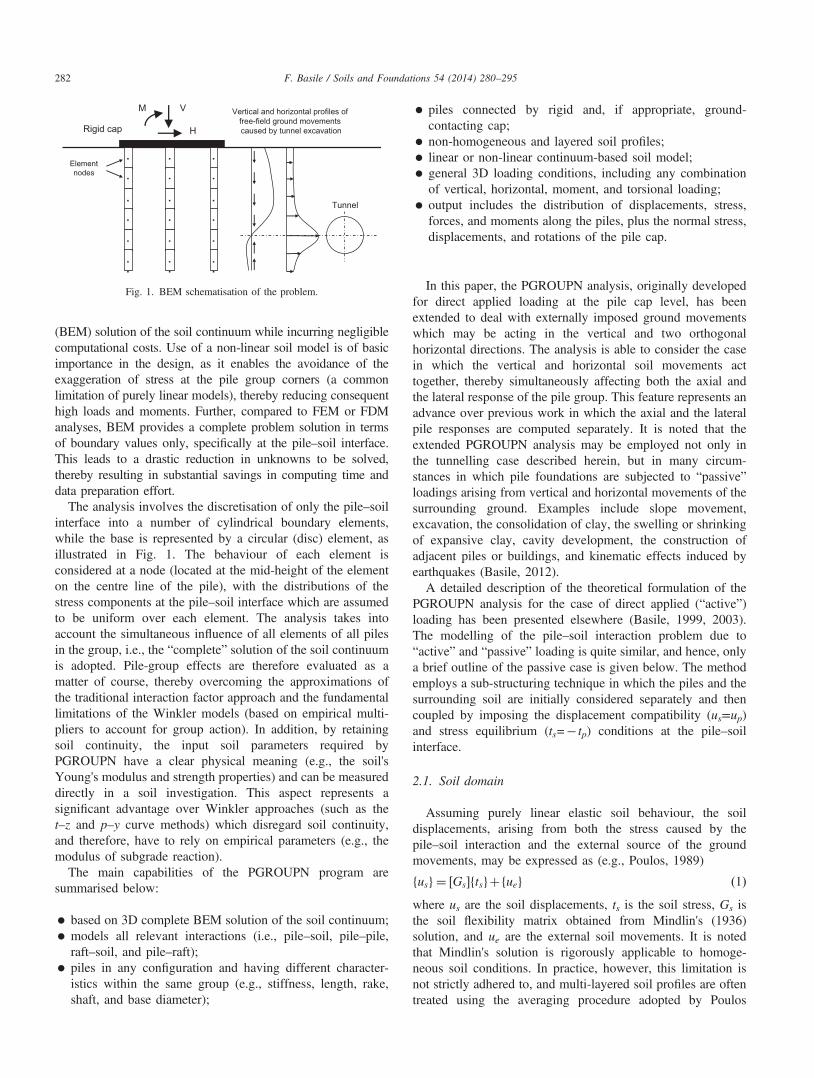
The accuracy of the PGROUPN analysis is assessed for thecase of an existing single pile adjacent to a tunnel underconstruction, as illustrated in Fig. 2. The free-field tunnelling-induced soil movement profiles to be input into the pileanalysis have been calculated using the analytical expressionsof Loganathan and Poulos (1998), as shown in Fig. 3. Asexpected, the soil movements increase with an increasing
ground loss ratio (ɛ) from 1% (a common design value) to 5%(an extreme value for which, in effect, the elastic assumptionof the analytical solution is less valid). The vertical groundmovements increase gradually with depth to a maximumlocated near the tunnel crown (at a depth of 17 m). Belowthis level, the vertical ground movements decrease rapidlywhile the lateral ground movements become dominant. Belowthe tunnel invert (at a depth of 23 m), both vertical and lateralground movements quickly decrease with depth.Assuming that no direct load (either vertical or horizontal) is
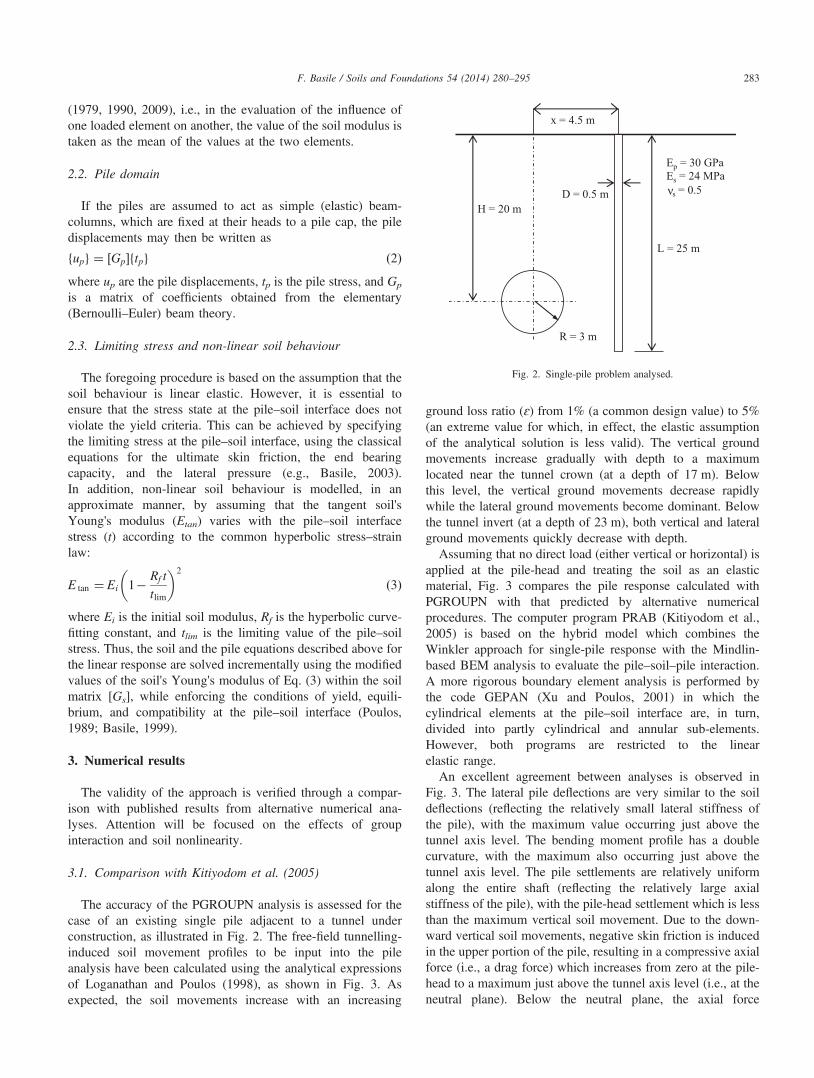
applied at the pile-head and treating the soil as an elasticmaterial, Fig. 3 compares the pile response calculated withPGROUPN with that predicted by alternative numericalprocedures. The computer program PRAB (Kitiyodom et al.,2005) is based on the hybrid model which combines theWinkler approach for single-pile response with the Mindlin-based BEM analysis to evaluate the pile–soil–pile interaction.A more rigorous boundary element analysis is performed bythe code GEPAN (Xu and Poulos, 2001) in which thecylindrical elements at the pile–soil interface are, in turn,divided into partly cylindrical and annular sub-elements.However, both programs are restricted to the linearelastic range.An excellent agreement between analyses is observed in
Fig. 3. The lateral pile deflections are very similar to the soildeflections (reflecting the relatively small lateral stiffness ofthe pile), with the maximum value occurring just above thetunnel axis level. The bending moment profile has a doublecurvature, with the maximum also occurring just above thetunnel axis level. The pile settlements are relatively uniformalong the entire shaft (reflecting the relatively large axialstiffness of the pile), with the pile-head settlement which is lessthan the maximum vertical soil movement. Due to the down-ward vertical soil movements, negative skin friction is inducedin the upper portion of the pile, resulting in a compressive axialforce (i.e., a drag force) which increases from zero at the pile-head to a maximum just above the tunnel axis level (i.e., at theneutral plane). Below the neutral plane, the axial force
H = 20 m
x = 4.5 m
R = 3 m
D = 0.5 m
L = 25 m
Ep = 30 GPaEs = 24 MPa
s = 0.5ν
Fig. 2. Single-pile problem analysed.
F. Basile / Soils and Foundations 54 (2014) 280–295 283
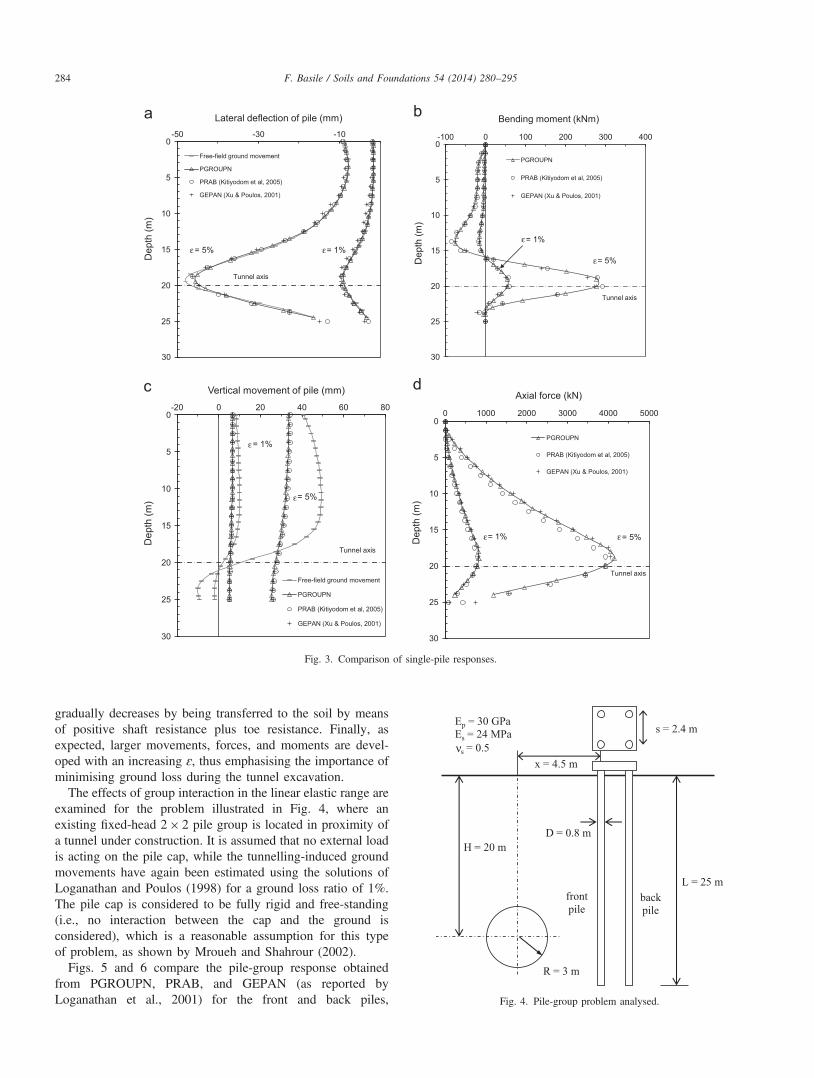
gradually decreases by being transferred to the soil by meansof positive shaft resistance plus toe resistance. Finally, asexpected, larger movements, forces, and moments are devel-oped with an increasing ɛ, thus emphasising the importance ofminimising ground loss during the tunnel excavation.
The effects of group interaction in the linear elastic range areexamined for the problem illustrated in Fig. 4, where anexisting fixed-head 2� 2 pile group is located in proximity ofa tunnel under construction. It is assumed that no external loadis acting on the pile cap, while the tunnelling-induced groundmovements have again been estimated using the solutions ofLoganathan and Poulos (1998) for a ground loss ratio of 1%.The pile cap is considered to be fully rigid and free-standing(i.e., no interaction between the cap and the ground isconsidered), which is a reasonable assumption for this typeof problem, as shown by Mroueh and Shahrour (2002).
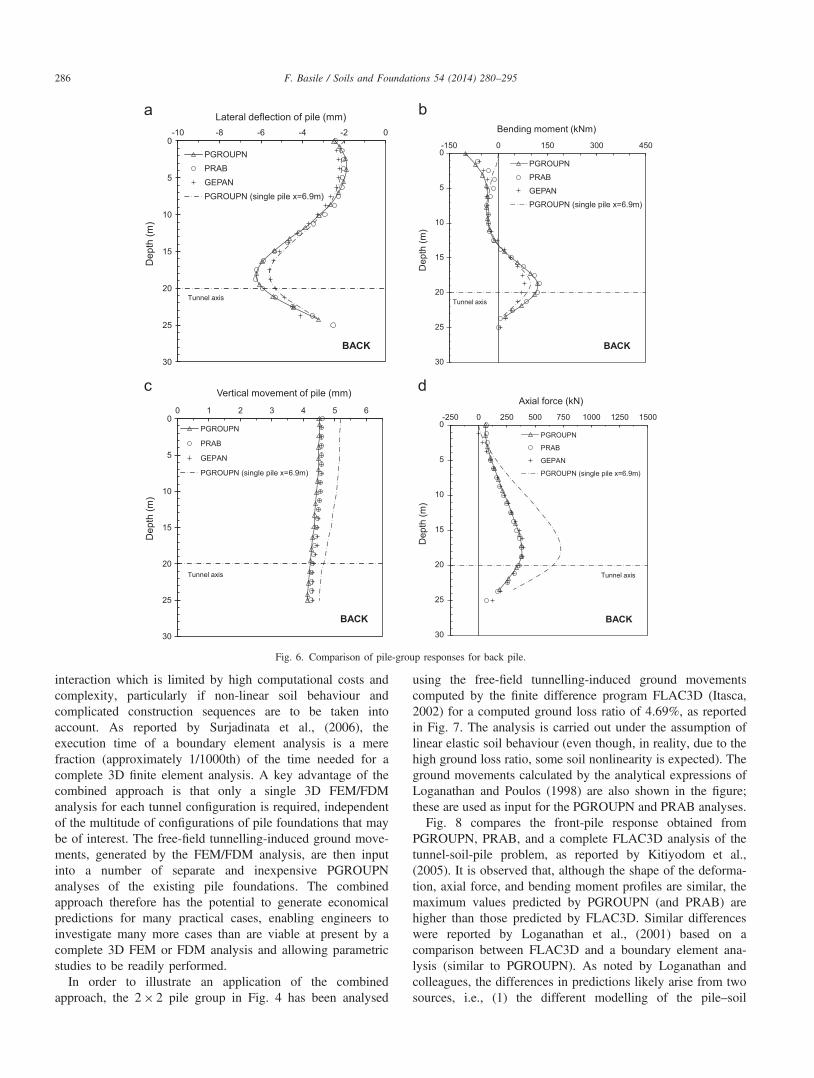
Figs. 5 and 6 compare the pile-group response obtainedfrom PGROUPN, PRAB, and GEPAN (as reported byLoganathan et al., 2001) for the front and back piles,
0
5
10
15
20
25
30
0 1000 2000 3000 4000 5000D
epth
(m)
Axial force (kN)
PGROUPN
PRAB (Kitiyodom et al, 2005)
GEPAN (Xu & Poulos, 2001)
= 1% = 5%
Tunnel axis
ε ε
0
5
10
15
20
25
30
-20 0 20 40 60 80
Dep
th (m
)
Vertical movement of pile (mm)
Free-field ground movement
PGROUPN
PRAB (Kitiyodom et al, 2005)
GEPAN (Xu & Poulos, 2001)
= 1%
= 5%
Tunnel axis
ε
ε
0
5
10
15
20
25
30
-100 0 100 200 300 400
Dep
th (m
)
Bending moment (kNm)
PGROUPN
PRAB (Kitiyodom et al, 2005)
GEPAN (Xu & Poulos, 2001)
= 1%
= 5%
Tunnel axis
ε
ε
0
5
10
15
20
25
30
-50 -30 -10D
epth
(m)
Lateral deflection of pile (mm)
Free-field ground movement
PGROUPN
PRAB (Kitiyodom et al, 2005)
GEPAN (Xu & Poulos, 2001)
= 1%= 5%
Tunnel axis
ε ε
Fig. 3. Comparison of single-pile responses.
H = 20 m
x = 4.5 m
R = 3 m
D = 0.8 m
L = 25 m
Ep = 30 GPaEs = 24 MPa
s = 0.5
s = 2.4 m
front pile
back pile
ν
Fig. 4. Pile-group problem analysed.
F. Basile / Soils and Foundations 54 (2014) 280–295284
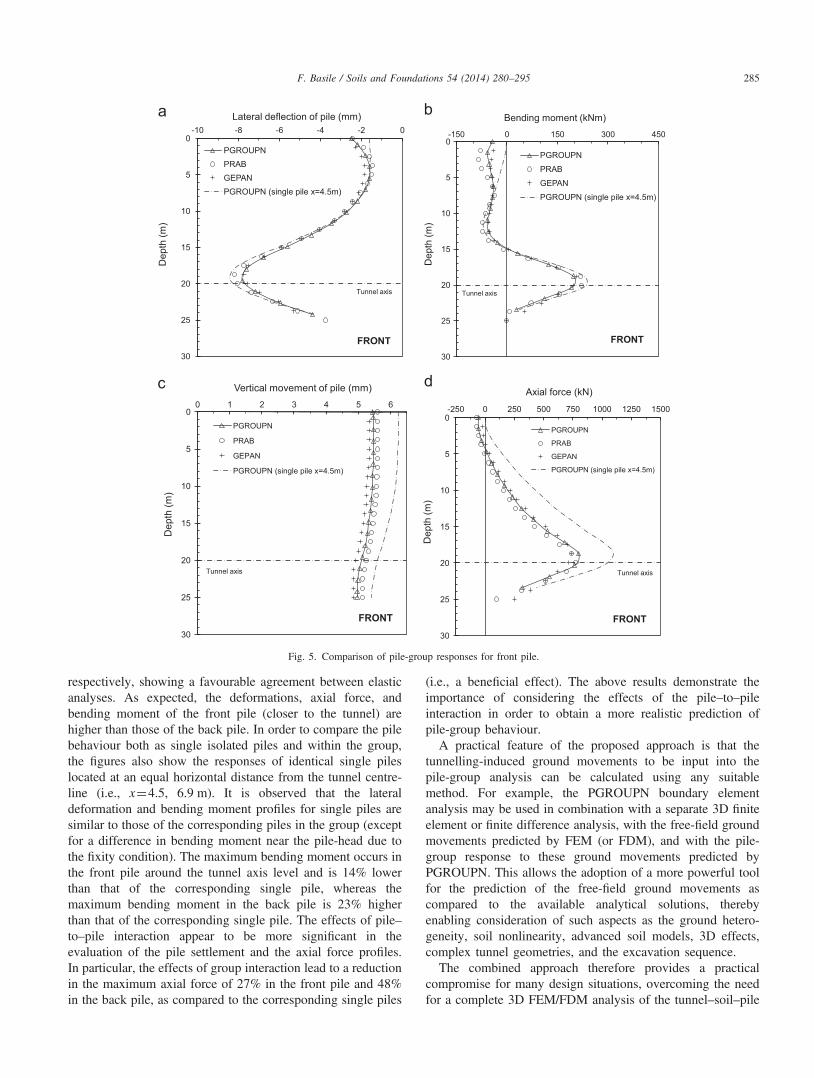
respectively, showing a favourable agreement between elasticanalyses. As expected, the deformations, axial force, andbending moment of the front pile (closer to the tunnel) arehigher than those of the back pile. In order to compare the pilebehaviour both as single isolated piles and within the group,the figures also show the responses of identical single pileslocated at an equal horizontal distance from the tunnel centre-line (i.e., x¼4.5, 6.9 m). It is observed that the lateraldeformation and bending moment profiles for single piles aresimilar to those of the corresponding piles in the group (exceptfor a difference in bending moment near the pile-head due tothe fixity condition). The maximum bending moment occurs inthe front pile around the tunnel axis level and is 14% lowerthan that of the corresponding single pile, whereas themaximum bending moment in the back pile is 23% higherthan that of the corresponding single pile. The effects of pile–to–pile interaction appear to be more significant in theevaluation of the pile settlement and the axial force profiles.In particular, the effects of group interaction lead to a reductionin the maximum axial force of 27% in the front pile and 48%in the back pile, as compared to the corresponding single piles
(i.e., a beneficial effect). The above results demonstrate theimportance of considering the effects of the pile–to–pileinteraction in order to obtain a more realistic prediction ofpile-group behaviour.A practical feature of the proposed approach is that the
tunnelling-induced ground movements to be input into thepile-group analysis can be calculated using any suitablemethod. For example, the PGROUPN boundary elementanalysis may be used in combination with a separate 3D finiteelement or finite difference analysis, with the free-field groundmovements predicted by FEM (or FDM), and with the pile-group response to these ground movements predicted byPGROUPN. This allows the adoption of a more powerful toolfor the prediction of the free-field ground movements ascompared to the available analytical solutions, therebyenabling consideration of such aspects as the ground hetero-geneity, soil nonlinearity, advanced soil models, 3D effects,complex tunnel geometries, and the excavation sequence.The combined approach therefore provides a practical
compromise for many design situations, overcoming the needfor a complete 3D FEM/FDM analysis of the tunnel–soil–pile
0
5
10
15
20
25
30
-250 0 250 500 750 1000 1250 1500
Dep
th (m
)
Axial force (kN)
PGROUPN
PRAB
GEPAN
PGROUPN (single pile x=4.5m)
FRONT
Tunnel axis
0
5
10
15
20
25
30
0 1 2 3 4 5 6
Dep
th (m
)
Vertical movement of pile (mm)
PGROUPN
PRAB
GEPAN
PGROUPN (single pile x=4.5m)
FRONT
Tunnel axis
0
5
10
15
20
25
30
-150 0 150 300 450
Dep
th (m
)
Bending moment (kNm)
PGROUPN
PRAB
GEPAN
PGROUPN (single pile x=4.5m)
FRONT
Tunnel axis
0
5
10
15
20
25
30
-10 -8 -6 -4 -2 0
Dep
th (m
)
Lateral deflection of pile (mm)
PGROUPNPRABGEPANPGROUPN (single pile x=4.5m)
FRONT
Tunnel axis
Fig. 5. Comparison of pile-group responses for front pile.
F. Basile / Soils and Foundations 54 (2014) 280–295 285
interaction which is limited by high computational costs andcomplexity, particularly if non-linear soil behaviour andcomplicated construction sequences are to be taken intoaccount. As reported by Surjadinata et al., (2006), theexecution time of a boundary element analysis is a merefraction (approximately 1/1000th) of the time needed for acomplete 3D finite element analysis. A key advantage of thecombined approach is that only a single 3D FEM/FDManalysis for each tunnel configuration is required, independentof the multitude of configurations of pile foundations that maybe of interest. The free-field tunnelling-induced ground move-ments, generated by the FEM/FDM analysis, are then inputinto a number of separate and inexpensive PGROUPNanalyses of the existing pile foundations. The combinedapproach therefore has the potential to generate economicalpredictions for many practical cases, enabling engineers toinvestigate many more cases than are viable at present by acomplete 3D FEM or FDM analysis and allowing parametricstudies to be readily performed.
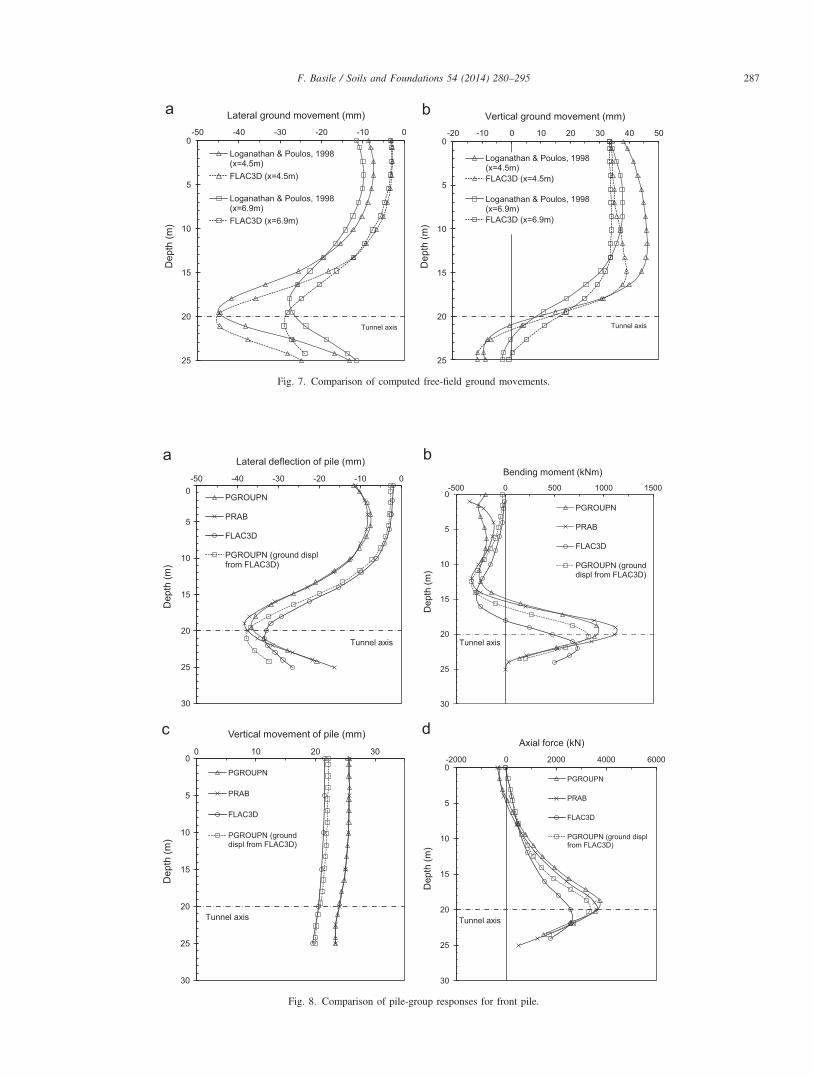
In order to illustrate an application of the combinedapproach, the 2� 2 pile group in Fig. 4 has been analysed
using the free-field tunnelling-induced ground movementscomputed by the finite difference program FLAC3D (Itasca,2002) for a computed ground loss ratio of 4.69%, as reportedin Fig. 7. The analysis is carried out under the assumption oflinear elastic soil behaviour (even though, in reality, due to thehigh ground loss ratio, some soil nonlinearity is expected). Theground movements calculated by the analytical expressions ofLoganathan and Poulos (1998) are also shown in the figure;these are used as input for the PGROUPN and PRAB analyses.Fig. 8 compares the front-pile response obtained from
PGROUPN, PRAB, and a complete FLAC3D analysis of thetunnel-soil-pile problem, as reported by Kitiyodom et al.,(2005). It is observed that, although the shape of the deforma-tion, axial force, and bending moment profiles are similar, themaximum values predicted by PGROUPN (and PRAB) arehigher than those predicted by FLAC3D. Similar differenceswere reported by Loganathan et al., (2001) based on acomparison between FLAC3D and a boundary element ana-lysis (similar to PGROUPN). As noted by Loganathan andcolleagues, the differences in predictions likely arise from twosources, i.e., (1) the different modelling of the pile–soil
0
5
10
15
20
25
30
-250 0 250 500 750 1000 1250 1500D
epth
(m)
Axial force (kN)
PGROUPN
PRAB
GEPAN
PGROUPN (single pile x=6.9m)
BACK
Tunnel axis
0
5
10
15
20
25
30
0 1 2 3 4 5 6
Dep
th (m
)
Vertical movement of pile (mm)
PGROUPN
PRAB
GEPAN
PGROUPN (single pile x=6.9m)
BACK
Tunnel axis
0
5
10
15
20
25
30
-150 0 150 300 450
Dep
th (m
)
Bending moment (kNm)
PGROUPN
PRAB
GEPAN
PGROUPN (single pile x=6.9m)
BACK
Tunnel axis
0
5
10
15
20
25
30
-10 -8 -6 -4 -2 0
Dep
th (m
)
Lateral deflection of pile (mm)
PGROUPNPRABGEPANPGROUPN (single pile x=6.9m)
BACK
Tunnel axis
Fig. 6. Comparison of pile-group responses for back pile.
F. Basile / Soils and Foundations 54 (2014) 280–295286
0
5
10
15
20
25
-50 -40 -30 -20 -10 0
Dep
th (m
)
Lateral ground movement (mm)
Loganathan & Poulos, 1998 (x=4.5m)FLAC3D (x=4.5m)
Loganathan & Poulos, 1998 (x=6.9m)FLAC3D (x=6.9m)
Tunnel axis
0
5
10
15
20
25
-20 -10 0 10 20 30 40 50
Dep
th (m
)
Vertical ground movement (mm)
Loganathan & Poulos, 1998 (x=4.5m)FLAC3D (x=4.5m)
Loganathan & Poulos, 1998 (x=6.9m)FLAC3D (x=6.9m)
Tunnel axis
Fig. 7. Comparison of computed free-field ground movements.
0
5
10
15
20
25
30
-50 -40 -30 -20 -10 0
Dep
th (m
)
Lateral deflection of pile (mm)
PGROUPN
PRAB
FLAC3D
PGROUPN (ground displ from FLAC3D)
Tunnel axis
0
5
10
15
20
25
30
-500 0 500 1000 1500
Dep
th (m
)
Bending moment (kNm)
PGROUPN
PRAB
FLAC3D
PGROUPN (ground displ from FLAC3D)
Tunnel axis
0
5
10
15
20
25
30
0 10 20 30
Dep
th (m
)
Vertical movement of pile (mm)
PGROUPN
PRAB
FLAC3D
PGROUPN (ground displ from FLAC3D)
Tunnel axis
0
5
10
15
20
25
30
-2000 0 2000 4000 6000
Dep
th (m
)
Axial force (kN)
PGROUPN
PRAB
FLAC3D
PGROUPN (ground displ from FLAC3D)
Tunnel axis
Fig. 8. Comparison of pile-group responses for front pile.
F. Basile / Soils and Foundations 54 (2014) 280–295 287
interface (this is modelled in FLAC3D by means of empiricalspring constants), and (2) the larger free-field ground move-ments predicted by Loganathan and Poulos (1998) as com-pared to FLAC3D. Indeed, a closer agreement with FLAC3Dis obtained using a combined approach in which the free-field ground movements from FLAC3D are input into thePGROUPN analysis.
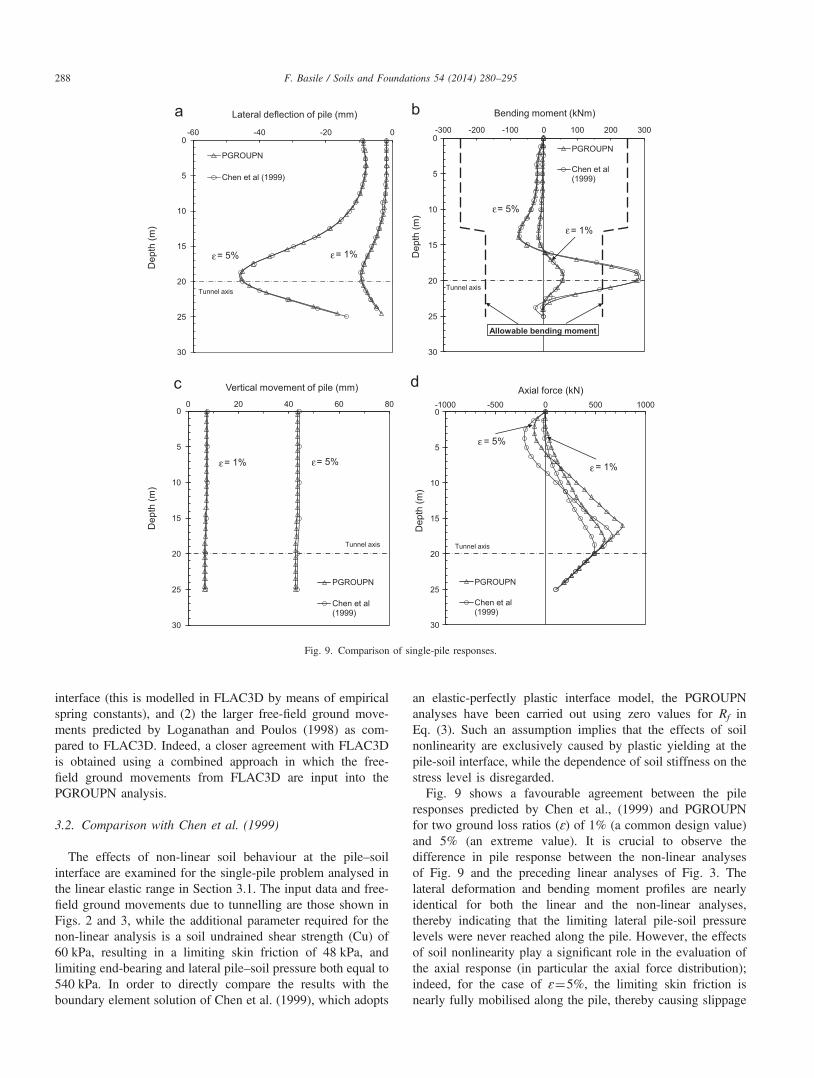
3.2. Comparison with Chen et al. (1999)
The effects of non-linear soil behaviour at the pile–soilinterface are examined for the single-pile problem analysed inthe linear elastic range in Section 3.1. The input data and free-field ground movements due to tunnelling are those shown inFigs. 2 and 3, while the additional parameter required for thenon-linear analysis is a soil undrained shear strength (Cu) of60 kPa, resulting in a limiting skin friction of 48 kPa, andlimiting end-bearing and lateral pile–soil pressure both equal to540 kPa. In order to directly compare the results with theboundary element solution of Chen et al. (1999), which adopts
an elastic-perfectly plastic interface model, the PGROUPNanalyses have been carried out using zero values for Rf inEq. (3). Such an assumption implies that the effects of soilnonlinearity are exclusively caused by plastic yielding at thepile-soil interface, while the dependence of soil stiffness on thestress level is disregarded.Fig. 9 shows a favourable agreement between the pile
responses predicted by Chen et al., (1999) and PGROUPNfor two ground loss ratios (ɛ) of 1% (a common design value)and 5% (an extreme value). It is crucial to observe thedifference in pile response between the non-linear analysesof Fig. 9 and the preceding linear analyses of Fig. 3. Thelateral deformation and bending moment profiles are nearlyidentical for both the linear and the non-linear analyses,thereby indicating that the limiting lateral pile-soil pressurelevels were never reached along the pile. However, the effectsof soil nonlinearity play a significant role in the evaluation ofthe axial response (in particular the axial force distribution);indeed, for the case of ɛ¼5%, the limiting skin friction isnearly fully mobilised along the pile, thereby causing slippage
0
5
10
15
20
25
30
-1000 -500 0 500 1000D
epth
(m)
Axial force (kN)
PGROUPN
Chen et al (1999)
= 1%
= 5%
Tunnel axis
0
5
10
15
20
25
30
0 20 40 60 80
Dep
th (m
)D
epth
(m)
Vertical movement of pile (mm)
PGROUPN
Chen et al (1999)
= 1% = 5%
Tunnel axis
0
5
10
15
20
25
30
-300 -200 -100 0 100 200 300
Dep
th (m
)
Bending moment (kNm)
PGROUPN
Chen et al (1999)
= 1%
= 5%
Tunnel axis
Allowable bending moment
0
5
10
15
20
25
30
-60 -40 -20 0
Lateral deflection of pile (mm)
PGROUPN
Chen et al (1999)
= 1%= 5%
Tunnel axis
ε ε
ε
ε
ε
εεε
Fig. 9. Comparison of single-pile responses.
F. Basile / Soils and Foundations 54 (2014) 280–295288
at the pile–soil interface. The effects of soil nonlinearity lead toa reduction in the maximum axial force of 29% for ɛ¼1% andof 82% for ɛ¼5%, as compared to the corresponding linearanalysis. If a non-linear soil model with stress-dependent soilstiffness (i.e., with non-zero values of Rf in Eq. 3), suchreductions in maximum axial force would become even moresignificant, specifically 43% for ɛ¼1% and 83% for ɛ¼5%. Itmay also be observed that, in the non-linear analysis, bothcompressive and tensile axial forces are induced in the pile,with the compressive force in this case being larger. The aboveresults demonstrate the importance of considering non-linearsoil behaviour in order to obtain a more realistic and, in thiscase, economical prediction of the pile behaviour. It is worthnoting that, for the 5% ground loss ratio, the maximum pilebending moment exceeds the allowable values estimated byChen et al., (1999), i.e., 250 kNm in the top half of the pileand 175 kNm in the bottom half. This observation is ofparticular significance considering that the developed bend-ing moment is solely induced by tunnelling without takinginto account that induced by other types of loading (either
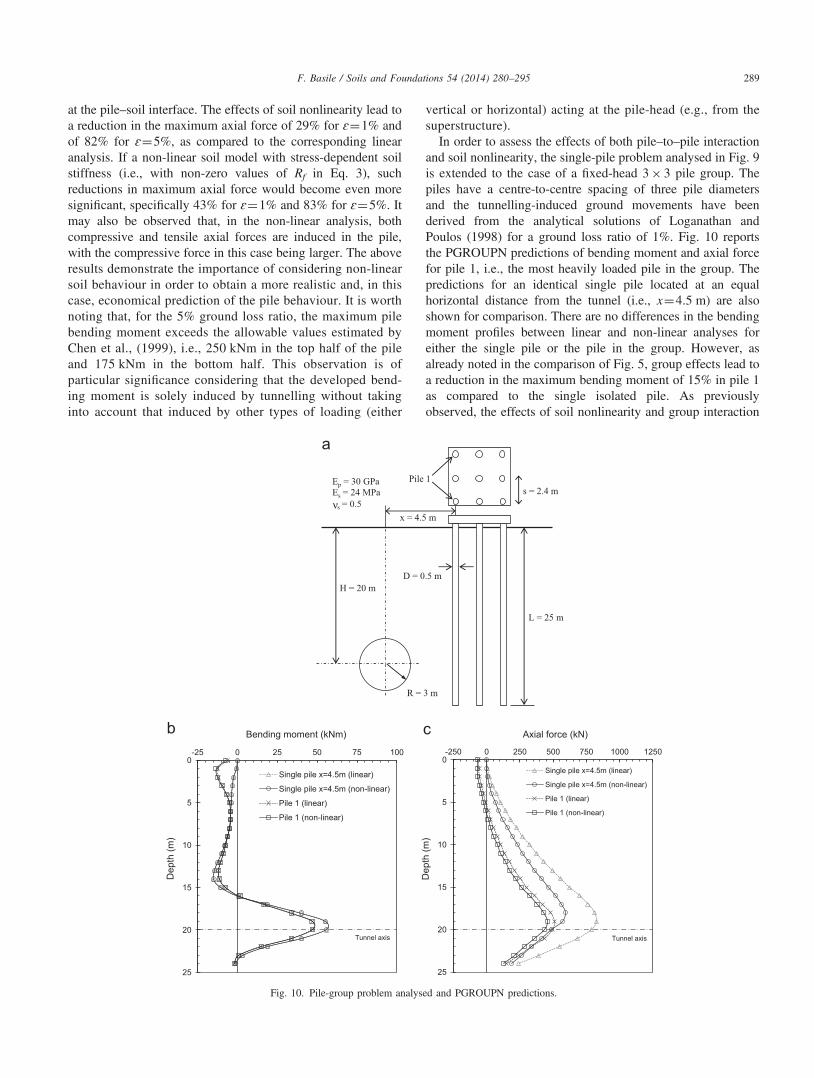
vertical or horizontal) acting at the pile-head (e.g., from thesuperstructure).In order to assess the effects of both pile–to–pile interaction
and soil nonlinearity, the single-pile problem analysed in Fig. 9is extended to the case of a fixed-head 3� 3 pile group. Thepiles have a centre-to-centre spacing of three pile diametersand the tunnelling-induced ground movements have beenderived from the analytical solutions of Loganathan andPoulos (1998) for a ground loss ratio of 1%. Fig. 10 reportsthe PGROUPN predictions of bending moment and axial forcefor pile 1, i.e., the most heavily loaded pile in the group. Thepredictions for an identical single pile located at an equalhorizontal distance from the tunnel (i.e., x¼4.5 m) are alsoshown for comparison. There are no differences in the bendingmoment profiles between linear and non-linear analyses foreither the single pile or the pile in the group. However, asalready noted in the comparison of Fig. 5, group effects lead toa reduction in the maximum bending moment of 15% in pile 1as compared to the single isolated pile. As previouslyobserved, the effects of soil nonlinearity and group interaction
H = 20 m
x = 4.5 m
R = 3 m
D = 0.5 m
L = 25 m
Ep = 30 GPaEs = 24 MPa
s = 0.5s = 2.4 m
Pile 1
ν
0
5
10
15
20
25
-25 0 25 50 75 100
Dep
th (m
)
Bending moment (kNm)
Single pile x=4.5m (linear)
Single pile x=4.5m (non-linear)
Pile 1 (linear)
Pile 1 (non-linear)
Tunnel axis
0
5
10
15
20
25
-250 0 250 500 750 1000 1250
Dep
th (m
)
Axial force (kN)
Single pile x=4.5m (linear)
Single pile x=4.5m (non-linear)
Pile 1 (linear)
Pile 1 (non-linear)
Tunnel axis
Fig. 10. Pile-group problem analysed and PGROUPN predictions.
F. Basile / Soils and Foundations 54 (2014) 280–295 289
play a more significant role in the evaluation of the axial forcedistribution, leading to a substantial reduction (by about 44%)in the maximum values obtained from a linear analysis of thesingle isolated pile.
4. Case history
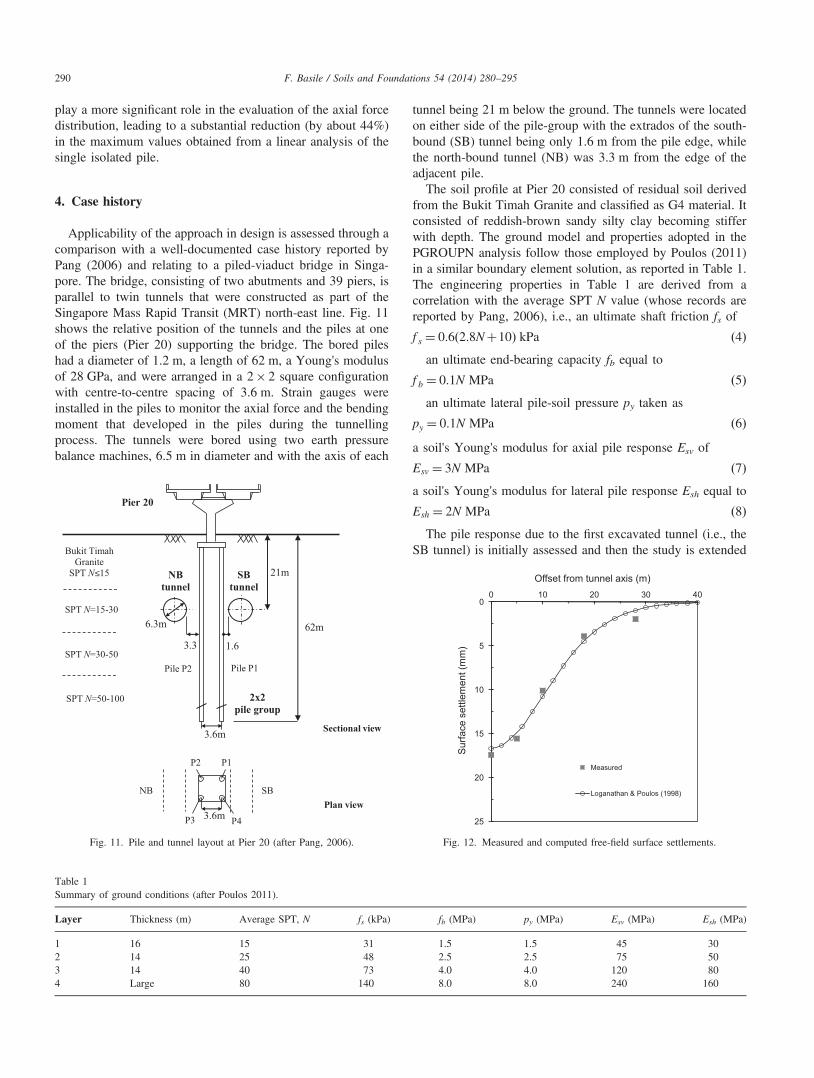
Applicability of the approach in design is assessed through acomparison with a well-documented case history reported byPang (2006) and relating to a piled-viaduct bridge in Singa-pore. The bridge, consisting of two abutments and 39 piers, isparallel to twin tunnels that were constructed as part of theSingapore Mass Rapid Transit (MRT) north-east line. Fig. 11shows the relative position of the tunnels and the piles at oneof the piers (Pier 20) supporting the bridge. The bored pileshad a diameter of 1.2 m, a length of 62 m, a Young's modulusof 28 GPa, and were arranged in a 2� 2 square configurationwith centre-to-centre spacing of 3.6 m. Strain gauges wereinstalled in the piles to monitor the axial force and the bendingmoment that developed in the piles during the tunnellingprocess. The tunnels were bored using two earth pressurebalance machines, 6.5 m in diameter and with the axis of each
tunnel being 21 m below the ground. The tunnels were locatedon either side of the pile-group with the extrados of the south-bound (SB) tunnel being only 1.6 m from the pile edge, whilethe north-bound tunnel (NB) was 3.3 m from the edge of theadjacent pile.The soil profile at Pier 20 consisted of residual soil derived
from the Bukit Timah Granite and classified as G4 material. Itconsisted of reddish-brown sandy silty clay becoming stifferwith depth. The ground model and properties adopted in thePGROUPN analysis follow those employed by Poulos (2011)in a similar boundary element solution, as reported in Table 1.The engineering properties in Table 1 are derived from acorrelation with the average SPT N value (whose records arereported by Pang, 2006), i.e., an ultimate shaft friction fs of
f s ¼ 0:6ð2:8Nþ10Þ kPa ð4Þan ultimate end-bearing capacity fb equal to
f b ¼ 0:1N MPa ð5Þan ultimate lateral pile-soil pressure py taken as
py ¼ 0:1N MPa ð6Þa soil's Young's modulus for axial pile response Esv of
Esv ¼ 3N MPa ð7Þa soil's Young's modulus for lateral pile response Esh equal to
Esh ¼ 2N MPa ð8ÞThe pile response due to the first excavated tunnel (i.e., the
SB tunnel) is initially assessed and then the study is extended
21m
6.3m 62m
SBtunnel
NBtunnel
3.3 1.6
Bukit Timah Granite
SPT N≤15
SPT N=15-30
SPT N=50-100
SPT N=30-50
2x2pile group
Pier 20
3.6m
Pile P1
SB
Pile P2
3.6m
NB
Sectional view
Plan view
P4P3
P2 P1
Fig. 11. Pile and tunnel layout at Pier 20 (after Pang, 2006).
Table 1Summary of ground conditions (after Poulos 2011).
Layer Thickness (m) Average SPT, N fs (kPa) fb (MPa) py (MPa) Esv (MPa) Esh (MPa)
1 16 15 31 1.5 1.5 45 302 14 25 48 2.5 2.5 75 503 14 40 73 4.0 4.0 120 804 Large 80 140 8.0 8.0 240 160
0
5
10
15
20
25
0 10 20 30 40
Surfa
ce s
ettle
men
t (m
m)
Offset from tunnel axis (m)
Measured
Loganathan & Poulos (1998)
Fig. 12. Measured and computed free-field surface settlements.
F. Basile / Soils and Foundations 54 (2014) 280–295290
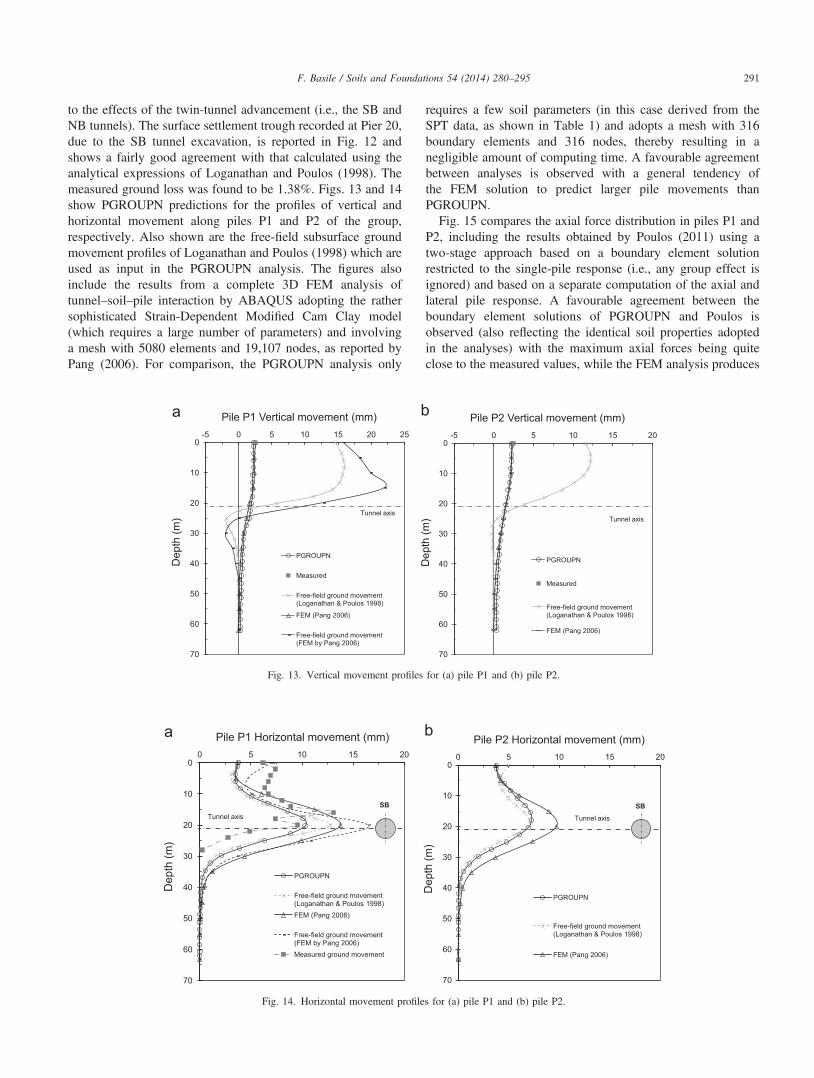
to the effects of the twin-tunnel advancement (i.e., the SB andNB tunnels). The surface settlement trough recorded at Pier 20,due to the SB tunnel excavation, is reported in Fig. 12 andshows a fairly good agreement with that calculated using theanalytical expressions of Loganathan and Poulos (1998). Themeasured ground loss was found to be 1.38%. Figs. 13 and 14show PGROUPN predictions for the profiles of vertical andhorizontal movement along piles P1 and P2 of the group,respectively. Also shown are the free-field subsurface groundmovement profiles of Loganathan and Poulos (1998) which areused as input in the PGROUPN analysis. The figures alsoinclude the results from a complete 3D FEM analysis oftunnel–soil–pile interaction by ABAQUS adopting the rathersophisticated Strain-Dependent Modified Cam Clay model(which requires a large number of parameters) and involvinga mesh with 5080 elements and 19,107 nodes, as reported byPang (2006). For comparison, the PGROUPN analysis only
requires a few soil parameters (in this case derived from theSPT data, as shown in Table 1) and adopts a mesh with 316boundary elements and 316 nodes, thereby resulting in anegligible amount of computing time. A favourable agreementbetween analyses is observed with a general tendency ofthe FEM solution to predict larger pile movements thanPGROUPN.Fig. 15 compares the axial force distribution in piles P1 and
P2, including the results obtained by Poulos (2011) using atwo-stage approach based on a boundary element solutionrestricted to the single-pile response (i.e., any group effect isignored) and based on a separate computation of the axial andlateral pile response. A favourable agreement between theboundary element solutions of PGROUPN and Poulos isobserved (also reflecting the identical soil properties adoptedin the analyses) with the maximum axial forces being quiteclose to the measured values, while the FEM analysis produces
0
10
20
30
40
50
60
70
-5 0 5 10 15 20 25
Dep
th (m
)
Pile P1 Vertical movement (mm)
PGROUPN
Measured
Free-field ground movement (Loganathan & Poulos 1998)
FEM (Pang 2006)
Free-field ground movement (FEM by Pang 2006)
Tunnel axis
0
10
20
30
40
50
60
70
-5 0 5 10 15 20D
epth
(m)
Pile P2 Vertical movement (mm)
PGROUPN
Measured
Free-field ground movement (Loganathan & Poulos 1998)
FEM (Pang 2006)
Tunnel axis
Fig. 13. Vertical movement profiles for (a) pile P1 and (b) pile P2.
0
10
20
30
40
50
60
70
0 5 10 15 20
Dep
th (m
)
Pile P1 Horizontal movement (mm)
PGROUPN
Free-field ground movement (Loganathan & Poulos 1998)FEM (Pang 2006)
Free-field ground movement (FEM by Pang 2006)Measured ground movement
Tunnel axisSB
0
10
20
30
40
50
60
70
0 5 10 15 20
Dep
th (m
)
Pile P2 Horizontal movement (mm)
PGROUPN
Free-field ground movement (Loganathan & Poulos 1998)
FEM (Pang 2006)
Tunnel axis
SB
Fig. 14. Horizontal movement profiles for (a) pile P1 and (b) pile P2.
F. Basile / Soils and Foundations 54 (2014) 280–295 291
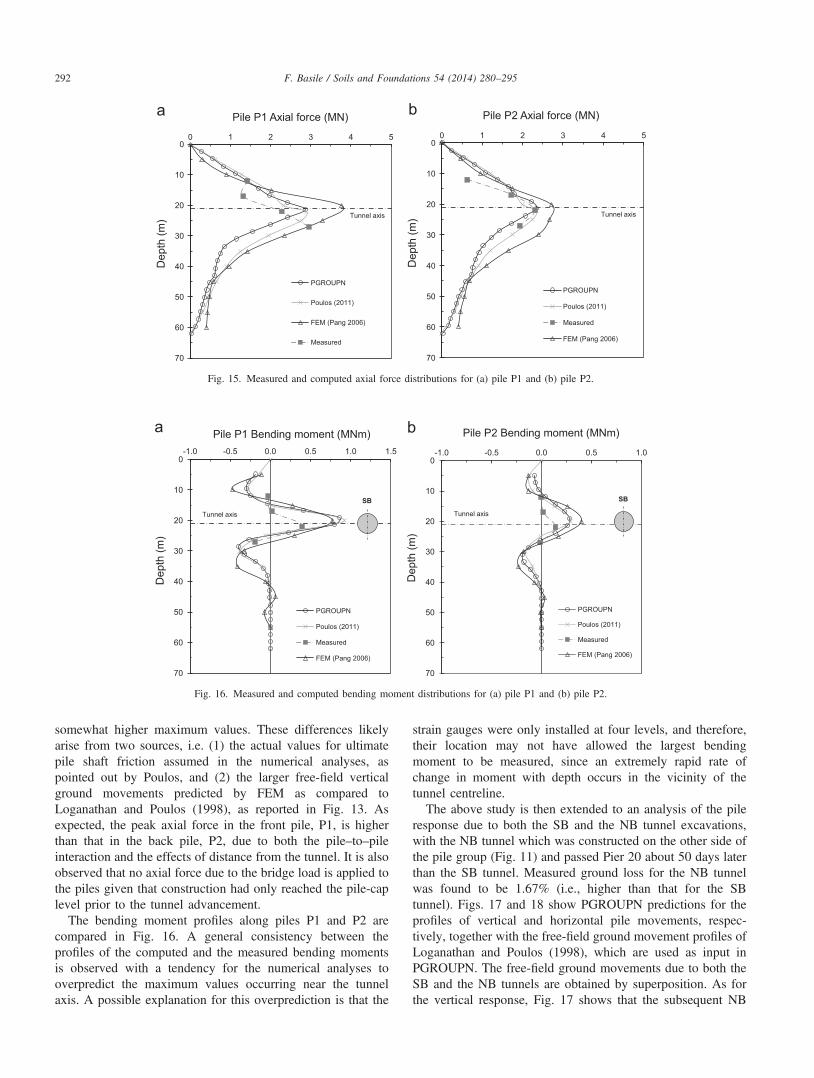
somewhat higher maximum values. These differences likelyarise from two sources, i.e. (1) the actual values for ultimatepile shaft friction assumed in the numerical analyses, aspointed out by Poulos, and (2) the larger free-field verticalground movements predicted by FEM as compared toLoganathan and Poulos (1998), as reported in Fig. 13. Asexpected, the peak axial force in the front pile, P1, is higherthan that in the back pile, P2, due to both the pile–to–pileinteraction and the effects of distance from the tunnel. It is alsoobserved that no axial force due to the bridge load is applied tothe piles given that construction had only reached the pile-caplevel prior to the tunnel advancement.
The bending moment profiles along piles P1 and P2 arecompared in Fig. 16. A general consistency between theprofiles of the computed and the measured bending momentsis observed with a tendency for the numerical analyses tooverpredict the maximum values occurring near the tunnelaxis. A possible explanation for this overprediction is that the
strain gauges were only installed at four levels, and therefore,their location may not have allowed the largest bendingmoment to be measured, since an extremely rapid rate ofchange in moment with depth occurs in the vicinity of thetunnel centreline.The above study is then extended to an analysis of the pile
response due to both the SB and the NB tunnel excavations,with the NB tunnel which was constructed on the other side ofthe pile group (Fig. 11) and passed Pier 20 about 50 days laterthan the SB tunnel. Measured ground loss for the NB tunnelwas found to be 1.67% (i.e., higher than that for the SBtunnel). Figs. 17 and 18 show PGROUPN predictions for theprofiles of vertical and horizontal pile movements, respec-tively, together with the free-field ground movement profiles ofLoganathan and Poulos (1998), which are used as input inPGROUPN. The free-field ground movements due to both theSB and the NB tunnels are obtained by superposition. As forthe vertical response, Fig. 17 shows that the subsequent NB
0
10
20
30
40
50
60
70
0 1 2 3 4 5
Dep
th (m
)
Pile P1 Axial force (MN)
PGROUPN
Poulos (2011)
FEM (Pang 2006)
Measured
Tunnel axis
0
10
20
30
40
50
60
70
0 1 2 3 4 5
Dep
th (m
)
Pile P2 Axial force (MN)
PGROUPN
Poulos (2011)
Measured
FEM (Pang 2006)
Tunnel axis
Fig. 15. Measured and computed axial force distributions for (a) pile P1 and (b) pile P2.
0
10
20
30
40
50
60
70
-1.0 -0.5 0.0 0.5 1.0 1.5
Dep
th (m
)
Pile P1 Bending moment (MNm)
PGROUPN
Poulos (2011)
Measured
FEM (Pang 2006)
Tunnel axis
SB
0
10
20
30
40
50
60
70
-1.0 -0.5 0.0 0.5 1.0
Dep
th (m
)
Pile P2 Bending moment (MNm)
PGROUPN
Poulos (2011)
Measured
FEM (Pang 2006)
Tunnel axis
SB
Fig. 16. Measured and computed bending moment distributions for (a) pile P1 and (b) pile P2.
F. Basile / Soils and Foundations 54 (2014) 280–295292
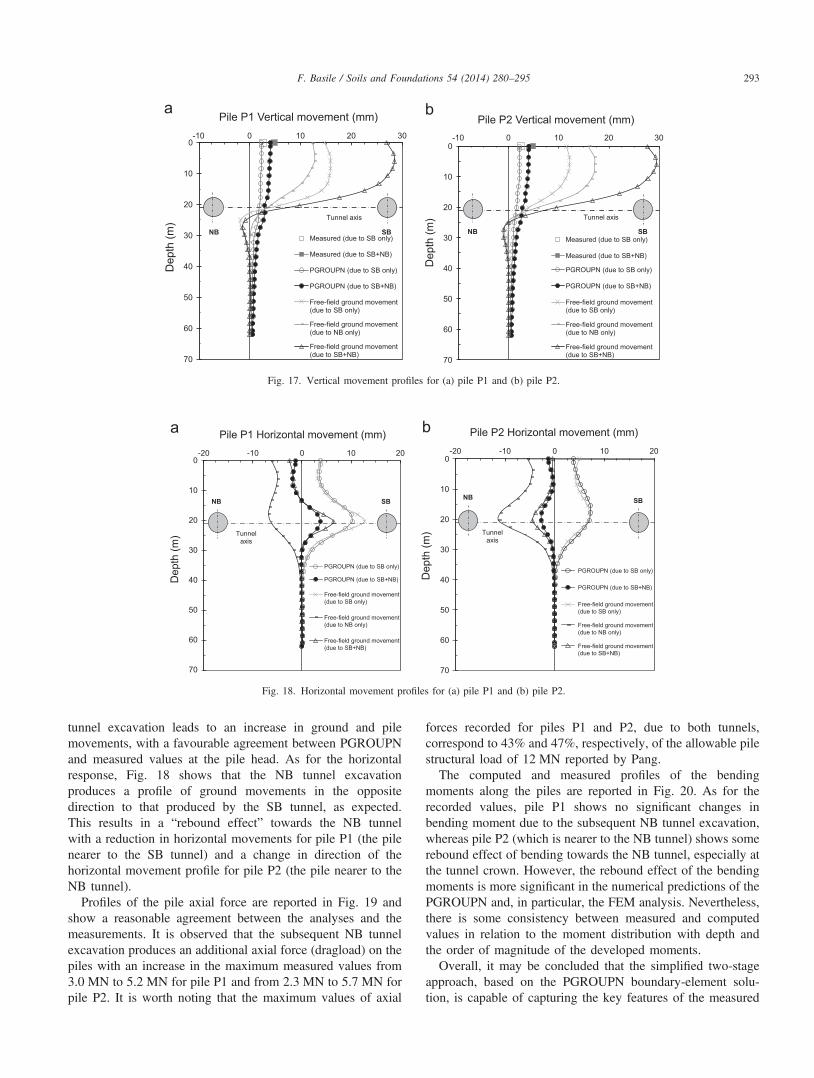
tunnel excavation leads to an increase in ground and pilemovements, with a favourable agreement between PGROUPNand measured values at the pile head. As for the horizontalresponse, Fig. 18 shows that the NB tunnel excavationproduces a profile of ground movements in the oppositedirection to that produced by the SB tunnel, as expected.This results in a “rebound effect” towards the NB tunnelwith a reduction in horizontal movements for pile P1 (the pilenearer to the SB tunnel) and a change in direction of thehorizontal movement profile for pile P2 (the pile nearer to theNB tunnel).
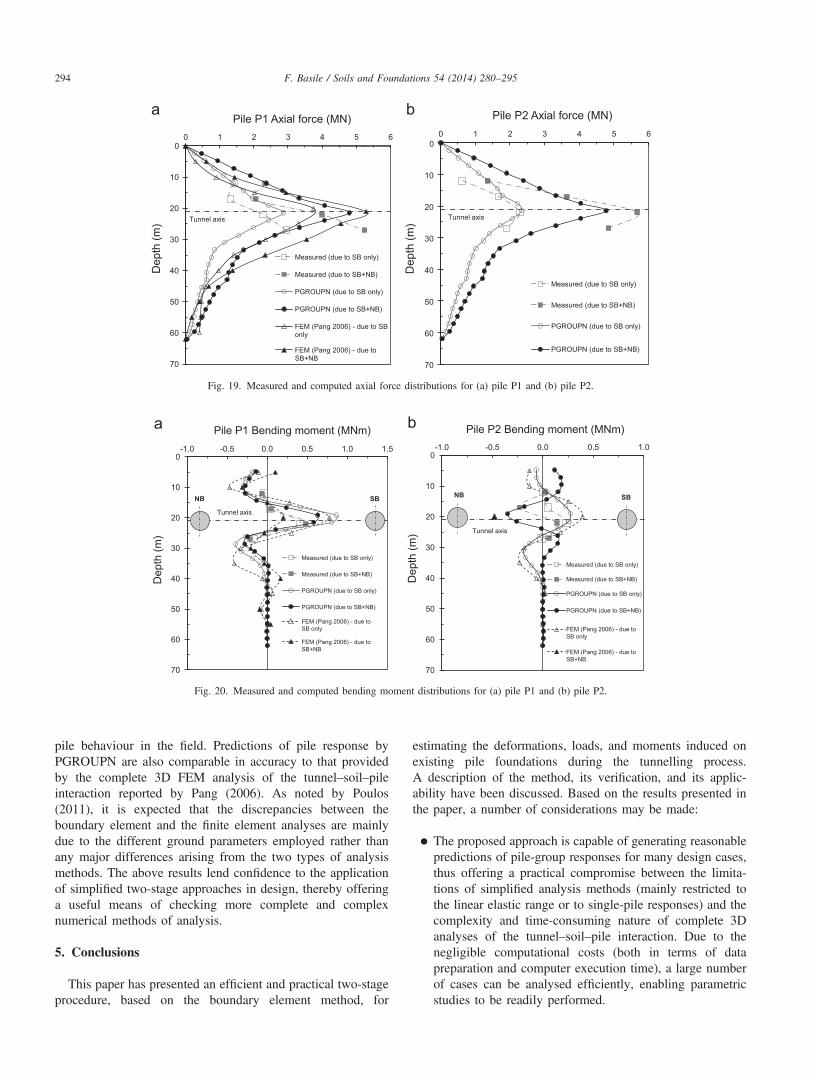
Profiles of the pile axial force are reported in Fig. 19 andshow a reasonable agreement between the analyses and themeasurements. It is observed that the subsequent NB tunnelexcavation produces an additional axial force (dragload) on thepiles with an increase in the maximum measured values from3.0 MN to 5.2 MN for pile P1 and from 2.3 MN to 5.7 MN forpile P2. It is worth noting that the maximum values of axial
forces recorded for piles P1 and P2, due to both tunnels,correspond to 43% and 47%, respectively, of the allowable pilestructural load of 12 MN reported by Pang.The computed and measured profiles of the bending
moments along the piles are reported in Fig. 20. As for therecorded values, pile P1 shows no significant changes inbending moment due to the subsequent NB tunnel excavation,whereas pile P2 (which is nearer to the NB tunnel) shows somerebound effect of bending towards the NB tunnel, especially atthe tunnel crown. However, the rebound effect of the bendingmoments is more significant in the numerical predictions of thePGROUPN and, in particular, the FEM analysis. Nevertheless,there is some consistency between measured and computedvalues in relation to the moment distribution with depth andthe order of magnitude of the developed moments.Overall, it may be concluded that the simplified two-stage
approach, based on the PGROUPN boundary-element solu-tion, is capable of capturing the key features of the measured
0
10
20
30
40
50
60
70
-10 0 10 20 30
Dep
th (m
)
Pile P2 Vertical movement (mm)
Measured (due to SB only)
Measured (due to SB+NB)
PGROUPN (due to SB only)
PGROUPN (due to SB+NB)
Free-field ground movement (due to SB only)
Free-field ground movement (due to NB only)
Free-field ground movement (due to SB+NB)
Tunnel axis
SB NB
0
10
20
30
40
50
60
70
-10 0 10 20 30
Dep
th (m
)
Pile P1 Vertical movement (mm)
Measured (due to SB only)
Measured (due to SB+NB)
PGROUPN (due to SB only)
PGROUPN (due to SB+NB)
Free-field ground movement (due to SB only)
Free-field ground movement (due to NB only)
Free-field ground movement (due to SB+NB)
Tunnel axis
SB NB
Fig. 17. Vertical movement profiles for (a) pile P1 and (b) pile P2.
0
10
20
30
40
50
60
70
-20 -10 0 10 20
Dep
th (m
)
Pile P1 Horizontal movement (mm)
PGROUPN (due to SB only)
PGROUPN (due to SB+NB)
Free-field ground movement (due to SB only)
Free-field ground movement (due to NB only)
Free-field ground movement (due to SB+NB)
Tunnel axis
NB SB
0
10
20
30
40
50
60
70
-20 -10 0 10 20
Dep
th (m
)Pile P2 Horizontal movement (mm)
PGROUPN (due to SB only)
PGROUPN (due to SB+NB)
Free-field ground movement (due to SB only)
Free-field ground movement (due to NB only)
Free-field ground movement (due to SB+NB)
Tunnel axis
NB SB
Fig. 18. Horizontal movement profiles for (a) pile P1 and (b) pile P2.
F. Basile / Soils and Foundations 54 (2014) 280–295 293
pile behaviour in the field. Predictions of pile response byPGROUPN are also comparable in accuracy to that providedby the complete 3D FEM analysis of the tunnel–soil–pileinteraction reported by Pang (2006). As noted by Poulos(2011), it is expected that the discrepancies between theboundary element and the finite element analyses are mainlydue to the different ground parameters employed rather thanany major differences arising from the two types of analysismethods. The above results lend confidence to the applicationof simplified two-stage approaches in design, thereby offeringa useful means of checking more complete and complexnumerical methods of analysis.
5. Conclusions
This paper has presented an efficient and practical two-stageprocedure, based on the boundary element method, for
estimating the deformations, loads, and moments induced onexisting pile foundations during the tunnelling process.A description of the method, its verification, and its applic-ability have been discussed. Based on the results presented inthe paper, a number of considerations may be made:
� The proposed approach is capable of generating reasonablepredictions of pile-group responses for many design cases,thus offering a practical compromise between the limita-tions of simplified analysis methods (mainly restricted tothe linear elastic range or to single-pile responses) and thecomplexity and time-consuming nature of complete 3Danalyses of the tunnel–soil–pile interaction. Due to thenegligible computational costs (both in terms of datapreparation and computer execution time), a large numberof cases can be analysed efficiently, enabling parametricstudies to be readily performed.
0
10
20
30
40
50
60
70
0 1 2 3 4 5 6
Dep
th (m
)
Pile P2 Axial force (MN)
Measured (due to SB only)
Measured (due to SB+NB)
PGROUPN (due to SB only)
PGROUPN (due to SB+NB)
Tunnel axis
0
10
20
30
40
50
60
70
0 1 2 3 4 5 6
Dep
th (m
)
Pile P1 Axial force (MN)
Measured (due to SB only)
Measured (due to SB+NB)
PGROUPN (due to SB only)
PGROUPN (due to SB+NB)
FEM (Pang 2006) - due to SB only
FEM (Pang 2006) - due to SB+NB
Tunnel axis
Fig. 19. Measured and computed axial force distributions for (a) pile P1 and (b) pile P2.
0
10
20
30
40
50
60
70
-1.0 -0.5 0.0 0.5 1.0 1.5
Dep
th (m
)
Pile P1 Bending moment (MNm)
Measured (due to SB only)
Measured (due to SB+NB)
PGROUPN (due to SB only)
PGROUPN (due to SB+NB)
FEM (Pang 2006) - due to SB only
FEM (Pang 2006) - due to SB+NB
Tunnel axis
NB SB
0
10
20
30
40
50
60
70
-1.0 -0.5 0.0 0.5 1.0
Dep
th (m
)
Pile P2 Bending moment (MNm)
Measured (due to SB only)
Measured (due to SB+NB)
PGROUPN (due to SB only)
PGROUPN (due to SB+NB)
FEM (Pang 2006) - due toSB only
FEM (Pang 2006) - due to SB+NB
Tunnel axis
NB SB
Fig. 20. Measured and computed bending moment distributions for (a) pile P1 and (b) pile P2.
F. Basile / Soils and Foundations 54 (2014) 280–295294
� The effects of group interaction have an influence on thepile-group deformations and the internal force distribution.In particular, the effects of pile–to–pile interaction lead to areduction (i.e., a beneficial effect) in the maximum valuesof bending moments and, especially, the axial force in themost heavily loaded pile of the group, as compared to asingle isolated pile located at an equal horizontal distancefrom the tunnel centreline.
� The effects of soil nonlinearity generate a significantreduction in the maximum axial force in the pile, ascompared to a linear elastic analysis, thereby allowingmore realistic and economical predictions of pile-groupresponses.
� Two-stage combined approaches, in which the free-fieldground movements are predicted by a rigorous FEM orFDM analysis and the pile-group response is predicted bya relatively simple BEM analysis (such as PGROUPN),have the potential to generate economical predictions formany practical cases, thus representing a major savingsover the cost of conducting a complete 3D FEM or FDManalysis.
References
Basile, F., 1999. Non-linear analysis of pile groups. Proceedings of Institutionof Civil Engineers, Geotechnical Engineering vol. 137 (No. 2), 105–115.
Basile, F., 2003. Analysis and design of pile groups. In: Bull, J.W. (Ed.),Numerical Analysis and Modelling in Geomechanics. Spon Press, pp.278–315 (Chapter 10).
Basile, F., 2010. Torsional response of pile groups. Proceedings of the 11thDFI & EFFC International Conference on Geotechnical Challenges inUrban Regeneration, London, 13p.
Basile, F., 2012. Pile-group response under seismic loading. In: Proceedings ofthe 2nd International Conference on Performance-Based Design in Earth-quake Geotechnical Engineering, Taormina, Italy, 28–30 May 2012, 16p.
Brinkgreve, R.B.J., Broere, W., 2003. The influence of tunnel boring onfoundations and buildings in urban areas – a numerical study. In: Vermeer,PA, Schweiger, HF (Eds.), Geotechnics and Soft Soils, pp. 257–263.
Chen, L.T., Poulos, H.G., Loganathan, N., 1999. Pile responses caused bytunneling. J. Geotech. Geoenviron. Eng., ASCE, 125; 207–215.
Geocentrix Ltd., 2012. Repute 2.0, Software for Pile Design ReferenceManual. Geocentrix Ltd., Banstead, UK, 49p.
Itasca, 2002. FLAC3D User's Guide. Itasca Consulting Group.Kitiyodom, P., Matsumoto, T., Kawaguchi, K., 2005. A simplified analysis
method for piled raft foundations subjected to ground movements. Int. J.Numer. Anal. Methods Geomech. 29, 1485–1507.
Lee, R.G., Turner, A.J., Whitworth, L.J., 1994. Deformations caused bytunnelling beneath a piled structure. In: Proceedings of the XIII Interna-tional Conference ICSMFE. New Delhi, pp. 873–878.
Loganathan, N., Poulos, H.G., 1998. Analytical prediction for tunnelling-induced ground movements in clays. J. Geotech. Geoenviron. Eng., ASCE,124; 846–856.
Loganathan, N., Poulos, H.G., Xu, K.J., 2001. Ground and pile-groupresponses due to tunneling. Soils Found. 41 (1), 57–67.
Mair, R.J., Taylor R.N.Burland, J.B., 1996. Prediction of ground movementsand assessment of risk of building damage due to bored tunnelling. In:Proceedings of International Symposium on Geotechnical Aspects ofUnderground Construction in Soft Ground. Mair & Taylor, London, pp.713–718.
Mindlin, R.D., 1936. Force at a point in the interior of a semi-infinite solid.Physics vol. 7, 195–202.
Mroueh, H., Shahrour, I., 2002. Three–dimensional finite element analysis ofthe interaction between tunnelling and pile foundations. Int. J. Numer.Anal. Methods Geomech. 26, 217–230.
Pang, C.H., 2006. The effects of tunnel construction on nearby pile founda-tions. Ph.D. thesis. National University of Singapore, 362p.
Peck, R., 1969. Deep Excavations and Tunneling in Soft Ground, State of theArt Report. In: Proceedings of the 7th International Conference ICSMFE.vol. III, Mexico, pp. 225–281.
Poulos, H.G., 1979. Settlement of single piles in nonhomogeneous soil. J.Geotech. Eng., Am. Soc. Civ. Eng. 105 (GT5), 627–641.
Poulos, H.G., 1989. Pile behaviour – theory and application. In: Proceedings of29th Rankine Lecture, Géotechnique 39 (3), pp. 365–415.
Poulos, H.G., 1990. User's guide to program DEFPIG – Deformation Analysisof Pile Groups, Revision 6. School of Civil Engineering, University ofSidney, 55p.
Poulos, H.G., 2001. Methods of analysis of piled raft foundations. ISSMGETC18 Report (46p.).
Poulos, H.G., 2009. Program CLAP (Combined Load Analysis of Piles) UsersManual, v. 6.2. Coffey Geotechnics Pty Ltd., Sidney, 45p.
Poulos, H.G., 2011. Comparisons between measured and computed responsesof piles adjacent to tunnelling operations. Geotech. Lett. 1 (April–June),11–15.
Pound, C., 2003. Prediction of damage to buildings and other structures fromtunnelling. In: Proceedings of the International Conference Response ofbuildings to excavation-induced ground movements. CIRIA SP201, UK,pp. 27–34.
Sagaseta, C., 1987. Analysis of undrained soil deformation due to ground loss.Geotechnique 37 (3), 301–320.
Surjadinata, J., Carter, J.P., Hull, T.S., Poulos, H.G., 2006. Analysis of effectsof tunnelling on single piles. In: Bakker, K.J. (Ed.), Proceedings of the 5thInternational Symposium Geotechnical Aspects of Underground Construc-tion in Soft Ground. Taylor and Francis, London, pp. 665–671.
Verruijt, A., Booker, J.R., 1996. Surface settlement due to deformation of atunnel in an elastic half plane. Geotechnique 46 (4), 753–756.
Xu, K.J., Poulos, H.G., 2001. 3-D Elastic analysis of vertical piles subjected topassive loadings. Comput. Geotech. 28, 349–375.
Zhang, Z., Zhang, M., 2013. Mechanical effects of tunneling on adjacentpipelines based on Galerkin solution and layered transfer matrix solution.Soils Found. 53 (4), 557–568.
F. Basile / Soils and Foundations 54 (2014) 280–295 295