en2011)0500(cor1)_en.pdf · 2011-04-28 · en 1 en european commission brussels, 19.4.2011...
TRANSCRIPT

EN EN
EN

EN 1 EN
EUROPEAN COMMISSION
Brussels, 19.4.2011 SEC(2011) 500 final
COMMISSION STAFF WORKING DOCUMENT
EU Accountability Report 2011 on Financing for Development
Review of progress of the EU and its Member States
Accompanying document to the
COMMUNICATION FROM THE COMMISSION TO THE EUROPEAN PARLIAMENT, THE COUNCIL, THE EUROPEAN ECONOMIC AND SOCIAL
COMMITTEE AND THE COMMITTEE OF THE REGIONS
Enhancing EU Accountability on Financing for Development towards the EU Official Development Assistance Peer Review
VOL I
{COM(2011) 218 final} {SEC(2011) 501 final} {SEC(2011) 502 final} {SEC(2011) 503 final} {SEC(2011) 504 final} {SEC(2011) 505 final}

EN 2 EN
CONTENTS
1. Introduction.................................................................................................................. 9
2. Increasing Financial Resources for Development and Global Challenges ................ 11
2.1. Improving Domestic Resource Mobilisation ............................................................. 11
2.1.1. Providing enhanced support for domestic resource mobilisation .............................. 11
2.1.2. EU assistance to developing countries in tax and customs reform and related capacity building ...................................................................................................................... 13
2.1.2.1. Mobilising domestic financial resources for development ........................................ 14
2.1.2.2. Promoting good governance in the tax area............................................................... 14
2.1.2.3. Adoption and implementation of the OECD Guidelines on Transfer Pricing ........... 15
2.1.2.4. Assessment of the three principles of good governance in the tax area..................... 16
2.1.2.5. Transparency .............................................................................................................. 16
2.1.2.6. Exchange of Information............................................................................................ 16
2.1.2.7. Fair tax competition ................................................................................................... 16
2.1.2.8. Tax Information Exchange Agreements .................................................................... 16
2.1.2.9. Donor coordination in the tax area............................................................................. 17
2.1.2.10. Transparency in the extractive industries sector ........................................................ 17
2.1.2.11. Emerging themes........................................................................................................ 18
2.2. Scaling up Official Development Assistance (ODA) ................................................ 19
2.2.1. EU ODA Commitments in the Global Context.......................................................... 20
2.2.2. EU ODA Performance 2005-2010 compared to other donors ................................... 21
2.2.3. Role of Debt Relief in EU ODA ................................................................................ 23
2.2.4. Performance on ODA targets (2005-2010) ................................................................ 25
2.2.5. Achievement of the 0.7% ODA/GNI Target by 2015................................................ 28
2.2.6. Lessons Learnt and the Way Forward........................................................................ 33
2.2.7. EU not acting in line with its promise on ODA to Africa.......................................... 36
2.2.8. EU ODA to Least Developed Countries stable.......................................................... 37
2.3. Scaling up funding for tackling Climate Change and Biodiversity Challenges......... 39
2.3.1. Climate change fast-start finance ............................................................................... 39
2.3.1.1. Background ................................................................................................................ 39
2.3.1.2. Volume and focus of EU support............................................................................... 41

EN 3 EN
2.3.1.3. The global context...................................................................................................... 42
2.3.1.4. Measuring additionality ............................................................................................. 43
2.3.2. Biodiversity ................................................................................................................ 46
2.3.2.1. Background ................................................................................................................ 46
2.3.2.2. Volume and focus of EU support............................................................................... 47
2.3.2.3. The global context...................................................................................................... 49
2.4. Increasing international support to Developing Countries through Innovative Financing Sources and Mechanisms .......................................................................... 51
2.5. Leveraging Private Flows .......................................................................................... 55
2.5.1. Private Capital Flows ................................................................................................. 56
2.5.2. Remittances ................................................................................................................ 60
2.5.2.1. Donor Initiatives......................................................................................................... 62
2.5.2.2. Improving data on remittances................................................................................... 63
2.5.2.3. Favouring cheaper, faster and more secure flows of remittances .............................. 64
2.5.2.4. Policy environment .................................................................................................... 64
2.5.2.5. Support for the Financial Sector in Developing Countries ........................................ 66
2.5.3. Leveraging private flows............................................................................................ 66
2.6. Supporting Trade Capacity through Aid .................................................................... 67
2.6.1. Background ................................................................................................................ 67
2.6.2. Trade Related Assistance ........................................................................................... 68
2.6.3. Total 'wider' Aid for Trade......................................................................................... 69
2.6.3.1. Aid for Trade by EU provider.................................................................................... 70
2.6.3.2. Aid for Trade by category .......................................................................................... 71
2.6.3.3. Wider Aid for Trade geographical distribution.......................................................... 72
2.6.4. Increasing Trade Related Assistance and Aid for Trade to ACP countries ............... 74
2.6.5. Effective delivery of Aid for Trade............................................................................ 74
2.6.5.1. Ownership .................................................................................................................. 75
2.6.5.2. Joint Aid for Trade operations and harmonisation: moderate progress ..................... 75
2.6.5.3. Regional dimension of Aid for Trade ........................................................................ 76
2.6.5.4. LDCs and EU AfT ..................................................................................................... 76
2.6.5.5. Aid for Trade monitoring and evaluation................................................................... 77

EN 4 EN
2.6.6. Conclusions ................................................................................................................ 77
2.7. Reducing the Debt Burden of Developing Countries ................................................ 78
2.7.1. Challenge of recent economic trends: Preserving debt sustainability........................ 78
2.7.2. Analysis of debt relief initiatives ............................................................................... 80
2.7.3. Vulture funds or the threats associated with commercial creditor litigation ............. 83
2.7.4. Alternative debt management initiatives.................................................................... 84
2.7.5. Discussion on enhanced forms of sovereign debt restructuring mechanisms............ 85
3. Improving the Effectiveness of Support to Developing Countries ............................ 87
3.1. Making EU aid more effective................................................................................... 87
3.1.1. EU and Member States action on ownership ............................................................. 88
3.1.2. EU and Member States action on alignment.............................................................. 88
3.1.3. EU and Member States action on harmonisation....................................................... 91
3.1.4. EU and Member States action on mutual accountability ........................................... 93
3.1.5. EU action on managing for development results ....................................................... 94
3.2. Supporting better Global Governance........................................................................ 95
3.2.1. Introduction................................................................................................................ 95
3.2.2. Reforming multilateral institutions ............................................................................ 96
3.2.2.1. IMF............................................................................................................................. 96
3.2.2.2. World Bank (WB) Group........................................................................................... 97
3.2.2.3. Regional Development Banks.................................................................................... 98
3.2.2.4. UN System ................................................................................................................. 98
3.2.3. Feedback from the EU and Member States................................................................ 99
3.2.4. Concluding Observations ......................................................................................... 100
Annexes: Vol. II: Annex 1: Bibliography
Annex 2: ODA methodology Annex 3: Statistical Annex on ODA results and trends Annex 4: Results of the EU fast start Climate Finance monitoring
Vol. III: Annex 5: Third Monitoring Report and Progress Review of the EU Fast Track Initiative on Division of Labour
Vol. IV: Annex 6: Aid for Trade Report Vol. V: Annex 7: Donor Profiles Vol. VI: Annex 8: Survey Results

EN 5 EN
LIST OF ACRONYMS A2II Access to Insurance Initiative ACP Africa, Caribbean and Pacific ADA Austrian Development Agency ADB Asian Development Bank ADF Asian Development Fund AfDB African Development Bank AFI Alliance for Financial Inclusion AfT Aid for Trade AMC Advance Market Commitment ASEAN Association of Southeast Asian Nations AT Austria ATAF Africa Tax Administration Forum B4D Business for Development BE Belgium BIO Belgian Investment Company for Developing
Countries BMI/SBI Belgian Corporation for International Investment BMZ Germany’s Federal Ministry for Economic
Cooperation and Development BPC Building Productive Capacity CBD Convention on Biological Diversity CDE Centre for the Development of Enterprise CDM Clean Development Mechanism CER Certified Emission Reduction CGAP Consultative Group to Assist the Poor CIAT Inter-American Centre of Tax Administrations COP Conference of the Parties to the CBD CPA Country Programmable Aid CPSS Committee on Payment and Settlement Systems CRS Creditor Reporting System CRW IDA Crisis Window CSO Civil Society Organisation CSR Corporate Social Responsibility CZ Czech Republic DAC Development Assistance Committee DDA Doha Development Agenda DE Germany DEVCO Directorate General for Development Co-
operation DFI Development Financial Institutions DFID Department for International Development DK Denmark DMF World Bank Debt Management Facilitation for
Low Income Countries DMFAS Debt Management and Financial Analysis System DTC Double Taxation Convention DTC Developing and Transition Countries DTIS Diagnostic Trade Integration Study EAC East African Community EBRD European Bank for Reconstruction and
Development ECB European Central Bank

EN 6 EN
EDF European Development Fund EDFI European Development Finance Institution EEE Espace Economique Européen EGI Ethical Globalisation Initiative EIB European Investment Bank EIF Enhanced Integrated Framework EITI Extractive Industries Transparency Initiative EPA Economic Partnership Agreement ES Spain ETS EU Emission Trading System EU European Union EUR Euro FAC Foreign Affairs Council FAO Food and Agriculture Organisation FAT Financial Activities Tax FDI Foreign Direct Investment FI Finland FIRST Financial Sector Reform and Strengthening
Initiative FLEGT Forest Law Enforcement, Governance and Trade FR France FTA Free Trade Agreement FTT Financial Transaction Tax G20 Group of Twenty (G8 countries plus Argentina,
Australia, Brazil, China, EU, India, Indonesia, Mexico, Saudi Arabia, South Africa, South Korea, and Turkey), European Commission
G8 Group of Eight (i.e., Canada, France, Germany, Italy, Japan, Russia, United Kingdom and USA, plus EU)
GAVI Global Alliance for Vaccines and Immunisation GDP Gross Domestic Product GEEREF Global Energy Efficiency and Renewable Energy
Fund GEF Global Environment Facility GIZ Gesellschaft für Internationale Zusammenarbeit GNI Gross National Income HDI Human Development Index HIPC Highly Indebted Poor Countries HLF High Level Forum HU Hungary IBRD International Bank for Reconstruction and
Development IDB Inter-American Development Bank IE Ireland IF EIB Investment Facility IFAD International Fund for Agricultural Development IFCA Investment Facility for Central Asia IFFIm International Financial Facility for Immunisation IFI International Financial Institutions ILO International Labour Organisation IMF International Monetary Fund IPD Innovative Partnerships for Development

EN 7 EN
IPSAS International Public Sector Accounting Standards IT Italy ITC International Tax Compact ITF EU–Africa Infrastructure Trust Fund ITRS International Transactions Reporting System, KfW Kreditanstalt für Wiederaufbau LAIF Latin America Investment Facility LDC Least Developed Countries LI Lithuania LIC Low Income Countries (LDC+OLIC) LMIC Lower Middle Income Countries LU Luxembourg LV Latvia MDG Millennium Development Goals MDRI Multilateral Debt Relief Initiative MIGA Multilateral Investment Guarantee Agency MoU Memorandum of Understanding MS Member States MSME Micro, Small and Medium Enterprises MT Malta MTO Money Transfer Organisation NGO Non Governmental Organisation NIF Neighbourhood Investment Facility NL Netherlands NORAD Norwegian Agency for Development Cooperation ODA Official Development Assistance OECD Organisation for Economic Co-operation and
Development OECS Organisation of Eastern Caribbean States OJ Official Journal OLIC Other Low Income Countries PCD Policy Coherence for Development PEFA Public Expenditure and Financial Accountability PEM Public Expenditure Management PFM Public Financial Management PPP Private Public Partnerships PSD Payment Services Directive PT Portugal REDD and REDD+ Reducing Emissions from Deforestation and
Forest Degradation. REDD+ goes beyond deforestation and forest degradation, and includes the role of conservation, sustainable management of forests and enhancement of forest carbon stocks.
REGMIFA Regional Micro Small and Medium-Sized Enterprises Investment Fund for Sub-Saharan Africa
REPARIS The Road to Europe: Programme of Accounting Reform and Institutional Strengthening
ROAP Regional Office for Asia and the Pacific ROSC Report on the Observance of Standards and
Codes SE Sweden

EN 8 EN
SME Small and medium-sized enterprises SWC System-Wide Coherence Reform TA Technical Assistance TCX The Currency Exchange TD Trade Development TEEB The Economics of Ecosystems and Biodiversity
Study TIEA Tax Information Exchange Agreements TNA Trade Needs Assessment TPR Trade Policy Regulations TRA Trade Related Assistance TRAdj Trade Related Adjustment TRI Trade Related Infrastructure UK United Kingdom UMIC Upper Middle Income Countries UN United Nations UNCCD United Nations Convention to Combat
Desertification UNEP United Nations Environment Programme UNFCCC United Nations Convention on Climate Change UNITAID International Drug Purchasing Facility US or USA United States of America USD United States Dollar WB World Bank WBIF Western Balkans Investment Framework WFP World Food Programme WTO World Trade Organisation

EN 9 EN
1. INTRODUCTION This Staff Working Document is the ninth EU Accountability Report on Financing for Development in a series of annual progress reports drafted since 2003 (previously labelled ‘Monterrey report’). It assesses where the EU and its Member States stand in relation to their common commitments. The Report fulfils the Council’s mandate1 to the European Commission to monitor progress and report annually on common EU commitments, which were initially with a view to the International Conference on Financing for Development in 2002 and have been further developed and extended. The Council expanded the monitoring mandate to the Commission accordingly to cover aid effectiveness2, aid for trade3, good governance in tax matters and development4 and fast-start climate finance.5 The report is also an input to EU preparations for several international meetings in 2011, namely the UN Conference on the Least Developed Countries (LDCs) in Istanbul (May 2011) the Busan High Level Forum IV on aid effectiveness (HLF4) in late November 2011, the follow-up meetings to the Cancun UNFCCC climate conference of December 2010, and the bi-annual WTO/ OECD monitoring meeting on aid for trade by all donors. The report builds on the input provided by the EU Member States and Commission staff in (i) the annual questionnaire on Financing for Development 2010/11 (formerly known as the ’Monterrey questionnaire’), which covers all EU commitments related to the international financing for development agenda, (ii) the bi-annual trade and development WTO/ OECD survey of 2010, (iii) the complementary in-country monitoring of aid for trade provided by EU donors, through EU Delegations and (iv) the third questionnaire on the implementation of the EU Fast Track Initiative on Division of Labour and Complementarity. Germany, in close cooperation with the European Commission, led the monitoring of the Fast Track Initiative. The Council also called on the Commission to make the annual progress report a model of transparency and accountability6. For this reason, in contrast to previous years, this year the Commission is presenting a single, comprehensive report covering all topical issues of the international financing for development agenda. For the first time, 22 of the 27 Member States have agreed to the publication of their replies to the annual questionnaire on financing for development. The replies can be consulted online7. Extra information will be included in the EU Donor Atlases 20118. Annex 1 lists the bibliography for all chapters, Annex 2 presents the methodology applied for analysing ODA indications/ forecasts provided by EU Member States. Annex 3 is the Statistical Annex on ODA trends (including individual graphs for all EU Member States showing the gaps from 2010 to reaching 2015 targets for ODA to Africa and ODA to LDCs). Annex 4 reports the results of the EU Fast Start Climate Finance (FSF) monitoring exercises. Annex 5 is the Third Monitoring Report and Progress Review of the EU Fast Track Initiative on Division of Labour.
1 Council Conclusions of 21 May 2003 and 24 May 2005. 2 Different Council Conclusions on the EU Operational Framework on Aid Effectiveness, last of 10 December 2010 (on transparency and mutual accountability). 3 Council Conclusions of 15 May 2007 on the European Conduct of Division of Labour in development policy, Council Conclusions of 29 October 2007 on the EU Aid for Trade Strategy. 4Council Conclusions of 14 June 2010 5 Council conclusions of 7 December 2010. 6Council Conclusions of 15 June (on the MDGs) and 10 December (on transparency and mutual accountability). 7 http://ec.europa.eu/europeaid/how/accountability/eu-annual-accountability-reports/index_en.htm 8 The donor atlases will be available on http://development.donoratlas.eu.

EN 10 EN
Annex 6 enclosed the Aid for Trade Report for 2011. Annex 7 reflects Member States’ replies to the most pertinent questions on the questionnaire, while Annex 8 gives an overview of the overall outcome of the survey. Financing for development aims to create a favourable environment for development by addressing the responsibilities of both developing countries and the global community. The UN Doha Follow-up Conference on Financing for Development in 2008 reiterated that sustainable development depends on mobilising financial resources for development and using them effectively. It also recognised that each country bears primary responsibility for its own development and that national policies, domestic resources and national development strategies are essential. The EU and other donors need to live up to their commitments and to keep their part of the agreement on what is needed to achieve the Millennium Development Goals (MDGs). This report shows that over the period 2004-2010, the EU and its Member States accounted for 57% of net ODA to developing countries from all DAC and EU donors, and for 65% of the global EUR 25.7 billion increase in ODA during this period; in 2010, the EU and its Member States missed their collective 2010 target of 0.56% by a wide margin (by almost EUR 15 billion), but the positive trend continued and the EU and its Member States together reached the highest ODA/GNI ratio of the last 20 years, i.e. 0.43%. The EU scaling-up process has been uneven, with asymmetric efforts. Member States not contributing their fair share to the burden-sharing effort endanger the performance of the EU as whole and substantially increase the risk of failure on future ODA targets. The third Monitoring Report and Progress Review of the EU Fast Track Initiative on Division of Labour (see Annex5) was drafted by Germany, in close coordination with the European Commission. Together with trends since 2008, that report shows that in the 17 partner countries involved in the initiative since the beginning, there has been encouraging progress. There is widespread use and institutionalisation of donor mappings as an aid management instrument, an upward trend in country-level agreement on sector definitions as an important precondition for Division of Labour and solid use of ‘lead donor’ arrangements that can generate more momentum for Division of Labour in the future. The Monterrey Consensus and the Doha Declaration recognise the importance of other financial flows for development besides ODA. To achieve sustainable progress towards the MDGs the financing discussion should look holistically at increasing developing countries’ overall revenue base for development. The EU can effectively support its partners’ with increasing their domestic resources for development in line with the principles of good governance in tax matters (transparency, exchange of information and fair tax competition). Enhanced international cooperation in tax matters in particular will not only increase domestic revenues in developing countries by reducing tax evasion, it will also help to address money laundering, corruption and the financing of terrorism. The EU has consistently supported developing countries in using trade as a tool for development. As part of its joint Aid for Trade strategy the EU as a whole agreed to actions to increase Aid for Trade and enhance its impact. The EU’s combined annual Aid for Trade was EUR 10.5 billion in 2009, matching the all-time high recorded the year before. As regards the EU and Member States’ Trade Related Assistance – a subcomponent of Aid for Trade, a substantial increase was reported in 2009, bringing the collective amount to EUR 3 billion), well above the target (as from 2010) of EUR 2 billion per year.

EN 11 EN
2. INCREASING FINANCIAL RESOURCES FOR DEVELOPMENT AND GLOBAL CHALLENGES
2.1. Improving Domestic Resource Mobilisation The objective of this chapter is to present progress in implementing the Monterrey consensus and subsequent Doha declaration in the area of tax and development. This area was not covered in depth in previous accountability reports – the EU Council asked in 2010 that it be from 2011 onwards. The analysis is based on the current international debate on issues identified in recent European Commission documents on the subject. Taxation should also be seen in the context of the diminishing importance of debt relief. Domestic resource mobilisation is crucial create more and sustainable fiscal space to implement and sustain development programmes. The review is also informed by feedback provided by the EU and Member States. The focus is on two topics: (a) strengthening good governance in tax matters in developing countries; and (b) harnessing EU instruments to provide enhanced support.
2.1.1. Providing enhanced support for domestic resource mobilisation
EU Commitments
Current EU thinking on tax and development set out in the Communication from the Commission to the European Parliament, the Council and the European Economic and Social Committee of 21 April 2010,Tax and Development - Cooperating with Developing Countries on Promoting Good Governance in Tax Matters9 and the accompanying Staff Working Document10. Its recommendations were backed up by the Council Conclusions of 14 June 2010 11.
Taxes are essential for sustainable development, the legitimacy of the State, economic stability, and the financing of public services and infrastructure. The Communication on Tax and Development12 argued that development aid policies should contribute to building effective, efficient, fair, and sustainable tax systems in line with the principles of good governance in tax matters (transparency, exchange of information and fair tax competition) and generate sustainable revenues in EU partner countries. When attempting to increase domestic tax revenues, developing countries are often confronted with the incidence of corruption, lack of capacity of tax administrations and the structure and competitiveness of their economy (large informal sectors. Some developing countries rely to a large extent on revenues stemming from extractive industries which tend to be less predictable. The effectiveness of national tax systems could also be affected by the use of tax incentives to attract foreign investment. In addition, implementing domestic tax rules is becoming ever more difficult in a world with an increasing geographical mobility of taxpayers and the existence of non-cooperative jurisdictions and harmful tax practices. In view of these challenges, the EU, in its Council Conclusions on Tax and Development of 14 June 2010, stated that it would ‘support developing countries in tax policy, tax administration and tax reforms, including the fight against tax evasion and other harmful practices’. This covered 10 points:
9COM(2010)163 of 21.04.2010 . 10http://ec.europa.eu/taxation_customs/resources/documents/common/publications/com_reports/taxation/sec(2010)426_en.pdf 113023rd FOREIGN AFFAIRS Council meeting Luxembourg, 14 June 2010 12 COM(2010)163 of 21.04.2010

EN 12 EN
1. Mobilising domestic resources for development through efficient and fair tax systems;
2. Discouraging capital flight, including tax evasion and avoidance, and illicit financial flows;
3. Supporting proposals outlined in earlier Commission communications;
4. Recognising that developing countries bear primary responsibility for building and improving efficient and fair tax systems and committing the necessary resources thereto, with EU and Member States supporting these efforts;
5. Using budget support programmes to accelerate tax reform;
6. Emphasising programme-based and comprehensive approaches;
7. Enhancing support for the EITI;
8. Promoting the principles of good governance in tax matters and working towards a transparent and cooperative international tax environment;
9. Encouraging the participation of developing countries in structures and procedures for international tax cooperation; and
10. Facilitating this process by covering these aspects in the annual Financing For Development Report.
It is for each partner country to define its policies and reforms. This is particularly true of taxation policy. Development aid should be adapted to each country according to its economic situation, international position and policies. In the case of low income countries the main challenges could be to increase generally low tax revenues by expanding the tax base. A recent study13 states that, as a rule of thumb, according to the UN, these countries would need to increase revenues by about 4 percent of GDP, although a low tax-to-GDP ratio does not necessarily reflect a poor tax performance. Therefore, it is important not only to increase domestic revenues, but possibly to consider the tax system as a whole: its composition, its impact on economic activity and private investment, its redistributive effects and its impact on state-building. There is limited systematic and comparable information on the tax systems of developing countries. The annual PWC / World Bank ’Doing Business’ report provides an estimate of the impact of tax policy and governance in most developing countries. While limited in scope, the information is available and updated annually and could provide a useful indicator of relative and absolute progress on the tax reforms pursued by developing countries to improve the business climate. However, extreme care is needed in interpreting the results as some of the underlying assumptions can lead to misleading results in some countries. Similarly, the PEFA measurement framework14 includes four indicators on revenues, transparency and effectiveness. For some specific indicators, measurement of progress (and accountability) is straight forward such as the conclusion of bilateral tax treaties or tax information exchange agreements. Measuring progress in partner countries is complicated due to incomplete information on donor support. Donor support in the area of tax and development is embedded in either policy reform programmes or technical assistance/capacity 13 http://ec.europa.eu/development/services/events/tax_development/docs/td_tax_challenges_bird.pdf 14 See for instance recent ITC study of 26 countries: http://taxcompact.net/pdf/ITC%20PEFA%20paper%20first%20draft%2012102010.pdf

EN 13 EN
building projects. Sometimes policy reforms are also embedded in government commitments in the context of budget support operations. They may be complemented by assistance to institutions, typically over the medium-term, e.g. with technical advice, drafting laws and regulations, consensus-building, and setting up and/or building institutions. Frequently, tax-related activities are a component of a larger programme and/or project assisting a country. As seen in the responses to the questionnaire discussed below, technical assistance and capacity-development activities tend to be quite varied. During the 2000s, developing countries received support from multilateral and bilateral donors, notably the EU and its Member States to build tax systems. Available information indicates that in the last decade some 65 developing countries undertook tax reforms with donor support – but efforts were sustained in fewer than 10 countries. Furthermore, following Monterrey, there has been no visibly increased emphasis on tax reform in developing countries; in contrast to the significant scale-up of reforms in public expenditure management (PEM, i.e., public financial management and procurement). There are several possible explanations for the limited importance of support for tax reforms in the 2000s. One is that budget support operations and the related policy dialogue tend to focus more on public expenditure management and social sectors than on revenue mobilisation. Another is that the agenda in the 1990s was driven by the tariff reform that took place in most countries, together with strong demand for support on taxation in former communist countries. While this agenda has to some extent been exhausted, developing countries still require country-specific support in the area of tax policy and administration. Tax reform and related institutional support is complex and needs to be sustained over time, to implement a full agenda and also to benefit from experience of what does and does not work in order to fine-tune the arrangements as needed. Given the importance of tax reforms and their central role in the Monterrey agenda, EU donors may consider accelerating progress in this area through promoting more domestic resource mobilisation in line with the principles of good governance in tax matters, inter alia in the context of budget support operations.
2.1.2. EU assistance to developing countries in tax and customs reform and related capacity building
This section is based on EU Member States’ replies to the 25 questions in the annual survey of progress on the implementation of the Monterrey commitments. The questions and statistics on the replies are given in Annex 8. These are analysed in the light of the 10 points listed in the previous section. Before discussing the replies, a few issues warrant mention. The space to reply to some questions was left blank and the feedback received may be incomplete. The analysis assumes in such cases that the donor does not provide significant support in the area. Furthermore, part of the information provided concerns ongoing support, some of which may have begun a few years back while in other cases, it may refer to possible future involvement. Moreover, some of the answers given had to be discounted because they were not relevant to the question asked or a positive answer was given even though the explanatory text suggested the opposite. Finally, the level of details provided differed from one Member State to another – with some countries providing extensive answers and specific examples.

EN 14 EN
2.1.2.1. Mobilising domestic financial resources for development
The questionnaire did not ask about the volume of support provided to tax and customs systems. However, the OECD/DAC collects information on assistance to public financial management and trade facilitation (mainly customs) in the Creditor Reporting System. These data show that the 15 EU DAC members committed some EUR 125 million of such assistance in 2008 and 2009. Germany, the Netherlands and Sweden reported the most assistance to these sectors. A quarter of EU countries do not provide any support to tax systems and revenue mobilisation, five of them having joined the EU only recently. While aid levels are not quantified, in terms of donor focus ACP countries tend to receive support from most other EU Member States, reflecting the fact that the poorest countries are given priority. On average, each donor covers two or more regions/country groupings, typically ACP, EU candidates, EU neighbourhood policy, or Asia – support for Latin America is less frequent. The two EU-related groups seem to be considered important for economic and, no doubt, political reasons. In addition to the EU, France, Hungary, Spain and the UK were the only Member States to be active in all five regions listed in the questionnaire, some of them indirectly. The remaining member countries were typically involved in only one or two regions. These figures may reflect selectivity and division of labour, but also seems to indicate that broad based support for tax systems and resource mobilisation is not yet a priority for many Member States. The most common type of support provided is to tax administrations, followed by tax policy. A handful of Member States provide other types of support such as training and capacity development, notably in customs administration and the judiciary. These contribute significantly to improved revenue mobilisation and to the effectiveness, efficiency and fairness of tax systems. It is less apparent whether Member States pursue coordinated and complementary approaches to avoid aid fragmentation and unmet demand in some countries – especially those with less donor presence. Ministries of Finance are the primary beneficiaries of this aid. Over half the EU donors also help customs and/ or semi-autonomous revenue authorities. A handful of respondents reported that they provided support to other institutions, for example a Prevention of Money Laundering Office. The choice of counterparts seems justified by the fact that Ministries of Finance bear primary responsibility for tax reform and revenue collection, whereas many developing countries have chosen not to set up semi-autonomous revenue authorities yet. National governments are the most frequent beneficiaries of capacity-building for financial management. Over two-thirds of EU and Member States support national supreme audit institutions, with civil society organisations (CSOs) and parliaments being helped less frequently. The relatively low level of engagement with CSOs and national parliaments may lead to low level of stakeholder ownership of tax reform. Where CSOs are weak, key stakeholders in reforms may lack a voice. Similarly, parliaments lacking an adequate understanding of public financial management issues may not fully appreciate the importance of the laws presented to them in this area, and may not sufficiently scrutinise public expenditure and hold governments to account.
2.1.2.2. Promoting good governance in the tax area
The EU and most Member States provide support for addressing tax evasion and harmful tax competition, and promote the principles of good governance in tax matters in their cooperation policy. According to comments made in reply to the questionnaire, the approaches vary from one donor to another. Most commonly, donors use budget support as an entry point, together with technical assistance, dialogue and monitoring agreements.

EN 15 EN
Under the 10th European Development Fund’s (EDF) ‘governance incentive’ tranche, the EU may offer additional funding in return for detailed commitments on the principles of good governance in taxation. A number of encouraging and concrete commitments have been made by ACP countries. In March 2010, in the second revision of Cotonou Agreement, the EU and ACP countries agreed, subject to further ratification at national level, to include a provision allowing EU support for the implementation of international best practices in tax matters, including transparency and exchange of information. The main challenge would appear to be to ensure that commitments are translated into concrete measurable and effective actions and that sufficient technical cooperation is provided to achieve this. The German Federal Ministry for Economic Cooperation and Development (BMZ) has launched the International Tax Compact15 (ITC) – an informal international action and dialogue platform grouping bilateral and multilateral donors to strengthen international cooperation with developing and transition countries to fight tax evasion and avoidance. Other EU Member States supporting this initiative include France, the Netherlands and Spain. The work of the ITC focuses on the following areas: (1) at country/regional level encouraging increased development cooperation in tax matters; and promoting the dissemination of successful practices and the exchange of reform experiences in policy formulation, legislation, and implementation, in addition to capacity development and institution building; (2) at international level facilitating access to and the exchange of information between policy makers, tax administrators, donors, civil society and the private sector; (3) analytical work and studies; and (4) networking and dialogue. The European Commission has since late 2008 taken part in the International Tax Dialogue (ITD). The ITD is a collaborative arrangement involving the IMF, OECD and World Bank Group, among others, to encourage and facilitate discussion of tax matters among national tax officials, international organisations, and a range of other key stakeholders. The ITD Secretariat is currently hosted by the OECD.
2.1.2.3. Adoption and implementation of the OECD Guidelines on Transfer Pricing
About half of the Member States provide assistance with implementing OECD guidelines on transfer pricing. The reasons given for not providing support included strategic choices, a lack of resources, reliance on indirect support, an intention to support this area in the future and no request from beneficiaries. The support that was confirmed tended to go through two main channels: OECD and Africa Tax Administration Forum (ATAF). While transfer pricing rules could help developing countries to mobilise revenues, donor support for this remains rather limited. The EU encourages research on innovative approaches to implementing the OECD transfer pricing guidelines in developing countries, such as assistance by other countries in applying the rules, or joint tax audits by developing countries’ administrations. It also considers that developing countries need to strengthen their tax administrations’ assessment capacity to apply the arm’s length’ principle. Most of the activities of Member States tend to be part of broader programmes. A few EU donors provide support through the OECD (e.g. the EU, France, Germany, Ireland, Slovakia and the UK) or through twinning projects, discussion of fraud avoidance mechanisms and negotiations on double taxation (Austria, Latvia and Romania).
15 http://taxcompact.net/index.html

EN 16 EN
2.1.2.4. Assessment of the three principles of good governance in the tax area
Most Member States say they assess beneficiaries’ commitment to the principles of good governance in tax matters and say they use indirect means to deal with this issue, for example when devising a new cooperation framework.
2.1.2.5. Transparency
The Commission and the majority of Member States said that they analysed the country’s situation in the light of international standards for the transparency of tax systems. In doing so, a number use comparisons with international transparency standards and many draw upon the conclusions of Public Expenditure and Financial Accountability (PEFA) assessment reports and, in one case, a Report on the Observance of Standards and Codes (ROSCs). Others conduct periodic studies, use public information, or take advantage of opportunities, e.g. when signing tax treaties, to review this area. France mentioned the use of peer reviews undertaken by the Global Forum on Transparency and Exchange of Information for Tax Purposes and of the list of non-cooperative jurisdictions published by OECD. Overall, it appears that there is sufficient public information available for the EU and Member States to conduct analyses of the transparency of tax systems, even if in some cases the basic documentation may not be recent.
2.1.2.6. Exchange of Information
Half the Member States indicated that they analysed the situation in the beneficiary country in the light of international standards of exchange of information. They pursued various approaches, such as use of PEFA – which may not be the most relevant tool - and public information sources, specific analysis and studies, tailor-made approaches for least developing countries and use of discussions on double taxation as the entry point. The indicators used for standards of exchange of information may also be based on the assessment of the OECD Global Forum on taxation. One Member State noted that exchange of information is an important objective, but that, when the focus is on least developed countries the extent to which implementation of international standards emerges as a dominant theme in an individual programme will depend on the circumstances of that country and particularly the capacity and sophistication of its tax authority. The reason why certain EU Member States did not address this area included lack of capacity and reliance on alternative ad-hoc approaches. 2.1.2.7. Fair tax competition
While some Member States indicated that they analysed fair tax competition issues most others mention selectivity/ division of labour, limited relevance and reliance on indirect means as arguments for not being active on this issue. Where analysis was done, it was done as part of general comparative studies of tax systems, in preparation for a cooperation project, or it was driven by country circumstances. Another common practice cited was the use of available reports, notably PEFA and 'Doing Business Reports'. This is thus an area that, based on Member States’ answers, does not seem to be perceived as a priority as part of meeting the EU’s commitments.
2.1.2.8. Tax Information Exchange Agreements
During 2010, the vast majority of EU Member States concluded Tax Information Exchange Agreements (TIEAs) and Double Taxation Conventions (DTC) and were drafting additional ones. This is an area where significant progress is being achieved. However, only two EU donors provide technical assistance to countries with which TIEAs or double taxation conventions are planned or signed, while half provide broader assistance on good governance in tax matters. Further technical cooperation with developing countries that are committed to the principles of good governance in the tax area is essential to enable them to negotiate and implement TIEA and, where appropriate, DTC. If non-EU countries are willing to sign and implement TIEAs with

EN 17 EN
Member States, technical assistance may be offered by the EU provided that funding is available and based on prior commitments to implement the three principles of good governance in tax matters (transparency, exchange of information and fair tax competition). A noteworthy approach to transparency pursued by the Belgian Ministry of Finance is to publish all such agreements on its website16.
2.1.2.9. Donor coordination in the tax area
The EU is also committed to harmonisation with other donors. The EU and most Member States indicated that they coordinated with bilateral and multilateral donors when supporting developing countries’ tax reform agendas. The usual way of doing this was at country level (9) or through international initiatives (ATAF, Afritacs, OECD, ITC and International Tax Dialogue17 (ITD), EU, World Bank and IMF). Other stand-alone or complementary approaches included coordination through twining projects and budget support policy dialogue. However, a review of budget support programmes implemented during the last decade indicates that tax reform is not a major feature of multilateral donors’ reform agenda and coordination has not yet yielded significant broadening or deepening of tax reforms in budget support operations. A majority of Member States supported international or regional initiatives or organisations that are active in the area of tax reform. The IMF (both Regional Technical Centres and the Trust Fund on Tax Policy and Administration) was the most common partner and received by far the most financial support. In addition to the ATAF, CIAT, International Tax Dialogue and International Tax Compact, other institutions receiving some type of EU donor support included the Investment Climate Facility for Africa and OECD. While there are a number of institutions receiving support, there is insufficient information to assess whether this leads to inefficiency and unnecessary segmentation in delivery of tax reforms.
2.1.2.10. Transparency in the extractive industry sector
Extractive Industries Transparency Initiative (EITI). The EITI aims at strengthening governance by improving transparency and accountability in the extractive industries sector. With 35 implementing countries now, the initiative is becoming a global standard for corporate governance and transparency. The EITI asks companies to publish payments to governments. It asks governments to disclose revenues received from companies. This enhances domestic accountability and strengthens the demand for good governance so that corruption related to extractive activities should decrease. Some 3.5 billion people live in countries rich in oil, gas and minerals. Through good governance the exploitation of these resources can generate large domestic revenues to foster inclusive growth, discourage conflict and reduce poverty. The EU is an increasingly active participant in and supporter of this initiative. Its position is reflected in the recent European strategy on the sustainable supply of raw materials18, and in the follow-up to the commitments on enhanced support made in the 2010 Tax and Development Communication19. The EU hosted and co-financed EITI expert meetings in 2010 and 2011 and
16 http://www.minfin.fgov.be/portail2/fr/index.htm 17 The International Tax Dialogue (ITD) is a collaborative arrangement involving the EC, IDB, IMF, OECD, UK (DFID) and World Bank Group to encourage and facilitate discussion of tax matters among national tax officials, international organisations, and a range of other key stakeholders. The ITD Secretariat is currently hosted by the OECD. http://www.itdweb.org/Pages/Home.aspx 18COM(2011) 25, Tackling the Challenges in Commodity Markets and on Raw Materials, http://ec.europa.eu/enterprise/policies/raw-materials/files/docs/communication_en.pdf 19 http://register.consilium.europa.eu/pdf/en/10/st11/st11082.en10.pdf, §7.

EN 18 EN
joined the supporting countries’ constituency in the EITI Board in order to actively contribute to developing this initiative further. A Multi-donor Trust Fund, administered by the World Bank, and bilateral donors including EU Member States provides assistance to EITI in-country implementation. The Trust Fund was set up in 2003 and European aid agencies such as the UK Department for International Development (DFID), Gesellschaft für Internationale Zusammenarbeit (GIZ), the Norwegian Agency for Development Cooperation (NORAD) as well as the European Commission play an important role in its implementation. EITI implementation is advancing; 11 countries20 have now achieved EITI-compliant status and several countries have become new candidates21. This is remarkable progress compared to late 2009, when only Azerbaijan was compliant among a total of 26 implementing countries. In order to enhance revenue transparency and corporate governance, the European Commission is currently assessing the feasibility of asking EU listed companies to disclose financial data on a country-by-country basis. Such a reporting standard would be a powerful tool for parliaments and civil society to hold multinational enterprises and governments to account for the revenues paid and received respectively and could yield important benefits in terms of domestic revenue mobilisation by reducing corruption and harmful tax practices. Kimberley process. The European Commission is committed to supporting the Kimberley process (KPCS), is an active participant in the KPCS and has chaired it in 2007. The Commission furthermore chairs the Kimberley Process Monitoring Working Group that supervises KPCS implementation globally and has also funded projects, e.g. through statistical analysis, satellite monitoring and technical expertise, in order to enhance the capacity of the Kimberley Process to respond to crises, e.g. in Côte d’Ivoire or Zimbabwe. Within the EU, the KPCS is implemented by a Council Regulation, adopted in December 2002. The Regulation lays down the procedures and criteria to be followed in the import and export of rough diamonds into and from the EU, and creates a uniform EU Kimberley Process certificate which is used for all shipments. In Belgium, the Kimberley Process Certification Scheme is being followed up by the Belgian Ministry of Foreign Affairs, the Ministry of the Economy and the Ministry of Finance in cooperation with the diamond industry in Antwerp. The UK has enacted the necessary national legislation allowing it to implement the Kimberly Process Certification Scheme in the UK. The UK implements the EU Regulation as a designated Community Authority which allows it to verify incoming diamond shipments for conformity with the Kimberly Process and to issue Kimberly Process Certificates for export shipments.
2.1.2.11. Emerging themes
The responses to the questionnaire indicate that the area of tax policy and administration receives attention and support from most EU Member States. In the case of good governance in tax matters, this support is more uneven. Recent Member States’ support tends to be quite limited due to selectivity, lack of know-how, reliance on indirect approaches, insufficient resources or a lack of
20 Azerbaijan, Liberia, Timor Leste, Ghana, Mongolia, Central African Republic, the Kyrgyz Republic, Niger, Nigeria, Norway and Yemen. 21Afghanistan, Albania, Burkina Faso, Cameroon, Chad, Côte d’Ivoire, Democratic Republic of Congo, Gabon, Guinea, Indonesia, Iraq, Kazakhstan, Madagascar, Mali, Mauritania, Mozambique, Peru, Republic of the Congo, Sierra Leone, Tanzania, Togo, Zambia, Guatemala and Trinidad & Tobago.

EN 19 EN
demand from counterparts. This approach has the benefit of avoiding spreading donor support too thinly, especially in the case of smaller programmes, and may result in better division of labour. The responses suggest that many countries follow similar/coordinated approaches, even if perhaps more could be done. Budget support operations, programming of aid to a country, and the PEFA exercise appears to provide important entry points to the dialogue on various issues. Some Member States, notably the UK, appear to use a tailor-made approach to each country, with inherent differences between low and middle income countries. There are also specific examples of interesting pilots involving e-government and other approaches that if successful may be replicable. There is also reliance on partnership with others, notably the OECD, IMF, World Bank and various institutions focusing on taxes. Finally, progress is monitored through different means, which range from donor-led studies to reliance on public information, including PEFA and investment climate reports. This reflects the link and complementarity between tax reform and institution building, and public expenditure management and investment climate reform. Member States do not seem to advocate or pursue tax policy reforms under budget support operations. This seems consistent with the earlier observation that this area does not receive priority in the macro policy dialogue with developing countries. This issue has been set out in the recent Commission Green Paper 'The future of EU budget support to third countries' to launch a public consultation22. Following on from this consultation, the Commission will issue a Communication on budget support later in 2011.
2.2. Scaling up Official Development Assistance (ODA)23
EU Commitments
In 2002, the EU Member States adopted joint commitments on ODA increases. These commitments were further developed and broadened, and endorsed by the European Council in 2005 ahead of the UN World Summit that undertook the first review of progress on the Millennium Declaration and the MDGs. The EU and its Member States agreed to achieve a collective ODA level of 0.7% of GNI by 2015 and an interim target of 0.56% by 2010, both accompanied by individual national targets. The EU Member States agreed to increase their ODA to 0.51% of their national income by 2010 while those countries which had already achieved higher levels (0.7% or above) promised to maintain these levels. The Member States that acceded to the EU in or after 2004 (EU-12) promised to strive to spend 0.17% of their GNI on ODA by 2010 and 0.33% by 2015.24
22 COM(2010) 586 of 19.10.2010 23Depending on data availability, the text sometimes refers to EU15 and EU20, which can nevertheless be taken as approximations of the EU’s collective performance. For explanations, see Annex 2: Methodology. 24The exact wording is as follows: ‘In the context of the commitment to attain the internationally agreed ODA target of an ODA/GNI ratio of 0.7%, the European Council notes with satisfaction that its Member States are on track to achievethe 0.39% target of GNI in 2006 for ODA volumes contained in the Barcelona commitments. While reaffirming its determination to fulfil these commitments, the Council decided on a new collective European Union target of an ODA/GNI ratio of 0.56% by 2010. That would result in an additional EUR20 billion a year in ODA. In this context, the European Council can reiterate, in accordance with the outcome of the Council on 24 May 2005, that Member States, which have not yet achieved an ODA/GNI ratio of 0.51% undertake to attain that level, within their respective budget allocation processes, by 2010, while those that are already above that level undertake to continue their efforts. Member States which joined the EU after 2002, and have not yet achieved an ODA/GNI ratio of 0.17%, will endeavour to increase their ODA to attain that level, within their respective budget allocation processes, by 2010, while those that are already above that level undertake to continue their efforts; Member States undertake to achieve the target of an

EN 20 EN
In addition the EU committed in 2005 to: (a) increase ODA to Sub-Saharan Africa and (b) provide 50% of the ODA increase to Africa as a whole (North Africa and Sub-Saharan Africa).
In 2008 the EU as a whole also committed to provide between 0.15 and 0.20% ODA/ GNI to the Least Developed Countries by 2010.25
2.2.1. EU ODA Commitments in the Global Context
The origins of the 0.7% target can be traced back to the late 1950s26. This was formally recognised in October 1970 when the UN General Assembly adopted a Resolution including the goal that “each economically advanced country will progressively increase its official development assistance to the developing countries and will exert its best efforts to reach a minimum net amount of 0.7% of its gross national product at market prices by the middle of the Decade.” Although the goal of allocating annually 0.7% of GNI to ODA is accepted by all donors except the United States of America, only EU donors and Norway have set a date to achieve it. Norway attained the goal in 1976 and, since 2000 has been providing ODA to developing countries in the order of 0.8-1% of its GNI27. The United States of America does not issue or approve forecasts of projected ODA; in 2010 it provided USD30 billion (EUR 20.4 billion), 0.21% of its GNI. At the G8 Summit in Gleneagles in 2005, the US, Japan and Canada alongside the EU G8 members, accepted to contribute to the collective G8 promise to increase aid to Africa. President Obama promised to double US official development assistance by 201528 – a pledge that, if fulfilled, will begin to appear in ODA disbursements after 2010. Japan29 promised to increase its ODA volume by USD10 billion in aggregate over 2005-2009, but fell short by USD3.6 billion; it increased its aid by USD1.6 billion in 2010, raising its ODA/GNI ratio to 0.20%, like the US well below the DAC average of 0.32%. Canada met its aim to double its 2001 International Assistance Envelope (IAE) level by 2010 to reach an ODA/GNI ratio of 0.33%30. Australia and Switzerland have announced their intent to reach an ODA/GNI target of 0.5% by 2015-2016 and 2015, respectively; their current levels are 0.32% and 0.41%. New Zealand has committed to 0.35% ODA/GNI in 2010-11, but fell short with only 0.26% in calendar year 201031. Korea, the most recent DAC member, has committed to 0.25% ODA/GNI by 2015 with an interim target of 0.118% in 2010, which it met32”.
ODA/GNI ratio of 0.7% by 2015, while those which have achieved that target commit themselves to remaining above that target; Member States which joined the EU after 2002 will endeavour to increase their ODA/GNI ratio to 0.33% by 2015. European Council, 18 June 2005, Doc. 10255/05 Conc. 2. 25European Council, 11 November 2008, Doc. 15075/1/08, Rev. 1 26T.J. Moss (2005). Ghost of 0.7%: Origins and Relevance of the International Aid Target. Center for Global Development. 27 OECD-DAC Secretariat Simulation of DAC Members’ Net ODA Volumes in 2006 and 2010. http://dx.doi.org/10.1787/131026367850 28 Obama administration committed in 2009 to double foreign aid: http://www.usaid.gov/press/frontlines/fl_aug09/p5_nsc080909.html 29DAC 2011 press release on preliminary ODA 2010: Japan’s Gleneagles promise was to give USD 10 billion more over the period 2005 to 2009 than if its ODA had stayed at its 2004 level over this period. It fell short by USD 3.6 billion due mainly to severe economic and budgetary constraints, as well as significant early repayments on ODA loans by some borrowing countries. http://www.oecd.org/document/11/0,3746,en_2649_34447_44981579_1_1_1_1,00.html 30 DAC 2011 press release: http://www.oecd.org/document/35/0,3746,en_2649_34447_47515235_1_1_1_1,00.html 31OECD Development Co-operation Report 2008 32DAC Special Review of Korea’s Development Co-operation: http://dx.doi.org/10.1787/522324562341. The government is determined to increase Korea’s development assistance, and outlines this objective as one of 50 core tasks in its long-term planning manifesto, Vision 2030. The government set explicit targets, and committed to reaching 0.118% ODA/GNI by 2010 and 0.25% by 2015 (an estimated USD 3 billion+): http://www.oecd.org/dataoecd/53/50/42347329.pdf

EN 21 EN
The EU and its Member States are therefore – apart from Norway - the only group of donors to transform the long-standing UN 0.7% goal, considered by many as an ’aspirational goal’, into a realistic, time-bound target. The EU decided to move forward and achieve this goal in steps within 15 years (2000 – 2015), in line with the deadlines of the Millennium Declaration and based on a mix of individual and collective intermediate targets. The first intermediate EU ODA objectives were defined in 2002 during the preparation for the Monterrey International Conference on Financing for Development, based on the EU’s ODA levels in 2000. The agreement was that the EU’s combined efforts would achieve the 0.7% ODA/GNI ratio by 2015 in three steps:
• A first set of intermediate targets for 2006. As a first significant step, those Member States that had not yet reached the 0.7% target committed themselves –individually and within their respective budget allocation to increasing their ODA volume between 2002 and 2006 to 0.33% of GNI. The other Member States agreed to renew their efforts to remain at or above the target of 0.7% ODA, so that collectively an EU average of 0.39% would be reached by 2006. These targets were set by the then EU 15 Member States.
• A second set of intermediate targets for 2010 was agreed in 2005, after the enlargement of the EU to 25 Member States. These targets have been endorsed33and reconfirmed by the European Heads of State and Government on various occasions34. Bulgaria and Romania, in the context of their accession to the EU in 2007, also subscribed to the commitments. The new ODA targets were differentiated to take into account the different national income levels and the transition of the newer EU Member States from ODA recipients to ODA donors. The definition of the 2010 intermediate targets took into account the EU’s collective ODA levels in 2004 (0.42% of GNI) and put 2010 at mid-way, i.e. 0.56% to achieving 0.7% by 2015. This collective target was translated into different individual targets for Member States (0.51% for EU15 and 0.17% for EU12). The collective target assumed that the most generous EU donors would (a) deliver on more ambitious national timetables (e.g. Belgium, Finland, France and the United Kingdom based on a steady scaling up) and (b) those already above 0.7% promised to sustain and not decrease their high levels. These countries were counted upon to achieve a higher collective level than the individual targets mentioned above.
• A third set of targets for 2015: 0.7% is the collective target and minimum individual threshold for the EU15. The EU12 target was set at 0.33% corresponding to the EU15 collective outcome for 2000, thereby accepting that the newest 12 Member States needed a long transition phase to adapt to the EU acquis.
In 2005, as part of the first review of progress on the MDGs and the G8 Summit at Gleneagles, these EU commitments were the main basis for calculating that the donor community would raise an additional USD50 billion (at 2004 prices) in official development assistance by 201035.
2.2.2. EU ODA Performance 2005-2010 compared to other donors
The EU has not only pledged to deliver more aid than non EU donors, but its combined efforts are already delivering substantially greater amounts of ODA, and individual EU countries (with a few
33European Council, 18 June 2005, Doc. 10255/05 34Most recently by the European Council on 17 June 2010 35The dollar value of the 2010 pledge was calculated by OECD DAC and backed by UN and World Bank estimates of incremental MDG costs, net of domestic resource contributions.

EN 22 EN
exceptions) are also making more substantial efforts in relative terms. Over the period 2004-2010, the EU and its Member States accounted for 57% of net ODA to developing countries from all DAC and EU donors, and for 65% of the global EUR 25.7 billion ODA increase in real terms during this period.

EN 23 EN
Figure 1 – Net ODA by Donor (EUR million, 2008 prices)
2004 2005 2006 2007 2008 2009 2010
EU 36775 47083 48367 45617 50032 50152 53458
Canada 2477 3228 2889 2937 3324 3000 3382
Japan 6225 9443 8547 6018 6656 5925 6624
USA 15315 21010 17140 15428 18610 19737 20436
0
10000
20000
30000
40000
50000
60000
EUR
mill
ion
at 2
008
pri
ces
Net ODA Volumes by Donor (Disbursements, EUR million at 2008 prices)
Source: OECD DAC/European Commission
The above statistics do not include aid from large emerging donors like Brazil, China, India, or Russia, as none of them report to DAC. Overall, aid from emerging donors is estimated to amount to about 10-12% of total ODA from all donors (EUR10-12 billion per year). As shown in Table 1, both the EU’s per capita ODA and its ODA/GNI ratios are greater than those of non-EU DAC Members. Indeed, its ODA/GNI ratio is double that of Japan and the USA. The EU12 still have ODA/GNI ratios that are below the average for non-EU DAC donors, but they have been growing from a low base. Collectively, the EU outperforms most other donors by a wide margin.
Table 1 – ODA/GNI and ODA per capita of EU Member States and Non-EU DAC Members
(at 2008 prices) ODA volumes (EUR billion)
ODA per capita (EUR)
ODA/GNI (%) Country
2004 2010 2004 2010 2004 2010 EU 25/27 36.8 53.5 75 107 0.34 0.43 EU 15 36.4 52.6 95 134 0.35 0.46 EU 10/12 0.3 0.8 3 8 0.07 0.09 USA 15.3 20.4 52 66 0.17 0.21 Japan 6.2 6.6 49 52 0.19 0.20 Canada 2.5 3.4 77 99 0.27 0.33 DAC Non EU Members 29.6 38.6 58 69 0.19 0.23 DAC Members 66.0 91.2 71 96 0.25 0.32
Source: OECD DAC/European Commission
2.2.3. Role of Debt Relief in EU ODA
The growth of EU ODA in 2010 is significant if one considers the declining importance of debt relief in the overall ODA effort of EU Member States. In the period 2005-2006 several EU Member States (namely Austria, Belgium, Finland, France, Germany, Italy, Spain and the UK) saw an

EN 24 EN
increase of ODA due in large part to exceptional debt relief. Almost two thirds of the EU15 debt relief over the period 2004-2009 was directed to two resource rich countries: Iraq (33%) and Nigeria (30%). Some smaller but still significant debt relief programmes were also implemented in 2007 and 2008 but became minimal in 2009, except for France. One positive effect of the EU ODA commitments is that they stimulated growth in EU ODA other than for debt relief over the period 2005-2010, and this more than compensated for the fall in debt relief. Over the period 1995-2010, EU ODA net of debt relief grew by 0.06% of GNI from 0.34% in 1995 to 0.41% in 2010 for EU27. The gap between the EU and non-EU DAC Members’ ODA net of debt relief had narrowed to only 0.10% of GNI by 2005, but the recent growth means that the gap has widened again reaching 0.23% of GNI by 2010 Debt relief certainly helped increase EU ODA over the period, and especially helped meet the targets in 2006. But it was a ’one-off’ effect exercise and not sustainable. The real challenge now for the Member States is to increase their national ODA budgets in a period of budget austerity.
Figure 2 – EU ODA and Debt Relief as a % of GNI
0.34 0.33 0.29 0.29 0.28 0.29 0.30 0.29 0.28
0.30 0.30 0.31 0.33
0.36 0.39
0.41
0.04 0.04
0.03 0.03
0.02 0.02 0.03 0.06 0.06 0.04
0.12 0.10 0.05
0.04
0.02 0.02
1995 1996 1997 1998 1999 2000 2001 2002 2003 2004 2005 2006 2007 2008 2009 2010
ODA without debt relief Debt Relief
Source: OECD DAC (covering 20 EU Member States reporting to the DAC)
As shown in Figure 3 below, debt relief played an important role in ODA for several Member States: Austria, France, Germany and Italy had a high share of debt relief in their ODA over the last five years. It is interesting to note that some of the Member States that are already behind schedule on their individual aid commitments have made the greatest use of debt relief (e.g. Germany, Italy and Portugal). Sudden increases in ODA shown in the country charts in Annex 3 were mainly due to debt relief. Portugal carried out substantial debt relief or rescheduling operations in 1995-2000 and again in 2004. Spain did likewise in 2001 and 2005-2006, Italy in 2002-2006, Germany in 2002-2008, France for the entire period 1995-2010 (fluctuating between 11% and 45% of total ODA), and Austria in 1999-2002 and 2005-2008.

EN 25 EN
Figure 3 – Share of Debt Relief in Net ODA (cumulative, 2004-2010, %)
39%
22%22%20%
18%17%
13%11%
10%
5% 5% 5% 4% 4% 3% 2% 2% 1% 0% 0% 0% 0% 0%
Source: OECD DAC
2.2.4. Performance on ODA targets (2005-2010)
ODA figures on 2010 net disbursements are preliminary, based on information of the EU Member States and the European Commission. For those EU Member States that report to the OECD/ DAC final and more comprehensive ODA figures will become available towards the end of 2011 As anticipated in the 2010 Financing for Development annual progress report, after achieving its 2006 intermediate target of 0.39% of GNI, the EU and its Member States did not achieve their collective 2010 target of 0.56%. However, the positive trend continued reaching the highest ODA/GNI ratio for twenty years, notwithstanding the decline in debt relief and the EU-wide budget. Since 2008 the financial crisis has hit EU Member States hard, triggering the deepest global economic recession for decades. State-financed rescue packages for the affected banking sector, higher social protection costs and lower budget revenues have dramatically changed the fiscal situation in many Member States. Nine Member States (namely Belgium, Cyprus, Denmark, Finland, Ireland, Luxembourg, Netherlands, Sweden, and the United Kingdom) achieved or exceeded the 2010 EU individual minimum targets. Most of them also reached their more ambitious national ODA targets. However, other eighteen EU Member States missed the individual 2010 minimum thresholds and, as a consequence, also the collective target of 0.56% has not been achieved (see Figure 4 below). In 2009, EU-27 ODA decreased in volume terms to EUR 49 billion, but increased as a share of GNI from 0.40% in 2008 to 0.42% due to falling GNI levels during the crisis. ODA growth resumed in 2010 and ODA increased by more than EUR 4.5 billion to almost EUR 54 billion, equivalent to 0.43% of GNI. Despite the increase, this means the EU has missed the collective target of 0.56% ODA/GNI target in 2010 by a wide margin of about 0.13% of GNI (EUR 15 billion).

EN 26 EN
Low or negative economic growth rates in the EU as a consequence of the crisis, and the consequential austerity measures that Member States introduced, led to different pressures on ODA. On the one hand lower GNI growth combined with higher public expenditure elsewhere may lead to a cut-back in spending on development co-operation, which in turn would result in a lower trajectory of scaling up to meet 2015 targets. On the other hand, where aid volumes are not cut, aid level can appear higher when expressed as a percentage of GNI but provide no additional ODA funding for developing countries.
Figure 4 – Gap between 2010 and 2015 targets and 2010 results
Gap between 2010 ODA levels and agreed individual targets of the 27 EU Member States and direction of change from 2009 to 2010
1.09
0.56 0.550.53
0.20
0.7
0.33
0.97
0.90
0.81
0.64
0.50
0.430.38
0.320.29
0.17 0.15 0.13 0.12 0.11 0.10 0.10 0.09 0.09 0.09 0.08 0.07 0.06
0.51
0.17
0.00
0.20
0.40
0.60
0.80
1.00
1.20
Luxe
mbo
urg
Swed
en
Den
mar
k
The
Net
herl
ands
Belg
ium UK
Finl
and
Irel
and
Fran
ce
Spai
n
Ger
man
y
Aus
tria
Port
ugal
Gre
ece
Italy
Cypr
us
Slov
enia
Czec
h Re
publ
ic
Mal
ta
Lith
uani
a
Esto
nia
Hun
gary
Bulg
aria
Slov
ak R
epub
lic
Pola
nd
Rom
ania
Latv
ia
OD
A a
s %
of G
NI
2010 level (preliminary) 2010 individual commitment 2015 individual commitment
Direction of change of ODA as % of GNI increase no change decrease
Source: OECD DAC/European Commission (EU annual questionnaire on financing for development)
and EU annual questionnaire on financing for development)

EN 27 EN
Table 2: EU ODA volumes and as % of GNI 2004 – 2010 and gaps for reaching the 2010 intermediate ODA targets
O DA EUR Million
O DA in % of GNI
O DA EUR Million
O DA in % of GNI
O DA EUR Million
O DA in % of GNI
O DA EUR Million
O DA in % of GNI
O DA EUR Million
O DA in % of GNI
O DA EUR Mill ion
O DA in % of GNI
O DA EUR Mill ion
O DA in % of GNI
O DA EUR Mill ion
O DA in % of GNI
Gap EUR million
Gap in % of GNI
O fficial Targets EU-15: 0.51 EU-15: 0.51EU-12: 0.17 EU-12: 0.17(or national target)
Austria 545 0.23 1266 0.52 1194 0.47 1321 0.50 1188 0.43 820 0.30 905 0.32 1419 0.51 513 0.19Belgium 1178 0.41 1580 0.53 1575 0.50 1425 0.43 1654 0.48 1874 0.55 2265 0.64 2486 0.70 221 0.06Bulgaria 1 0.00 17 0.06 13 0.04 12 0.04 31 0.09 58 0.17 27 0.08Cyprus 4 0.03 4 0.03 21 0.15 18 0.12 26 0.17 33 0.20 34 0.20 29 0.17 0 -Czech Republic 87 0.11 109 0.11 128 0.12 131 0.11 173 0.12 154 0.12 169 0.12 234 0.17 65 0.05Denmark 1640 0.85 1697 0.81 1782 0.80 1872 0.81 1944 0.82 2018 0.88 2164 0.90 1901 0.80 0 -Estonia 4 0.04 5 0.05 11 0.09 12 0.08 16 0.10 13 0.10 14 0.10 24 0.17 10 0.07Finland 547 0.37 726 0.46 665 0.40 717 0.39 808 0.44 926 0.54 1008 0.55 910 0.51 0 -France 6820 0.41 8067 0.47 8445 0.47 7220 0.38 7562 0.39 9048 0.47 9751 0.50 10026 0.51 274 0.01Germany 6064 0.28 8112 0.36 8313 0.36 8978 0.37 9693 0.38 8674 0.35 9606 0.38 12888 0.51 3282 0.13Greece 258 0.16 309 0.17 338 0.17 366 0.16 488 0.21 436 0.19 378 0.17 1139 0.51 762 0.34Hungary 56 0.07 81 0.11 119 0.13 76 0.08 74 0.08 84 0.10 85 0.09 158 0.17 73 0.08Ireland 489 0.39 578 0.42 814 0.54 871 0.55 921 0.59 722 0.54 676 0.53 647 0.51 0 -Italy 1981 0.15 4096 0.29 2901 0.20 2901 0.19 3370 0.22 2368 0.16 2349 0.15 7780 0.51 5432 0.36Latvia 7 0.06 8 0.07 9 0.06 12 0.06 15 0.07 15 0.07 12 0.06 31 0.17 19 0.11Lithuania 8 0.04 12 0.06 20 0.08 35 0.11 35 0.11 30 0.11 28 0.10 46 0.17 18 0.07Luxembourg 190 0.79 206 0.79 232 0.89 274 0.92 288 0.97 298 1.04 301 1.09 286 1.00 0 -Malta 8 0.18 7 0.17 7 0.15 8 0.15 11 0.20 10 0.18 7 0.11 10 0.17 3 0.06The Netherlands 3384 0.73 4115 0.82 4343 0.81 4547 0.81 4848 0.80 4615 0.82 4795 0.81 4654 0.80 0 -Poland 95 0.05 165 0.07 236 0.09 265 0.10 258 0.08 269 0.09 285 0.08 581 0.17 295 0.09Portugal 830 0.63 303 0.21 316 0.21 344 0.22 430 0.27 368 0.23 489 0.29 843 0.51 354 0.22Romania 3 0.00 84 0.07 94 0.07 99 0.09 86 0.07 205 0.17 119 0.10Slovak Republic 23 0.07 45 0.12 44 0.10 49 0.09 64 0.10 54 0.09 56 0.09 112 0.17 56 0.08Slovenia 25 0.10 28 0.11 35 0.12 40 0.12 47 0.13 57 0.15 48 0.13 60 0.17 13 0.04Spain 1962 0.24 2429 0.27 3038 0.32 3755 0.37 4761 0.45 4728 0.46 4467 0.43 5259 0.56 792 0.13Sweden 2191 0.78 2705 0.94 3151 1.02 3170 0.93 3281 0.98 3266 1.12 3418 0.97 3500 1.00 82 0.03UK 6362 0.36 8667 0.47 9926 0.51 7194 0.36 7973 0.43 8251 0.52 10391 0.56 8795 0.56 0 -
EU 15 TO TAL 34441 0.35 44856 0.44 47033 0.43 44954 0.39 49207 0.43 48413 0.45 52963 0.46 62532 0.56 11712 0.10EU 12 TO TAL 317 0.07 464 0.09 635 0.09 745 0.09 825 0.09 830 0.10 854 0.09 1548 0.17 699 0.08EU 27 TO TAL 34758 0.34 45320 0.42 47668 0.41 45699 0.37 50032 0.40 49243 0.42 53817 0.43 64365 0.53 12411 0.10
Gap to collective 2010 target 0.56%Target in EUR million: 68,376 Gap in EUR million 14,559 Gap in % of GNI 0.13
2010 (preliminary) 2010 (commitments)2010: financial gap to INDIVIDUAL targets2004 2005 2006 2007 2008 2009

EN 28 EN
The trends among Member States varied, as the figures and tables in Annex 2 show. The largest increase during 2010 was made by the United Kingdom (EUR 2.1 billion), followed by Germany (EUR 0.9 billion), France (EUR 0.7 billion), and Belgium (EUR 0.4 billion). These four countries accounted for over 90% of the increase between 2009 and 2010. Cyprus (0.20%) exceeded its individual, intermediate target threshold of 0.17% ODA/GNI, which it had already achieved in 2009, one year ahead of schedule. Sweden, despite increased ODA volumes corresponding to 0.97% of its GNI again demonstrated how difficult it is to remain, year-on-year, in keeping with its national 1% target level. Belgium, although reaching a record level of 0.64% ODA/GNI, had planned to spend 0.7% of its GNI for development assistance in 2010 and beyond, in line with its national legislation and projects reaching that level in 2011. Ireland, severely hit by the financial crisis, had decided, in 2010, to slow down the scaling-up of ODA process and to align with the common EU timetable, by postponing the target date for reaching 0.7% ODA/ GNI from 2012 to 2015. Consequently Ireland's ODA spending in 2010 was cut, but less than initially feared.
From 2009 to 2010, ODA fell in nine Member States (Greece, Ireland, Italy, Latvia, Lithuania, Malta, Romania, Slovenia and Spain), although for most of them the decline was minor. The worst aid cuts were made in Spain (down EUR 261 million, to 0.43% ODA/GNI).
The performance of Italy and Germany will be particularly important in helping achieve the 2015 target as they account for almost half the shortfall. Italy has shown little commitment to the ODA targets and has continuously cut its aid budgets over the last five years. This has led to a decline in ODA/GNI ratios from 0.20% in 2002 to 0.15% in 2010, with a few occasional increases over the period due mostly to one-off debt relief operations that are not enough for sustaining ODA levels. Germany, whose ODA/GNI ratio grew from 0.27% in 2002 to 0.38% in 2010, also relied substantially on the one-off effects of debt relief. Contrary to its declaration annexed to the May 2005 Council Conclusions, Germany has not introduced the innovative sources of financing with sufficient revenue generation potential it had declared were necessary to reach the ODA targets. Increased allocations to the Development Ministry’s budget came too late and at much too low a level to create the necessary upward trend.
2.2.5. Achievement of the 0.7% ODA/GNI Target by 2015
The EU scaling-up process has been uneven, with asymmetric efforts. Member States not contributing their fair share to the burden-sharing effort endanger the performance of the EU as a whole and substantially increase the risk of collective failure on ODA targets.
Figure 5 below shows the long-term trends in ODA volumes for the EU27. At the current pace and with existing budgets, there is a delay equivalent to about 25 years on the path to 0.7%, as ODA is projected to increase at an annual rate of 0.01% of GNI. These Commission simulations build on the trends of 2005 – 2010 and spending forecasts, as available, that Member States reported in their replies to the annual questionnaire. To reach 0.7% ODA/ GNI by 2015 as planned, efforts would have to be stepped up dramatically but this may not be realistic under current economic conditions. Furthermore, as shown in Figure 4 above, the main effort would have to come from under-performing Member States, which would have to drastically increase their ODA in a short time span under tight budget conditions. To reach the 2015 target Latvia would need to sextuple its current ODA volumes over the next five years, Bulgaria, Greece, Italy, Poland, Romania, and the Slovak Republic quintuple; Estonia, Hungary, and Malta quadruple; and Austria, the Czech Republic, Portugal and Slovenia triple their aid allocations.. This effort is all the more significant since the exceptional debt relief operations that explain, for example, the sudden increase in 2005-2006 (see Figure 5) will not be feasible again.

EN 29 EN
Figure 5 - EU 27 ODA/GNI Ratios (1995-2015)
0.37 0.37
0.33 0.33 0.31 0.32 0.33 0.35 0.35 0.35
0.41 0.41
0.370.40
0.420.43
0.50
0.55
0.61
0.65
0.70
0.43 0.43 0.44 0.45 0.45
0.00
0.10
0.20
0.30
0.40
0.50
0.60
0.70
0.80
1995 1996 1997 1998 1999 2000 2001 2002 2003 2004 2005 2006 2007 2008 2009 2010 2011 2012 2013 2014 2015
OD
A a
s a
% o
f GN
I
EU27 - ODA as a % of GNI Historical data and projections for reaching 2015 targets
EU15 EU25 EU27 EU15 ODA to Africa EU15 ODA to LDCs Required linear increase EU27 Commission projections or MS forecasts
2010 Target: 0.56
2015 Target: 0.70
LDC Target: 0.15
Source: OECD DAC/European Commission (EU annual questionnaire on financing for development)

EN 30 EN
Table 3: Estimates and gaps to be bridged for reaching the 2015 ODA targets, based on Member States' forecast information and Commission simulation
O DA EUR Million
O DA in % of GNI
O DA EUR Million
O DA in % of GNI
O DA EUR Million
O DA in % of GNI
O DA EUR Million
O DA in % of GNI
O DA EUR Million
O DA in % of GNI
O DA EUR Million
O DA in % of GNI
O DA EUR Million
O DA in % of GNI
Gap EUR million
Gap in % of GNI
O fficial Targets EU-15: 0.7 EU-15: 0.7EU-12: 0.33 EU-12: 0.33
Austria 905 0.32 929 0.32 1,053 0.35 1,046 0.34 1,099 0.34 1,034 0.31 2329 0.70 1424 0.42Belgium 2265 0.64 2,576 0.70 2,676 0.70 2,771 0.70 2,869 0.70 2,972 0.70 2972 0.70 707 0.13Bulgaria 31 0.09 31 0.08 36 0.09 42 0.10 49 0.11 56 0.12 151 0.33 121 0.26Cyprus 34 0.20 34 0.19 34 0.19 35 0.18 36 0.18 36 0.17 69 0.33 35 0.16Czech Republic 169 0.12 180 0.12 193 0.13 197 0.12 211 0.13 225 0.13 579 0.33 411 0.22Denmark 2164 0.90 2,043 0.82 2,043 0.79 2,043 0.77 2,144 0.79 2,257 0.81 2240 0.80 76 -Estonia 14 0.10 17 0.12 21 0.14 23 0.14 27 0.16 31 0.17 61 0.33 47 0.25Finland 1008 0.55 1,074 0.56 1,119 0.56 1,175 0.56 1,229 0.55 1,334 0.57 1624 0.70 616 0.25France 9751 0.50 9,555 0.47 10,044 0.48 9,128 0.42 9,513 0.43 9,940 0.43 16091 0.70 6340 0.26Germany 9606 0.38 10,479 0.40 10,933 0.40 11,416 0.41 11,911 0.41 12,426 0.42 20851 0.70 11245 0.34Greece 378 0.17 418 0.19 423 0.19 441 0.19 459 0.19 480 0.19 1779 0.70 1401 0.52Hungary 85 0.09 94 0.09 96 0.09 95 0.09 94 0.08 93 0.08 379 0.33 294 0.26Ireland 676 0.53 669 0.52 708 0.55 766 0.57 834 0.60 914 0.63 1021 0.70 345 0.20Italy 2349 0.15 2,495 0.16 3,281 0.20 2,003 0.12 1,792 0.11 1,606 0.09 11948 0.70 9600 0.57Latvia 12 0.06 12 0.06 12 0.06 12 0.06 13 0.06 13 0.06 74 0.33 62 0.27Lithuania 28 0.10 33 0.11 39 0.13 46 0.14 53 0.16 63 0.18 117 0.33 89 0.22Luxembourg 301 1.09 292 1.00 309 1.00 327 1.00 346 1.00 366 1.00 366 1.00 65 -Malta 7 0.11 13 0.22 15 0.24 18 0.27 20 0.30 23 0.33 23 0.33 16 0.16The Netherlands 4795 0.81 4,646 0.76 4,480 0.71 4,661 0.70 4,810 0.70 5,059 0.70 5059 0.70 264 -Poland 285 0.08 321 0.09 357 0.09 391 0.09 428 0.10 467 0.10 1541 0.33 1256 0.26Portugal 489 0.29 335 0.20 364 0.21 403 0.23 448 0.24 499 0.26 1340 0.70 851 0.50Romania 86 0.07 99 0.08 119 0.09 136 0.10 157 0.11 180 0.12 510 0.33 424 0.26Slovak Republic 56 0.09 66 0.10 63 0.09 63 0.08 63 0.07 63 0.07 297 0.33 242 0.27Slovenia 48 0.13 60 0.17 66 0.17 69 0.17 71 0.17 73 0.17 143 0.33 96 0.20Spain 4467 0.43 4,234 0.40 3,934 0.36 4,450 0.39 5,045 0.43 5,729 0.47 8510 0.70 4043 0.30Sweden 3418 0.97 4,025 1.00 4,184 1.00 4,367 1.00 4,551 1.00 4,739 1.00 4739 1.00 1321 -UK 10391 0.56 10948 0.56 11411 0.56 14878 0.70 15561 0.70 16308 0.70 16308 0.70 5917 0.23
EU 15 TO TAL 52963 0.46 54716 0.46 56962 0.46 59873 0.47 62613 0.48 65663 0.48 96238 0.71 44215 0.30EU 12 TO TAL 854 0.09 960 0.10 1052 0.10 1128 0.10 1221 0.11 1324 0.11 3946 0.33 3092 0.25EU 27 TO TAL 53817 0.43 55677 0.43 58014 0.43 61001 0.44 63834 0.45 66986 0.45 100181 0.68 47307 0.29
MS Projection/Budget Forecast Gap to collective 2015 target 0.7%Target in EUR million: 103,736 Gap in EUR million 49,919 Gap in % of GNI 0.34 2010 ODA on 2015 GNI 0.36 Total 0.70
2015 (commitments)2015: financial gap to
meet individual targets 2010 (preliminary) 2011 2012 2013 20142015
(forecast/simulation)

EN 31 EN
Initial projections for 2011, based on Member Sates’ replies or budget data monitored by Concord/AidWatch36, point to an increase in ODA budgets below the expected GNI growth rate that would lead to a stable ODA/GNI ratio for 2011 of 0.43%. The prospects for 2011 according to Member States' reports are as follows:
• The ODA budgets for Austria, Belgium, the Czech Republic, Estonia, Finland, Germany37, Greece, Hungary, Italy, Lithuania, Malta, Poland38, the Slovak Republic, Slovenia, Sweden and the United Kingdom are expected to grow in 2011.
• Bulgaria, Cyprus, Ireland39, Latvia, and the Slovak Republic will maintain their ODA budget essentially at the same level in nominal terms.
• Denmark, France, Luxembourg, the Netherlands, Portugal40, and Spain will reduce their ODA budget in 2011.
• Romania did not provide estimates for its 2011 ODA budgets and no third party monitoring was available.
The ODA graphs in Annex 2 show each EU Member State's readiness to meet the individual ODA target levels of 0.7% and 0.33% of GNI for EU15 and EU12 respectively in 2015. Annex 1 outlines the methodology used to analyse ODA indicators and forecasts provided by Member States. A recent survey by OECD DAC41 reached similar conclusions; i.e. that donors’ forward budget plans will probably remain substantially steady in 2011. According to this survey, global Country Programmable Aid (CPA) is ‘programmed to grow at a real rate of 2.5% per year from 2009 to 2012. This is good news in the light of the current climate of budgetary austerity in OECD countries. The bad news is that growth in planned CPA is decelerating significantly, from an average annual growth rate of 7% over the past three years. Almost all the planned growth was in 2010, with a zero-forecast growth rate in 2012.’ Enabling factors for increases in Member States’ ODA. There has been some progress in establishing what can be considered ‘multi-annual timetables’ for ODA, as repeatedly called for by Council Conclusions. Timetables have proven a useful tool for embedding the scaling-up of aid volumes in national budgets in line with stated commitments. Member States have taken different paths in developing timetables (see Box 1). However, even where these tools exist, they cannot stop possible reductions in ODA budgets when there is a strong political intent to do so, as shown by the recent events in the Netherlands or Spain. Nor can the tools replace the political will to increase aid where no such will exists.
36AidWatch Briefing (February 2011), Between austerity and political will: EU MS ODA budgets in 2011. Risks that in 2011 genuine EU aid will fall for the first time since 1997. 37According to Aid Watch (2011), Germany’s budget for 2011 will increase to 0.40% of GNI. 38Based on Aid Watch (2011), as no reply was provided by the Member State. 39According to Aid Watch (2011), Ireland’s ODA budget will decline in 2011. We inserted the reply provided by Ireland to the Monterrey questionnaire. 40According to Aid Watch (2011), Portugal’s ODA budget will decline in 2011. 41See the 2010 OECD Report on Aid Predictability Survey on Donors’ Forward Spending Plans 2010 – 2012.

EN 32 EN
Box 1. Approaches to maintaining or increasing ODA budgets
Enacting legislation to make 0.7% ODA/GNI a binding obligation. Belgium has set, by law, a minimum aid level commitment, called the ‘growth-path’ towards the 0.7% target. The ‘growth path’ is set out in the solidarity notes and can also be amended by the solidarity notes. These are drafted and approved by the government but the government cannot amend the legally binding target of 0.7% to be reached in 2010. Despite this, the Belgian ODA level was 0.64% of GNI in 2010, missing its legally binding commitment to the 0.7% target. For many years the Netherlands has had a legal obligation to spend a fixed proportion of its GNI as ODA. In a letter of 26 November 2010 to the House of Representatives on its development cooperation policy the new ruling coalition stated that ’[the budget] will be reduced in two equal steps in the next two years, from 0.8% to 0.7% of GNP as of 2012’. In the UK, the government will enshrine in law before April 2012 its commitment to spend 0.7% of GNI as ODA from 2013. There seems to be cross-party consensus on the importance of ODA and readiness to assume responsibility in the world, as the commitment for 2015 was kept notwithstanding the recent change in government. Cross-party consensus is important in maintaining high ambitions even under difficult budget situations.
Transparent multi-year budget spending plans. The UK Government has set out its commitment to increase Official Development Assistance (ODA) to 0.56% of GNI in 2011 and 2012 and 0.7% from 2013 in line with the UK’s international commitments to help the very poorest in the World. The Spending Review 2010, published on 20 October 2010, sets out the figures for each year up to 2014 in clear spending plans (http://www.hm-treasury.gov.uk/spend_sr2010_documents.htm). The UK’s ODA budget will increase every year between now and then, amidst budget cuts in many other areas, an indication that ODA increases are possible despite budget austerity, if the political will is there.
Government-endorsed development policy documents. The Finnish Development Policy Programme42, i.e. Government Decision-in-Principle, has stated the commitment to ensuring the development cooperation appropriations which ’will take Finland towards 0.7% GNI set by the UN, and Finland is committed to achieve the target of 0.51% in 2010 as established in the European Council’s decision’. Denmark’s commitments and strategic priorities are set down in its new development strategy ‘Freedom from Poverty - Freedom to change’ and the accompanying multi-annual budget forecast43. The Spanish ‘Master Plan for Development Cooperation 2009-2012’44 forms the basis of Spanish development cooperation at government level and was endorsed by the Spanish Government and Parliament. The Master Plan states that Spain aspires to reach an ODA/GNI ratio of 0.7% by 2012. Spain has shown a significant commitment to increase its aid over the last few years, but ODA is always lagging behind its own national plans and has been declining since 2008. Given current aid levels, it seems unrealistic to assume that Spain could achieve its national target, especially in light of the further aid cuts announced for 2011.
Indicative multi-annual timetables. Four Member States (Belgium, Malta, Sweden, and the United Kingdom)45 have indicative multi-annual timetables in place that show the path towards the achievement of their individual target for 2015. As part of next year’s budget process for the financial year 2012 and the medium-term financial plan until 2015, the German government will define its intended budgets for development cooperation. Nevertheless government and parliament will discuss the actual annual budgets for 2013-2015 and how to reach this goal in the annual budget processes.
42http://formin.finland.fi/public/default.aspx?contentid=107497 http://formin.finland.fi/public/default.aspx?contentid=107497 43http://amg.um.dk/NR/rdonlyres/1C903D5E-3A75-453F-BACB 8EBF8B55F7F2/0/Priorities_danish_development_assistance20112015.pdf http://amg.um.dk/NR/rdonlyres/1C903D5E-3A75-453F-BACB 8EBF8B55F7F2/0/Priorities_danish_development_assistance20112015.pdf 44http://www.maec.es/en/MenuPpal/Actualidad/NotasdePrensa/Paginas/49NP20090514EN.aspx http://www.maec.es/en/MenuPpal/Actualidad/NotasdePrensa/Paginas/49NP20090514EN.aspx 45The total number of Member States with multi-annual timetables is ten. However, six are on a path away from rather than towards keeping their individual commitments for 2015. Denmark and Luxembourg have plans showing they will keep their volumes steady in nominal terms. They will, thus not meet their commitment to sustain their efforts, as levels and volumes in real terms are both projected to decline. The Czech Republic and Finland have timetables till 2013 or 2014, showing paths with significant implicit back-loading of their commitments. Cyprus and Estonia have multi-annual timetables that show they will not meet their 2015 target of 0.33%.

EN 33 EN
2.2.6. Lessons Learnt and the Way Forward
The European Union and its Member States have repeatedly reiterated their commitments to achieve the 0.7% ODA to GNI ratio by 2015, as a concrete, time-bound goal. The rationale for a time-bound target was to provide adequate funding to achieve the Millennium Development Goals. This was not as an act of solidarity or charity but a strategy to tackle the root causes of poverty and fragility before they spiral out of control, generating refugee flows and security threats. It was also designed to face challenges that know no boundaries and that affect the entire globe, such as climate change, loss of biodiversity, desertification or the spread of infectious diseases. There are thus no grounds for seeing the 2015 goal as a mere aspiration or a declaration of intent, as some Member States do. ODA is not an act of charity that makes sense only in ‘good times’ but it is in the Union’s own interests. There is a clear need to better communicate these goals and to educate EU public opinion about their importance. Significantly, the latest Eurobarometer on Development Cooperation shows that Europeans believe it is important to help people in developing countries because they are facing challenges such as overwhelming poverty. Two out of three Europeans cite self-interested motivation for giving aid, namely trade, terrorism, migration and political relations with third countries.46 There are several lessons to be drawn from the EU’s experience. First, the reduced ambition of some national plans has had a real impact on collective progress on ODA. Some of the more ambitious Member States have reduced their targets compared to the ones that formed the basis for the 2005 Council Conclusions. Had these commitments been met, the EU 27 ODA/GNI47 ratio would have been closer to the 2010 target (0.50% rather than 0.43% based on simulations prepared for this report). Second, the current fiscal crunch has led some countries to revise their commitments and targets. Spain, after increasing ODA substantially under the current government, has announced a reduction of EUR 800 million in the next two years and has acknowledged that the 0.7% of GNI target will have to wait until 2015 at least, and even then will only be attained if economic conditions improve. The coalition treaty of the new government of the Netherlands states that ODA spending will be reduced from 0.8% to 0.7% for the legislative period of the new government, which goes against the spirit of its individual commitment as an EU country to sustain its efforts. Although the agreed individual EU target was to reach 0.33% by 2006 and 0.51% by 2010 Portugal translated this into national targets of 0.33% by 2006, 0.30% by 2009, and 0.34% by 2010. It has missed all three. At the UN Millennium Summit of September 2000, Ireland committed to reaching the UN target of 0.7% GNI by 2007. Its government gradually increased ODA from 0.39% of GNI in 2003 to 0.58% by 2008. However, in 2005 the target date for meeting 0.7% was revised to 2012. In 2009 it was further postponed to 2015. Italy has consistently missed targets and its aid has declined. Without debt relief, which is expected to be about EUR 0.6 billion in 2011 and EUR 1.3 billion in 2012, respectively, Italy’s ODA is projected to remain essentially unchanged in nominal terms (at about EUR 2 billion per year) between 2010 and 2013 at already minimal levels. According to Social Watch (2010), Germany publicly announced in late 2009 that it considered the EU’s step-by-step ODA scaling up plan as a declaration of intent, not an obligation under international law, and could
46Special Eurobarometer 318 / Development Aid in times of economic turmoil Wave 71.2 – TNS Opinion & Social (Fieldwork: May 2009 – June 2009 Publication: October 2009) 47Commission simulation based on public announcement and intermediate targets indicated in the OECD DAC’s annual Development Co-operation Report.

EN 34 EN
not achieve an ODA ratio of 0.51% in just one year. Finally, Greece is drawing conclusions from the fact that it will not be able to move away from low aid levels and indicated that 0.51% will not be achieved prior to 2012, and this revised target is likely still too ambitious given current economic circumstances. The majority of 12 newest Member States do not see the 0.17% or 0.33% targets as firm commitments, and have adopted lower national targets (e.g. Estonia forecast to reach 0.17% by 2015, Cyprus 0.18% by the same year) or seem to have no plan for ODA increases. Third, back-loading the increase in ODA expenditure has been the main factor in missing target levels. Sustaining the scaling-up process through debt relief grants is impossible: debt relief grants are ‘one-off’ exercises by nature and insufficient if not replaced after the debt relief spike by ‘fresh money’ in ODA budgets. Experience shows that missing intermediate targets in a significant way leads to missing subsequent targets too. A good example is the Member States that significantly missed the 2006 target of 0.33% GNI: Greece, Italy and Portugal. Once the target was missed, statements were made that the 2006 target would be achieved by 2007 or 2008. In reality, the 2006 target has not been met by any of them even by 2010 and these three Member States ended up missing both the 2006 and the 2010 targets.
Table 4 - Gap between 2010 ODA levels and 0.7% and 0.33% ODA/ GNI individual targets, by Member State
Member State Funding Gap (EUR million) Member State
Funding Gap (EUR million)
0.7% target 0.33% target Germany 11245 Poland 1256 Italy 9600 Romania 424 France 6340 Czech Republic 411 UK 5917 Hungary 294 Spain 4043 Slovak Republic 242 Austria 1424 Bulgaria 121 Greece 1401 Slovenia 96 Sweden 1321 Lithuania 89 Portugal 851 Latvia 62 Belgium 706 Estonia 47 Finland 616 Cyprus 35 Ireland 345 Malta 16 Netherlands 264 Denmark 76 Luxembourg 65 Total 47307
Source: OECD DAC/European Commission (EU annual questionnaire on financing for development)
Fourth, Europe relies not only on the medium-sized donors, but also on EU countries with large economies such as France, Germany, Italy and the UK to boost average aid levels so as to reach targets. These countries account for 70% of the gap to be filled between 2010 and 2015. If Europe is to meet the collective target of 0.7% ODA/GNI by 2015, it is imperative that all the big players step up their efforts. Table 4 above shows the funding gap between the 0.7% target and the current level of ODA from EU Member States. When analysing the ODA gap to 2015, we can distinguish four groups of Member States:
1. Denmark, Luxembourg, the Netherlands, and Sweden have already achieved the 0.7% target and rather than providing additional resources, may actually reduce their

EN 35 EN
contribution. These countries account for 3% of the gap and the risk of backtracking on their ODA commitments is small but not zero. Available multi-annual budgets show that Denmark, the Netherlands and Luxembourg are planning to keep their aid steady in nominal terms till 2014 or 2015, with declining ODA/GNI ratios. Only Sweden is expected to grow its aid both in volume and as a share of GNI.
2. Belgium, Cyprus, Finland, France, Ireland and the United Kingdom have reached the 2010 targets or missed it by a small margin, and could achieve their individual targets (0.7 % and 0.33 %) on time or ahead of time. These countries account for 30% of the funding gap and their downside risk is limited. Their share of the gap is likely to be filled, although the current degree of back-loading is probably too high.
3. Austria, the Czech Republic, Estonia, Germany, Lithuania, Malta, Poland, Slovenia and Spain have missed the 2010 targets but could step up their efforts. They account for 40% of the funding gap and the risk of not meeting their targets on time is relatively high. The most likely outcome is that only a fraction of their share of the gap will be filled on time.
4. Bulgaria, Greece, Hungary, Italy, Latvia, Portugal, Romania, and the Slovak Republic are far behind and are unlikely to meet their individual targets by 2015. These countries account for 27% of the gap and the likelihood of major improvements is low. The current economic situation in Greece and Portugal in particular may place a serious constraint on increasing ODA budgets.
Unless decisive action is taken, the risk is high that the 2015 target will be missed by a large margin as shown by the above analysis. The Commission has pointed this out in the last four annual reports and has, over the years, proposed several ways of stepping up efforts. The options remain the same as identified in last year’s report:
1. All Member States draw up realistic and verifiable national ODA action plans outlining how they aim to scale up and strive to achieve the 2015 ODA targets. Each annual action plan should be published by the end of the year preceding the spring Foreign Affairs Council (Development) (FAC). Core elements of the action plan are:
• Increasing ODA each year (by volumes and as a percentage of GNI) compared to the previous year in order to reach and sustain EU targets. ODA increases are an issue of political choice, even in difficult budgetary situations.
• Indicating ODA estimates for the remaining period until 2015. Overall ODA increases in the period 2010–2015 should be commensurate with the individual target to be reached or sustained by and beyond 2015 (0.7% of GNI for the EU-15 and 0.33% for the EU-12. Higher aid levels already achieved by the strong performers should be maintained.
• Describing concrete actions to build public support for development in the Member State concerned, including better coverage of development-related issues in the national media and finding new and better means of communication on development. The EU and its Member States need to do more to communicate development success stories, and should do this more systematically and jointly. A better informed and educated public that is supportive of development cooperation can be a powerful ally in government commitments to increase ODA spending. Only an educated public will be able to hold governments accountable for delivering on their commitments.

EN 36 EN
2. The European Council, in June 2010, took up partially the idea of an EU-internal annual ODA peer review, by requesting an annual report of the Council on the ODA situation. However, it remains to be seen whether the European Council will assess the progress of each Member State and what guidance it will give for further joint EU progress for attaining the agreed ODA targets..
3. Describing mechanisms for ensuring scaling-up. National legislation ring-fencing ODA or making ODA targets legally binding is helping some Member States to reach the 0.7% target early (Belgium) or to maintain aid levels at or above that level (Sweden). Against this background, the Commission had also proposed that Member States should consider enacting national legislation on ODA levels with a view to reaching the agreed EU ODA targets or maintaining higher national aid levels. This could be done either through specific legislation, such as that currently being examined in the UK, or through specific annotations in the national budget laws.
Increasing ODA levels is not a technical exercise and Member States need to decide on the way forward.
2.2.7. EU not acting in line with its promise on ODA to Africa
What share of EU ODA increases have been directed to the African continent? Since making the commitment to direct 50% of EU aid increases to Africa in 2005 (based on 2004 aid levels), the combined EU aid to Africa has risen by about EUR 3.3 billion at constant prices so that 26% of ODA growth between 2004 and 2009 went to Africa, as shown in Figure 6.
Figure 6 - ODA to Africa from EU15 in EUR million and as a % of GNI (including imputed multilateral flows)
ODA to Africa from EU Member States reporting to DAC in EUR million and as a % of GNIincluding imputed multilateral flows
13,977 14,45716,360 17,271
18,431 18,200
21,928
3,373
6,640
8,412
2,0261,198 2,483
-
0.16
0.19
0.21
0.16 0.16
0.18
0.19
-
5,000
10,000
15,000
20,000
25,000
30,000
2004 2005 2006 2007 2008 2009 2010
EUR
mill
ion
(200
8 pr
ices
)
-
0.05
0.10
0.15
0.20
0.25
% o
f GN
I
EU Net ODA to Africa and imp multi excluding debt EU Net Debt Relief to Africa Per cent of donor GNI
Please note: preliminary 2010 data do not allow to identify debt rel ief to Africa. Imputed multilateral flows for 2010 are estimates.
Source: OECD DAC data for 2004 – 2009 and Commission simulation on DAC data for 2010
Most EU Member States stated that they have already met the commitment on ODA to Africa and some (e.g. Netherlands) have set up systems to monitor their performance in this respect. For some,

EN 37 EN
aid to Africa already accounts for most of their bilateral ODA (e.g. 80% for Ireland, 64% for Portugal). Few Member States will not contribute to that target through their bilateral ODA as they believe their comparative advantage is in other regions of the world. An important dimension is the imputed multilateral share of EU aid to Africa, which amounted to some EUR 8.7 billion in 2010 and contributed 50% of the collective EU increase from 2004 to 2010.
How did EU ODA to Sub-Saharan Africa increase since 2005?
EU ODA to Sub-Saharan Africa grew by around EUR 2.6 billion in real terms over the period 2004-2009, thus meeting the less demanding target of increasing EU aid to Sub-Saharan Africa. Preliminary estimates for 2010 indicate there was no further growth. Only the Netherlands and Portugal decreased their ODA to Sub-Saharan Africa over this period. The growth was due to aid through multilateral channels (EUR 1.8 billion), and ODA excluding debt relief (EUR 1.5 billion) partly compensated by a decline in debt relief of EUR0.7 billion. The relative importance of Sub-Saharan Africa declined over the period from 47% of total EU ODA to 42%.
2.2.8. EU ODA to Least Developed Countries stable
In November 2008, Member States promised, as part of the EU’s overall ODA commitments, to provide collectively 0.15% to 0.20% of their GNI to Least Developed Countries (LDCs) by 2010 while fully meeting the differentiated commitments set out in the ’Brussels Programme of action for the LDCs for the decade 2001-2010’. According to available OECD DAC data, LDCs' share of EU ODA has increased both in absolute and relative terms since 2004 and stood at EUR 15.1 billion at 2008 prices, 31% of EU ODA or 0.13% of GNI in 2010. Ten Member States plan to achieve the LDC target of 0.15% to -0.20% by 2015 while ten think they will not do so, due in some cases to budgetary constraints. For the remaining seven Member States no information is available. According to DAC data summarised in Table 5, Belgium, Denmark, Finland, Ireland, Luxembourg, the Netherlands, Sweden and the United Kingdom had already met the ODA to LDC target by 2009 and stayed above it also in 2010. All of these countries had an average ODA/GNI ratio well above the 0.15% mark for the entire period since taking the EU commitments. Ireland is the only Member State that has kept a share of ODA to LDC greater than 50% for the entire period. Portugal met the target on average in 2004-2009 and, along with Hungary and Italy, maintained a share of LDCs in total ODA greater than the EU average of 30% for most of that period. Member States that have not reached the target need to make a deliberate effort to increase their overall ODA and, within this, to increase the proportion of aid that goes to LDCs. Figure 7 summarises the evolution of the ODA to LDCs over GNI ratios for EU Member States reporting to DAC over the period 2004-2010. The peak in 2005 and 2006 is due to large debt relief operations in those years.

EN 38 EN
Table 5 - ODA/GNI to LDCs and LICs 48 (2009 and average 2004-2009, %)
ODA/GNI 2009 Average ODA/GNI 2004-
2009 Country LDC OLIC LIC LDC OLIC LIC
Austria 0.09 0.03 0.12 0.08 0.04 0.11
Belgium 0.20 0.05 0.25 0.18 0.05 0.23
Denmark 0.34 0.12 0.46 0.33 0.12 0.45
Finland 0.19 0.05 0.24 0.15 0.04 0.19
France 0.12 0.08 0.20 0.12 0.06 0.18
Germany 0.10 0.03 0.13 0.09 0.04 0.13
Greece 0.04 0.01 0.04 0.04 0.01 0.05
Ireland 0.28 0.04 0.32 0.27 0.04 0.31
Italy 0.05 0.01 0.07 0.06 0.02 0.08
Luxembourg 0.39 0.09 0.48 0.34 0.08 0.43
Netherlands 0.21 0.06 0.26 0.24 0.08 0.31
Portugal 0.10 0.01 0.10 0.16 0.01 0.16
Spain 0.12 0.03 0.15 0.08 0.02 0.11
Sweden 0.34 0.09 0.43 0.30 0.07 0.38
United Kingdom 0.18 0.06 0.24 0.15 0.08 0.23
Czech Republic 0.04 0.01 0.05 0.03 0.01 0.04
Hungary 0.03 0.01 0.04 0.03 0.00 0.03
Poland 0.02 0.00 0.03 0.02 0.00 0.03
Slovak Republic 0.02 0.00 0.03 0.04 0.01 0.05
Slovenia 0.03 0.01 0.04 0.06 0.01 0.07
Total EU (20 Member States)49 0.13 0.05 0.17 0.12 0.05 0.17
Source: OECD DAC
48 LDCs : Low Developed Countries. LICs: low Income Countries. OLIC: Other Low Income Countries 49For other EU Member States that are not DAC members this information is not available.
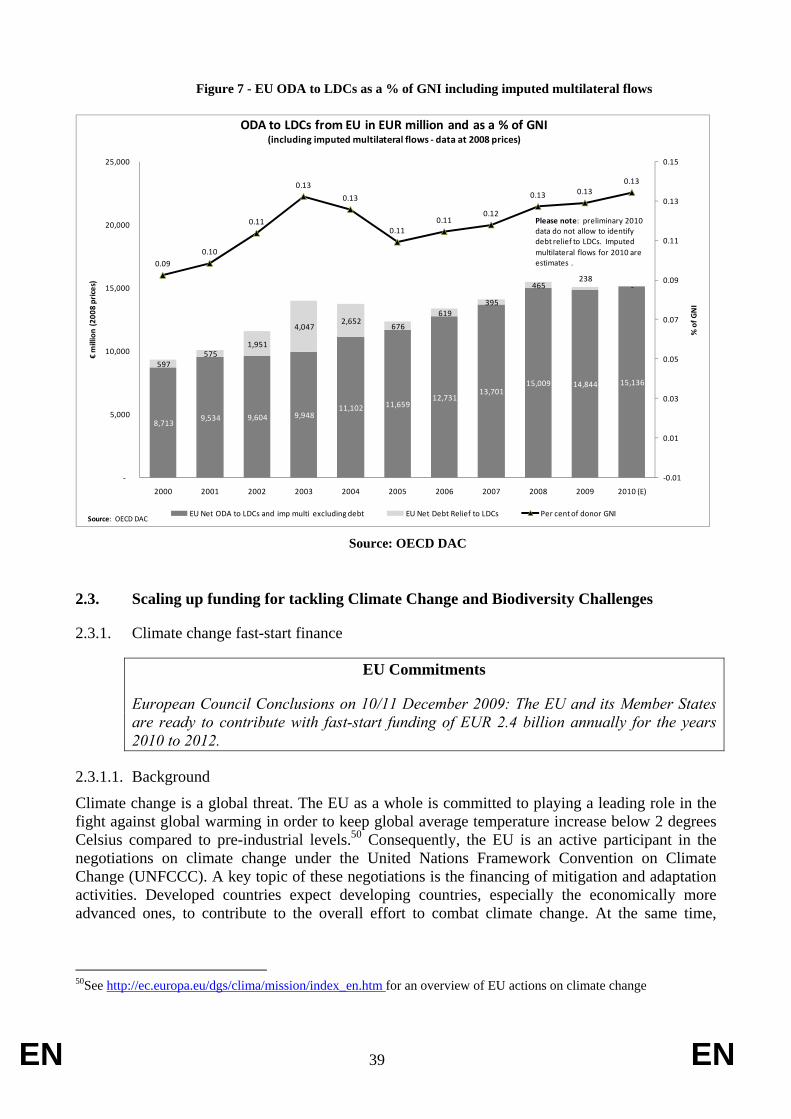
EN 39 EN
Figure 7 - EU ODA to LDCs as a % of GNI including imputed multilateral flows
8,713 9,534 9,604 9,948
11,102 11,659 12,731
13,701 15,009 14,844 15,136
597 575
1,951
4,047 2,652
676
619 395
465 238
-
0.090.10
0.11
0.13
0.13
0.110.11
0.12
0.13 0.130.13
-0.01
0.01
0.03
0.05
0.07
0.09
0.11
0.13
0.15
-
5,000
10,000
15,000
20,000
25,000
2000 2001 2002 2003 2004 2005 2006 2007 2008 2009 2010 (E)
% o
f GN
I
€m
illio
n (2
008
pric
es)
ODA to LDCs from EU in EUR million and as a % of GNI(including imputed multilateral flows - data at 2008 prices)
EU Net ODA to LDCs and imp multi excluding debt EU Net Debt Relief to LDCs Per cent of donor GNISource: OECD DAC
Please note: preliminary 2010 data do not allow to identify debt relief to LDCs. Imputed multilateral flows for 2010 are estimates .
Source: OECD DAC
2.3. Scaling up funding for tackling Climate Change and Biodiversity Challenges
2.3.1. Climate change fast-start finance
EU Commitments
European Council Conclusions on 10/11 December 2009: The EU and its Member States are ready to contribute with fast-start funding of EUR 2.4 billion annually for the years 2010 to 2012.
2.3.1.1. Background
Climate change is a global threat. The EU as a whole is committed to playing a leading role in the fight against global warming in order to keep global average temperature increase below 2 degrees Celsius compared to pre-industrial levels.50 Consequently, the EU is an active participant in the negotiations on climate change under the United Nations Framework Convention on Climate Change (UNFCCC). A key topic of these negotiations is the financing of mitigation and adaptation activities. Developed countries expect developing countries, especially the economically more advanced ones, to contribute to the overall effort to combat climate change. At the same time,
50See http://ec.europa.eu/dgs/clima/mission/index_en.htm for an overview of EU actions on climate change

EN 40 EN
developing countries want to see a clear position from developed countries on finance for climate change related action51. During the Climate Change Conference in Copenhagen in December 2009, developed countries made pledges for short-term as well as long-term climate financing. These commitments were later anchored in the agreements concluded at the Climate Change Conference in Cancún (the ‘Cancún Agreements’) in December 2010. The collective commitment by developed countries is to provide new and additional resources approaching USD 30 billion for the period 2010-2012, with balanced allocation between adaptation and mitigation. Funding for adaptation will be prioritised for the most vulnerable developing countries, such as the Least Developed Countries, Small Island Developing States and Africa. The European Commission and its Member States have pledged to contribute fast-start funding totalling EUR 2.4 billion annually for the years 2010 to 201252. Developed countries also committed to a long-term goal of jointly providing USD 100 billion per year by 2020 to address the needs of developing countries. This funding will come from a variety of sources, public and private, bilateral and multilateral, including alternative sources of finance. This longer term pledge has been made in the context of meaningful mitigation action by the developing countries. The UN Secretary General’s Advisory Group on Climate Finance has concluded that it is feasible to reach the USD 100 billion target, but that it will be a challenging task53. To maintain trust in the international negotiating process, it is vitally important to ensure transparent measurement, reporting and verification (MRV) of these climate finance commitments. This was recognised at the Cancún conference. Developed countries were asked to provide information on the resources they would make available to provide their fast-start commitment and on the ways in which developing countries can access these resources. This information was to be sent to the UNFCCC secretariat for compilation into an information document in May 2011, 2012 and 2013. It was agreed that a Standing Committee should be set up to help ensure that climate change financing is delivered in a more consistent and coordinated manner and to help rationalise the financial mechanism, mobilise financial resources and improve the measurement, reporting and verification of support provided to developing countries. The EU is a strong advocate of transparent reporting. It drew a comprehensive report on the implementation of its fast-start commitments ahead of the Cancún Climate Change Conference, based on a survey of Member States54. The EU also intends to produce further fast-start progress updates for the subsequent UNFCCC Conferences (2011, 2012)55. The EU welcomes initiatives to make climate financing even more transparent56. Monitoring ODA which is related to climate change (and other environmental issues) is a difficult task due to the complexity of the issues and their multidimensional character. To help carry out this task, a system of markers (agreed with Secretariats of each of the Rio Conventions—see Box 2) has been set up within the DAC/CRS 51European Commission, Stepping up international climate finance: A European blueprint for the Copenhagen Deal, COM(2009) 475 final 52European Council Conclusions on 10/11 December 2009 53http://www.un.org/wcm/content/site/climatechange/pages/financeadvisorygroup 54 European Council, EU Fast start finance Report for Cancún, 6 December 2010 55 In its meeting of 7 December 2010, the ECOFIN Council ’invites the Commission to integrate fast start finance reporting into its annual EU accountability and development finance report, with a further end-of-year update for UNFCCC meetings as needed.’ (§4) 56 European Council, EU Fast start finance Report for Cancún, 6 December 2010

EN 41 EN
system. In parallel, other monitoring work is also being carried out, such as the Fast Start Finance initiative (www.faststartfinance.org) sponsored by Denmark, Germany, the Netherlands, the UK and some other countries.
Box 2. The ‘Rio markers’ – monitoring development assistance to address climate change, biodiversity and desertification 57
In 1998 the OECD/DAC added the so called ‘Rio markers’ to the CRS system to enable the identification of aid activities related to the three Rio Conventions signed in 1992: the United Nations Framework Convention on Climate Change (UNFCCC), the Convention on Biological Diversity (CBD) and the United Nations Convention to Combat Desertification (UNCCD). The use of the markers was made compulsory for DAC reporters for aid from 2007 onward. All bilateral aid activities should be screened and marked as having the objectives of each Convention as a ’principal objective’, ’significant objective’ or ’not targeted’. Activities can be marked for more than one convention, so there are overlaps between ODA volumes targeted at the individual conventions.
The original Rio marker on climate change only covers mitigation related activities. For aid data from 2010 onwards, a new marker will be introduced in use that also tracks aid in support of climate change adaptation, in order to give a more complete picture of climate-change-related ODA.
Using the Rio markers is fraught with methodological difficulties. The OECD/DAC points out that the marker data do not produce exact ODA volumes. Rather, they give an indication of the amounts allocated or spent and the extent to which donors address the objectives of the Rio Conventions in their aid programmes.
2.3.1.2. Volume and focus of EU support
EU and its Member States are jointly committed to provide fast-start finance amounting to EUR 7.2 billion in 2010-12. EUR 2.34 billion of this was provided in 2010 (data as of end February 2011). The current austerity requirements on national budgets make it more difficult to mobilise funds. Nevertheless, the EU seems well on track to meet its overall target. Annex 4 provides a detailed breakdown of the commitments. Fast-start finance is part of the wider action on climate financing being taken by the EU and the Member States. Data provided by 10 Member States shows that their non-fast-start climate financing in 2010 was almost three times as large as their fast start-financing commitments that year. The EU uses both multilateral and bilateral channels for deploying its fast-start finance; 56% of commitments are multilateral and 43% bilateral. Multilateral channels include the Climate Investment Funds, the Global Environment Facility, the Adaptation Fund, the Least Developed Countries Fund, the Forest Carbon Partnership Facility, the Regional Development Banks and UN agencies. By channelling funds through existing platforms, initiatives and bilateral structures the EU aims to reach the beneficiaries efficiently and minimise additional administrative complications and the proliferation of new initiatives. Some 82 % of the funds have climate change as a principal objective and 18% as a significant objective. Loans play a large role in EU’s fast-start finance: 55% of the commitments are reported as loans and 45% as grants. Around 35% of the commitments are earmarked for adaptation, 45% for mitigation and 15% for the 'Reducing Emissions from Deforestation and Forest Degradation+'-Initiative (REDD+). Support for adaptation aims to help poor and vulnerable countries adapt to and build resilience to the adverse
57Source: www.oecd.org/dac/stats/rioconventions.

EN 42 EN
effects of climate change. Funding will help developing countries protect their infrastructure, industry and agriculture from changing weather patterns and rising sea levels. It will also support investment in water management, drought-resistant crops and disaster risk reduction, and will help provide better scientific analysis as the basis for decision making and national planning. Support for mitigation aims to speed the transition to a low-carbon global economy and to reduce greenhouse gas emissions by promoting the deployment of clean energy technologies. Funding will, for example, promote and support low-carbon energy, energy efficiency, low-carbon transport and the development of Nationally Appropriate Mitigation Actions. Support for REDD+ aims to cut greenhouse gas emissions by reducing deforestation and forest degradation in developing countries and by enhancing the sustainable management and conservation of forests and carbon stocks. In this context, the EU is seeking to promote synergies between REDD+ governance objectives and the EU Action Plan for Forest Law Enforcement, Governance and Trade (EU FLEGT initiative). Climate issues have become increasingly integrated in broader development strategies (making ODA ‘climate resilient’) so that actions to mitigate and adapt to the negative effects of climate change often support efforts to reach other MDGs and vice versa, e.g. by fostering climate-resilient development and access to clean energy. The EU will continue working to integrate climate change, biodiversity and other global commitments more fully into its development strategies.
2.3.1.3. The global context
The EU has been the largest contributor to mitigation-related ODA since well before the Copenhagen conference. The European Commission and DAC-reporting Member States committed EUR 7.7 billion to aid activities aimed at climate change mitigation between 2007 and 2009. This represented 50% of global reported aid to combat climate change. These activities targeted areas which are closely linked to the objectives of fast-start finance. After Japan, the EU as a whole has pledged the largest amount to fast-start finance (see Table 6). Note, however, that it is impossible to make like-for-like comparisons of fast-start contributions and pledges by different donors, as the metrics used vary as do the definitions of what qualifies as fast-start finance. Japan, for instance, counts other official flows (covering a range of non-ODA funding forms, such as export credits, as part of its fast-start finance.
Table 6 - Pledges to fast-start finance (2010-12) and reported ODA to mitigation 2007-2009
Total pledged fast-start finance 2010-12 (EUR million )
Total ODA to mitigation 2007-2009 (2008, EUR million)
Australia 413 337Canada 292 108Japan 11.278 6.070Norway 752 643Switzerland 101 70US 1 278* n/aEU 7.200 7.580
* = US data is for fiscal year 2010 only Source: www.faststartfinance.org for fast-start finance pledges and OECD/DAC for ODA to mitigation58 .
58 Activities marked with a ‘principal’ or a ‘significant’ objective are included). The ODA data is for the

EN 43 EN
2.3.1.4. Measuring additionality
The European Council has endorsed the principle that climate financing should not undermine the fight against poverty and continued progress towards the MDGs59. The Council has also agreed that, while support for mitigation and adaptation in developing countries will require additional resource mobilisation from a wide range of financial sources, ODA will continue to play a role, particularly in supporting adaptation (including disaster risk reduction), in the most vulnerable and least-developed countries60. Paragraph 95 of the Cancún Agreements states that developed countries will provide ’new and additional resources’ as fast-start finance. It is important for the credibility of the commitments that fast-start climate finance is not replacing other development finance. However no agreed definition exists of what constitutes ‘new and additional’. The general understanding of additionality is that certain financing sources or types of expenditure should not be lower than a pre-defined benchmark or reference level. In the case of climate finance, this concerns in particular the relation of climate finance to official development assistance (ODA), as referred to by the Council. Climate-related financing will normally be reported as ODA as long as the support fulfils the OECD/DAC criteria of ODA. As climate and development finance are mutually reinforcing and the objectives intertwined, trying to separate the two would appear artificial and unproductive. While adaptation projects will, as a rule, show multiple benefits, most mitigation projects will also have developmental benefits (e.g. reducing deforestation or renewable energy projects). Climate-related financing will also come in non-ODA form, e.g. through non-concessional loans or official export credits which do not qualify as ODA and possibly in countries not included in the DAC list of ODA recipients. EU Member States use different definitions of additionality as shown in Figure 8. Some Member States aim for additionality related to climate related funding, while others include climate spending in their efforts to increase ODA. Three Member States define additionality as ODA over and above the UN ODA target of 0.7% of GNI. One Member State states explicitly that fast-start financing is strictly additional to the aid budget and will not be reported as ODA. The most commonly used reference year is 2009, with some Member States using 2010. Some Member States finance climate efforts from outside the ODA budgets or through innovative sources. Some Member States use a combination of the definitions in the graph and some have not yet decided on a definition of additionality. One Member State notes that development cooperation and climate change are so closely linked that it is difficult to distinguish between the two objectives in terms of funding.
European Commission and the 15 Member States which report to the OECD/DAC. No mitigation data was available for Luxembourg or the US which do not report on the Rio markers. No mitigation data was available for the Netherlands for 2009 59European Council Conclusions of 30 October 2009, §23 60Conclusions on Climate Change and Development of the General Affairs and External Relations. Council of 17 November 2009, §15

EN 44 EN
Figure 8 - Definitions of additionality used by EU Member States in reporting fast-start financing in the context of this report
Source: Questionnaire on financing for development61.
At an aggregate EU level, given that the EU pledge was made collectively, the additionality requirement of the Copenhagen Accord should also be applied collectively. Since the EU’s view is that ’traditional’ aid to reduce poverty should not be diverted in order to fund climate change activities, total ODA less climate related ODA would be an appropriate benchmark for gauging to new and additional climate finance, within the context of the specific definitions used by various Member States, as outlined above. This would make it possible to check whether increases in ODA-related climate finance are really additional or whether they encroach on other areas of ODA. To even out annual variations, the ODA part of the benchmark could be defined as the average level of EU ODA budgetary commitments in the period 2007 to 2009, expressed in absolute and real terms. A benchmark level for climate-related ODA is harder to obtain because, as was highlighted above, the current climate change marker only covers mitigation. Data on adaptation will only be available from 2010 onwards. For the years 2010 to 2012 a distinction would ideally need to be made between fast-start finance and other climate-related finance, but there is no way to track fast-start finance within the DAC system. The average EU total ODA for the period 2007 to 2009 in constant 2008 prices is EUR 48.6 billion and the corresponding amount for mitigation-related ODA is EUR 2.5 billion. For the purpose of this illustrative exercise it is assumed that the average total adaptation-related ODA for the period corresponded to the same share – 35% - of total climate-related as the share of adaptation reported for fast-start finance. This would give an estimate of adaptation-related ODA of around EUR 1.4 billion and total climate-related ODA of some EUR 3.9 billion. The benchmark level would be EUR 44.7 billion. By this reasoning, if climate finance is to be additional, the EU’s total ODA excluding climate-related ODA should be higher than this benchmark level in the years 2010-12. Figure 9 illustrates this, using this report’s estimate for the EU’s total ODA in 2010 – namely –EUR 53.5 billion in constant 2008 prices. This is EUR 8.7 billion above the benchmark level, which 61 Based on 26 responses, of which 2 did not reply to the question. The European Commission is included as a ‘Member State’ in the text. Two countries reported using two definitions. The ’Other’ category includes Member States that have not yet decided on a definition of additionality and two Member States that have not reported any definition
9
7
4
8
Additional to climaterelated funding in aspecific reference year
Additional to the level ofODA spending in nominalterms
Additional to a ODAspending target in % ofGNI
Other definition ofadditionality

EN 45 EN
corresponds to the maximum potential volume of climate finance that would be additional without cutting into support to other sectors. This is enough to cover the EUR 2.3 billion in constant 2008 prices dedicated to fast-start finance and a constant level of EUR 3.9 billion of non-fast-start finance for 2010 compared to 2007-2009, which would imply a fairly strict definition of additionality of fast-start finance being in addition to climate finance in previous years. However, the latter can only be verified once the 2010 data on Rio-marked ODA become available.
Figure 9: Calculating the additionality of climate finance – an illustrative example, EUR million in 2008 prices
Average 2007-2009 2010
Fast-start - 2 291
Non fast-start (est) 3 887 3 887
Other ODA 44 713 47 280
30 000
35 000
40 000
45 000
50 000
55 000
Benchmark EUR 44.7 billion
Volume above benchmark
in 2010:EUR 8.7 billion
Total ODA 2010: EUR 53.5 billion
Source: OECD DAC for ODA and mitigation data 2007-2009 for DAC reporting Member States. Financing for development questionnaire for non-reporting Member States and 2010 data. Mitigation data was not available
for Luxembourg or for the Netherlands in 2009.
Consequently, if the EU continues to scale up ODA in 2011 and 2012 towards meeting its aid targets in 2015, the additionality requirement could be met, since the increase in total ODA is likely to exceed any increase in climate-related ODA (both fast-start and non-fast-start finance). This would be in line with the EU commitment that ’climate financing should not undermine or jeopardise the fight against poverty and continued progress towards the Millennium Development Goals’. It should be clear from the above that it is hard to quantify the benchmark because of the unreliability of the data on EU climate finance. Once higher-quality data become available, it will be possible to monitor precisely the additionality of EU fast-start. In particular, the additionality exercise requires more complete data, including data on adaptation financing, and further progress in the methodology and application of the OECD DAC Rio Markers.

EN 46 EN
2.3.2. Biodiversity
EU Commitments
European Council conclusions on the Convention on Biological Diversity (CBD): outcome of and follow-up to the Nagoya biodiversity conference, 20 December 2010: The EU and its Member States have committed themselves to implementing the strategy for resource mobilisation and to substantially increasing resources (financial, human and technical) from all possible sources balanced with the effective implementation of the CBD and its strategic plan. The EU will actively involved in developing baselines for monitoring the implementation of the strategy, and into implementing the COP 10 decision to adopt targets at CBD COP 11, provided that robust baselines have been identified and endorsed and that an effective reporting framework has been adopted.
2.3.2.1. Background
In recent decades unprecedented economic growth and human development have benefited people across the globe. However, these benefits have come at the cost of degraded ecosystems and loss of biodiversity caused by changes in land use, over-exploitation, the spread of invasive species, pollution and climate change. These negative effects are not only of concern because of the important intrinsic value of Nature, but also because they result in a decline of the ‘ecosystem services’ which natural systems provide. These services include producing food, fuel, fibre and medicines, regulating water, air and climate, maintaining soil fertility, storing carbon and recycling nutrients. Any loss of such services could have serious economic and social consequences, as has recently been shown 62. A global strategy to combat biodiversity loss for the coming decade was adopted at the tenth meeting of the Conference of the Parties (COP 10) of the Convention on Biological Diversity (CBD) in Nagoya (Japan) in October 201063. The plan is backed up by a strategy for mobilising resource to help achieve the CBD’s three objectives. This strategy aims to substantially increase international financial flows and domestic funding for biological diversity in order to significantly reduce the current funding gaps and thus help ensure that the Convention is indeed implemented. The EU is working on a biodiversity strategy that will be adopted in 2011 and that follows on from the EU’s previous Biodiversity Action Plan. The new strategy will integrate the EU’s CBD commitments and the EU headline target – which is to the loss of biodiversity and the degradation of ecosystem services in the EU by 2020, and indeed to restore them as far as possible, while stepping up the EU’s contribution to averting global biodiversity loss64. The EU recognises that the link between ecosystems and employment, income and livelihoods in developing countries is even stronger than in developed countries.65 Consequently, the
62Economics of Ecosystems and Biodiversity (TEEB) study, http://www.teebweb.org/ 63The Convention on Biological Diversity entered into force in 1993 and has three main objectives: i) the conservation of biological diversity; ii) the sustainable use of the components of biological diversity; and iii) the fair and equitable sharing of the benefits arising out of the utilisation of genetic resources. The Convention obliges developed countries to provide new and additional financial resources related to the implementation of the Convention (Article 20). 64EU Council Conclusions on Biodiversity: Post-2010 EU and global vision and targets and international ABS regime, 15 March 2010 65EU Council conclusions on Biodiversity: Post-2010 EU and global vision and targets and international ABS regime, 15 March 2010

EN 47 EN
0
200
400
600
800
1000
1200
1400
1600
1800
2007 2008 2009
Principal objective
Significant objective
Commission’s Communication on Policy Coherence for Development states that the EU should ‘enhance funding earmarked for biodiversity and strengthen measures to mainstream biodiversity in development assistance’66. This ambition is carried forward in the EU Development Policy (the European Consensus on Development Cooperation)67 and Neighbourhood Policy68. Indeed, one of the aims of the EU’s Biodiversity Action Plan was to increase the development cooperation funds earmarked for biodiversity while mainstreaming biodiversity more effectively into EU and Member States’ development aid budgets. Biodiversity is thus an integral part of EU’s development cooperation policy and activities. Until now, these activities have been monitored by reporting on the Biodiversity Action Plan. Ahead of the Nagoya meeting the Council asked the European Commission to continue reporting on the amount of funds related to biodiversity conservation and sustainable use69.
2.3.2.2. Volume and focus of EU support
From 2007 to 2009, the EU committed, on average, EUR 1.3 billion per year to biodiversity-related aid.70 The volume increased by more than 50% during this period in real terms; from EUR 1 billion in 2007 to EUR 1.5 billion in 2009 (see Figure 10). In contrast the share of activities which had biodiversity as their principal objective decreased from 36% in 2007 to just 15% in 2009.
Figure 10: EU's biodiversity-related ODA by objective. 2007-2009, commitments, EUR million at
constant 2008 prices
Source: OECD DAC/CRS71. Among EU Member States, Germany, France and Spain were the largest donors, but several other countries also donated substantial amounts during this period (see Table 7). Member States that are not DAC members are also contributing to the effort, as evidenced by the appearance of the Czech Republic, Slovenia and Romania in the table.
66COM (2005) 134 final 67COM (2005) 311 final 68COM (2003) 104 final, COM (2004) 373 final 69EU Council Conclusions on Preparation of the tenth meeting of the Conference of the Parties (COP 10) to the Convention on Biological Diversity (CBD), 14 October 2010 70See the Box on the Rio markers above for an explanation of how this amount is calculated. 71 Luxembourg does not report on the Rio markers. No data for the Netherlands for 2009

EN 48 EN
The EU’s biodiversity-related aid as a share of total EU ODA increased from 2.1% in 2006 to 3.2% in 2009. One major challenge in increasing the share is the low priority often given to biodiversity by partner countries faced with other needs. Moreover, very few Member States have dedicated funds for biodiversity. Exceptions include the UK’s Darwin Initiative and the Swedish International Biodiversity Programme SwedBio72.
Table 7: EU’s biodiversity-related bilateral aid, 2007-2009, commitments, EUR million at constant 2008 prices
2007 2008 2009 Average 2007-2009
Austria 10 22 21 18 Belgium 47 83 92 74 Czech Republic 2 3 2 2 Denmark 71 113 84 89 Finland 35 90 82 69 France 115 154 168 145 Germany 169 197 217 194 Greece 3 3 6 4 Ireland 20 14 75 36 Italy 80 54 45 60 Netherlands 156 170 n/a 163 Portugal 1 1 3 2 Romania 0.05 0.06 0.06 0 Slovenia 1 1 1 1 Spain 67 240 207 171 Sweden 0 10 5 5 United Kingdom 7 12 11 10 European Commission73 207 239 517 321 Total 991 1 406 1 533 1 310
Source: OECD DAC/CRS74. Nearly a third of the EU’s biodiversity-related aid goes to Africa and around one fifth each to America and Asia (see Figure 11). The support is divided between over 140 regions and territories. One fifth of the support has no specific geographical focus.
72Commission Staff Working Document, Consolidated Profile Accompanying Document to the Report from the Commission to the Council and the European Parliament - the 2010 Assessment of Implementing the EU Biodiversity Action Plan, SEC(2010) 1163 final, p. 131, 90 and 94. 73 The European Commission did not consistently use the Rio Marker on biodiversity until 2009. As a consequence, the European Commission data reported to the DAC and presented in the table are currently under review. Preliminary revised volumes are 2007: EUR 75 million, 2008: EUR 151 million, and 2009: EUR 412 million. 74 Luxembourg does not report on the Rio markers and there is no data for the Netherlands for 2009. Activities marked with a ‘principal’ or a ‘significant’ objective are included. Monterrey survey for the Czech Republic, Romania and Slovenia.

EN 49 EN
Figure 11 - EU’s biodiversity-related bilateral aid by geographic area, 2007-2009, percentage share, commitments
30%
20%18%
8%
5%
1%
18%
Africa
America
Asia
North Africa and Middle East
Europé
Pacific
Bilateral, unspecified
Source: OECD DAC/CRS75
In terms of sectors, the EU’s biodiversity-related aid falls primarily within environmental protection, followed by water and sanitation, agriculture and forestry (see Figure 12).
Figure 12: EU’s biodiversity-related bilateral aid by sector, 2007-2009, percentage share, commitments
Environmental protection
37%
Water and sanitation
20%
Agriculture14%
Forestry7%
Other22%
Source: DAC/CRS76
2.3.2.3. The global context
Global ODA for biodiversity rose in 2009 after a small decline in 2008 (see Table 8). In terms of activities reported to the OECD/DAC the increase was 24% in real terms to a total of EUR 3.0
75 see footnotes 73 and 74 76 see footnotes 73 and 74

EN 50 EN
billion in 2009 in constant 2008 prices. The US does not report on the Rio markers and data for the Netherlands are missing for 2009. The annual contribution of each country can be estimated at around EU200 million. The EU contribution corresponds to around half of all biodiversity-related ODA over the period 2007 to 2009.
Table 8: Total biodiversity-related bilateral aid 2007-2009, commitments, EUR million at constant
2008 prices
2007 2008 2009 Average 2007-2009
Australia 43 67 110 73 Canada 43 36 125 68 Norway 53 72 202 109 Japan 1 233 608 787 876 Korea 9 17 29 18 Switzerland 33 19 26 26 US 187 199 205 197 EU 991 1 406 1 533 1 310 Other 2 6 2 4 Total 2 594 2 430 3 019 2 681
Source: OECD DAC/CRS77
The EU and its Member States provide contributions to a number of biodiversity-related conventions: the Convention on Biological Diversity, the Ramsar Convention on Wetlands, the Convention on the Conservation of Migratory Species of Wild Animals, the Convention on International Trade in Endangered Species, the African-Eurasian Migratory Waterbird Agreement and the World Heritage Convention78. In addition, the EU Member States are important contributors to the Global Environment Fund (GEF) and the UNEP Environment Fund. The GEF serves as the financial mechanism for the Convention on Biological Diversity. It has been replenished five times. EU Member States provided EUR 1.096 billion to explain GEF-4, which represented 52% of total contributions79. Preliminary data on the recently-concluded explain GEF-5 shows that, compared to the previous replenishment, EU Member States increased their contributions considerably - by 24% - to EUR 1.357 billion, or 54% of total contributions80. The UNEP Environment Fund will spend around a fifth of its budget on biodiversity-related activities in 2012-2013. EU Member States contributed EUR 43.9 million to the UNEP Fund in 2009 and EUR 39.2 million in 2010, which in both years corresponded to around three quarters of total contributions/pledges81.
77 Luxembourg does not report on the Rio markers and there are no data for the Netherlands for 2009. Activities marked with a ‘principal’ or a ‘significant’ objective are included. Monterrey survey for the Czech Republic, Romania and Slovenia. USAID, Biodiversity Conservation and Forestry Programs Annual Report, October 2010. The United States does not report on the Rio markers. The US data in the table are labelled ‘funding’ in the USAID report 78See SEC(2010) 1163 final for details 79SEC(2010) 1163 final 80GEF Secretariat & World Bank, Summary of Negotiations Fifth Replenishment of the GEF Trust Fund, May 17, 2010, http://www.thegef.org/gef/sites/thegef.org/files/documents/GEF-A.4 7%20Summary%20of%20Negotiations%20of%20the%20Fifth%20Replenishment%20of%20the%20GEF_0.pdf 81http://www.unep.org/rms/en/Financing_of_UNEP/Environment_Fund/index.asp

EN 51 EN
2.4. Increasing international support to Developing Countries through Innovative Financing Sources and Mechanisms
EU Commitments
Conclusions 11 November 2008 (Common EU position for the Doha Financing for Development Conference:
The EU welcomes the success of the pilot phase of implementation of innovative sources of financing and calls for a change of scale in this area. It encourages all donors which have shown their ability to provide stable and predictable resources in a coordinated manner and to participate in existing initiatives in the field of health (air ticket levy/UNITAID, IFFIm/GAVI, AMC). It encourages broad collaboration, which includes the private sector, civil society and the international financial institutions, to experiment with and implement new mechanisms and partnerships allowing an increase in financing for development, including via the carbon market. The EU will study the creation of tools to assist private financing for development, in particular to mobilise savings used for the benefit of developing countries.
European Council (October 29 and 30, 2009)
– agreed on the need to prepare a coordinated strategy for exiting from the broad- based stimulus policies when recovery is secured,
– invited the Commission to examine innovative financing at the global level, with a view to facilitating fiscal exit strategies and fiscal consolidation,
– recognised the need to significantly increase financing to help developing countries implement ambitious climate mitigation and adaptation strategies, without jeopardising the fight against poverty and continued progress towards the MDGs,
– highlighted the role of innovative financing in ensuring predictable flows of financing for sustainable development, especially towards the poorest and most vulnerable countries.
European Council (June 15, 2010)
The EU is seriously considering proposals for innovative financing mechanisms with significant revenue generation potential, with a view to ensuring predictable financing for sustainable development, especially towards the poorest and most vulnerable countries. The EU calls on all parties to significantly step up efforts in this regard, welcomes the ongoing work by the Leading Group on Innovative Financing for Development, and takes note of the ongoing work of the Task Force on International Financial Transactions for Development and of the Task Force on Innovative Financing for Education.
Innovative financing mechanisms have been under discussion and trial for some years in order to address financing needs for development. Innovative sources of financing could play a more prominent role in the near future, not least because of the difficulties of many donor countries in meeting their ODA commitments in the medium term. Development budgets are coming under increasing pressure, in particular because of the difficult situation of public finances in many donor countries as a consequence of the crisis. The reference here is to innovative sources of development finance, and it is therefore not confined to ways to increase official development assistance (ODA).

EN 52 EN
The recent Commission Communication "Taxation of the Financial Sector"82 mentions arguments for a fair and substantial contribution, by the financial sector, to address many and varied key challenges for the EU, including "commitments towards developing countries and to combat climate change and global resource scarcity." The Commission is currently conducting an impact assessment on new financial sector taxes; the impact assessment is expected to be published before the summer 2011. Depending on the findings of the impact assessment and on concrete Commission proposals revenues from such taxes could possibly be used to also respond to global and European challenges, such as development and the achievement of the MDGs and other internationally agreed development objectives, as well as efforts to tackle climate change. In its Staff Working Paper "Innovative financing at a global level"83, the European Commission provided an assessment of the various instruments of innovative financing relating to the financial sector, climate change and development on the basis of a number of criteria (see Box 3 below).
Box 3. Review of Innovative financing instruments
Air ticket levy. UNITAID is a drug purchasing facility aimed at combating the major pandemic diseases affecting the developing world. UNITAID buys the necessary drugs and diagnostics and negotiates significant reductions in the prices of pharmaceutical firms. Almost half of the available funding comes from a solidarity contribution levied on air tickets. This is already applied in 11 countries and it has enabled France for example to generate an extra EUR 160 million in conventional aid.
International Financing Facility. The International Finance Facility for Immunisation (IFFIm) exists to rapidly accelerate the availability and predictability of funds for immunisation. The funds raised by IFFIm are used by the GAVI Alliance, a public-private partnership which aims to reduce the number of vaccine-preventable deaths and illness among children under five. So far IFFIm has raised more than USD3 billion for the GAVI Alliance’s immunisation programmes. IFFIm's financial base consists of legally binding grants from its sovereign sponsors. By signing the grant agreements, these countries have agreed to pay these obligations in a specified schedule of payments over 20 years.
Advance Market Commitments (AMCs) for vaccines aim to encourage the development and production of affordable vaccines tailored to the needs of developing countries. Through a forward-looking binding contract from donors and international agencies guaranteeing a viable market for target vaccines, AMCs encourage vaccine makers to develop or build manufacturing capacity for urgently needed vaccines. The binding contract guarantees a pre-agreed price for the first doses of vaccines sold to developing countries, so that companies can re-coup their investment costs. In exchange, participating companies must guarantee to supply vaccines for the long term at a pre-agreed sustainably low price that developing countries can afford. In the AMC pneumococcal pilot, the governments of Italy, the United Kingdom, Canada, Russia, and Norway and the Bill & Melinda Gates Foundation have committed USD1.5 billion, with GAVI promising to allocate USD1.3 billion through 2015. In March 2010, GlaxoSmithKline (GSK) and Pfizer Inc. became the first two companies to make long-term commitments to supply new vaccines for the Pneumo AMC. The two participating firms committed to supply 30 million doses each per year for a 10 year period. These doses will be sold at USD3.50 each rather than at the current price in industrialised countries of USD70 per dose.
EU ETS Auction Revenues. Some Member States used the EU Emissions Trading System (EU ETS) auctioning revenues for development. According to Commission estimates, ETS auction revenues could reach EUR 50 billion annually by 2020. The total revenues Germany raised, for example, were EUR 528 million in 2009 and EUR 560 million in 2010, of which EUR 230 million were reported as ODA. The Federal Ministry for the Environment, Nature Conservation and Nuclear Safety (BMU) coordinates its activities with the Federal Ministry for Economic Cooperation and Development (BMZ). BMZ’s programmes are fully integrated with existing development cooperation.
82COM52010)549 of7.10.2010 83 SEC(2010)409 of 1.4.2010

EN 53 EN
National Lotteries. The Belgian Survival Fund (BSF), financed with proceeds from the national lottery, was created in 1983 by the Belgian Government in response to drought and famine in sub-Saharan Africa. The following year, BSF and IFAD formed a partnership to pursue a common goal; helping poor people in rural areas overcome poverty and improve food security. Joint Programme (JP) interventions target the most vulnerable populations in the most fragile parts of Africa. From January 2010 the BSF will be renamed the Belgian Fund for Food Security (BFFS) to better reflect its food security agenda. The International Communities programme is the UK Big Lottery Fund’s way of helping disadvantaged communities overseas. It will have a budget of up to £80 million between 2010 and 2015.
Depending on the mechanism, at most six Member States raised funds via innovative mechanisms in 2010. The use of the IFFIm was most common (France, Netherlands, Italy, Sweden, Spain and United Kingdom) , followed by AMC (United Kingdom and Italy) and Debt2Health (Germany only). Austria and Germany have introduced air ticket levies, but the funds raised are not earmarked for development cooperation. The United Kingdom also supports the Private Infrastructure Development Group (PIDG) governed by a donor council with members from 8 donors, and utilises innovative facilities to address market failures preventing private investment in infrastructure in developing countries. Social and environmental safeguards conform to World Bank standards. A new tax on international financial transactions (FTT or Tobin tax) is supported by several Member States. In a report released in April 2010, the IMF proposed instead a levy on the balance sheets of all financial institutions and a "financial activities tax" on pay and profits, rather than a tax on international transactions. The IMF concluded that “there may indeed be a case to supplement a levy of the kind described above with some other form of taxation, but an FTT does not appear well suited to the specific purposes set out in the mandate from G-20 leaders84.” Some Member States such as Belgium, France and Spain support the introduction of an FTT at EU level or worldwide. The recent Commission Communication on "Taxation of the Financial Sector"85 established a clear link between a number of key challenges for the EU (including "commitments towards developing countries and to combat climate change and global resource scarcity") and the "fair and substantial contribution" of the financial sector "to address the above challenges". The Commission is currently conducting an impact assessment on new financial sector taxes which is due to be published in 2011. Revenues from such taxes could potentially, as part of the national or EU budgets, or through some form of earmarking to international funds, be used to respond to global and European challenges, such as development and the achievement of the MDGs, as well as efforts to tackle climate change.
84IMF (2010) - Financial Sector Taxation. The IMF’s Report to the G-20 and Background Material. p. 17 85See http://ec.europa.eu/taxation_customs/resources/documents/taxation/com_2010_0549_en.pdf See http://ec.europa.eu/taxation_customs/resources/documents/taxation/com_2010_0549_en.pdf

EN 54 EN
Table 9 - EU Innovative Sources for Development Cooperation (EUR million, 2007-2009)
Mechanism & Instrument 2007 2008 2009 Average EU Member States
Solidarity 300 289 255 281
National Lottery 133 114 90 112 Belgium, UK
New Taxes 167 175 165 169
of which Adaptation Fund 2 2 3 2
of which Airline Levy 165 173 162 167 France
Catalytic - - 76 25
Advanced Market Commitment (AMC) - - 76 25 Italy, UK
Leveraged - 223 1,102 442
Frontloading of ODA (e.g. IFFIm bonds issued)
- 223 1,102 442 France, Italy, The Netherlands, Spain, Sweden, UK,
Total 300 512 1,433 748
Sources: Annual Reports for Lotteries, UNTAID for Airline Levy, UNFCC for Adaptation Fund, GAVI for AMC and IFFIm, OECD DAC for EU philanthropy
Only nine Member States are planning to step up support for innovative financing mechanisms with significant revenue generation potential aimed at ensuring predictable financing for sustainable development. For example, Germany is setting up a new special fund under public law (Sondervermögen “Energie- und Klimafonds”) to finance national and international programmes in the fields of energy efficiency, renewable energies and climate change. The fund will be in operation from 2011 onwards, with a small amount of funding available from contractually agreed payments by energy utilities. From 2013 onwards additional revenues from auctioning EU emissions allowances (compared to the 2008 level of EUR 915 million; excluding emissions trading in the aviation sector) will be channelled to the special fund. It is expected that several hundred million euro of climate and environment related ODA will be committed annually through this fund from 2013 onwards, subject to parliamentary budget approval. EUR 31.5 million will be committed as climate and environment related ODA from this fund in 2011. As shown in Table 9 above, amounts raised from innovative sources for development cooperation from EU Member States have been increasing over the period 2007-2009. National lotteries in Belgium and the United Kingdom have been used to fund development programmes, while the air ticket levy has contributed to the fight against HIV/AIDS through UNITAIDS and the 2% levy of the "Certified Emission Reductions" (CERs) issued in respect of each project under the Clean Development Mechanism (CDM) has raised about EUR 7 million for climate change adaptation. Overall, these innovative sources have had a limited impact, equivalent to just 3% of EU-15 ODA in 2009. However, catalytic (AMC) and leveraged (IFFIm) tools are now starting to produce flows for the benefit of developing countries. Flows included in the table are funds raised on international bond markets. The interest and principal on these bonds will need to be paid and donor contributions counted as ODA as the bonds are redeemed. Although small, these innovative sources represent an important option in a period of hard-pressed aid budgets. However, they also raise legitimate issues in terms of additionality and earmarking of aid funds, coupled with ring-fencing of specific tax revenues. EU philanthropy and private donations to developing countries have existed for many years and therefore can hardly be considered innovative. Although smaller than in North America, they amount to about EUR 2.5 billion per year over the period 2007-2009 according to OECD/DAC statistics. These private flows are often supported by EU Member States through tax discounts that

EN 55 EN
are not considered as ODA, as they are not flows from the official sector, but nevertheless help to increase resources available to developing countries.
2.5. Leveraging Private Flows
EU Commitments
●Conclusions 11 November 2008 (Common EU position for the Doha Financing for Development Conference)§10: “The EU is committed to promote policies and instruments supporting private investment and the expansion of partner countries' private sector in support of an inclusive and sustainable economic growth. The EU also recalls the positive impact and importance of migrants’ remittances.”
§ 27: "The EU recognises the development impact of remittances in migrants’ countries of origin. It encourages all countries the need for an enabling environment, the EU encourages the promotion of financial sector development in countries of origin. It commits to adopt “General Principles for International Remittances Services" agreed by the Committee on Payments and Settlements Systems (CPSS) and operational definitions and recommendations allowing the improvement of data on remittances and calls for all countries to do the same. The EU also encourages partner countries to reduce the cost and improve the safety of transfers, and to support the migrants’ initiatives with a view to reinforce the impact of remittances on economic and social development. Underlining, in this regard, to address gender equality and empowerment of women to reinforce the impact of remittances on development".
●Council Conclusions of 18 May 2009 (support to developing countries in coping with the crisis) § 11: “The Council expresses concern about the negative impact of the crisis on remittance flows. Bearing in mind their importance for development, the EU will further work towards enhancing the impact of remittances on development, including through the reduction of transaction costs. In this regard, the Council welcomes the work in progress in international fora, including inter alia the G8 Global Remittances Working Group, chaired by the World Bank, and work towards the establishment of an African Remittances Institute.”
Council Conclusions of 18 November 2009 on Policy Coherence for Development §10: "to promote transparent, cheaper, faster and more secure flows of remittances to migrants' countries of origin, and to ensure that relevant legislation does not contain provisions hampering the effective use of legal remittance channels.”
In 2009, the Council emphasised the importance of mobilising all possible sources of financing for development, including export credits, investment guarantees and technology transfers, as instruments to leverage assistance aimed at stimulating inclusive growth, investment, trade and job creation. The quality of information on this type of financing is important in order to ensure global accountability and to better grasp the development impact of different financial sources and flows. This requires a comprehensive overview of as many development-relevant financial flows as possible and from as many donors as possible. Some of these non-ODA flows are, in principle, tracked under the established OECD/DAC reporting system, which needs to be developed further. Not all EU Member States have a reliable system in place yet to monitor such flows. Improving data on the different flows is, however, essential to enable better use of ODA to leverage more, and complementary, flows for development.

EN 56 EN
In July 2009, at the L´Aquila summit, the G8 Heads of States endorsed the '5x5' objective and pledged “to achieve in particular the objective of a reduction of the global average costs of transferring remittances from the present 10% to 5% in five years through enhanced information, transparency, competition and cooperation with partners.”
2.5.1. Private Capital Flows
Foreign Direct Investment. The economies of many developing countries suffer from a general shortage of capital, especially foreign direct investment (FDI). To increase foreign investment and prevent the flight of domestic private capital, many developing countries are working to provide companies with transparent and simple regulatory and fiscal frameworks, expanded access to finance, business development services, technology and innovation – in short creating a favourable business climate. The majority of Member States reported that they support private flows through investment guarantees, dedicated funds, preferential loans and support for joint ventures in developing countries in sectors that have high returns in terms of development, often through bilateral agreements. Some Member States and the Commission also have special programmes to promote microfinance. Germany, for example, supports the Regional Micro Small and Medium Enterprises Investment Fund for Sub-Saharan Africa (REGMIFA). REGMIFA is promoted by a donor consortium composed of leading Donors/DFIs (including, inter alia, France, Germany, Netherlands, and Spain) and IFIs, and led by the German Financial Cooperation (KfW). It aims to enhance long and medium-term financial needs of local financial intermediaries providing funding to Micro, Small and Medium Enterprises (MSMEs) in Sub-Saharan Africa. Dedicated institutions in Member States, such as national development agencies and development finance institutions, are in charge of specific tools and projects. For example, the Belgian Investment Company for Developing Countries (BIO), which was created in 2001 by the Belgian State and Belgian Corporation for International Investment (BMI/SBI), aims to promote a strong private sector in developing countries and/or emerging economies so that these can accomplish sustainable development, promote social welfare and decrease poverty. BIO supports the local private sector directly (loans, equity stakes, guarantees for local micro, small and medium enterprises) and indirectly through intermediary financial institutions (banks, non-banking financial institutions, investment companies/funds aimed at SMEs and microfinance institutions or MFIs). BIO also provides grants for feasibility studies and technical assistance to local enterprises and intermediary financial institutions. Several Member States also contribute to initiatives led by the international financial institutions that provide capital, guarantees, and various forms of finance and risk management tools to the private sector. To invigorate the business and investment climate in South Eastern Europe the Austrian Development Agency (ADA) strongly supports the World Bank initiative “The Road to Europe: Program of Accounting Reform and Institutional Strengthening (REPARIS)”. This is a regional programme aimed at creating a transparent policy environment and an effective institutional framework for corporate reporting. The programme is designed around the introduction, implementation and effective enforcement of relevant portions of the EU acquis to southern-eastern European countries in order to contribute to foreign direct and portfolio investment, foster private and financial sector developments, improve the business environment and investment climate, and facilitate potential integration into (or harmonisation with) the European

EN 57 EN
Union. Denmark, in cooperation with AfDB and Spain, is working on establishing an African Guarantee Fund in order to enable MSME’s to gain greater access to financial services. The EU promotes foreign and domestic investments through its support for the private sector in developing countries. The vast majority of support is provided through national support programmes, the remainder being through regional programmes (including All ACP programmes). In the same framework, the European Investment Bank (EIB) is entrusted with the management of the Investment Facility (IF) provided from the EU Member States' budgets via the European Development Fund (EDF). The IF, alongside the EIB own resources, meets the financing needs of investment projects in the ACP region with a broad range of loans and flexible risk-bearing instruments. In line with the objectives set out by the EU Policy and by the international community in the United Nations (UN) Millennium Development Goals (MDGs), the EIB’s overriding aim is to support projects that deliver sustainable economic, social and environmental benefits through: supporting responsible private and public investments; fostering regional cooperation and integration; mobilising domestic savings and acting as a catalyst for foreign direct investment; encouraging the broadening, deepening and strengthening of the local financial sector; and relying on/promoting partnerships. The European Commission encourages blending mechanisms, in which grants are added to loans as a way of achieving a number of objectives, including the need to increase the volume of private and public development finance in a context of restricted resources. In order to support the EU policy, regional strategy and partnership in the targeted region and countries, the European Commission has set up five regional blending facilities: the Neighbourhood Investment Facility (NIF); the Western Balkans Investment Framework (WBIF); the EU–Africa Infrastructure Trust Fund (ITF); the Latin America Investment Facility (LAIF) and the Investment Facility for Central Asia (IFCA). The potential range of instruments includes: technical assistance (TA); feasibility studies; investment co-financing; equity participation; risk-capital; interest rate subsidies; on-lending; guarantees; insurance subsidies; and incentive payments. TA/feasibility studies and interest rate subsidies provide for the largest number of projects. The facilities cover similar broadly defined, sectors, i.e. transport, energy, social, environment and finance for SMEs. Partners in the beneficiary country can be public, private or mixed, with public partners dominating the current projects aside from SME support. Alongside the regional frameworks, the European Commission plays an active role in the sector approach, mainly in cooperation with Member States. An interesting example of this is provided by the Global Energy Efficiency and Renewable Energy Fund (GEEREF), an innovative Fund-of-Funds, providing global risk capital through private investment for energy efficiency and renewable energy projects in developing countries and economies in transition. Launched in 2004, GEEREF aims to accelerate the transfer, development, use and enforcement of environmentally sound technologies for the world's poorer regions, helping to bring secure, clean and affordable energy to local people. GEEREF was initiated by the Directorate General for Environment and the Directorate General for Development Co-operation (DEVCO) of the European Commission. It is sponsored by the European Union, Germany and Norway and advised by the European Investment Bank Group. It has secured funding for a total of EUR 108 million and is considered as an ODA by DAC. According to Eurostat86, net FDI from the EU27 to developing countries peaked in 2007 and has been declining since then, as shown in Figure 13 below. 86 Eurostat is the statistical office of the European Union situated in Luxembourg. Its task is to provide the European Union with statistics at European level that enable comparisons between countries and regions

EN 58 EN
Figure 13 – Net FDI Flows from EU to Developing Countries (EUR billions, current prices)
2005 2006 2007 2008 2009
FDI to Developing Countries 48 84 204 130 100
-
50
100
150
200
250
BIlli
ons
of E
uros
(cu
rren
t pr
ices
)
FDI from EU27 to Developing Countries
Source: Eurostat
Corporate Social Responsibility refers to the voluntary inclusion of social and environmental concerns, beyond the minimum legal requirements, in companies' business operations to address societal needs. It has become an increasingly important concept and is part of the debate about globalisation, climate change, competitiveness and sustainability. CSR practices are not a substitute for public policy, but they can contribute to a number of public policy objectives in developing countries, especially in relation to labour markets, labour standards, skills development, more rational use of natural resources and overall poverty reduction. In Europe, the promotion of CSR reflects the need to promote common values and increase the sense of solidarity and cohesion. In order to promote awareness and the adoption of CSR principles by companies operating in developing countries the Commission is supporting several projects totalling approximately EUR 50 million in the period 2004 – 2010. The Commission regularly consults its High-Level Group of Member States representatives and its European Multi-Stakeholder Forum on the international aspects of CSR policies. The vast majority of Member States undertake national action to promote CSR principles and 15 of them report that they advocate the adoption of internationally agreed principles and standards on corporate social and environmental responsibility by European companies. Most of them strongly support multilateral initiatives such as: • The OECD Declaration on International Investment and Multinational Enterprises which
promotes voluntary standards of responsible business conduct within the framework of the OECD Guidelines for Multinational Enterprises. These guidelines are currently undergoing a review which is likely to be completed in May 2011. Twenty-three EU Member States and the Commission have created National Contact Points on the implementation of the guidelines.
• The UN Global Compact, which is a voluntary corporate citizenship initiative for companies committed to supporting and enacting a set of 10 core values in the areas of human rights, labour, the environment and combating corruption. Global Compact Local Networks have been established in 20 EU Member States.

EN 59 EN
• The International Labour Organization (ILO) Conventions and recommendations on labour standards.
• the IFC’s "Performance Standards on Environment and Social Sustainability".
• European Development Finance Institution (EDFI) “Principles for Responsible Financing”.
• the Global Reporting Initiative (GRI).
• the Principles of Responsible Investment (PRI).
• the mandate of the Special Representative of the UN Secretary-General on business and human rights, Professor John Ruggie.
• the OECD initiative concerning a “Due Diligence Guidance for Responsible Supply Chains of Minerals from Conflict-Affected and High-Risk Areas”.
• OECD Convention on combating bribery of foreign public officials.
• FAO Code of Conduct for Responsible Fisheries.
• Realising Rights: the Ethical Globalisation Initiative (EGI) spearheaded by Mary Robinson. CSR is one of the core activities of EGI with a focus on a few countries (e.g. Liberia and Ghana) in Sub-Saharan Africa.
There are a variety of other activities supported by a few Member States. The Austrian Development Agency (ADA) offers Business Partnerships to Austrian/European companies on a co-financing basis. One typical example is the hepatitis vaccination programme of the OMV, the leading Austrian oil and gas corporation. The project, implemented in Pakistan, focuses on vaccination and medical education and is part of a comprehensive development programme which includes water and infrastructure. Another example is the business partnership with five European carpet retailers and the STEP foundation. It focuses on the elaboration of common CSR-standards for the entire value chain in carpet manufacturing in Nepal and Pakistan. The German Government has defined its own CSR Strategy and brought forward a CSR Action Plan that builds on broad consultation with stakeholders. The international and development policy perspective is included in the national CSR Strategy. Development Partnerships with business companies (develoPPP.de). Since 1999, the Federal Ministry for Economic Cooperation and Development has supported more than 1,200 projects with an amount of approx. EUR 500 million. The majority of these projects contain CSR components. Denmark’s Innovative Partnerships for Development (IPD) Programme sets out to promote better working and living conditions for employees, their families, the community and society at large by advancing strategic CSR and socially responsible innovation. The UK Government is a strong supporter of responsible business behaviour. The UK promotes adherence to the OECD Guidelines on Multinational Enterprises, which set recommendations for good corporate behaviour. NGOs and trades unions can lodge, and have lodged, complaints against companies for breaching the Guidelines. Under the OECD mechanism the UK government investigates the complaints and produces a conclusion, with recommendations for improvement if necessary.

EN 60 EN
Social and environmental considerations in public procurement rules. The EU public procurement Directives87 allow contracting authorities to take into account environmental and social considerations at all stages of the procurement procedure. The prerequisite is that these considerations are linked to the subject matter of the contract or to the execution of the contract, if they are addressed in the contract performance clauses, and comply with the fundamental principles of the Treaty on the Functioning of the EU (transparency, non-discrimination) and with relevant EU law. EU Member States may introduce more specific rules in their national legislation, in order to further promote the inclusion of social and environmental considerations in public procurement, provided such national rules are in line with the public procurement Directives and all relevant EU law. Also, on 28/01/2011 the Commission published a guide to taking account of social considerations in public procurement88. A number of Member States reported substantial reforms of their rules in 2010. The Ministry for Foreign Affairs of Finland is defining a new case management process. This is an overall process which has been ongoing since 2009 and is based on updating manuals and templates. A new initiative during 2010 has been the consistent addition of social and environmental clauses into terms of reference templates. These new templates and interlinked manuals are being put into use, even though the case management process software is not yet usable. In 2010 the government of the Netherlands started to implement its new policy on sustainable public procurement. From January 2010 environmental criteria have been applied and from 2011 onwards social criteria will also be applied. Public procurement is used to pursue various policy objectives, including development objectives. The government links its public procurement policy to economic diplomacy, activities of multilateral organisations (e.g. ILO) and supply chain initiatives (e.g. the Dutch Sustainable Trade Initiative and ‘fair trade municipalities’). The government has chosen to apply fundamental labour standards and human rights on a generic basis (i.e. in a uniform manner in all public procurement). The development aim is to bring about improvements in the entire supply chain (a process-oriented approach). For a limited number of products, for which community-supported supply chain initiatives exist, supplementary standards apply. These standards relate to living wages/income (or fair trade), working hours, and occupational health and safety. The system is designed to be as simple as possible for both contracting parties and suppliers, and to be consistent with actual practice. It only applies to large contracts (above EUR 133,000 for goods and services). Companies will be held accountable for the way they fulfil their supply chain responsibilities with regard to the product, work or service they deliver.
2.5.2. Remittances
Remittances sent by migrants to their countries of origin, private by nature, are essential to improving the livelihoods of millions of people and for some countries are more significant in volume terms than ODA.
87Directive 2004/17/EC of 31 March 2004 coordinating the procurement procedures of entities operating in the water, energy, transport and postal services sectors (OJ L 134, 30.4.2004) and Directive 2004/18/EC of 31 March 2004 on the coordination of procedures for the award of public works contracts, public supply contracts and public service contracts (OJ L 134, 30.4.2004). 88See http://ec.europa.eu/social/BlobServlet?docId=6457&langId=en

EN 61 EN
According to a recent Eurostat publication89, the total number of non-nationals (i.e. persons who are not citizens of their country of residence) living on the territory of the EU Member States on 1 January 2009 was 31.9 million, representing 6.4% of the total EU population. More than one third of them (11.9 million) were citizens of another Member State. Among the non-EU foreign population living in the EU in 2009, 48.2% are citizens of a High Human Development Index (HDI) country (with Turkey, Albania and Russia accounting for almost half); 44.4% are citizens of a Medium HDI country (one fifth of whom are citizens of Morocco, followed by nationals of China and Ukraine); only 7.4% of the non-EU foreign population living the EU are from developing countries with a lower HDI (30% of whom have Nigerian or Iraqi citizenship). With regard to migration flows in 2008, another recent Eurostat publication90 indicated that in 2008 EU Member States received a total of 3.8 million immigrants and at least 2.3 million emigrants are reported to have left one of the EU Member States. Compared with 2007, immigration to EU Member States is estimated to have decreased by 6 % and emigration to have increased by 13 %. The scale and patterns of immigration differ from one Member State to another. It is estimated that more than a half (55%) of immigrants to the EU in 2008 previously resided outside the EU, while 44% of immigrants had previously also lived in one of the EU Member States (other than the country of immigration). The impact of the economic crisis on migration employment, migrant stocks and flows is not easy to assess, but it is generally acknowledged that migrants are often more affected by the economic downturn either because they work in sectors that are more affected by the crisis, such as tourism or construction, or because of their particular vulnerability.
According to World Bank data, global remittance flows to developing countries grew from 2007 (EUR 203 billion) to 2008 (EUR 220 billion). Remittance flows started to decrease in the last quarter of 2008. For 2009 global remittances to developing countries remained stable at EUR 220 billion. In 2010 the growth in remittances is expected to have resumed and attained EUR 245 billion-91
Worker remittances are defined by the World Bank as the sum of three components: (a) workers’ remittances recorded under the heading “current transfers” in the current account of the balance of payments; (b) compensation of employees which includes wages, salaries, and other benefits of border, seasonal, and other non-resident workers (such as local staff of embassies) and which are recorded under the “income” subcategory of the current account; and (c) migrants’ transfers which are reported under “capital transfers” in the capital account of the IMF’s Balance of Payments Yearbook.
Data on remittance flows are not always reliable, as a large proportion of remittances are not recorded in official statistics. The World Bank estimated that immigrants sent about USD440 billion of remittances and worker compensations to their countries of origin in 2010. Of these, USD325 billion were sent to developing countries, although only USD22 billion went to low income countries, compared to about USD56 billion of ODA in 2009. The relative importance of remittances in terms of volume is therefore sometimes exaggerated in the case of low income countries.
89Eurostat, Statistics in Focus, 45/10. 90Eurostat, Statistics in Focus, 1/11. 91World Bank Migration and Remittances (Excel files attached to Outlook for Remittance Flows 2011-12: Recovery
after the crisis, but risks lie ahead) data as of November 2010 converted into Euro using Eurostat’s Euro/ECU exchange rates - Annual data.

EN 62 EN
According to WB statistics, remittances from EU Member States to all countries (developed and developing) grew steadily between 2004 and 2008 and then declined in 200992. Available data point to a further slight decline in 2010.
Figure 14 – Remittances from EU Member States to All Countries
Source: World Bank - World Development Indicators
According to Eurostat most remittances from EU Member States registered in their Balance of Payments statistics93 are sent to developing countries. Of the EUR 30.3 billion of remittances reported in official statistics for 2009, EUR 8.3 billion were intra-EU and EUR 22 billion extra-EU. EUR 19 billion were sent to developing countries94.
2.5.2.1. Donor Initiatives
In recent years the importance of remittances has been recognised, and several international initiatives propose concrete measures to measure them more accurately, assess their impact in country specific contexts, lower transfer costs, make them safer and faster, formalise them and leverage their impact on development by developing incentives for investment.
92World Bank’s World Development Indicators. 93Data on remittance flows are often underestimated due to the use of informal remittance channels, irregular migration, and ambiguity in the definition of migrants (foreign born versus foreigner, seasonal versus permanent). The quality of data is also affected by lack of adherence to IMF guidelines on BOP statistics by some countries and differences between host and recipient countries’ records. 94http://appsso.eurostat.ec.europa.eu/nui/show.do?dataset=bop_remit&lang=en

EN 63 EN
Box 4. Summary of main international initiatives
Guidelines for the compilation of data on remittances have been drafted by the 'Luxembourg Group'95 the 'General Principles for International Remittances Services' and the recent G8 initiative of a 'Global Remittances Working Group' coordinated by the World Bank. The G20 Summit in Seoul of November 2010 recognised the importance of facilitating international remittance flows and enhancing their efficiency to increase their contribution to growth with resilience and poverty reduction, and committed to support the above initiatives towards a reduction of the global average cost of transferring remittances.
On a number of occasions (see above) the EU has undertaken to make remittances cheaper, faster and more secure and to maximise their development impact. Some EU Member States follow a multi-pronged approach to foster remittances. The Netherlands is a good example, focusing on creating favourable conditions to reinforce the positive link between remittances and development through its own policies on remittances. The Netherlands contributes to the development of the financial sector in countries of origin. The aim is to achieve a more sustainable development impact of remittances. Lastly, the Netherlands aims to increase the poverty alleviation effect of money transfers by promoting small-scale initiatives by migrants.
2.5.2.2. Improving data on remittances
Eurostat has started regular collection of data on remittances flows from each EU Member State and third countries. This information is regularly updated (most recently in December 2010). Generally, Member States still combine different data compilation methods for remittances, as these flows are difficult to capture. In the past, the ITRS (International Transactions Reporting System, a data collection system based on data from banks and enterprises on individual transactions) was the main source for data compilation, but direct reporting by Money Transfers Operators, surveys and administrative data have also gained in significance in the meantime. The main reference for data compilers is the IMF's manual "International Transactions in Remittances": Guide for Compilers and Users", which was prepared by members of the Luxembourg Group and which are already applied by a number of Member States. At present more precise data on remittances are transmitted to Eurostat only on a voluntary basis - only data for Total World, Intra/Extra EU and Intra/Extra Euro Area are mandatory for Quarterly Balance of Payments reporting. The ECB also publishes data on workers' remittances for the euro area. In response to the increasing demand for data on remittances, Eurostat launched a new annual survey in 2009, in which it asked Member States to provide statistics on remittances and compensation of employees, collected as part of balance of payments statistics. According to the responses to the Commission's annual questionnaire on financing for development, 14 Member States have no robust and reliable data concerning the amounts and destination of remittances from their country, such as ad-hoc surveys, while 12 Member States said their data are robust. Twelve Member States have not adopted and do not intend to adopt the operational definitions, recommendations and best practices on improving the quality and coverage of data on remittances according to the compilation guide drafted by the "Luxembourg Group".
95The Luxembourg Group was created as an informal working group of practitioners to consider the difficulties of collecting and compiling remittance data. The objective of the Group is to make recommendations for improvements that should lead to the production of a compilation guide for remittance statistics. Jointly with Eurostat and the World Bank, the IMF planned the first meeting of the Luxembourg Group (and constituted its secretariat) which was held in June 2006 with participation from 16 countries.

EN 64 EN
2.5.2.3. Favouring cheaper, faster and more secure flows of remittances
According to the World Bank’s Remittance Prices Worldwide, the cost of sending remittances from the EU, measured for a USD200 transfer, has been falling steadily since 2008 in France, Italy and the United Kingdom, while remaining above the general averages in Germany. The United Kingdom and Italy have an average total cost below the overall average (8.89 percent). As shown in Table 10 below, costs declined in France and Italy and increased in Germany. However, the average cost is still higher than the 5% target by 2014 set at the L’Aquila G8 Summit. The EU has not developed its own monitoring system.
Table 10 - Average Cost to transfer USD200 for EU G8 Countries (%)
Country 2008 Q1 2009 Q3 2009 Q1 2010 Q3 2010
France 10.92 11.50 11.15 10.01 8.95 Germany 14.07 13.53 12.71 11.85 12.67 Italy 10.03 7.36 8.21 8.11 7.87 United Kingdom 10.26 10.27 9.05 8.29 8.07 G8 Average 10.26 10.32 8.80 8.37 8.40 Global Average 9.81 9.67 9.40 8.72 8.89
Source: World Bank
Banks remain more expensive than Money Transfer Operators (MTOs) and the differing importance of each channel in EU Member States may explain price variations across countries, as banks dominate the money transfer market in France or Germany, for example, while MTOs are relatively more important in the United Kingdom. Some Member States - including France, Germany, Italy, the Netherlands, and the United Kingdom - have set up remittance price comparison websites. The German government has set up a remittance price comparison website (www.geldtransfair.de). This was done in cooperation with the Frankfurt School of Finance and Management, who now own the ongoing project. The objective is the reduction of transfer costs for formal remittances from migrants living in Germany to their countries of origin. In 2009 Italy launched the “Rome Road Map for Remittances” at an International Conference. A dedicated website on the costs of remittances has been elaborated by stakeholders and co-funded by the Ministry of Foreign Affairs and has operated since 2009 (www.mandasoldiacasa.it); it has been the first such website certified by the World Bank as being compliant with current applicable standards. The Netherlands supports a remittances comparison website (www.geldnaarhuis.nl). This website provides information in eight languages on money transfer costs charged by banks and money transfer offices.
2.5.2.4. Policy environment
Substantial progress has been achieved in the form of the adoption of the Payment Services Directive (PSD) in November 2007, which lays the legal foundation for an EU-wide single market for payments, although it applies to intra-EU money transfers only. Fourteen Member States have gone beyond the requirements of the Directive to cover transfers between operators when one of them is outside the EU or when the transaction is made in currencies other than those existing in the EU. Fully implemented in the EU Member States since November 2009 - with the exception of Poland which is expected to adopt it in 2011 - it allows for a new category of non bank service provider, namely the "Payment institutions", i.e. money transfer operators or telecom providers for their pre-paid activities, which are now recognised as a separate payment service provider and subject to specific authorisation. They have to comply with appropriate prudential and regulatory requirements harmonised throughout the EU/EEE. This directive has resulted in increasing

EN 65 EN
competition, with 131 new licences obtained in EU Member States in October 2010, most of them in the United Kingdom. In addition, the E-Money Directive adopted in October 2009, which has to be transposed by 30 April 2011, will authorise e-money institutions (such as issuers of pre-paid cards, on-line or telecom providers for their pre-paid activities) to carry out business activities other than issuing e-money. Here again, the EMD still only applies to payments made within the EU/EEE, but the Member States have the right to extend its scope should they so wish. Both directives will be evaluated by the end of 2012, when their economic impact will be assessed and recommendations will be made regarding their potential revision. In the Council Conclusions of 30 November 2009, the EU undertook "to promote transparent, cheaper, faster and more secure flows of remittances to migrants' countries of origin, and to ensure that relevant legislation does not contain provisions hampering the effective use of legal remittances channels", within the broader context of migration which is one of the five priorities of the work on Policy Coherence for Development. The European Commission intends to keep up its efforts to identify any provisions hampering the effective use of legal remittances channels in the context of promoting mobile banking and transfers. It is sometimes argued that the legislation on anti money-laundering and counter terrorism financing may be perceived as a barrier for migrants to send money through formal channels as well as a burden on money transfer operators. So far, no Member State has conducted an assessment of the impact of the legislation on anti money-laundering and counter-terrorism financing on the remittances' market. As part of the Stockholm Programme, which is the 5-year plan (2010-2014) in the area of justice and home affairs96, the European Council invited the Commission to submit proposals on how to further ensure efficient, secure and low-cost remittance transfers, and enhance the development impact of remittance transfers, as well as to evaluate the feasibility of creating a common Union portal on remittances to inform migrants about transfer costs and to encourage competition among remittance service providers. A number of targeted initiatives have been set up to support developing countries in establishing a policy framework that is more conducive to remittances, such as the Commission's support for the establishment, under the auspices of the African Union, of an African Institute for Remittances and the contributions by a number of Member States and the Commission to the multi-donor Financial Facility for Remittances of the International Fund for Agricultural Development (IFAD) which, inter alia, provides grants for innovative projects that support: i) the creation of enabling environments for market development, openness and transparency; ii) the design of innovative business models; iii) the introduction of new technologies as a means for better financial inclusion; iv) financial access and services to rural remote areas; and v) migrant investment and entrepreneurship. France and the African Development Bank also organised two workshops in November 2009 with relevant local stakeholders in Bamako and Casablanca in order for them to share experiences on existing regulatory frameworks and discuss potential improvements to be made in terms of cost reduction, formalisation of flows, and suppression of barriers to competition and so on. More could be done to support developing countries in improving data collection, and to strengthen their capacity in policy making, for example to counter potential anti-competitive behaviour of money transfer operators. In a different vein, recent measures by some Member States, such as the decree in Italy requiring money transfer operators to inform local police within 12 hours if the person wishing to transfer
96http://www.statewatch.org/news/2010/jun/eu-jha-council-jun-10-stockholm-programme-action-plan-conclusions.pdf

EN 66 EN
funds is unable to present a residence permit, could be counter-productive from a development perspective, because such restrictions will increase the use of informal less secure channels to transfer remittances.
2.5.2.5. Support for the Financial Sector in Developing Countries
The Commission and EU Member States also implement programmes in partner countries with the aim of developing the financial sector (e.g. microfinance, technical assistance on financial sector regulation and supervision). Through its development cooperation, the EU supports the creation of a more favourable business environment in developing countries. Denmark, France, Germany, Netherlands, Sweden and the United Kingdom contribute to the Partnership for Making Finance Work for Africa, a major initiative that has been launched as part of the G8 commitments of the G8 Heiligendamm summit of 2007, to support the efforts of African countries to boost economic growth and fight poverty by encouraging and facilitating development of the financial sector. Germany also cooperates bilaterally with partner countries in advancing financial sector development, including the banking sector. German Financial Cooperation (KfW) is one of the world’s major investors in microfinance. Germany is active in several international initiatives that aim to improve the overall banking system, e.g. Financial Sector Reform and Strengthening Initiative (FIRST), Alliance for Financial Inclusion (AFI), Consultative Group to Assist the Poor (CGAP), and the Access to Insurance Initiative (A2II). Furthermore, Germany co-chairs the G20 expert working Group on SME Finance, aiming in particular at improving access to finance for SME in developing countries. Eight EU Member States (France, Germany, Italy, Luxembourg, Netherlands, Portugal, Spain and the United Kingdom) declare they have implemented solutions internally and in cooperation with third countries to overcome barriers to access to financial services by migrants and their families, with a view to reinforcing the impact of remittances on their economic and social development. Two other Member States (the Czech Republic and Greece) plan to implement such solutions in the near future. Eight Member States (Belgium, Germany, Estonia, Greece, Spain, France, Italy and the United Kingdom) have implemented the "General Principles for International Remittances Services" agreed by the Committee on Payments and Settlements Systems (CPSS) and referred to in the Council Conclusions of November 2008. Some Member States (such as Finland) feel that current payment services already meet the needs of migrants at a reasonable cost and therefore take the view that no action is necessary. The share of remittance services providers in the overall payment transmission is minor, the bulk of payments are transferred via banking channels. Furthermore, there are no indications that the current payment services do not satisfy the needs of migrants. In other cases there are few immigrants from developing countries (Ireland, Latvia, Lithuania, and Slovenia). To improve financial literacy and access to financial services, the UK informs migrants about financial products suited to their needs and also works through dialogue with the private sector. The UK prepared a leaflet explaining what information has to be given to the sender of money, what needs to be checked to make sure that the money reaches the recipient safely and what rights the sender has if things go wrong. The Netherlands recently evaluated its cost comparison website. As most migrants have access to financial services similar to that of the rest of the population in the EU, the cost of remittances depends mainly on access to financial services in non-EU countries.
2.5.3. Leveraging private flows
There have been a limited number of initiatives by Member States on leveraging private flows to developing countries.

EN 67 EN
One of the most significant is the support provided by Germany, France and the Netherlands for the Local Currency Financing Fund “The Currency Exchange” (TCX). TCX provides market risk management products in developing and emerging markets. This unique fund focuses on currencies and maturities which are not covered by regular market providers. In this way, TCX helps provide local microfinance institutions and banks, bilateral and multilateral development financers, and enterprises with long term finance in local currency. The Netherlands has also supported several private public partnerships (PPPs) in development cooperation. At present there are 75 PPPs in various sectors: health, agriculture, water, trade and energy. They take various forms: innovative public private financing mechanisms, technical support to enhance the business climate, product development, promotion of inclusive business models, pilots for sustainable trade, and capacity building for local water utilities. Sweden has launched a new programme called “Business for Development” or B4D. The B4D programme contains tools for new forms of dialogue and collaboration with the private sector. The purpose is to mobilise resources and encourage companies to develop their core activities so that they can contribute even more to ensuring better conditions for poor people. The B4D toolbox contains, among others, “Innovations Against Poverty”, “Challenge Funds” and “Market Transformation”.
2.6. Supporting Trade Capacity through Aid97
EU Commitments
On 15 October 2007, the Council of the European Union adopted the EU Aid for Trade Strategy with the following objectives:
- Quantitative Aid for Trade (AfT): ambitions within the gradual increase of overall EU aid (Member States’ and European Commission’s collective spending on Trade Related Assistance to reach EUR 2 billion annually by 2010).
- Enhancing the Pro-poor Focus and Quality of EU AfT
- Increasing EU-wide and Member State donors’ capacity in line with globally agreed aid effectiveness principles
- Building upon, fostering and supporting ACP regional integration processes with an ACP-specific angle of EU AfT
2.6.1. Background
Increased participation in world trade has the potential to be an engine for growth and poverty reduction in developing countries by generating revenues and employment, lowering prices on essential goods and promoting technology transfer and increased productivity. Market opening and strengthened international trade rules provide new opportunities, but are not on their own sufficient to generate trade, especially in the poorest countries. Many countries face internal "behind the border" constraints such as a lack of productive capacity, poor infrastructure, excessive red tape and inability to meet standards in high value export markets - all of which impact negatively on the competitiveness of developing country exports and undermine the potential benefits of increased imports. Trade-related development assistance – known as Aid for Trade (AfT) – targets these
97 This chapter summarises the Aid for Trade monitoring report 2011, which is included in Annex 6. The report provides detailed analyses of the data and issues covered in this summary.

EN 68 EN
“supply-side” constraints. It also strengthens countries’ capacity to negotiate and implement trade agreements to reap the most benefit from increasing trading opportunities. The EU and its Member States adopted a joint Aid for Trade Strategy on 15 October 2007 that aims at supporting all developing countries, particularly the Least Developed Countries (LDCs), to better integrate into the world trading system and to use trade more effectively in promoting the overarching objective of eradicating poverty in the context of sustainable development. The strategy embraces the full AfT agenda, which can be divided into six categories 1) Trade policy and regulations; 2) Trade development; 3) Trade-related infrastructure; 4) Building productive capacity; 5) Trade-related adjustment; and 6) Other trade-related needs. Categories 1, 2 and 6 correspond to more narrowly focused ‘Trade-Related Assistance’ (TRA). TRA plus the remaining categories are referred to as ‘the wider Aid for Trade agenda’, which has emerged as the concept of ODA to benefit trade has broadened. The OECD/DAC tracks ODA in each of the AfT categories through its Creditor Reporting System (CRS). The EU AfT strategy is a joint strategy to which EU Member States have signed up. In addition, several Member States have adopted specific AfT strategies in line with their national development policies. Sixteen Member States98 and the EU responded this year to the OECD/WTO AfT questionnaire which is intended to acquire information on the progress by individual donor countries with a particular focus on outcomes of AfT strategies and programmes. The responses show that Member States and the EU generally continue their engagement without significantly altering their strategy. Yet, six Member States adjusted their national AfT strategy since 2008 in areas such as regional integration, ‘economic growth’ and enhanced engagement with the private sector. Six Member States foresee further changes in their strategies in the near future. The Commission prepares every year a monitoring report in order to assess progress in implementing the commitments made by the EU and its Member States in the EU AfT Strategy. This is done in close coordination with the AfT reporting that is carried out by the WTO and the OECD, in the context of the monitoring of global AfT. The present chapter is a summary of the fourth EU AfT monitoring report, which is included in Annex 5, together with sub-annexes. More background, explanations and analysis of the issues covered in this summary can be found there.
2.6.2. Trade Related Assistance
Trade-Related Assistance supports developing countries to design and implement trade policies and agreements, to stimulate trade by domestic firms and encourage investment in trade-oriented industries. In 2005, the EU and its Member States committed to increase its collective TRA to EUR 2 billion per year from 2010 - EUR 1 billion by the EU and EUR 1 billion in bilateral aid from the Member States. Last year's monitoring report showed that the EU and Member States already met their EUR 2 billion target for TRA in 2008. In 2009, the EU as a whole continued to increase its TRA commitments substantially, reaching almost EUR 3 billion, compared to EUR 2.4 in 2008 (Figure 15). This results mainly from an increase in Member States TRA commitments, from EUR 1.4 billion in 2008 to EUR 2 billion in 2009. Four Member States make up 76% of total commitments in TRA provided by Member States in 2009: Germany (34%), the UK (17%), Spain (15%) and Belgium (10%). Member State financial commitments in 2009 increased in particular for Category 2 "Trade development, for which an increase of 50% was recorded. Trade development represented close to
98 BE, CZ, DE, DK, ES, FI, FR, HU, IE, IT, LI, LU, NL, PT, SE, UK

EN 69 EN
80% of total Member States TRA commitments in 2009. In contrast, the EU TRA was almost evenly split over the TRA categories in 2008 and 2009.
Figure 15 – Trade Related Assistance (EU and EU Member States, EUR million)
Trade Related Assistance(EU and EU MS, in EUR million)
276 388 482 299 473 677 841
1.359
2.052
592 566
733 811
695
902 1.032
1.007
911
867 954 1.215 1.110 1.168
1.579
1.874
2.366
2.964
-
500
1.000
1.500
2.000
2.500
3.000
3.500
2001 2002 2003 2004 2005 2006 2007 2008 2009
EU MS EU Grand Total
Source: OECD CRS Database, Doha Development Database, Monterrey Questionnaire 2011
In terms of geographical coverage, EU and Member States TRA volumes towards Africa increased substantially compared to 2008; it reached EUR 1.1 billion in 2009, representing 40% of all TRA (compared to 25% in 2008). Asia received the second largest share of TRA (23%), followed by Latin America (16%), Europe (5%) and Oceania (1%). Many programmes have a global coverage and are therefore classified by the OECD as geographically "unspecified" – the total amount for this category is EUR 0.43 billion.
2.6.3. Total 'wider' Aid for Trade
The AfT concept has widened over the years to include more general support for infrastructure and productive sectors, whereas the original scope of AfT did not stretch far beyond TRA, i.e. supporting beneficiaries to formulate and implement trade policies. Last year's report indicated an all-time high of total EU and Member States Aid for Trade commitments in 2008; the latest data for 2009 show that this high level was not an isolated event: The commitments increased slightly (+1.4%) in 2009 and reached a total of almost EUR 10.5 billion - EUR 7.1 billion from EU Member States and EUR 3.3 billion from the EU (Figure 16). The EU and its Member States accounted for about 37% of AfT from the world’s major bilateral and multilateral donors in 2008-2009 and is together the world's largest provider of AfT. This is a substantial increase compared to 2004-2005, when their share was 30% of the total. The EU on its own is after Japan the world largest donor of AfT, representing 11.4% of the world's total.

EN 70 EN
Figure 16 Aid for Trade(EU and EU Member States, in EUR million)
Aid for Trade(EU and EU MS, in EUR million)
3.322 3.413 3.175 3.369 3.327 4.384 4.975 4.685
7.279 7.137 1.277 1.741 2.036 1.903 1.444
2.117 2.563 2.436
3.056 3.345
4.599 5.154 5.210 5.272
4.770
6.501
7.538 7.120
10.335 10.482
-
2.000
4.000
6.000
8.000
10.000
12.000
2000 2001 2002 2003 2004 2005 2006 2007 2008 2009
EU MS EU Grand Total
Source: OECD CRS Database, Doha Development Database, Questionnaire on financing for development
2.6.3.1. Aid for Trade by EU provider
After having increased by 55% in 2008, AfT from Member States practically stabilised in 2009. EU AfT commitments continued to increase, albeit at a slower pace (+9.5% in 2009 compared to +25% in 2008). The slowdown in Member State commitments is largely attributable to France and Germany in 2009, as shown in Table 11. Yet they remain the largest Member State donors of AfT; together with the UK accounting for more than 60% of total AfT from EU Member States.
Table 11 Amounts of Aid for Trade by Member States: 2000-2009
(EUR million) 2000 2001 2002 2003 2004 2005 2006 2007 2008 2009 Austria 18 15 63 21 17 27 26 44 51 58 Belgium 86 114 186 135 178 155 156 209 221 389 Bulgaria 0 0 0 0 Cyprus - - - Czech Rep. 3 3 0 0 Denmark 495 81 206 188 367 410 189 255 173 251 Estonia 0 0 0 Finland 29 31 41 38 43 100 64 84 135 256 France 301 635 329 466 527 755 744 1 017 1 738 1 090 Germany 613 962 816 776 889 1 138 1 495 1 213 2 036 1 889 Greece 6 4 12 14 22 11 10 13 Hungary - - - Ireland 18 19 19 22 26 20 29 30 52 44 Italy 152 105 164 187 70 310 239 111 186 202 Latvia 0 0 0 0 Lithuania 0 0 1 0 Luxembourg 3 2 15 14 11 12 27 28 22 Malta - - - Netherlands 221 343 463 303 461 384 686 510 466 515

EN 71 EN
Poland - - 0 Portugal 23 30 17 8 41 61 7 47 13 66 Romania - 0 0 Slovakia - - - Slovenia 1 1 2 0 Spain 225 253 306 366 247 135 561 474 701 757 Sweden 143 192 135 170 150 200 259 267 225 247 United Kingdom 998 631 422 670 286 665 480 380 1 240 1 335 EU MS 3 322 3 413 3 175 3 369 3 327 4 384 4 975 4 685 7 279 7 137 EU 1 277 1 741 2 036 1 903 1 444 2 117 2 563 2 436 3 056 3 345 Grand Total 4 599 5 154 5 210 5 272 4 770 6 501 7 538 7 120 10 335 10 482
Source: OECD CRS Database, Doha Development Database, Questionnaire on financing for development
2.6.3.2. Aid for Trade by category
Figure 17 illustrates the trend for total EU and Member States’ AfT for each AfT category. Commitments for building productive capacity (BPC in the Figure) have increased considerably in recent years, and reached a record high of EUR 5.6 billion in 2009, representing 56% of total AfT. This covers support to agriculture, fisheries, banking, business industry etc. The second biggest category—trade-related infrastructure (TRI), which covers transport, storage, communication and energy—has followed a much more fluctuating path; commitments decreased from EUR 4.9 billion in 2008 to EUR 3.8 billion in 2009, after having increased by 76% in 2008. This can be explained by the fact this category covers large infrastructure projects for which substantial commitments are made on an irregular basis. Due to the nature of the support – institution building, technical assistance, training etc, commitments for trade policy and regulations (TPR) are on a much smaller scale (6% of total AfT in 2009). They increased by about 33% in each of 2008 and 2009, a clear indication of the continued attention to EU And Member States' support to the capacity of developing countries to formulate and implement trade policy. Activities in the trade-related adjustment (TRAdj) category have only been reported for ACP countries, and in limited amounts (in 2009 the total for this category was EUR 11.3 million), because the relevant sector code was added to the CRS only in 2008. As a consequence, TRAdj commitments are not shown in the graph. Most programmes under category 6 'other trade-related assistance' are in EU Neighbourhood countries and Europe as in these regions programmes more often cover areas that go beyond the sectors covered by Aid for Trade. They can be part of broader government advice or public reform projects in several sectors and as such reported as “Multi-sector Aid”. A total of 67 projects were included in this category in 2009 representing a total amount of EUR 333 million.

EN 72 EN
Figure 17 Aid for Trade by Category (EU + EU Member States, in EUR million)
Aid for Trade by Category(EU + EU MS, in EUR million)
-
1.000
2.000
3.000
4.000
5.000
6.000
2000 2001 2002 2003 2004 2005 2006 2007 2008 2009
1. TPR 3. TRI 4. BPC 6. Other Source: OECD CRS, EU
Source: OECD CRS, EU
2.6.3.3. Wider Aid for Trade geographical distribution
Efforts under the EU AfT strategy cover all developing country regions, as reflected in Figure 18. Compared to the 2000-2004 average, 2009 EU AfT commitments increased for all regions. Comparing with the 2005-2009 average, 2009 commitments only decreased for Europe and North of Sahara (between 2008 and 2009 from EUR 1.3 billion to EUR 0.7 billion in Europe and from EUR 1.5 billion to EUR 0.8 billion in North of Sahara. Africa accounted for the largest share of AfT from the EU and its Member States; commitments amounted to EUR 4.1 billion corresponding to 41% of total AfT in 2009. Last year's report indicated that the relative share of Sub-Saharan Africa was decreasing to the benefit of North Africa. However, the 2009 data demonstrates a reverse trend with almost stable commitments in North of Sahara and substantial increases in Sub-Saharan Africa. The South of Sahara region received by far the largest amounts of AfT of all regions. Asia received the second largest share of AfT (22% of total in 2009), followed by America (11%), Europe (7%) and Oceania (1%). As for TRA, the AfT classified as 'unspecified' (which includes programmes with global coverage) increased substantially in recent years and reached almost EUR 1.9 billion in 2009 representing 19% of total TRA. This is mainly due to three large global commitments to the EU Food Facility which were reported as geographically “unspecified” (global coverage).

EN 73 EN
Figure 18 - Aid for Trade by OECD Region (bilateral & regional programmes, EU + EU Member
States, in EUR million)
Aid for Trade by OECD Region(bilateral & regional programmes, EU + EU MS, in EUR million)
-
500
1.000
1.500
2.000
2.500
3.000
3.500
South ofSahara
Asia America North ofSahara
Europe Africa Oceania Unspecified
Annual Average 2000-2004 Annual Average 2005-2009 2009
Source: OECD CRS
The share of AfT to LDCs as percentage of total AfT from EU and EU Member States remained relatively stable at 22% in 2009, down from 24% in 2008, as shown in Figure 19. LDCs accounted for EUR 2.3 billion in 2009, compared to EUR 7.8 billion to non-LDCs. Interestingly, the figure also demonstrates that the LDC share of EU AfT (30% in 2009) has been continuously higher than the LDC share of Member States AfT (19% in 2009), despite a decreasing LDC share of EU AfT as compared to 2008.
Figure 19
Aid for Trade to LDCs(EU and EU MS, in EUR million)
22% 24% 22%22% 32% 29% 27% 24% 22% 34%
32%
22%26%
41%
46%43%
34%
24%
42%
30%
35%
22% 23%19%
21%
26%
16% 17%19%21%
-
2.000
4.000
6.000
8.000
10.000
12.000
2000 2001 2002 2003 2004 2005 2006 2007 2008 2009
0%
5%
10%
15%
20%
25%
30%
35%
40%
45%
50%
EU+EU MS AfT to LDC EU+EU MS AfT to non LDC EU: % LDCs in AfT EU MS: % LDCs in AfT
Source: OECD CRS
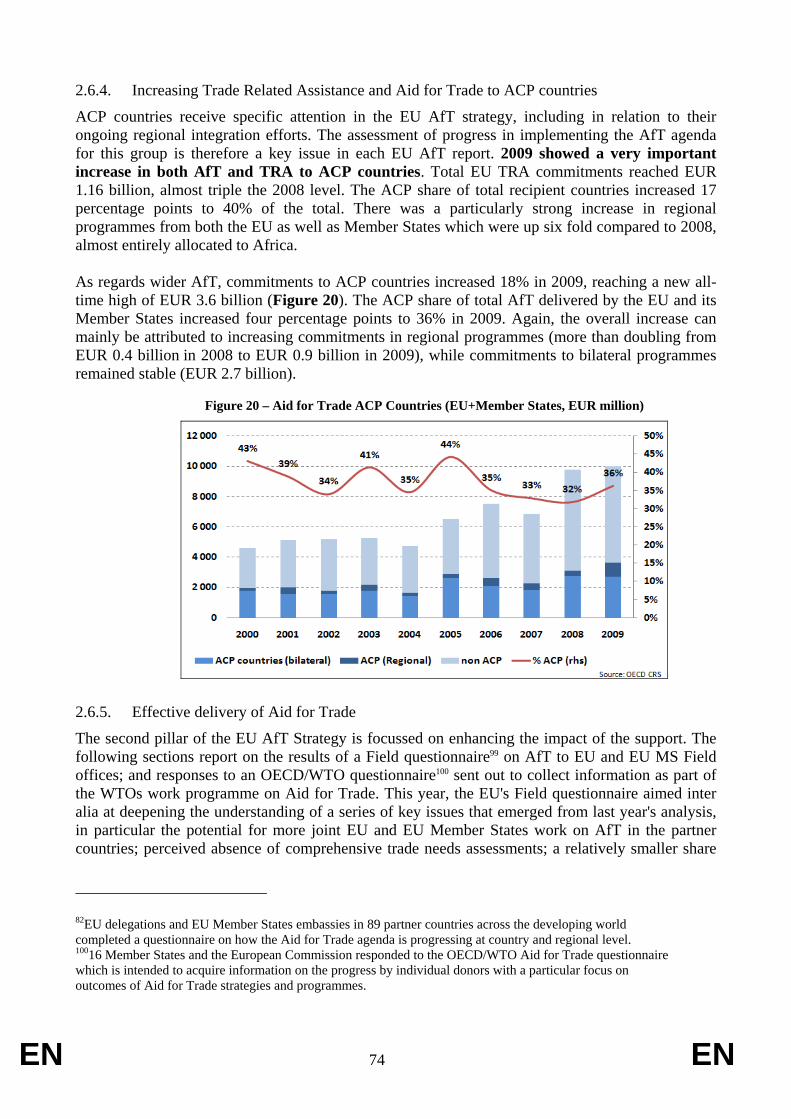
EN 74 EN
2.6.4. Increasing Trade Related Assistance and Aid for Trade to ACP countries
ACP countries receive specific attention in the EU AfT strategy, including in relation to their ongoing regional integration efforts. The assessment of progress in implementing the AfT agenda for this group is therefore a key issue in each EU AfT report. 2009 showed a very important increase in both AfT and TRA to ACP countries. Total EU TRA commitments reached EUR 1.16 billion, almost triple the 2008 level. The ACP share of total recipient countries increased 17 percentage points to 40% of the total. There was a particularly strong increase in regional programmes from both the EU as well as Member States which were up six fold compared to 2008, almost entirely allocated to Africa. As regards wider AfT, commitments to ACP countries increased 18% in 2009, reaching a new all-time high of EUR 3.6 billion (Figure 20). The ACP share of total AfT delivered by the EU and its Member States increased four percentage points to 36% in 2009. Again, the overall increase can mainly be attributed to increasing commitments in regional programmes (more than doubling from EUR 0.4 billion in 2008 to EUR 0.9 billion in 2009), while commitments to bilateral programmes remained stable (EUR 2.7 billion).
Figure 20 – Aid for Trade ACP Countries (EU+Member States, EUR million)
2.6.5. Effective delivery of Aid for Trade
The second pillar of the EU AfT Strategy is focussed on enhancing the impact of the support. The following sections report on the results of a Field questionnaire99 on AfT to EU and EU MS Field offices; and responses to an OECD/WTO questionnaire100 sent out to collect information as part of the WTOs work programme on Aid for Trade. This year, the EU's Field questionnaire aimed inter alia at deepening the understanding of a series of key issues that emerged from last year's analysis, in particular the potential for more joint EU and EU Member States work on AfT in the partner countries; perceived absence of comprehensive trade needs assessments; a relatively smaller share
82EU delegations and EU Member States embassies in 89 partner countries across the developing world completed a questionnaire on how the Aid for Trade agenda is progressing at country and regional level. 10016 Member States and the European Commission responded to the OECD/WTO Aid for Trade questionnaire which is intended to acquire information on the progress by individual donors with a particular focus on outcomes of Aid for Trade strategies and programmes.

EN 75 EN
of EU and Member States ODA allocated to AfT in LDCs than for developing countries as a whole; and the room for strengthening support to regional integration.
2.6.5.1. Ownership
In half of partner countries, EU delegations and Member States representatives report that trade is a regular topic in their policy dialogue with the partner country. This is a considerable improvement compared to the 33% of positive responses to last year’s questionnaire. But in 37 partner countries (42%) trade is a topic of policy dialogue only to a limited extent, and in eight countries not at all. The Member States responses to the OECD/WTO questionnaire indicate that trade is a more regular topic in policy dialogues between donors and regional communities (reported by eight Member States) compared to the policy dialogues between donor and partner countries (reported by five Member States).
EU and Member States donors indicated that civil society was always included in the dialogue in 9% of partner countries. Civil society was sometimes included in the policy dialogue in 40% of the cases. Similarly, nine Member States out of 16, and the EU, report in the OECD/WTO questionnaire that the private sector is sometimes involved in the policy dialogue. Two Member States report that the private sector is always involved in their dialogue with partners. There is, in other words, continued room for a broadened dialogue.
Compared to 2008, an increasing demand for AfT is reported in about 50% of partner countries, with a particularly strong increase of AfT demand in EU Neighbourhood countries (reported in 70% of cases for this region). It is interesting to note that overall, the Field responses do not actually support the notion that there is a clear link between the inclusion of trade issues in the policy dialogue and demand for Aid for Trade. On the contrary, there appears to be rather little correlation between these two elements and more in-depth analysis is necessary to fully understand the inter-linkages between dialogue and demand.
Almost half of the Field responses report that the partner country has effective national coordination processes in place to develop and implement an integrated trade strategy. The other half of the countries are said either not to have such coordination processes, or to have them formally but not use them actively. Reasons given relate to lack of capacity, understaffing and reconciling different interests among the private sector players. This remains an important area for further attention to ensure that AfT is effective.
This year's exercise showed that in half of the partner countries a comprehensive trade needs assessment has been undertaken in the last 5 years (and partially in a further 17% of partner countries). This is a modest improvement compared to situation signalled in the 2008 responses, but still seems to imply that in at least one third of partner countries EU and its Member States are providing AfT on the basis of an out of date or non-existent trade needs assessment. In these cases, other methods are used to agree on AfT priorities. It should also be noted that even if a recent comprehensive trade needs assessment is available, the findings appear to be fully reflected in national trade strategies only in about 60% of cases.
2.6.5.2. Joint Aid for Trade operations and harmonisation: moderate progress
This year’s field responses indicate that in 21% of partner countries, EU donors significantly improved their donor coordination compared to 2008 (in terms of joint needs assessments, joint implementation, joint monitoring/evaluation etc). Moderate improvement is reported by 43% of respondents. The responses to the OECD/WTO questionnaire support this finding - nine out of 16 Member States indicate that harmonisation of AfT strategies between Member States have been

EN 76 EN
progressing at a moderate pace. No Member State characterised the overall improvement as ‘significant’ – suggesting that their "aggregate" response "hides" the important progress experienced by some field offices.
2.6.5.3. Regional dimension of Aid for Trade
The field responses indicate that in 54% of partner countries EU donors supported (of which 40% partially) the partner country in strengthening the inclusion of strategic economic regional integration priorities in the national development plan or trade strategy. 64% of responses report that this is an improvement compared to 2008. When grouping the responses by sub-region, a strongly diverging picture emerges. EU donors appear particularly to have supported the inclusion of regional economic integration in national development plans or trade strategies in the EAC and the Caribbean (60%) and to a somewhat lesser extent in Latin America and Neighbourhood (50%). Noteworthy is the relatively low score of other African regions where donors are supporting regional integration initiatives at national level, such as ESA, SADC, Central and West Africa. Although regional integration is more advanced in some regions than in others, this does not fully explain the diverging responses from the EU field offices.
2.6.5.4. LDCs and EU AfT
The questionnaires paid specific attention to AfT in LDCs, following last year's finding that the share of EU and Member States ODA allocated to AfT in LDCs was smaller than for developing countries as a whole, despite the apparent trade-related needs of LDCs. Thirteen of the 37 responses to the questionnaire received from EU donors based in LDCs (35%) reported that trade issues were a regular element of policy dialogue in their partner countries. Eighteen (49%) said that it was so only to a limited extent. Six said that trade was not part of the dialogue at all. In 12 countries (32%), the policy dialogue was considered to have improved compared to the situation in 2008. This should be compared with the responses for all countries for which 45% had noted an improvement. As the baseline situation was better in the total sample, this would suggest that despite progress, LDCs do not appear to be catching up with the other developing countries on this front. Comments relating to the reasons for changes or lack of changes in the LDC policy dialogue often relate to either progress or stagnation in trade negotiations. Another reason cited was that several countries were in a crisis or post crisis situation, leading to a generally scaled down dialogue or a focus on basic constitutional and socio-economic issues. As many as 19 of the joint responses received from EU donors in LDCs (more than 50%) considered that demand for Aid for Trade had increased since 2008; 11 said it had not. Three reported it had increased significantly. Responses from EU donors in LDCs indicate a lower degree of availability and use of trade policy coordination mechanisms in LDCs as compared to the total sample. Only 11 of the 37 LDCs (30%) EU field offices considered that national mechanisms were in place to coordinate trade policy – featuring inter-ministerial and inter-institutional coordination – compared to 50% for all countries. A further 16 (43%) said that such mechanisms existed formally, but were not actively used. In 9 countries, such mechanisms were said not to exist. Several references were made to the Enhanced Integrated Framework (EIF) which could improve coordination platforms although there were also quite a number of reports on EIF not using fully its potential in this regard. Responding to the question whether LDCs had carried out a comprehensive trade needs assessment in the past 5 years, there were 21 positive answers (57%), 14 negative (38%), and 2 partially. This indicates if anything a potential worsening compared to 2008 when 22 out of 31

EN 77 EN
(79%) LDCs were said to have undertaken a comprehensive trade needs assessment in the last 5 years. The score is comparable to the total sample. 33 responses considered that a main constraint to increasing the attention to trade in LDCs was low absorption capacity. 21 responses referred to the LDC country’s low capacity to identify needs and priorities. Eight responses indicated that the most important or important constraint was insufficient availability of donor resources; but 25 considered that this was not important or less important. “Other more pressing priorities" were mentioned by 15 respondents as important. No one said 'very important', but 15 respondents indicated that they were not sure about the answer to this question. This indicates a need to focus more on LDCs' capacity to position trade issues in their development strategy, identify more clearly the trade-related needs, and place more attention on absorptive capacity.
2.6.5.5. Aid for Trade monitoring and evaluation
The past few year's have seen a search for improved methods to demonstrate the impact of AfT on trade and development performance of partner countries - a challenging task, not least due to attribution problems. Asked about the difficulties that donors encounter in assessing AfT programmes and projects, EU Delegations in developing countries considered the difficulty in obtaining in-country data as the most important challenge (69% of respondents). The difficulty to identify quantifiable objectives for intervention was rated as another important hurdle (67%). To a slightly lesser extent the difficulty in defining suitable indicators was considered as an important challenge (57%). A key aim of monitoring and evaluation is to feed-back results into the government's trade development strategy. For this specific processes need to be in place, but the responses to the EU field office questionnaire indicate that this is often lacking. Only 3% of respondents reported that this 'significantly' applies and 37% 'moderately'. This is clearly an area where further work is required. Monitoring and evaluation was also addressed in the OECD questionnaires: nine Member States indicated that AfT monitoring had moderately improved. Regarding evaluation of AfT strategies, programmes and projects, Member States reported a number of challenges they face, in decreasing order of importance: 'difficulty of assigning trade outcomes to the programme' (attribution) was considered as most the important by seven Member States, followed by ‘difficulty in identifying quantifiable objectives’ which was considered ‘most important’ by four Member States.
2.6.6. Conclusions
The outcome of this year's AfT monitoring exercise demonstrates that both the EU and its Member States continue to advance in implementing the EU AfT Strategy. The results point to a strengthening of EU engagement in AfT, both in terms of volume commitments as well as on enhancing the impact of AfT delivery on the ground: The EU combined annual AfT reached EUR 10.5 billion in 2009, maintaining the all-time high registered the year before and a substantial increase was reported for EU TRA, bringing the collective amount to nearly EUR 3 billion, well above the Hong Kong target to spend (as from 2010) EUR 2 billion per year on TRA. Reports from the EU field offices point to moderate improvement in the processes that underpin both the volumes and the effectiveness of AfT, such as; addressing trade in the partner-donor policy dialogue; improved coordination to develop and implement trade strategies; availability of trade needs assessments; joint operations and harmonisation; and the inclusion of strategic economic regional integration priorities in national development plans.

EN 78 EN
In order to sustain this advance of the EU AfT agenda and to further strengthen its impact on the world's poorest, enhanced endeavours by the EU and Member States are essential in the following key areas:
- Enhancing AfT support to the LDCs by increasing attention to the capacity of LDCs to formulate and implement trade development strategies in support of inclusive growth and to further capitalise on the potential of the Enhanced Integrated Framework in this respect;
- Improve the effectiveness of AfT identified at country level, including by making better use of trade needs assessments, enhancing the effectiveness of platforms intended to support the development of trade related strategies; and acting on opportunities for increasing joint operations;
- Step up support for regional integration, building further on existing initiatives such as the EU Aid for Trade packages for the ACP countries and increasing attention to regional issues in assistance provided at the national level; and
- Support partner countries' own monitoring of results and impact of Aid for Trade and the progress of their trade development strategies
The European Commission's Trade and Development Communication which is foreseen for the last quarter 2011 provides an opportunity to further highlight these issues and to suggest concrete actions on the way forward.
2.7. Reducing the Debt Burden of Developing Countries
EU Commitments
Council Conclusions of 18 May 2009: Support to developing countries in coping with the crisis (§12): ‘the EU will continue supporting the existing debt relief initiatives, in particular the Heavily Indebted Poor Countries (HIPC) Initiative and Multilateral Debt Relief Initiative (MDRI) and values the Evian approach as an appropriate flexible tool to ensure debt sustainability’.
In line with the Doha Declaration, the EU has also confirmed in the Council Conclusions of 18 May 2009 (§12), that it ’supports discussions, if relevant, on enhanced forms of sovereign debt restructuring mechanisms, based on existing frameworks and principles, including the Paris Club, with a broad creditors’ and debtors participation and ensuring comparable burden-sharing among creditors with a central role for the Bretton Woods Institutions (BWI) in the debate.
2.7.1. Challenge of recent economic trends: Preserving debt sustainability
To assess debt sustainability, three main international methodologies have been developed: the Heavily Indebted Poor Countries Debt Relief Analyses, the Low Income Countries Debt Sustainability Framework (LIC-DSF) and the Middle-Income Countries Debt Sustainability Framework (MIC-DSF). They all involve making projections of intended borrowings and economic variables over a maximum 20-year period, and then using ratios comparing debt stock, present value or service with GDP, exports or budget revenue to assess payment capacity.

EN 79 EN
The indicative debt burden thresholds are not intended to be used as rigid ceilings. There are four possible ratings for the risk of debt distress:101 – Low risk: all debt indicators are well below the indicative debt burden thresholds
– Moderate risk: the debt service ratio may reach its indicative threshold but debt-stock ratios may breach them
– High risk: the baseline scenario indicates a breach of debt stock and/or service ratios over the projection period
– Debt distress: the country is already having repayment difficulties.
Operational implications. The classification of risk distress forms the basis for determining the grant/loan mix of future International Development Association (IDA) allocations under IDA14 and some other multilateral creditors such as the African Development Fund. Accordingly, IDA-only countries that are classified at:
– High risk of debt distress receive 100% grant financing from IDA at a 20% volume discount.
– Moderate risk of debt distress receive 50% grant financing at a 10% discount.
– Low risk of debt distress receive 100% loan financing.
Debt crises tend to be costly and disruptive, especially for the poor and other vulnerable social groups. Debt crises also have a negative impact on access to schooling and health services, reducing human capital accumulation and long-run economic growth. Therefore, policies aimed at mitigating the prevalence and cost of debt crises can yield large payoffs in terms of poverty reduction and can play a key role in helping achieve the Millennium Development Goals. Such policies involve a broad choice of mechanisms: the promotion of newer and safer debt instruments; regulation to reduce destabilising capital flows; the creation of an effective international lender of last resort; the design of a set of guidelines to limit solvency crises by promoting responsible sovereign borrowing and lending to sovereigns; and the design of a mechanism for dealing with sovereign debt crises. Debt relief provides a crucial cushion to developing countries in times of difficulty. Encouraging progress has been made in the past year on delivering debt relief to heavily indebted poor countries. However, the global financial crisis and the recent stagnation of aid flows, means there is still concern for the increased debt vulnerabilities of many developing countries. Until recently, liquidity crises affected mostly financially globalised economies, which borrow in foreign currency from the international capital market, and spared low-income countries, which rely on more stable official financial flows. Now, however, the process of financial globalisation is rapidly expanding to middle and low-income countries (the so-called frontier markets), making those countries subject to potential liquidity shocks. The least developed countries that are currently in debt distress include Comoros, the Democratic Republic of the Congo, Eritrea, Guinea, Guinea-Bissau, Liberia, Myanmar, Somalia, the Sudan and Togo. Countries at high risk of debt distress include Afghanistan, Burkina Faso, Burundi, Djibouti, the Gambia, Haiti, the Lao People’s Democratic Republic, Maldives, Sao Tome and Principe and Yemen. Debt service burdens of HIPC were expected to remain higher in 2010 and beyond than in the pre-crisis years102. The economic crisis led to a drop in the dollar value of exports and GNI. As a
101 UNCTAD, Debt Sustainability Analysis (DSA): An E-Learning Training Course

EN 80 EN
consequence, the average external debt-to-export ratio of HIPC increased from 64 to 82% between 2009 and 2010, and their external debt-to-GNI ratio went from 22.0 to 23.5% over the same period103. This is a substantial setback, as it reversed some of the advances achieved between 2000-2008 period, when debt dropped from 133 to 64% of exports of goods and services and from 37 to 22% of GNI. The economic crisis may also have an impact on debt sustainability for Middle Income Countries. The IMF has set a framework focusing on the sustainability of both public and external debt, implicitly addressing the interaction with the financial sector. The IMF Classical Framework for Middle Income Countries with Market Access104 aims to introduce a greater degree of consistency and discipline in sustainability analysis in an attempt to make better informed judgements under a set of clear and transparent assumptions. To assess sustainability, the IMF looks at several scenarios of potential events and projections. The ‘baseline’ medium-term projections of the balance of payments and fiscal developments, which is based on current policies projected over a five-year horizon, is the benchmark scenario for the IMF DSA framework. The framework is not intended to be applied in a completely mechanical and rigid fashion. It serves as an indication of potential trends in debt. The IMF has also developed a set of tools for exploring medium-term current account and real exchange rate sustainability. Financial sector stability assessments are made to help identify the vulnerability of the financial sector to various shocks. Beyond the baseline projection, the framework incorporates a standard set of sensitivity tests. The purpose is to examine the effects of alternative assumptions about the time paths of variables affecting both the ability to service the debt and the cost of financing it. This framework may be useful in at least three cases:
- For countries that have moderately high indebtedness, the framework can help identify vulnerabilities;
- For countries on the edge or in the midst of a crisis, it can be used to examine the plausibility of the debt-stabilising dynamics set out in the programme projections;
- In the aftermath of a crisis and/or debt default, it can be useful to examine the consistency of the debt restructuring required to achieve a desired or projected outcome.
2.7.2. Analysis of debt relief initiatives
25 out of 28 respondents to the questionnaire said they delivered on commitments to the HIPC (High Indebted Poor Countries) Initiative and MDRI (Multilateral Debt Relief Initiative), including commitments to the IDA and the African Development Bank, without delays. But only 13 have taken new steps to help restore and preserve debt sustainability in low-income countries. Most Member States agree that action to support external debt sustainability is more effective if undertaken multilaterally. Spain mentioned that it has supported the IMF’s temporary moratorium on interest payments and the general reform of its financing. By December 16 2010, debt reduction packages under the HIPC Initiative were approved for 36 countries, 32 of them in Africa, providing EUR 54.36 billion (USD72 billion)105 in debt-
102According to the latest status of HIPC Initiative and Multilateral Debt Relief Initiative (MDRI) prepared by IDA and IMF staff, September 14, 2010;. confirmed during the Ministerial Meeting On Enhancing The Mobilization Of Financial Resources For Least Developed Countries’ Development in Lisbon, 2 3 October 2010. 103Global Development Finance 2011: External Debt of Developing Countries, World Bank, 12 Dec 2010. External debt sustainability and development, UN Report, Sixty-fifth session, July 2010. 104UNCTAD, Debt Sustainability Analysis (DSA): An E-Learning Training Course 1052010 DAC exchange rate : 1dollar = 0.755 euro

EN 81 EN
service relief over time. Out of the 40 eligible countries, 30 have now reached completion point, 6 have reached decision point and 4 have yet to begin HIPC. Of these, 24 qualified for irrevocable debt relief under HIPC and MDRI. A ’sunset clause’ was included in the HIPC Initiative to prevent it from becoming a permanent facility. The clause has been extended four times to allow the remaining HIPCs to begin to establish a policy track record to qualify for HIPC relief consideration. The sunset clause took effect on December 31 2006, but the Executive Boards of the IMF decided to grandfather all countries that had been assessed (or in the future are assessed) to meet the HIPC Initiative’s income and indebtedness criteria based on end-2004 data. This would allow countries that had not yet met the policy performance criterion of the HIPC Initiative by the end of 2006 sunset-clause date to become eligible for debt relief if they adopt, at any time, a qualifying economic programme.106
Figure 21 – Post decision-point HIPC’s debt stock at different debt relief stages (in billions of U.S. dollars, in end-2009 NPV terms)
Source: HIPC Initiative country documents and IDA/IMF staff estimates, September 14, 2010107
The World Bank classifies nearly all of the countries that have yet to complete the Initiative as fragile economies, indicating their need for additional assistance to expedite relief. Some creditors have given debt relief to HIPC that goes beyond the requirements under the HIPC Initiative. For Paris Club official bilateral creditors, the amount of beyond HIPC debt relief provided was EUR 6.9 billion (USD9.6 billion)108 in end-2009 PV terms. Under the Least Developed Countries (LDC) Initiative, the EU cancels all outstanding amounts on special loans of eligible least developed countries after the application of HIPC Initiative relief. From the start to the end of July 2010, the EU provided additional debt relief on special loans of seven completion-point countries and one decision-point country amounting to EUR 53.4 million. 106 IDA and IMF, Heavily Indebted Poor Countries (HIPC) Initiative and Multilateral Debt Relief Initiative (MDRI)—Status of Implementation prepared IMF and World Bank staff. October 15, 2007 107Source HIPC Initiative country documents, and IDA/IMF staff estimates. In “IMF, HIPC Initiative and Multilateral Debt Relief Initiative (MDRI)—Status of Implementation, Prepared by IDA and IMF, September 14, 2010. Note: Estimates based on decision-point debt stocks. 1082009 DAC exchange rate: 1 dollar = 0.719 euro.

EN 82 EN
Seven Paris Club meetings were held in the year to July 2010, all of them devoted to tackling the debt of HIPC. Below are three examples:
• After the HIPC completion in January 2010, Paris Club creditors met with representatives of Afghanistan in March 2010. The country obtained a 100% write-off on its pre-cut-off-date debt, which included additional debt cancellations granted by creditors on a voluntary and bilateral basis. The agreement with the Paris Club creditors includes a comparability of treatment clause.
• In March 2010, a Paris Club meeting was held to consider the debt situation of the Democratic Republic of Congo after it reached HIPC completion in January. The country obtained a complete cancellation of its stock of eligible debt, with the provision that it keep the Paris Club secretariat informed of the progress made with other creditors for the next three years. That meeting highlighted the controversial role played by vulture funds in the international financial system. The amounts involved were large, around EUR 377 million (USD500 million)109, and the Democratic Republic of Congo obtained a minimum discount on them.
Box 5 - Review of debt relief by main creditors (Status Dec 2009, HIPC)
Denmark provides 100% cancellation of ODA loans and non-ODA credits contracted and disbursed before September 27, 1999.
France: cancellation of 100% of debt service on pre-cut off date commercial claims on the government as they fall due starting at the decision point. Once countries have reached completion, debt relief on ODA claims on the government will go to a special account and will be used for specific development projects.
Finland: no post-Cancellation of Date (COD) claims.
Italy: cancellation of 100% of all debts (pre- and post-cut off date, ODA and non-ODA) incurred before June 20, 1999 (the Cologne Summit) cancellation of related amounts falling due in the interim period. At completion point, cancellation of the stock of remaining debt.
The Netherlands: 100% ODA (pre- and post-cut off date debt is cancelled at decision point) For non-ODA, in some cases (Benin, Bolivia, Burkina Faso, Ethiopia, Ghana, Mali, Mozambique, Nicaragua, Rwanda, Tanzania, Uganda and Zambia), NL will write off 100% of the consolidated amounts on the flow at decision point. All other HIPCs will receive interim relief up to a 90% reduction of the consolidated amounts. At completion point, all HIPCs will receive 100% cancellation of the remaining stock of the pre-cut off date debt.
Norway and Switzerland have cancelled all ODA claims.
Sweden and Russia have no ODA claims.
Spain provides 100% cancellation of ODA and non-ODA claims contracted before January, 2004.
United Kingdom: ‘beyond 100%’ full write-off of all debts of HIPCs as of their decision points, and reimbursement at the decision point of any debt service paid before the decision point.
United States: cancellation of 100% of all debts (pre and post-cut off date, ODA and non-ODA) incurred before June 20, 1999 (the Cologne Summit). At decision point, cancellation of accrued arrears and maturities falling due in the interim period. At completion point, cancellation of the stock of remaining eligible debt
1092010 DAC exchange rate: 1dollar = 0.755 euro

EN 83 EN
In July 2010, Guinea-Bissau concluded an agreement with Paris Club creditors to reschedule its debt under the Cologne terms, thus reducing by 98% the debt service falling due between January 2010 and December 2012. Under the agreement, the country obtained a deferral until December 2012 of payments on its short-term and post-cut-off-date debts, including a deferral of moratorium interest. This was intended to support adjustment efforts in Guinea-Bissau to reach its HIPC completion. The HIPC Debt Relief Initiative and the MDRI have significantly reduced the debt burden in many countries, freeing critical resources to help finance governments’ growth programmes. The perception of a large fiscal space in some LICs, however, has led to the emergence of new creditors and new opportunities to access non-concessional sources of financing. These opportunities, while welcome, raise new risks. Countries are frequently faced with new and conflicting market proposals, and other bilateral creditors on new financing options. In many cases, they lack the means to fully assess the related costs and risks. Poor financial choices, including on the terms on which new debt is contracted, could contribute to the re-emergence of debt vulnerabilities in these countries, putting debt sustainability at risk. When poor, heavily indebted countries contract commercial loans while simultaneously benefiting from IDA grants, credits or debt relief, it is classified as free riding. The World Bank uses this term to denote ‘situations in which IDA debt relief or grants could potentially cross-subsidise lenders that offer non-concessional loans to recipient countries’. The Bank has proposed a two-pronged approach to free riding. First, creditor coordination should be stepped up to prevent non-concessional lending to the countries concerned and, secondly, these countries should be discouraged from non-concessional borrowing through penalties, or reductions in either the amount or the grant element of IDA flows110
2.7.3. Vulture funds or the threats associated with commercial creditor litigation
The EU should also help to find ways to tackle the problem of so called “vulture funds”, i.e. to prevent the actions of distressed-debt funds. 22 Member States have not planned specific actions to prevent aggressive litigation against HIPC. However, some EU countries are already leading the way. Spain participates actively in the Paris Club initiative working towards a coordinated fight against the implications of action by ’vulture funds’ for debtor countries. In the UK, the Debt Relief Act has prevented litigation against HIPCs in UK courts since June 2010 (see Box 6). Belgium passed a bill in April 2008 to prevent the seizure or transfer of public funds for international cooperation, in particular related to the methods used by vulture funds. Germany, Belgium and the European Commission report that they support the African Legal Support Facility (ALSF), launched by the African Development Bank (AfDB) in mid 2009, which provides support for African countries facing litigation from commercial creditors. In the US, a member of the. House of Representatives has also tabled legislation that would limit the ability of non-participating creditors to seek awards from HIPCs via U.S. courts111. Therefore, while some commercial creditors continue to pursue litigation to recover claims against HIPCs, rather than participate in the provision of debt relief under the Initiative, the incidence of new litigation has fallen in recent years. According to survey responses (September 2010) from
110 Free Riding and Debt Relief: Implications for IDA, February 2007. Jan Willem Gunning Free University, Amsterdam and AIID and Sweder van Wijnbergen University of Amsterdam and AIID 111The “Stop VULTURE Funds” Bill introduced in June 2009

EN 84 EN
HIPC authorities, the number of outstanding litigation cases against HIPCs fell from 33 to 14 cases in 2008 and then rose to a total of 17 cases in 2009112.
Box 6 – The U.K. Debt Relief Act On April 8, 2010, the UK Parliament enacted the Debt Relief (Developing Countries) Act. It seeks to introduce a mandatory element to debt relief under the HIPC Initiative by limiting the proportion of debts previously contracted by a HIPC that a commercial creditor can reclaim through litigation under U.K. law. The limit is set in reference to the debt reduction expected on claims under the HIPC Initiative. The Act came into force on June 8 2010. The key aspects of the Act are: 1. The debt covered by the Act is the debt eligible for relief under the HIPC Initiative, but it is limited to HIPC debt incurred prior to a HIPC’s decision point and prior to commencement of the Act. 2. Qualifying debt is limited to the debts of the countries that meet the HIPC eligibility criteria in effect at commencement. Any changes to those criteria going forward (whether resulting in an expansion or reduction of HIPCs) are disregarded by the Act. The Act is therefore restricted to an identifiable stock of historic debt. It makes no distinction between HIPC debt still held by the original creditor and HIPC debt that has been traded on the secondary markets. 3. The Act limits the amount of qualifying debt (and associated causes of action such as damages claims) recoverable by a creditor in the U.K. courts to the amount the creditor would have received if it had applied the most recently published Common Reduction Factor set by the IMF and World Bank under the HIPC Initiative (on top of traditional relief). 4. For the five countries that had not yet reached decision point at the time the Act was passed, no Common Reduction Factor was available. As a result, the Act only takes into account the 67% traditional relief, leaving a reduced amount of 33% payable. This may encourage creditors to settle with the pre-decision-point HIPCs before they reach decision point. 5. In addition to reducing the recoverable amount on due debts, the Act also applies the same reduction to qualifying debts on which judgment has been obtained but not yet enforced. 6. Qualifying debt includes HIPC debt governed by foreign law as well as UK law. Therefore, the Act will apply to cases decided by UK courts, where the governing law is foreign. 7. The Act contains a sunset clause. Unless the UK Government decides to extend the Act permanently or for one year, it will expire on June 8 2011. This would also need to be approved by the UK Parliament. 8. The Act also promotes the negotiated settlement of these debts on terms compatible with the HIPC Initiative by excluding from the scope of the legislation debts where the HIPC government does not offer to do this.
2.7.4. Alternative debt management initiatives
In their answers to this year’s questionnaire, Member States mentioned an extensive list of debt management initiatives beyond HIPC and MDRI:
• Activities of the African Legal Support Facility (ALSF)
• The DMFAS Programme (Debt Management and Financial Analysis System), an UNCTAD (UN Conference on Trade and Development) provider of technical cooperation and advisory services on debt management
• The DMF (Debt Management Facilitation for Low Income Countries), a World Bank Multi Donor Trust Fund, scaling up World Bank work on debt management technical assistance in LICs
• Implementing a bill to prevent the seizure or transfer of public funds for international cooperation, in particular related to the methods used by vulture funds.
• National legislation (Belgium, UK), or within the Paris Club.
1122010 Survey of commercial creditor participation and creditor lawsuits against HIPCs. The survey elicited responsesfrom the authorities of 37 countries out of 40 surveyed in May/June 2010 in ’HIPC Initiative and Multilateral Debt Relief Initiative (MDRI) -Status of Implementation, Prepared by the Staffs of IDA and the IMF, September 14, 2010’.

EN 85 EN
The African Legal Support Facility decided in November 2010 to provide a USD 500.000 grant to fund services of a reputable international law firm in connection with the dispute between the government of the Democratic Republic of Congo (DRC) and a renowned vulture fund. Legal assistance to the DRC is the first of its kind by the ALSF since its creation by the African Development Bank (AfDB) Group in 2008. The support to DRC falls within the ALSF’s mission to provide technical legal advice to its members in creditor litigation. This includes technical legal assistance to strengthen their legal expertise and negotiating capacity in matters pertaining to debt management, natural resources and extractive industries management and contracting; investment agreements and related commercial and business transactions. Belgium and Germany participate in the ALSF. The DMFAS programme offers countries a set of solutions for improving their capacity to handle the day-to-day management of public liabilities and produce reliable debt data for policy-making purposes. At the programme’s core is software that can be used for the purposes of recording, monitoring, reporting and analysis. Usually installed in the Ministry of Finance and/or Central Bank, it supports external and domestic public debt (loans and securities), whether this be short-, medium- or long-term. It also provides coverage for private debt, grants and on-lent loans. The DMFAS enables the debt office to develop a debt database containing detailed and aggregated data on loan contracts, bonds and grants, real operations (disbursements and debt service) as well as future operations (disbursements and debt service). As the system can process large quantities of debt data, more time and energy can be focused on analytical and management tasks. Its design allows for easy customisation and adaptation in accordance with the needs and preferences of each client institution. It can also be integrated with other financial systems if the institution so wishes. The DMF is a grant facility financed by a multi-donor trust fund managed by the World Bank that helps strengthen debt management policies and institutions in eligible countries by financing the systematic application of the World Bank’s Debt Management Performance Assessment (DeMPA). It supports World Bank participation in joint Bank/Fund technical assistance efforts to facilitate the country-led application of a toolkit for formulating and implementing a Medium-Term Debt Management Strategy (MTDS). Spain carried out relief of debts contracted before 2003 partially through Debt Swap Agreements. In 2009 and 2010, Spain signed Debt Swaps Programmes with LICs and HPCs, including Mozambique, Ghana and Bolivia. Italy subscribes to and has been in the lead, as a co-sponsor, of the ’principles and guidelines to promote sustainable lending practices in the provision of official export credits to LICs’. The provision of official export credits to public buyers and publicly guaranteed buyers in LICs should reflect Sustainable Lending practices, i.e. lending that supports a borrowing country’s economic and social progress without endangering its financial future and long-term development prospects. The Principles will yield their full benefits only if all creditors act in harmony.
2.7.5. Discussion on enhanced forms of sovereign debt restructuring mechanisms
There is some degree of support among Member States for a reform of the international debt rescheduling system. 12 out 28 Member States see a need to reform the international architecture for the restructuring of sovereign debts in order to deal with potential cases of debt distress in low-income countries. Further work is required to reach an EU common approach on this issue. The German government supports the creation of a debt workout mechanism and wants to promote discussions. Although some parties are calling for a sovereign debt restructuring mechanism by setting up an international arbitration body, Belgium is of the opinion that there is no need for

EN 86 EN
another international body. For Belgium, debt distress in developing countries can be handled within the existing frameworks and principles, in particular the Paris Club and the Debt Sustainability Framework of the Bretton Woods Institutions. Within the Paris Club, Belgium favours broad creditor’ and debtor participation to ensure comparable burden sharing among creditors. Some Member States (Germany for example) feel that a common EU-position must be found. In its dialogue, especially with non-Paris Club countries, the EU should stress that debt sustainability is a shared responsibility of all borrowers and creditors (including emerging economies). Spain argued that a further implication of non-Paris Club members in the debt relief of LICs would be necessary, particularly in light of the growing importance of emerging creditors and even private creditors. Denmark calls for the involvement of non-Paris Club creditors in restructuring and cancel sovereign debt for HIPC countries in the boards of the IMF and the World Bank. Others (Netherlands, UK) are not in favour of a structural sovereign debt restructuring mechanism. They do not see the potential for the EU to take special initiatives, except of course taking part in international discussions. The new debt workout mechanism would be based on the Paris Club but may also involve a role for International Financial Institutions within the Debt Sustainability Framework of the Bretton Woods Institutions. EU Member States have already agreed to discuss these issues but a common EU-position may be needed. On 8-9 April 2010, the OECD, World Bank Group and IMF convened the 11th OECD-WBG-IMF Global Bond Market Forum in Washington D.C. Debt managers and central bankers from 23 advanced and emerging market economies came together with private sector representatives to discuss the post-crisis outlook for government bond markets. Discussions focused on four key areas: i) the impact of crisis-related measures and the potential implications of exit; ii) measuring sovereign risk; iii) the determinants of investor demand; and iv) debt managers’ response to the crisis. Overall, participants felt that the steps taken to stabilise financial conditions had generally been effective and that conditions in financial markets were normalising. Discussions highlighted a number of ongoing risks including:
i) while credible consolidation plans were needed, fiscal and monetary policy could be tightened too soon;
ii) managing investor uncertainty would prove critical in managing risk in the near-term; iii) regulatory changes may lead to a deterioration in conditions in primary and secondary
markets and aggravate the challenges facing debt managers.

EN 87 EN
3. IMPROVING THE EFFECTIVENESS OF SUPPORT TO DEVELOPING COUNTRIES
3.1. Making EU aid more effective
EU Commitments
● On 17 November 2009, the Council (General Affairs and External Relations) adopted the Conclusions on an Operational Framework on Aid Effectiveness, with additions made in June 2010 (cross country division of labour DoL) and December 2010 (accountability and transparency).113 ● The Operational Framework includes detailed commitments on accelerating Division of Labour (DoL); increased use of country systems; ensuring technical cooperation for enhanced capacity development; and strengthening accountability and transparency.
Aid effectiveness is one of the key pillars of development cooperation to which the EU and its Member States are firmly committed. Improving aid effectiveness will augment the quality and impact of aid and contribute to more value for money. The EU and its Member States are working on a range of measures to implement commitments in relation to the Paris Declaration principles and the Accra Agenda for Action. Since 2003 the Commission has reviewed the efforts of all EU donors to implement those commitments. The replies of the Member States to this year’s questionnaire on financing for development114 show that, although some improvements have been made, enhanced efforts are needed to maximise the impact of aid. The Fourth High Level Forum on Aid Effectiveness in Busan in 2011 will review the evidence of implementing aid effectiveness principles in the wider context of development. The EU as a whole will be expected to present results that are in line with the declared EU level of ambition. In November 2009, the General Affairs and External Relations Council adopted an Operational Framework on Aid Effectiveness which contains measures in key areas of the aid effectiveness agenda, such as division of labour, use of country systems and technical cooperation for enhanced capacity development. Based on Commission proposals, the Operational Framework was complemented, in 2010, by a subchapter on cross-country division of labour115 and a new chapter on a common EU approach for implementing commitments on mutual accountability and transparency116. Article 210 of the Lisbon Treaty marks a new era in European development policy; it states that , the Union and the Member States shall coordinate their policies on development cooperation, and consult each other on their aid programmes, including in international organisations and during international conferences, and may undertake joint action, and contribute if necessary to the implementation of Union aid programmes. 113See Council document 18239/10 of 11.11. 2011: . Operational Framework on Aid Effectiveness – Consolidated text. 114To avoid duplication with the ongoing OECD/ DAC Paris Declaration Survey, the Aid Effectiveness chapter in the annual questionnaire on financing for development was substantially reduced. As the results of the OECD/ DAC survey have not been available prior to publication of this report, this chapter includes less detailed information than in previous years. 115Council Conclusions of 14.06.2010. 116 Council Conclusions of 9.12.2010.

EN 88 EN
This is a new opportunity to make EU development aid more effective, efficient, and potent in terms of actual impact on the ground. It should also make a real difference in terms of EU political impact and visibility. A study carried out on behalf of the European Commission117 found that the potential benefits from a European approach (i.e. joint programming, country and cross-country division of labour) towards aid effectiveness could save an estimated EUR 3 to 6 billion per year.
3.1.1. EU and Member States action on ownership
Ownership is the first principle established in the Paris Declaration. Donors committed themselves to respect partner country leadership and help strengthen their capacity to exercise it. Member States (20) emphasised consultation as the main tool to build ownership, followed by support for capacity development (16). Most Member States rely on bilateral negotiations and consultations. Ownership is achieved by aligning strategies and conducting consultations. Germany emphasises at national and international levels the importance of capacity development as a prerequisite for implementing the aid effectiveness principles, and the need to make capacity development support more effective. Capacity development is thus understood as a process whereby systems are enabled to unfold their capability for self-reliant action and management. Sweden highlighted the impact of the choice of aid modalities on ownership. Sweden’s Action Plan on Aid Effectiveness, valid 2009-2011, aims in its entirety to increase the conditions for exercising country leadership/ownership, e.g. by increasing the use of country systems and applying programme-based approaches in Swedish development cooperation. The three-year plan includes a number of measures to achieve seven concrete objectives. The plan includes concrete measures related to staff incentives to work on aid effectiveness.
3.1.2. EU and Member States action on alignment
Increasing alignment of aid with partner countries’ priorities, systems and procedures and helping to strengthen their capacities is a central principle of the Paris Declaration. To improve alignment donors agreed to use country systems (national arrangements and procedures for public financial management, accounting, auditing, procurement, results frameworks and monitoring) to the maximum extent possible. Using a country’s own institutions and systems increases aid effectiveness by strengthening the partner country’s sustainable capacity to develop, implement and account for its policies to its citizens and parliament. Donors also committed themselves to align their conditions, whenever possible, with their partner’s national development strategy, and make them public. Improving the predictability of aid is another aspect of alignment, and donors have committed themselves to disburse aid in a timely and predictable fashion according to agreed schedules. In terms of technical cooperation, donors have agreed to reduce the stock of parallel project implementation units, in order to strengthen the capacities of partner countries. Use of Country Systems (UCS). A study prepared for the third High Level Forum (HLF3) in Accra in 2008118 found that progress in the use of country systems had been limited as only a 3% improvement has been recorded in the aggregate (from 40% to 43%), with almost no change in country averages. The Operational Framework on Aid Effectiveness identified actions (general and
117HTSPE, Aid Effectiveness Agenda: Benefits of a European Approach, October 2009. 118Third High Level Forum on Aid Effectiveness hosted by the Government of Ghana in Accra, 2-4 September 2008. OECD DAC (2008), Working Party on Aid Effectiveness, Joint Venture on Public Financial Management, Report on the Use of Country Systems in Public Financial Management.
EN 89 EN
time-bound) for the EU and its Member States to report on. Progress on some of these actions is reflected in the responses to the questionnaire as follows: On using country systems as a first option119, 15 out of 24 Member States supported the use of country systems through an assessment to identify internal constraints. 11 Member States revised the design of aid instruments irrespective of modality; staff training was provided by 12 Member States and 17 out of 24 Member States supported partner country capacity development for improving the quality of country systems. With regard to additional time-bound actions not covered by the questionnaire, in response to the action on budget support120 the Commission, following the public consultation, launched with the Green Book on the Future EU Budget Support for third countries of 2010, is currently preparing policy proposals on this issue. Likewise, good practice examples on the use of country systems collection by the end of 2010 is covered by the DAC work to which the Commission and the EU Member States contribute. On undertaking Joint Assessments to promote the Use of Country Systems121 16 Member States supported partner country capacity development for improved quality of country systems; 12 Member States conducted joint assessments with others; 16 Member States used methodologies and results from other donor’s assessments; and 11 Member States made methodologies and results from their assessments available to others. EU Member States usually support UCS through:
• Use of general and sector budget support;
• Improving procurement systems to facilitate the actual use of UCS at a later stage’;
• Public finance management (PFM) at sector level, e.g. Finland: strengthening local PFM-systems in the planning phase of its forestry sector project and is now using local PFM systems both in forestry and water sector cooperation; and
• Strengthening of domestic accountability systems (for example through support for Supreme Audit Institutions in several countries).
Many EU Member States do not use country systems due to:
• Lack of quality systems and subsequent fiduciary, political and reputational risk of using country systems (particularly for the treasury);
• Lack of knowledge among staff of different options to gradually use country systems (e.g. CABRI dimensions of putting aid on budget), particularly when systems are still weak and cannot be fully used;
• Trade-off between quick implementation and results-orientation and UCS;
• Overall resource demands/initial labour intensity of increasing use of partners’ systems; and
119 See European Council, 11 January 2011, Doc. 18239/10. Operational Framework on Aid Effectiveness – Consolidated text: paragraphs 6, 8, 12 and 13 (A. Use of country systems as a first option), 120’The Commission and its Member Sates will initiate a dialogue towards a coordinated approach on budget support by early 2010’. 121Consolidated version Operational Framework: B. Undertake joint assessments to promote the Use of Country Systems, paragraphs 14-17.

EN 90 EN
• Difficulty of assessing systems and processes at decentralised/organisational level, making decisions on use or non-use based on incomplete information.
In 2010, the Belgian Development Cooperation (BDC) developed guidelines for using country systems in the field of procurement and financial management. The important aspects of human resource management, quality management (monitoring and evaluation), scope management and coordination management will be dealt with in a second phase. The BDC subscribes to the Accra Agenda for Action and gives priority to the use of country systems. All formulation reports must contain an analysis of the opportunity to use the country public procurement and financial management systems. If the conclusion is that one of the country systems cannot be used, then a donor system should be adopted (ideally in a harmonised way with other donors providing project support in the sector). For the United Kingdom, decisions on the use of country systems are made in the light of DFID’s three partnership commitments (commitment to reducing poverty, meeting human rights and other international obligations, and improving public financial management and accountability) and through dialogue with partner countries and other donors. Use of country systems is the preferred method, providing countries can demonstrate a credible commitment to improving public financial management and accountability. This is assessed as part of a fiduciary risk assessment of the national Public Financial Management and Accountability system, which is obligatory in country planning where financial aid (i.e. use of country PFM systems) is considered. DFID’s approach to this is set out in the How to Note: ‘Managing Fiduciary Risk when Providing Financial Aid’ (December 2009). This provides guidance on assessing country PFM systems, including the use of additional safeguards, which seek to reduce the risk of using country systems while also helping to strengthen them. Changing the nature of conditionality. 13 out of 14 Member States that answered this question said that they harmonised condition with other donors. Only 3 reduced them. Making aid more predictable. Table 12 below presents the ratios between actual ODA flows and budgets prepared one or two years before. Ratios below 100% mean that actual expenditure was below budget, while ratios above 100% are over budget. Table 13 shows that most EU Member States’ aid has achieved a good degree of predictability with ratios above the DAC average both for one-year and two-year predictability. Only Denmark, Ireland, Italy, Netherlands and Spain have a one-year predictability ratio below average. 15 EU Member States can make multi-annual commitments for projects, twelve for general programme based support, and eleven for budget support. For several, outer year budgets are indicative and subject to change (e.g. Ireland).

EN 91 EN
Table 12 – Predictability Ratios of 2009 flows
Predictability Ratios of 2009 flows
One-year predictability ratio
Two-year predictability ratio DAC Members
2009 Outturn/programmed early 2009 (%)
2009 Outturn/programmed early 2008 (%)
Australia 111 134 Austria 100 na Belgium 119 56 Canada 67 97 Denmark 91 101 European Commission 117 100 Finland 103 98 France 107 68 Germany 120 140 Greece na na Ireland 88 48 Italy 60 63 Japan na na Korea 89 na Luxembourg 104 97 Netherlands 85 87 New Zealand 73 86 Norway 71 82 Portugal 97 91 Spain 82 121 Sweden 101 113 Switzerland 99 na United Kingdom 99 86 United States na na DAC Total 93 94
Source: OECD DAC Forward spending plans (2010) 21 Member States stated that they align their technical cooperation to partner country policies and plans.19 make the information on expenditure related to providing technical cooperation (including in-kind technical assistance) available to the general public. EU Member States gave about 22% of their ODA in the form of technical cooperation stand alone projects in 2009, according to data from OECD DAC’s CRS database.
3.1.3. EU and Member States action on harmonisation
Harmonisation refers to cooperation between donors to improve the efficiency of aid delivery. The focus under the Paris Declaration process was initially on how to harmonise rules and procedures and on developing new instruments, including programme-based approaches, pooled funding arrangements, joint country plans and other common arrangements. Experience suggests that organising joint activities with too many donors is often unproductive, and the focus has shifted towards achieving a better division of labour among donors, focusing on areas of comparative advantage, and using silent partnerships and lead donor arrangements elsewhere. EU donors have committed themselves to establishing a more effective division of in-country division of labour. In terms of achieving this goal, joint programming represents a fundamental tool for the EU. In Accra, donors agreed to start a dialogue on cross-country division of labour, and this is also a subject for EU-level action in the Operational Framework. Coordinating missions

EN 92 EN
is also important in terms of harmonisation, since the number of donor missions often represents a serious challenge in terms of the time and resources that must be devoted to these visits. Better in-country division of labour. Since 2008, the EU Fast Track Initiative on Division of Labour and Complementarity (FTI DoL), which involves the European Union and currently 14 Member States as facilitators has supported DoL processes in approximately 30 partner countries. The network of EU DoL is being continuously updated and is regularly used for communication. Work is underway to facilitate better web-based communication and information exchange, fulfilling one of the commitments with regard to DoL adopted in the Operational Framework on Aid Effectiveness122.The 3rd Monitoring Report and Progress Review of the EU Fast Track Initiative on Division of Labour123 and trends since 2008 show encouraging progress, especially in the 19 countries involved since the beginning. There is widespread use and institutionalisation of donor mappings as an aid management instrument, an upward trend in country-level agreement on sector definitions as an important precondition for DoL and solid use of lead donor arrangements that can generate more momentum for DoL. Perceptions of partner country commitment to DoL processes have also somewhat improved. The results of DoL processes are increasingly positive with regard to the quality of sector dialogue and, to a lesser degree, the rationalisation of aid allocations. Responses show an increasing expectation of positive contributions to aid and development effectiveness. Nevertheless, the DoL approach is demanding and takes time to yield measurable results. It still faces challenges with regard to some methodological issues, questions of country ownership and donor commitment. It needs to be better adapted to specific country conditions and integrated with other aspects of the aid effectiveness agenda. An emerging issue concerning HLF 4 is the rapidly increasing importance of ‘new donors’ and ‘new funding lines’ reported from country level. This phenomenon adds to the complexity of the Global Aid and Development Architecture. 12 EU Member States (out of 23 that responded) have fully integrated the principles of the Code of Conduct on Complementarity and Division of Labour (2007) in their strategies, staff guidance and programming processes/guidelines. Another six have done so partially, while only two have not done so yet. Delegated cooperation. 15 out of 23 Member States have legal and administrative arrangements for delegated cooperation in place. As regards the European Commission, Finland’s assessment procedure for indirect centralised management was finalised in June 2010, providing a framework for cooperation between the Foreign Ministry and the European Commission.’ All projects funded by CyprusAid are implemented through the delegated cooperation method. For the following organisations the European Commission assessment procedure to administer EU funds under indirect management has been concluded: Agence Française de Développement (AFD), Deutsche Gesellschaft für Internationale Zusammenarbeit (GIZ), Cooperation Technique Belge (BTC CTB), Austrian Development Agency (ADA), Kreditanstalt fur Wiederaufbau (KfW), UK Department for International Development (DFID), NL Ministry of Foreign Affairs, Instituto Portugues de Apoio ao Desenvolvimento (IPAD), Lux-Development SA, Ministry of Foreign Affairs Finland, Danish Ministry of Foreign Affairs (DANIDA)and the British Council. For the following organisations the assessment is ongoing: France Cooperation Internationale (FCI), Societa Italiana per le Imprese al’Estero (SIMEST), Agencia Española de Cooperación Internacional al Desarrollo (AECID), Fundación Internacional y para Iberoamérica de 122I. Division of Labour, paragraph 4. 123European Commission, The 3rd Monitoring Report and Progress Review of the EU Fast Track Initiative on Division of Labour, Draft Version, February 24 2011.

EN 93 EN
Administración y Políticas Públicas (FIIAPP) and Australian Development Agency (AusAID). Denmark, Finland, Ireland, the Netherlands, Sweden and the United Kingdom subscribe to the Nordic Plus principles124 for delegated cooperation, where Nordic Plus countries have agreed to mutually approve each other as potential partners for delegated co-operation arrangements. The majority of Member States (14 out of 23) do not have a mechanism in place at headquarters level to track cases of delegated cooperation. Improving joint programming. Overall Member States reported 13 cases of joint programming, only five of which involved joint analysis and response strategies according to the EU agreed Common Format for Country Strategy Papers. A recent desk review of the experience with joint programming125 found that there has been a lack of progress in implementing joint programming. Joint programming differs greatly from country to country. Experiences range from agreeing a strategy (e.g. Sierra Leone, Somalia) to harmonising approaches at sector/programme level. These findings are confirmed by the 2011 survey. Only 13 Member States out of 27 are currently involved in joint programming exercises. Reasons for not participating vary. Cyprus, for example, does not do programming directly but participates in programming of Lead Donors through delegated cooperation. Malta works directly with NGOs. Poland and Romania cannot carry out multi-annual programming due to the fact that ODA budget allocations are annual. The United Kingdom is involved in joint programming in a number of countries, such as Bangladesh, where a joint cooperation strategy involving the government and 17 development partners including the UK was signed in 2010. Other examples are Afghanistan, Kenya, Nigeria, Uganda, Zambia, which all use different models depending on the country context. In South Africa, the UK is signed up to a Country Strategy Paper that is in line with the 2006 Council Conclusions. Cross-country division of labour. The Commission survey revealed that in recent years, EU Member States have reorganised their bilateral aid portfolios by refocusing their assistance, often in the presence of stable or increasing aid budgets. There are 123 cases of planned exits by EU Member States from 69 partner countries. Italy, Sweden, Spain and the United Kingdom accounted for three quarters of the exit cases. There seem to be only five cases of EU Member States currently starting a new bilateral aid relationship. Once EU Member States leave a country, some ODA that is counted as country programmable aid - CPA (e.g. cultural cooperation, scholarship via state programmes, special education schemes like German schools abroad) and some ODA that does not count as CPA (ODA through NGOs and Civil Society, imputed student cost, equity capital investment) may remain. Exit takes time. In the case of the German cooperation, partner governments and other donors are informed and if possible consulted, as the exit period lasts normally for several years. It allows for orderly conclusion of activities, achievement of intended results and, if possible, other donors to take over certain support schemes.
3.1.4. EU and Member States action on mutual accountability
Mutual accountability lies at the heart of the Paris Declaration, and is a process by which two (or multiple) partners agree to be held responsible for the commitments that they have voluntarily made to each other. It helps build trust and partnership around shared agendas and provides incentives for
124 These are principles developed to enhance aid effectiveness. Delegated cooperation is aimed at significantly reducing the transaction costs for both partner governments and donors. http://www.norad.no/en/ (Norad - Norwegian Agency for Development Cooperation) 125European Commission, IQSG Secretariat, DG DEV A, State of Play of EU Joint Programming of External Assistance - Desk Study of Recent Experiences, 2010.

EN 94 EN
behaviour change needed to achieve better results. A central aspect is making aid flows more transparent. Likewise, as stated in the Operational Framework126 'in the Accra Agenda for Action, donors and partner countries agreed to provide timely and detailed information on current and future aid flows in order to enable more accurate budget, accounting and audit by developing countries’. Improving mutual accountability. A 2010 study127 of national mutual accountability initiatives in 70 countries found that only 8 partner countries made major progress on mutual accountability, 52 partner countries do not have an aid policy or agreed document outlining targets for ODA providers, and 32 partner countries had an aid information management system in place. In almost all countries, non-DAC donors, global funds and NGOs do not supply data to aid management systems. Joint frameworks for monitoring joint commitments have been set up in at least 15 priority countries for EU Member States (i.e., Bhutan, Burkina Faso, Cape Verde, Ethiopia, Ghana, Kenya, Malawi, Mali, Mozambique, Nicaragua, Peru, Rwanda, Tanzania, Uganda, and Zambia). They are either formal frameworks or policy dialogue groups. In 2010, for example, the United Kingdom worked with other partners to establish and review mutual accountability frameworks in a number of countries including Ghana (aid policy and joint donor Performance Assessment Framework), Bangladesh (joint cooperation strategy), Uganda (to help develop an aid policy and joint Memorandum of Understanding ), Nepal (the joint transparency and accountability initiative with the UN and a number of bilateral donors) and Zambia (to develop a new Joint Assistance Strategy). Making aid more transparent. Increased reporting on ODA flows. Most EU non-DAC donors report their ODA to the OECD/DAC. The Commission encourages all of them to do this, in line with DAC reporting rules, although none of the EU-12 is yet a DAC member. Bulgaria and Malta have yet to start reporting systematically to the DAC. The Commission will continue to work with the DAC secretariat to provide support to the EU’s non-DAC donors to enhance their statistical reporting capacity. The European Commission and several Member States (Denmark, Finland, Germany, Ireland, Netherlands, Spain, Sweden and the United Kingdom) are party to the International Aid Transparency Initiative (IATI) launched in 2008 at Accra. IATI’s role is to develop consistent and coherent international standards for the way donors report more timely information on past and future aid spending. 21 out of 22 Member States make their ODA volumes public on their websites, often in an annual report. Member States mentioned several good examples of ODA data tools. In Mozambique the Government of Mozambique Medium-Term Expenditure Framework (MTEF) and Budget processes, in Ethiopia the Development Assistance Group (DAG) and EU, in Vietnam, the EU annual blue book exercise and annual Ministry of Foreign Affairs report. For the Netherlands, an important tool to disclose information on aid volumes is the Bi-annual Results Report that presents the results achieved and the Dutch policy and philosophy on giving aid. The report is meant to inform parliament, stakeholders and the public. The Results Report is coproduced by the Ministry of Foreign Affairs and Dutch CSOs.
3.1.5. EU action on managing for development results
The promotion of management for development results (MfDR) is central to the entire aid effectiveness agenda. It means that stakeholders hold partner country governments and donor agencies accountable to show results, i.e. to demonstrate the effectiveness and actual impact of aid. 126Consolidated version: IV Accountability and transparency, paragraph 1 127UN Development Cooperation Forum (DCF), Review of Progress in International and National Mutual Accountability and Transparency on Development Cooperation, May 2010.

EN 95 EN
It means that donors and recipients oblige each other to demonstrate that they are honouring their commitments and promises. 12 Member States (out of 23 who replied) provide support for MfDR. The results approach suffers from an over elaborate and technical approach focused on donors and their capacity. Donor countries are struggling to demonstrate their attribution rather than their contribution to partner countries’ results. Donors could increase support to partner countries to focus on results (improving statistical data, analytical capacity etc) and then use these results to communicate to the public the successes and challenges of their development cooperation programmes Sweden felt that the aid effectiveness agenda needed to be more specific to different cooperation contexts, particularly in conflict and post-conflict countries and in reform cooperation with Europe, including how the reporting and measurement of results is conducted.
3.2. Supporting better Global Governance
EU Commitments March 14, 2002 European Council Conclusions on the International Conference on Financing for Development. To influence the reform of the International Financial System by combating abuses of financial globalisation, strengthen the voice of developing countries in international economic decision-making, and, while respecting their respective roles, enhance coherence between the UN, International Financial Institutions and the WTO.
3.2.1. Introduction
The objective of this Chapter is to give an update of the reform initiatives in the main International Financial Institutions (namely the World Bank, IMF, and to a lesser extent, other key multilateral development banks), as well as the UN and its specialised agencies. The reform of these institutions was accelerated by perceived shortcomings in the international financial and monetary architecture revealed by the global financial and economic crisis in 2008-2009, the effects of which continue to be felt today and are further exacerbated by increases in commodity prices in early 2011. An objective would be to ensure more effective and coordinated management of global issues, such as financial stability, food and energy security, climate change and the fight against major pandemics. The main challenge is to strike the correct balance between legitimacy (through representativeness and accountability) and the effectiveness of global institutions. The way forward that the Commission proposed in 2010128 was as follows:
• The Commission will monitor emerging discussions on how best to use the general SDR allocations, in particular to the benefit of low-income countries.
• In line with the decision taken by the G20 and the Joint World Bank/IMF Development Committee, the EU and other Governors on the Boards need to ensure that the increases in developing and transition countries voting shares are implemented swiftly in both institutions and that the IMF quota is revised.
128 COM (2010) 159 of 21.04.2010 and Statement of Commissioner Piebalgs at the World Bank/ IMF Development Committee meeting in April 2010

EN 96 EN
• Europe’s voice international financial institutions should be amplified through consolidated, less fragmented European representation, with the ultimate objective of having a single European seat at the IMF and the World Bank. EU coordination should be stepped up, particularly within regional development banks.
• The replenishments for concessional arms of Multilateral Development Banks such as the IDA at the World Bank Group and the African Development Fund at the African Development Bank are of particular concern regarding assistance to the most vulnerable.
• The ’UN system-wide coherence reform’ needs support in order to reduce fragmentation of the UN to strengthen its operational capacity and improve its efficiency at headquarters and in the countries where it operates.
The next section presents the key reforms in the above areas undertaken in Multilateral Institutions. It sets out the points of view of the European Commission and Member States, based on their responses to the relevant part of the questionnaire.
3.2.2. Reforming multilateral institutions
3.2.2.1. IMF129
The 2008 quota and voice reform was the first step towards realigning IMF members’ quotas with their relative positions in the world economy. On 16 December 2010, the IMF’s Board of Governors approved a far-reaching quota and governance reform130. Once implemented (no target date so far), the reform package will result in: (a) a doubling of quotas; (b) a shift of more than 6%of quota shares to dynamic emerging market and developing countries, Brazil, China, India, and Russia will be among the 10 largest shareholders in the Fund, while the combined voting share of the US and EU Members will fall below 50%, and (c) preserving the quota and voting share of the poorest member countries. A comprehensive review of the current quota formula will be completed by January 2013. Completion of the 15th General Review of Quotas will be brought forward by about two years to January 2014. Any future realignment is expected to result in increases in the quota shares of dynamic economies in line with their relative positions in the world economy. New concessional facilities for Low Income Countries (LICs) were established in January 2010 under the Poverty Reduction and Growth Trust (PRGT) as part of a broader reform to make the Fund’s financial support more flexible and better tailored to the diverse needs of developing countries. Access limits and norms were broadly doubled. Financing terms were made more concessional, and the interest rate will be reviewed every two years. All facilities support country-owned programmes aimed at achieving a sustainable macroeconomic position consistent with strong and durable poverty reduction and growth. These facilities are as follows: (a) The Extended Credit Facility; (b) The Standby Credit Facility (SCF); and (c) The Rapid Credit Facility (RCF). The 2010 reforms do not fully address the existing agenda. One major ongoing effort is for any future competition for the leadership of the IMF to become more open. All of the Fund’s ten Managing Directors have been European. All eight of the Deputy Managing Directors (First Deputies since 1994) have been from the United States. For the past decade, while non-European candidates for Managing Director have been nominated but ultimately rejected, pressure has been intense for the selection process to be fully open to all candidates regardless of geography. The
129See summary posted in December 2010 http://blog-imfdirect.imf.org/2010/12/28/2010-the-year-of-imf-reform/ 130http://www.imf.org/external/np/exr/facts/pdf/quotas.pdf

EN 97 EN
IMF’s Executive Board, which selects the Managing Director, agreed in principle several years ago to open up the process, but winning higher political support for the reform has not been easy. EU members are ready to participate in changing the process of appointing the Heads of the International Financial Institutions (IFIs). The heads and senior leadership of all IFIs should be appointed through an open, transparent and merit-based process, irrespective of nationality and gender. This change should apply to all IFIs including the IMF and the World Bank.
3.2.2.2. World Bank (WB) Group
On April 25 2010, the Development Committee endorsed WB general and selective capital increases equivalent to EUR 66.7 billion131 (USD86 billion). The IDA16 replenishment was concluded with an 18% increase (compared to IDA15) for a total amount of EUR 38.2 billion (USD49.3 billion). The World Bank’s governance reform is to be implemented in two phases, the first of which has already been approved and is under implementation. The package aims to create a new WB Group that is strategically focused on where it can add most value, has 21st century governance, remains financially strong, and is more responsive, innovative and accountable. This will be pursued through the following additional measures:
• Shifting voting power for developing and transition countries (DTCs) to 47.19% for the International Bank for Reconstruction and Development (IBRD), representing a total shift of 4.59% to DTCs since 2008132;
• The Bank's private-sector arm, the International Finance Corporation (IFC,—significantly increasing DTC voting power from 33.4% at present to about 40%;
• International Development Association (IDA)—raising the voting shares of borrowing member countries from about 40% prior to the reforms to around 46%;
• Multilateral Investment Guarantee Agency (MIGA)—maintaining voting power parity between developed and developing members;
• In all institutions, helping the smallest poor members to maintain their voice and voting power;
• Establishing unique IBRD Shareholding Principles, primarily reflecting evolving economic weight and the Bank’s development mission, including: (a) economic weight in the world economy, measured through a formula which is compatible with - but also suitably different from - IMF quotas; (b) integrated, substantive and permanent recognition of past member contributions to IDA, combined with incentives for future IDA contributions; and (c) moving over time towards equitable voting power between developed country and DTC members;
• Holding regular IBRD and IFC shareholding reviews every five years to allow for more dynamism and to account for changes in economic weight and member contributions to the World Bank Group mission;
• Amplifying the DTC voice on the World Bank Boards by adding a third Director to represent member countries in Sub-Saharan Africa in October 2010;
131 Using an average 2010 US$/Euro exchange rate of 0.775. 132http://siteresources.worldbank.org/DEVCOMMINT/Documentation/22553921/DC2010-006(E)Voice.pdf http://siteresources.worldbank.org/DEVCOMMINT/Documentation/22553921/DC2010-006(E)Voice.pdf

EN 98 EN
3.2.2.3. Regional Development Banks
EU countries also play a major role in the financing and governance of the regional development banks listed below. These institutions play an important role in transferring aid flows to developing countries and European countries in transition. They have recently risen to the twin challenges of carrying out their mandate of reducing poverty and at the same time responding to the adverse effects of the economic crisis and its impact on economic growth in many countries. African Development Bank (AfDB). Donors concluded negotiations of the Twelfth Replenishment of the African Development Fund (ADF-XII) in October 2010. They agreed133 on a replenishment level equivalent to EUR 7.4 billion (USD 9.5 billion) for the ADF over the next three years (2011-2013), a 10.6% increase in donor contributions over ADF-11. This came as an important complement to the endorsement on May 27 2010 by governors representing AfDB’s shareholders of a tripling of the Bank’s capital resources to nearly USD100 billion134. Asian Development Bank (ADB). The Asian Development Bank’s (ADB) Board of Governors had already agreed in 2009 to triple ADB’s capital base from EUR 42.7 billion to EUR 127.9 billion (USD 55 billion to USD 165 billion).135 The negotiations on the replenishment of the Asian Development Fund (ADF X) are due to commence next year. ADF IX mobilised over EUR 8.5 billion (USD 11 billion136). Inter-American Development Bank (IDB). The IDB’s Board of Governors on July 21 2010, agreed to the terms of the increase of the Bank’s ordinary capital by EUR 54 billion (USD 70 billion). European Bank for Reconstruction and Development (EBRD). A capital increase from EUR 20 billion to EUR 30 billion was agreed in May 2010.
3.2.2.4. UN System
The 2010 annual progress report on Financing for Development137 noted that ’The systemic reforms decided at the 2005 World Summit have yet to be fully implemented.’ The reforms envisaged improving the transparency, representativeness and effectiveness of the principal UN bodies and included major challenges, such as reform of the Security Council and establishment of a Human Rights Council, as well as the challenge of achieving system-wide coherence by improving the coherence of operational activities. Some progress has been made during 2010. The system-wide coherence reform (SWC) is important to reduce fragmentation of the UN system and strengthen its operational capacity by improving coordination between agencies and reducing fragmentation. The ‘delivering as one’ initiative138 announced in 2007 and implemented in 8 pilot countries is intended to make the UN more coherent, effective and efficient. This process, strongly supported by the EU, has moved relatively fast and created an important ‘bottom-up’ momentum. Furthermore the call for UN system-wide coherence has led many UN entities to develop intra-UN partnerships and cooperation. Building on the positive experience of the pilot countries and the
133http://www.afdb.org/en/news-events/article/african-development-fund-replenished-with-usd-9-5-billion-7335/#;
http://www.afdb.org/en/news-events/article/african-development-fund-replenished-with-usd-9-5-billion-7335/# 134http://www.afdb.org/en/topics-sectors/topics/capital-increase/; http://www.afdb.org/en/topics-sectors/topics/capital-increase/. 135http://www.adb.org/Documents/Brochures/InFocus/2010/General-Capital-Increase-V.pdf;
http://www.adb.org/Documents/Brochures/InFocus/2010/General-Capital-Increase-V.pdf. 136http://www.adb.org/adf/highlight.asp , http://www.adb.org/adf/highlight.asp. 137http://ec.europa.eu/development/icenter/repository/SEC_2010_0420_COM_2010_0159_EN.PDF;
http://ec.europa.eu/development/icenter/repository/SEC_2010_0420_COM_2010_0159_EN.PDF. 138http://www.undg.org/?P=7.

EN 99 EN
progress made on UN business practices by heads of UN agencies, funds and programmes, the SWC agenda has managed to move forward. However, the results of this initiative have yet to be assessed through a performance evaluation. Other important reform processes, also framed in the context of SWC, have made major progress, such as the humanitarian reform and the reform of the UN gender architecture. The humanitarian reform process launched by the international humanitarian community in 2005 seeks to improve the effectiveness of humanitarian response by ensuring greater predictability, accountability and partnership. To strengthen the foundation for understanding the process, Regional Office for Asia Pacific (ROAP) conducts workshops on humanitarian reform at regional and national level to promote regional and country-level progress towards humanitarian reform and create dialogue between policy-makers and practitioners on the reform. The key elements of the reform are: (1) the Cluster Approach; (2) a strengthened Humanitarian Coordinator (HC) system; (3) more adequate, timely, flexible and effective humanitarian financing; and (4) the development of strong partnerships between UN and non-UN actors. On 2 July 2010, the General Assembly unanimously adopted the resolution on ’System-wide coherence’ establishing the new UN Entity for Gender Equality and the Empowerment of Women, to be known as UN Women. With the adoption of this resolution, the new entity will be in a position to close the current gap between the normative and operative work of the UN on gender aspect, promote effective system-wide mainstreaming in the UN system, and improve accountability. There are also reforms to strengthen UN accountability in a process initiated about five years ago139. Achievements during 2010 were as follows:
• Transparency and Integrity: (a) The UN has implemented a financial disclosure programme for senior officials and procurement officers to ensure that potential conflicts of interest that may arise from staff members’ private holdings, affiliations, or activities can be identified and addressed appropriately; and (b) the UN issued a policy on the ’Reporting, Retaining and Disposing of Honours, Decorations, Favours, Gifts or Remuneration.’
• Procurement: The UN amended the Award Review Board and formed the Senior Vendor Review Committee to strengthen internal control, transparency, accountability and risk mitigation in the UN procurement process.
• Ongoing Commitments: Currently, the Department of Management is undertaking a comprehensive review of delegation of authority; and (b) the UN is introducing the International Public Sector Accounting Standards (IPSAS) to improve the quality and transparency of financial reporting. WFP has adopted these standards and, due to delays, other agencies are expected to complete roll-out by 2013.
3.2.3. Feedback from the EU and Member States
There were 12 questions in the EU and Member State questionnaire that related to governance reforms at the World Bank and IMF. This section reports feedback received from 27 Member States and the EU. Very few of the respondents chose not to answer each question. The responses show a diversity of opinions and differences on key approaches that would need to be reconciled for the EU
139http://www.un.org/en/strengtheningtheun/accountability.shtml;
http://www.un.org/en/strengtheningtheun/accountability.shtml

EN 100 EN
group to adopt a consensus towards the Bretton Woods institutions. Details of the questionnaire and responses may be found in Annex 8. With respect to World Bank reforms, some issues were raised repeatedly. The key concerns and proposals were as follows: (a) decentralisation of the Bank; (b) use of results-based approaches for greater effectiveness; (c) fairer voting power/greater voice for developing countries; and (d) open selection of Bank President (and of senior management). There were also multiple mentions of using a corporate scoreboard and the importance of improved internal governance. Overall, this agenda seems aligned with ongoing reforms and issues highlighted in the previous section. On the issue of quota realignment at the IMF, 16 Member States (out of 27 replies) felt it would increase the institution’s legitimacy. However, 11 Member States disagreed. Many in the latter group felt that the reforms did not go far enough. Others were concerned by the increased importance of the G20 and the diminishing role for small economies. A number thought ministers should be more involved in decisions. This issue was raised specifically in question 75 (do you support the creation of a Ministerial Council for the IMF with decision-making powers?) with 16 of 25 respondents in favour. Finally, a few were concerned that the IMF may be drifting away from its core mandate, even though others thought it should expand that mandate. The issue of broader governance reform and open selection of head of IMF was also mentioned. Respondents were equally split over whether the EU should have a single representation at the International Financial Institutions (IFIs). Feedback provided showed that countries had concerns such as: (a) a single euro area representation may make more sense, especially at the IMF; (b) how would intra-EU coordination will work and conversely existing coordination mechanisms seemed sufficient to others; (c) need to preserve specific separate interests of individual shareholders and of small countries; (d) a potential difficulty is mobilising funding; and (e) loss of synergies within current constituency groups, some of which include non-EU countries. Many of these concerns were also expressed as risks to overcome by countries that were in favour of a single representation, at least for the euro area. The need to reach a common position was mentioned again as a challenge. Related to the coordination issue, almost three-quarters of respondents felt there should be stronger Brussels-based coordination on World Bank and MDB issues. Three respondents were dissatisfied with the outcome of voice and participation reforms at the World Bank and five were highly satisfied. The remaining two-thirds were somewhat satisfied. Nevertheless, major concerns and observations were raised by respondents that were less than very satisfied, in particular: (a) insufficient recognition of the efforts of smaller states and the need to give adequate weight to IDA contribution; (b) poorer countries may have been left-out; and (c) the process should have been less complex/confusing and more transparent. A small majority of EU Member States (59%) felt that the EU should push for a greater portion of IDA resources to be allocated to Sub-Saharan Africa. In the absence of a follow-up question, the reasons for the negative answers cannot be determined. As this may be due to a concern over aid effectiveness or other reasons, a follow-up question to this effect could be included in subsequent questionnaires. In contrast, the overwhelming majority (93%) were in favour of creating of a permanent IDA crisis window (CRW) and at the time of writing this reform has now been agreed to.
3.2.4. Concluding Observations
In 2010, two major risks faced by the IFIs were effectively mitigated. Capital increases were successful and so was the replenishment of IDA, the biggest IFI concessional lending window. IFIs

EN 101 EN
are continuing to implement governance reform programmes, give greater voice to their borrowing member countries and promote stronger inclusiveness and accountability. The World Bank’s decision to open more documents and databases to the public is also noteworthy. In terms of the UN, it is important not to lose the momentum of reforms; especially regarding adoption of International Public Sector Accounting Services (IPSAS). An issue not addressed in the above analysis but worth mentioning here concerns another type of financing of IFIs and other international agencies through multi-bilateral resources – bilateral funding disbursed through multilateral agencies. These resources in practice increase the amount of concessional resources available for developing countries. However, these earmarked resources also contribute to the fragmentation of donor programmes and may affect IFIs and UN agencies’ governance and distort resource allocation. For example on the estimated budget for a given agency or programme, only about one-third of it comes from untied ‘core’ resources. The rest are earmarked for specific projects, some quite small, in target countries and for activities that may not be fully aligned to that agency’s core competencies. Furthermore, the agency Executive Board only approves the core budget, which leads to limited oversight over the majority of the resources. The feedback from EU Member States proved useful. It also identified significant differences on key issues that would need to be resolved for the EU 27 Member States to speak with the same voice at the Boards of the IMF and the World Bank. Most Members States agreed that the EU internal coordination should be improved. While a limited consolidation of European representation looks likely to take place in the IMF, a specific intra-EU coordination in the World Bank and multilateral development banks could be warranted.