energetics & stoichiometry of plankton production bas kooijman dept theoretical biology vrije...
Post on 19-Dec-2015
218 views
TRANSCRIPT
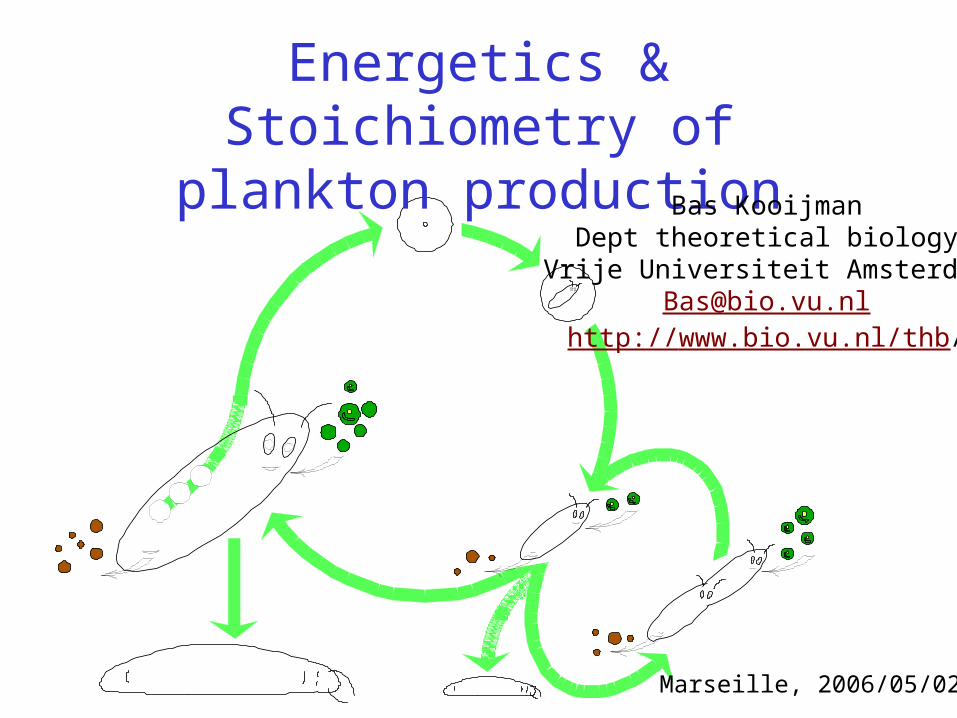
Energetics & Stoichiometry of plankton production
Bas KooijmanDept theoretical biology
Vrije Universiteit [email protected]
http://www.bio.vu.nl/thb/
Marseille, 2006/05/02
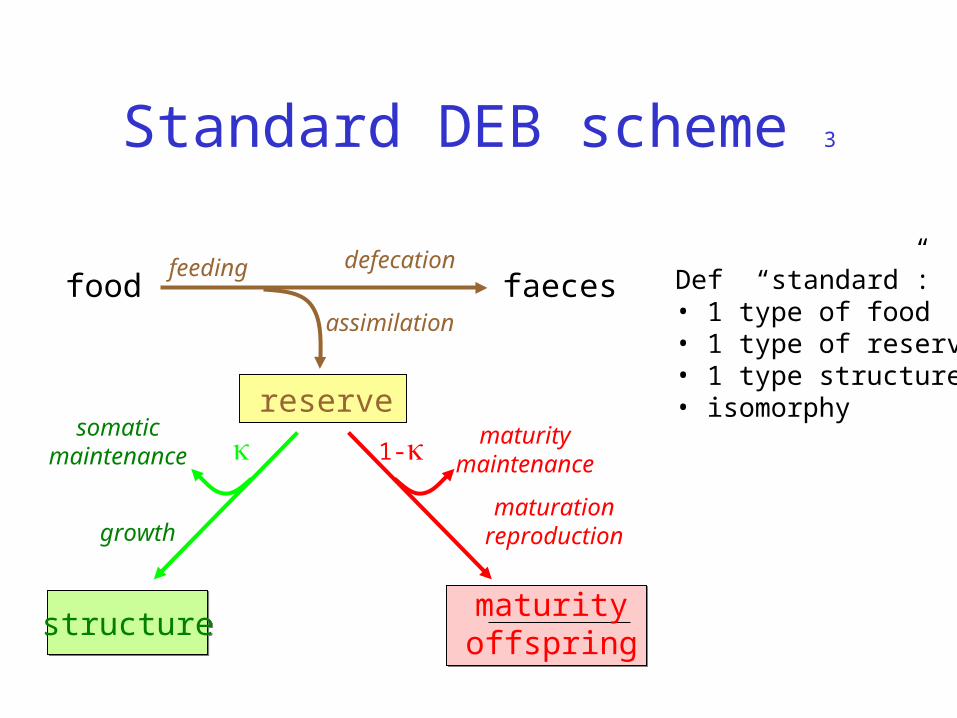
1- maturitymaintenance
maturityoffspring
maturationreproduction
Standard DEB scheme 3
food faecesassimilation
reserve
feeding defecation
structurestructure
somaticmaintenance
growth
Def “standard”:• 1 type of food• 1 type of reserve• 1 type structure• isomorphy
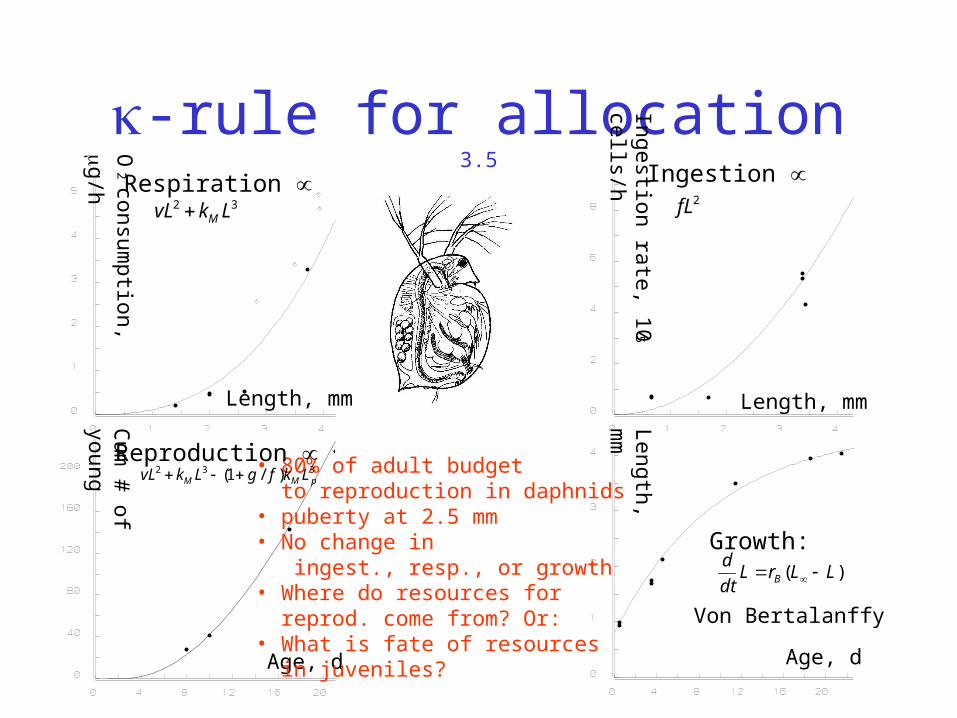
-rule for allocation 3.5
Age, d Age, d
Length, mm Length, mm
Cum
# of young
Length,
mm
Ingestion rate, 105
cells/h
O2 consum
ption,
g/h
• 80% of adult budget to reproduction in daphnids• puberty at 2.5 mm• No change in ingest., resp., or growth • Where do resources for reprod. come from? Or:• What is fate of resources in juveniles?
Respiration Ingestion
Reproduction
Growth:
32 LkvL M2fL
332 )/1( pMM LkfgLkvL
)( LLrLdt
dB
Von Bertalanffy

Growth at constant food 3.7
time, d ultimate length, mm
leng
th, m
m
M
M
δfVfLLvLδkr
trLLLtL
mm
MB
Bb
//33
)exp()()(
3/1
11
LLLt
b
Mδkvr
M
BtimeLengthL. at birthultimate L.
von Bert growth rateenergy conductancemaint. rate coefficientshape coefficient
vδ /3 M
Von
Ber
t gro
wth
rat
e -1, d
13 Mk
Von Bertalanffy growth curve:

Embryonic development 3.7.1
time, d
wei
ght,
g
Salmo truttaData from Gray 1926
yolkembryo

Occur if cumulated investment into maturation exceeds a threshold
This also occurs at a fixed amount of structure if
For all other values: amount of structure at stage transition depends on food history
Stage transitions

Anchovy Engraulis encrasicolus
time, d
leng
th, c
m
0.16 cm 0.22 cm
0.4 cm
0.9 cm
1.2 cm
>4 cm
embryo
Laure PecquerieIfremer, Nantes
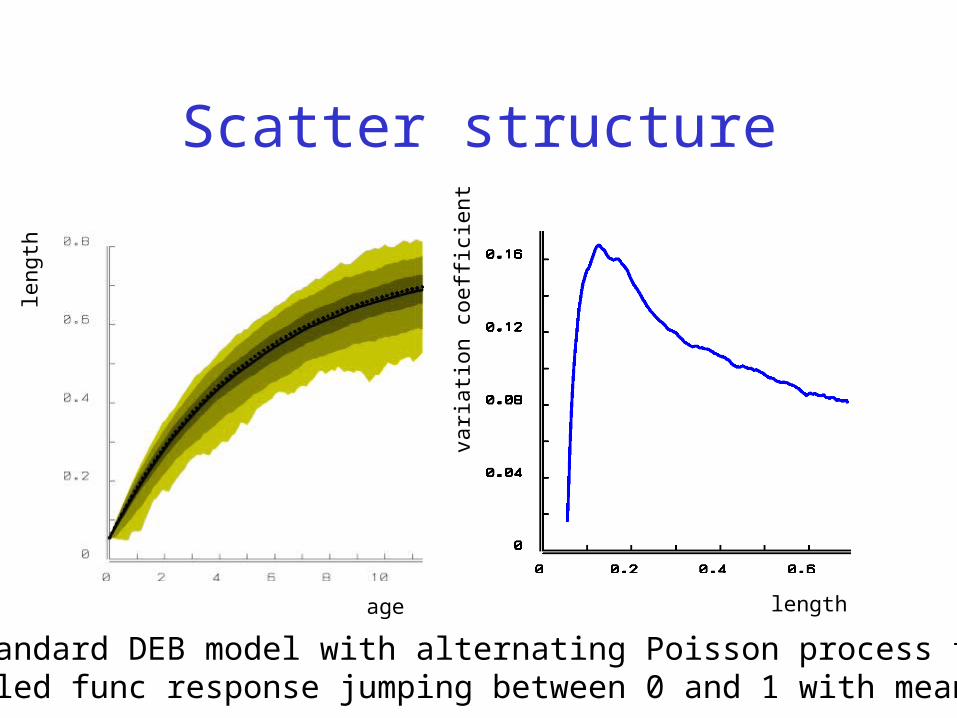
Scatter structure
age length
leng
th
vari
atio
n co
effi
cien
t
standard DEB model with alternating Poisson process forscaled func response jumping between 0 and 1 with mean .7
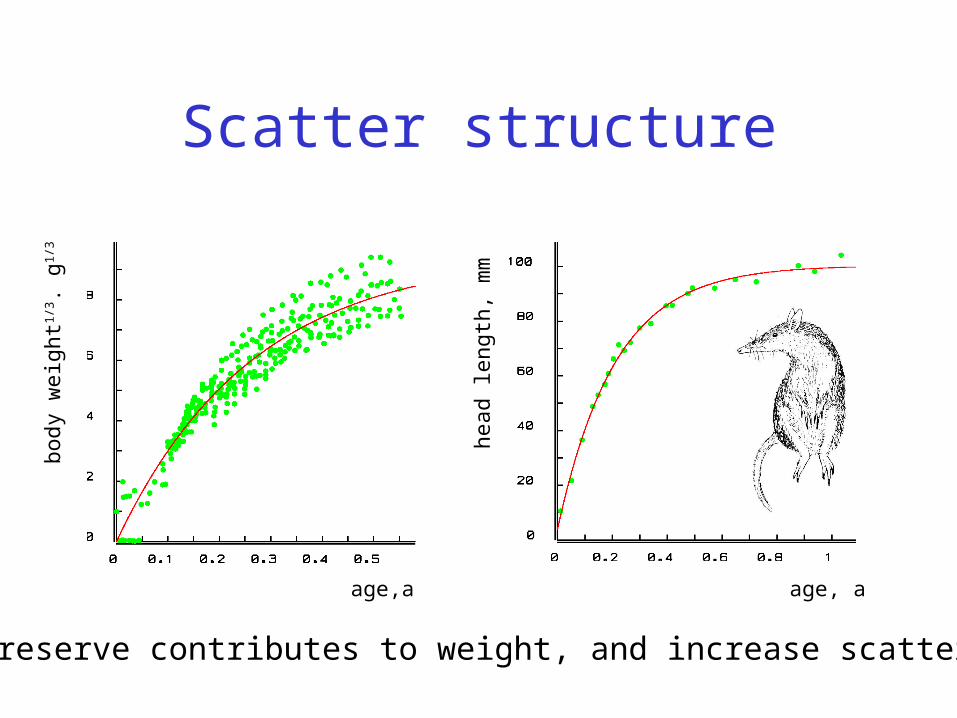
Scatter structure
age,a age, a
head
leng
th, m
m
body
wei
ght1/
3 . g1/
3
reserve contributes to weight, and increase scatter

Seasonal forcing
time, d time, d
Chl
o a,
mg
m-2 d
-1
tem
pera
ture
, K
Laure PecquerieIfremer, Nantes

Growth & reproduction
Born early in spawning seasonBorn in the middle of spawning seasonBorn end of spawning season
time, d time, d time, d
leng
th, c
m
wei
hgt,
g
kilo
egg
s
scal
ed r
eser
ve d
ensi
ty
repr
oduc
tion
buf
fer
cum
. rep
rod,
k-e
ggs
Laure PecquerieIfremer, Nantes

Growth data
• 2001-2005
• 3700 individuals
• L, W , otoliths
L, m
m
age, years
17001300
510 40
230
Laure PecquerieIfremer, Nantes

Growth for length
total length, cmchan
ge in
tota
l len
gth,
cm
/d
First yearSecond yearThird year
otolith radius at ring 1
radi
us b
etw
een
rin
g 2
and
1
measured
simulated
Problems:Age 1 grows before spawning; equally sized Age 2 & 3 do notScatter in length does not decrease with length
simulated
Solution:parameter variation among individualsvariation in time of birthhalf saturation constant linear in length
Laure PecquerieIfremer, Nantes

Short vs long-term nutrient uptakeMorel 1987 on nutrient uptake in algae
Variant that is consistent with DEB/Droop

Variable biomass compositionConsumers feed on producers with multiple reserves rules to convert prod structure + reserve cons reserve(s)
If we delineate carbohydrate and protein reserve partial substitutable for paying maintenance costs fully substitutable with structure
Rules for excretion of rejected reserve and fate specification
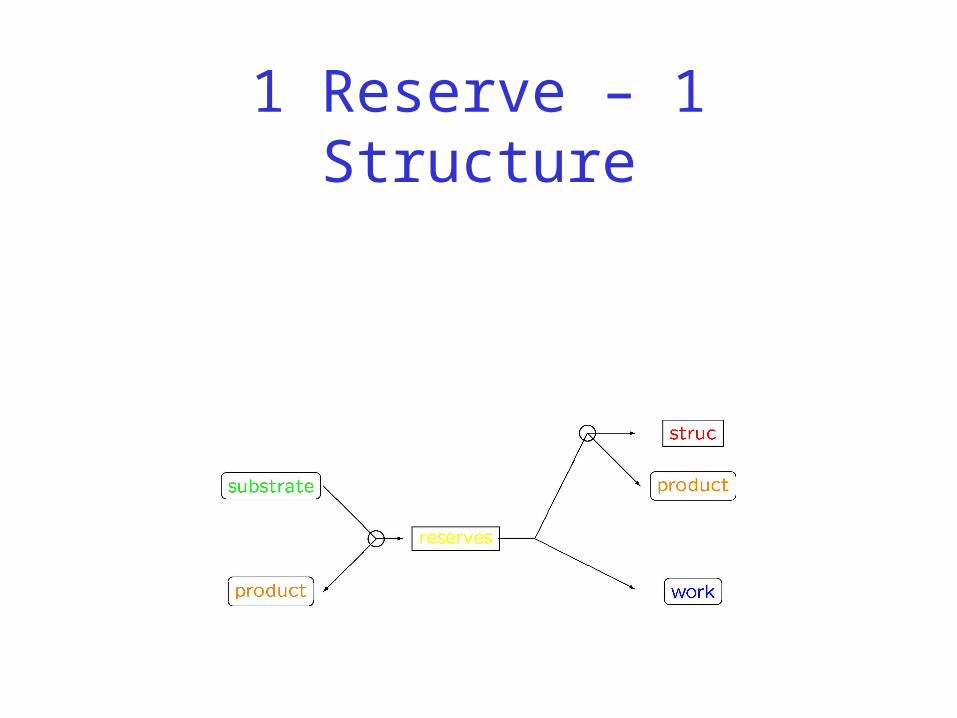
1 Reserve – 1 Structure

2 Reserves – 1 Structure

Producer/consumer dynamics 9.2.1
PnCnNPm
ChrCdt
d
CjPrPdt
d
NPNCN
C
PAP
)(
PK
jj
my
kr PAm
PANNP
NP /1
;1
CNCPCNCPC rrrrr
1111
MNPANCNCNMPPACPCP kjmyrkjyr ;
producer
consumer
nutr reserveof producer
: total nutrient in closed system
N
h: hazard rate
CPCCN rry special case: consumer is not nutrient limited
spec growthof consumer
Kooijman et al 2004 Ecology, 85, 1230-1243
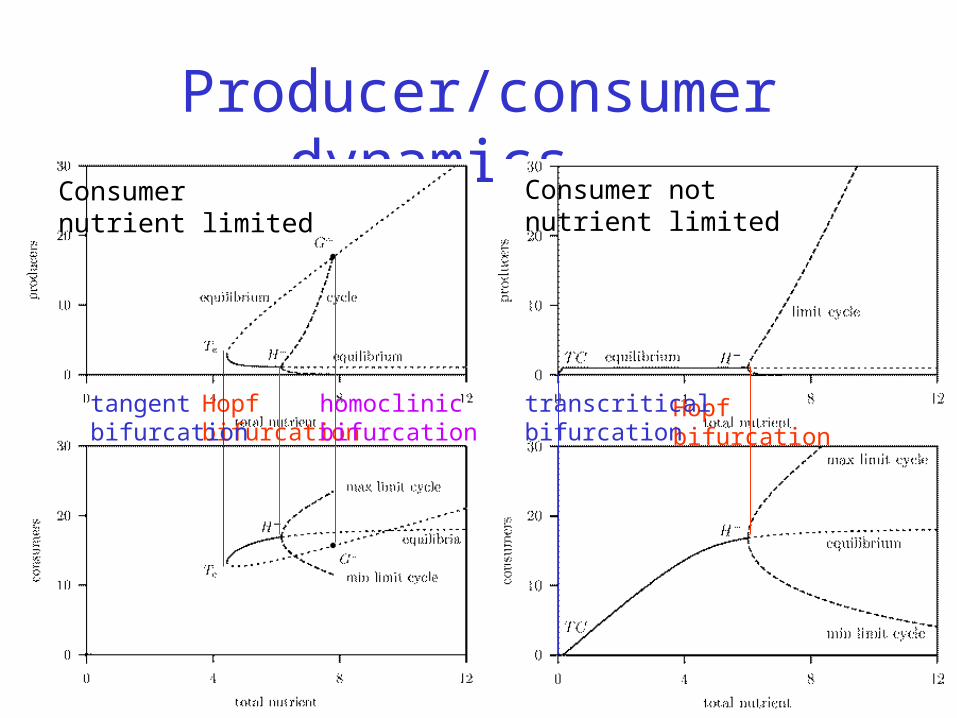
Producer/consumer dynamics 9.2.1
Consumer nutrient limited
Consumer notnutrient limited
Hopf bifurcation
Hopf bifurcation
tangent bifurcation
transcritical bifurcation
homoclinicbifurcation

Producer/Consumer Dynamics 9.2.1
Deterministic model
Stochastic model
in closed homogeneous system
Kooijman et al 2006 TPB, subm

Producer/Consumer Dynamics 9.2.1
0 2 4 6 8
0
10
20
consumers
nutrient
1.75 2.3 2.4
2.5
2.7
3.0
1.23
1.15
1.0
2.81.231.53
tang
ent
focu
s
Hop
f
Bifurcation diagram
isoclines
DEB tele course 2007http://www.bio.vu.nl/thb/deb/
Free of financial costs; some 250 h effort investment
Feb-April 2007
Target audience: PhD students
We encourage participation in groups that organize local meetings weekly French group of participants of the DEB tele course 2005: special issue of J. Sea Res. on DEB applications to bivalves
Software package DEBtool for Octave/ Matlab freely downloadable