the application of deb theory to fish energetics bas kooijman dept theoretical biology vrije...
Post on 20-Dec-2015
214 views
TRANSCRIPT

The application of DEB theory to fish energetics
Bas KooijmanDept theoretical biology
Vrije Universiteit [email protected]
http://www.bio.vu.nl/thb
Sète, 2005/01/12

Contents• DEB theory introduction
• Allocation & growth
• Body parts
• Scaling
• Schooling
Sète, 2005/01/12

Dynamic Energy Budget theoryfor metabolic organisation
Uptake of substrates (nutrients, light, food) by organisms and their use (maintenance, growth, development, reproduction)
First principles, quantitative, axiomatic set upAim: Biological equivalent of Theoretical Physics
Primary target: the individual with consequences for• sub-organismal organization• supra-organismal organizationRelationships between levels of organisation
Many popular empirical models are special cases of DEB
molecule
cell
individual
population
ecosystem
system earth
time
spac
e
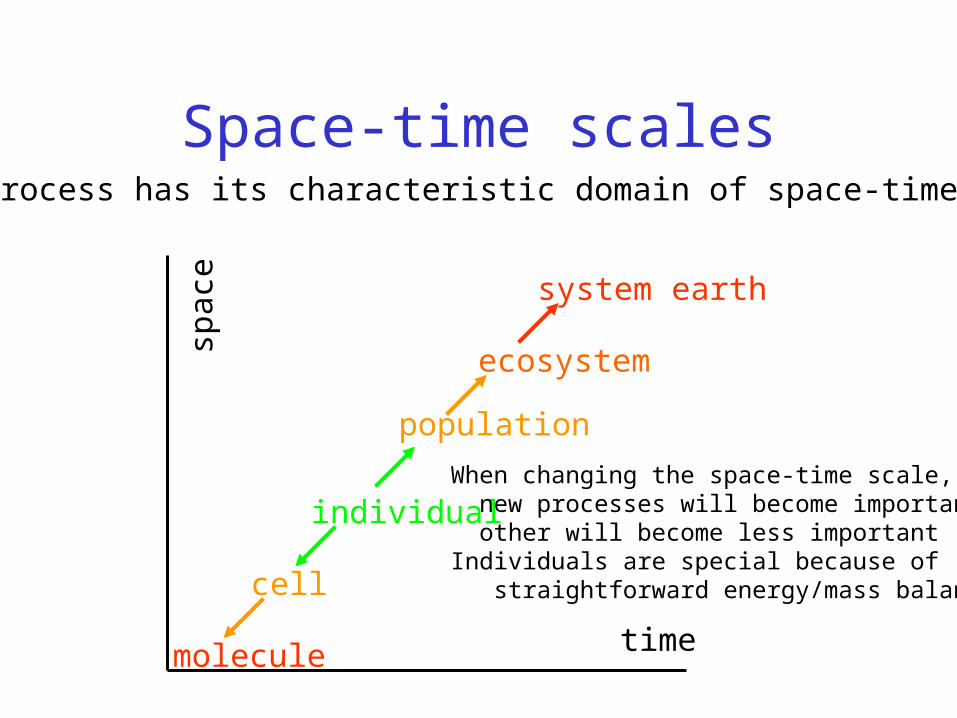
Space-time scales
When changing the space-time scale, new processes will become important other will become less importantIndividuals are special because of straightforward energy/mass balances
Each process has its characteristic domain of space-time scales

Empirical special cases of DEB year author model year author model
1780 Lavoisier multiple regression of heat against mineral fluxes
1950 Emerson cube root growth of bacterial colonies
1825 Gompertz Survival probability for aging 1951 Huggett & Widdas foetal growth
1889 Arrhenius temperature dependence of physiological rates
1951 Weibull survival probability for aging
1891 Huxley allometric growth of body parts 1955 Best diffusion limitation of uptake
1902 Henri Michaelis--Menten kinetics 1957 Smith embryonic respiration
1905 Blackman bilinear functional response 1959 Leudeking & Piret microbial product formation
1910 Hill Cooperative binding 1959 Holling hyperbolic functional response
1920 Pütter von Bertalanffy growth of individuals
1962 Marr & Pirt maintenance in yields of biomass
1927 Pearl logistic population growth 1973 Droop reserve (cell quota) dynamics
1928 Fisher & Tippitt
Weibull aging 1974 Rahn & Ar water loss in bird eggs
1932 Kleiber respiration scales with body weight3/ 4
1975 Hungate digestion
1932 Mayneord cube root growth of tumours 1977 Beer & Anderson development of salmonid embryos
DEB theory is axiomatic, based on mechanisms not meant to glue empirical models
Since many empirical models turn out to be special cases of DEB theory the data behind these models support DEB theory
This makes DEB theory very well tested against data

: These gouramis are from the same nest, These gouramis are from the same nest, they have the same age and lived in the same tank they have the same age and lived in the same tankSocial interaction during feeding caused the huge size differenceSocial interaction during feeding caused the huge size differenceAge-based models for growth are bound to fail;Age-based models for growth are bound to fail; growth depends on food intake growth depends on food intake
Not age, but size:Not age, but size:
Trichopsis vittatus

Some DEB pillars• life cycle perspective of individual as primary target embryo, juvenile, adult (levels in metabolic organization)
• life as coupled chemical transformations (reserve & structure)
• time, energy & mass balances
• surface area/ volume relationships (spatial structure & transport)
• homeostasis (stoichiometric constraints via Synthesizing Units)
• syntrophy (basis for symbioses, evolutionary perspective)
• intensive/extensive parameters: body size scaling

Biomass: reserve(s) + structure(s)
Reserve(s), structure(s): generalized compounds, mixtures of proteins, lipids, carbohydrates: fixed compositionCompounds in reserve(s): equal turnover times, no maintenance costs structure: unequal turnover times, maintenance costs
Reasons to delineate reserve, distinct from structure• metabolic memory• explanation of respiration patterns (freshly laid eggs don’t respire) • biomass composition depends on growth rate• fluxes are linear sums of assimilation, dissipation and growth basis of method of indirect calorimetry• explanation of inter-species body size scaling relationships

1- maturitymaintenance
maturityoffspring
maturationreproduction
Basic DEB scheme
food faecesassimilation
reserve
feeding defecation
structurestructure
somaticmaintenance
growth

-rule for allocation
Age, d Age, d
Length, mm Length, mm
Cum
# of young
Length,
mm
Ingestion rate, 105
cells/h
O2 consum
ption,
g/h
• 80% of adult budget to reproduction in daphnids• puberty at 2.5 mm• No change in ingest., resp., or growth • Where do resources for reprod come from? Or:• What is fate of resources in juveniles?
Respiration Ingestion
Reproduction
Growth:
32 LkvL M2fL
332 )/1( pMM LkfgLkvL
)( LLrLdt
dB
Von Bertalanffy

Embryonic development
time, d time, dwei
ght,
g
O2 c
onsu
mpt
ion,
ml/
h
l
ege
dτ
d
ge
legl
dτ
d
3
3,
3, l
dτ
dJlJJ GOMOO
; : scaled timel : scaled lengthe: scaled reserve densityg: energy investment ratio
Carettochelys insculptaData from Web et al 1986
yolk
embryo

Embryonic development
time, d
wei
ght,
g
Salmo truttaData from Gray 1926
yolkembryo
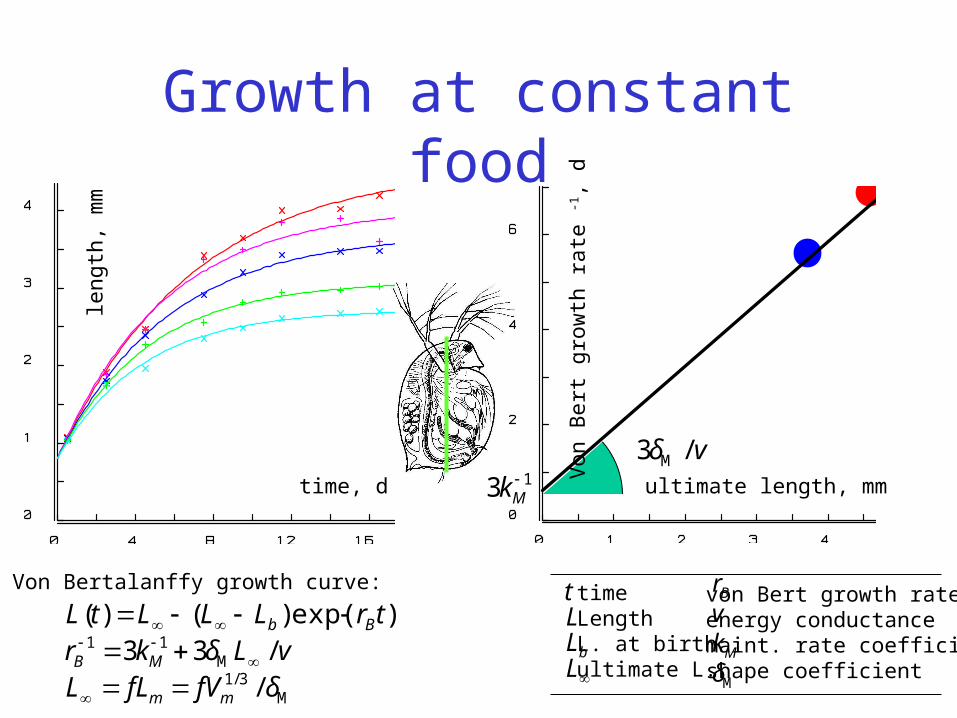
Growth at constant food
time, d ultimate length, mm
leng
th, m
m
M
M
δfVfLLvLδkr
trLLLtL
mm
MB
Bb
//33
)exp()()(
3/1
11
LLLt
b
Mδkvr
M
BtimeLengthL. at birthultimate L.
von Bert growth rateenergy conductancemaint. rate coefficientshape coefficient
vδ /3 M
Von
Ber
t gro
wth
rat
e -1, d
13 Mk
Von Bertalanffy growth curve:

Von Bertalanffy growth
trb
BeLLLtL )()( rategrowh Bert von length; BrL
Len
gth,
mm
Age, d
Arrhenius
1T
BrlogK6400AT
Data from Greve, 1972

1-
1-u
Competitive tumour growth
food faecesassimilation
reserve
feeding defecation
structurestructure
somaticmaintenance
growth
maturitymaintenance
maturityoffspring
maturationreproduction
tumourtumour
u
)(][)(][
)(][)(
tVptVp
tVptκ
uMuM
uMuu
Allocation to tumour relative maint workload
Isomorphy: is constantTumour tissue: low spec growth costs low spec maint costs
uκ
Van Leeuwen et al., 2003 The embedded tumour: host physiology is important for the evaluation of tumour growth.British J Cancer 89, 2254-2268
maint

Competitive organ growth
)()())(1()(
tfκκtκtfκκtκ
assimgut
assimvelum
Allocation to velum vs gut
relative workload
uκ
Macomahigh food
Macomalow food
Collaboration:Katja Philipart (NIOZ)
fraction ofcatabolic flux
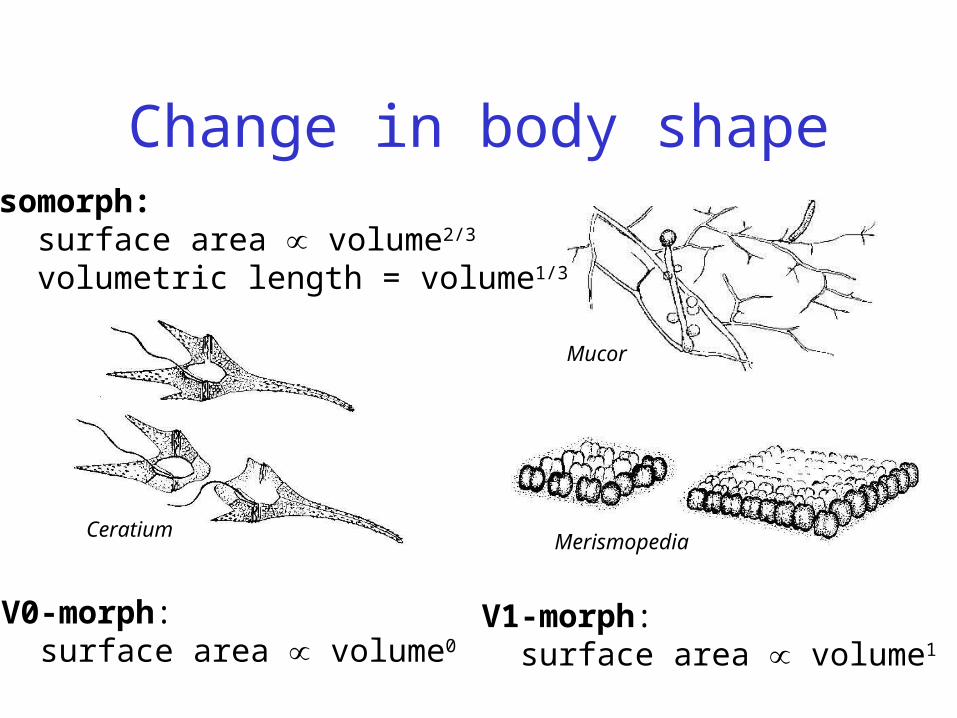
Change in body shapeIsomorph: surface area volume2/3
volumetric length = volume1/3
V0-morph: surface area volume0
V1-morph: surface area volume1
Ceratium
Mucor
Merismopedia

Mixtures of V0 & V1 morphs
volu
me,
m
3vo
lum
e,
m3
volu
me,
m
3
hyph
al le
ngth
, mm
time, h time, min
time, mintime, min
Fusarium = 0Trinci 1990
Bacillus = 0.2Collins & Richmond 1962
Escherichia = 0.28Kubitschek 1990
Streptococcus = 0.6Mitchison 1961

Reproduction Definition:Conversion of adult reserve(s) into embryonic reserve(s)Energy to fuel conversion is extracted from reserve(s)Implies: products associated with reproduction (e.g. CO2, NH3)
Allocation to reproduction in adults:
Allocation per time increment is infinitesimally smallWe therefore need a buffer with buffer-handling rules for egg prod (no buffer required in case of placental mode)
Strong homeostasis: Fixed conversion efficiencyWeak homeostasis: Reserve density at birth equals that of motherReproduction rate: follows from maintenance + growth costs, given amounts of structure and reserve at birth
constantwith)1( ,,,, JEJECERE JJJκJ
eggpercostswith/ 00, EEJκR RER0E

Reproduction at constant food
length, mm length, mm
103 e
ggs
103 e
ggs
Gobius paganellusData Miller, 1961
Rana esculentaData Günther, 1990
)(foodconstantat
)()1(),(
332
3/2
0
feLδv
k
f
fgLδ
v
kL
VgkVkvVeg
geκ
Ve
κVeR
pMM
pMMm
R
ΜΜ

Application to flatfishname (english) plaice flounder dab sole
name (latin) Pleuronectes platessa
Platichthys flesus Limanda limanda Solea solea
habitat cold warm, euryhaline cold warm
max life span (a) 30 10-15 10-12 20
max length (cm) 78 56 51 75
max weight (kg) 5 2 1.3 3
reprod/ body wght 0.2 0.45 0.2 0.15
length at pub m,f (cm) 15,22 11,13 10,11 12.15
Arrhenius temp (K) 5878, 7963 6957, 11134 3958, 4931 7301, 9708
partitioning fraction 0.85 0.65 0.85 0.9
{pXm} (W m-2, 283 K) 57 55 36 45
E0 (J/egg) 5 0.7 0.4 1.5
{pAm}/{pXm} = 0.2[pM] = 225 W m-3
[EG] = 7 kJ cm-3 [Em] 2.5 kJ cm-3
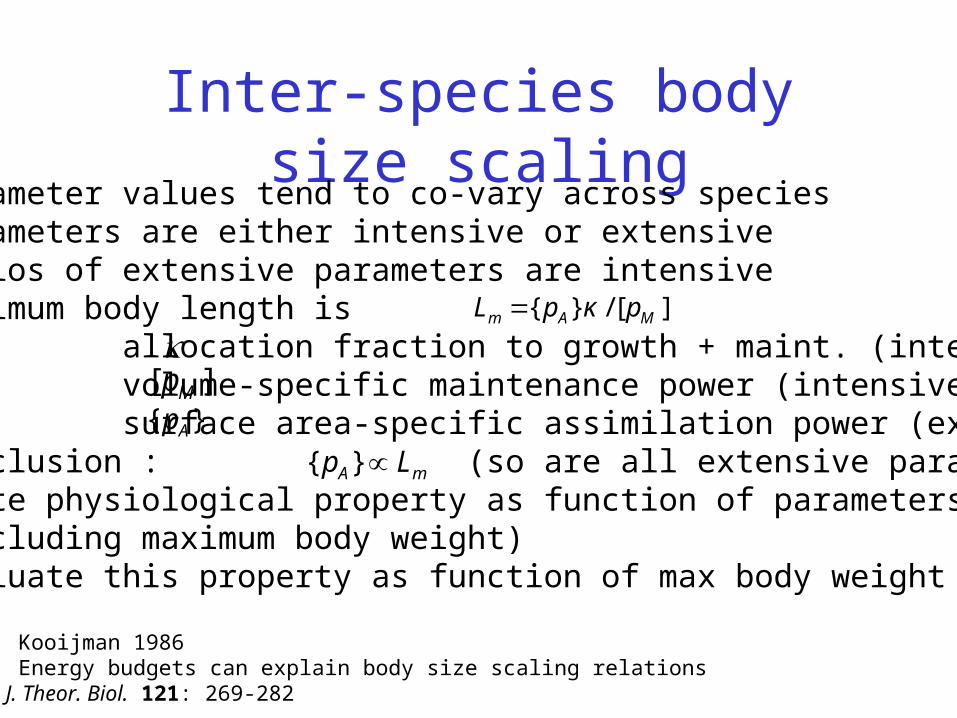
Inter-species body size scaling• parameter values tend to co-vary across species• parameters are either intensive or extensive• ratios of extensive parameters are intensive• maximum body length is allocation fraction to growth + maint. (intensive) volume-specific maintenance power (intensive) surface area-specific assimilation power (extensive)• conclusion : (so are all extensive parameters)• write physiological property as function of parameters (including maximum body weight)• evaluate this property as function of max body weight
][/}{ MAm pκpL
}{ Ap][ Mp
mA Lp }{
Kooijman 1986 Energy budgets can explain body size scaling relationsJ. Theor. Biol. 121: 269-282

Body weight
Body weight has contribution from structure and reserveIf reserves allocated to reproduction hardly contribute:
13/4
13/100
11
1
)(][
][
W
EEmV
EEmV
f
EEV
L
μwEd
μwEdVμwEVdW
VVV/VVW
][ m
E
E
V
Eμwd
WLE
V
W
V
Wintra-spec body weightinter-spec body weightintra-spec structural volumeInter-spec structural volumereserve energycompound length-parameter
specific density for structuremolecular weight for reservechemical potential of reservemaximum reserve energy density

Usually quantified in three different ways• consumption of dioxygen• production of carbon dioxide• dissipation of heat
DEB theory: These fluxes are weighted sums of• assimilation• maintenance• growth
Weight coefficients might differ
Not constant, depends on size & feeding conditions
Metabolic rate
nconsumptiodioxygen
production dioxidecarbon Quotient n Respiratio

Scaling of metabolic rate
comparison intra-species inter-species
maintenance
growth
weight
nrespiratio3
32
dl
llls
43
32
ldld
lll
EV
h
structure
reserve
32 lll
l0l
0
3lllh
Respiration: contributions from growth and maintenanceWeight: contributions from structure and reserveStructure ; = length; endotherms 3l l
3lllh
0hl

Metabolic rate
Log weight, g
Log metabolic rate,
w
endotherms
ectotherms
unicellulars
slope = 1
slope = 2/3
Length, cm
O2 consum
ption,
l/h
Inter-speciesIntra-species
0.0226 L2 + 0.0185 L3
0.0516 L2.44
2 curves fitted:
(Daphnia pulex)

Von Bertalanffy growth rate
11 ][])[]([3
)()(
MmGB
trb
pEκfEr
eLLLtL B
costsmaint spec][fractioncapacity reserve spec][resp funccostsgrowth spec][length
m
m
G
pκEfEL

Length at puberty
L, cm
Lp,
cm
Clupea• Brevoortia° Sprattus Sardinops Sardina
Sardinella+ Engraulis* Centengraulis Stolephorus
Data from Blaxter & Hunter 1982
Clupoid fishes
Length at first reproduction Lp ultimate length L

Spatial structure: schooling
Isomorphic schools: Number of feeding individuals N 2/3
Feeding rate per individual N -1/3
Population models require rules for birth and death of schools; shools are just “super individuals”
Scomber scombrus

DEB tele-course 2005Feb – April 2005, 10 weeks, 200 h no financial costs
http://www.bio.vu.nl/thb/deb/course/deb/
Download slides of Sète lecture by Bas Kooijmanhttp://www.bio.vu.nl/thb/users/bas/lectures/
Vacancies at Dept Theor Biol VUA EU-projects Modelkey (1PhD+1PD), Nomiracle (1PhD)
see http://www.bio.vu.nl/thb/