innovations by deb theory to understand metabolic organisation bas kooijman dept theoretical biology...
Post on 19-Dec-2015
213 views
TRANSCRIPT
Innovations by DEB theory to understand metabolic organisation
Bas KooijmanDept theoretical biology
Vrije Universiteit [email protected]
http://www.bio.vu.nl/thb/
Nantes, 2005/04/22

Contents
• introduction
• static & production models
• principles
• surface-volume interactions
• respiration patterns
• biomass composition
• product formation
• body size scaling
Nantes, 2005/04/22

Dynamic Energy Budget theoryfor metabolic organisationUptake of substrates (nutrients, light, food) by organisms and their use (maintenance, growth, development, reproduction)
First principles, quantitative, axiomatic set upAim: Biological equivalent of Theoretical Physics
Primary target: the individual with consequences for• sub-organismal organization• supra-organismal organizationRelationships between levels of organisation
Many popular empirical models are special cases of DEB

molecule
cell
individual
population
ecosystem
system earth
time
spac
e
Space-time scales
When changing the space-time scale, new processes will become important other will become less importantIndividuals are special because of straightforward energy/mass balances
Each process has its characteristic domain of space-time scales

Empirical special cases of DEB year author model year author model1780 Lavoisier multiple regression of heat
against mineral fluxes1950 Emerson cube root growth of bacterial
colonies
1825 Gompertz Survival probability for aging 1951 Huggett & Widdas foetal growth
1889 Arrhenius temperature dependence of physiological rates
1951 Weibull survival probability for aging
1891 Huxley allometric growth of body parts 1955 Best diffusion limitation of uptake
1902 Henri Michaelis--Menten kinetics 1957 Smith embryonic respiration
1905 Blackman bilinear functional response 1959 Leudeking & Piret microbial product formation
1910 Hill Cooperative binding 1959 Holling hyperbolic functional response
1920 Pütter von Bertalanffy growth of individuals
1962 Marr & Pirt maintenance in yields of biomass
1927 Pearl logistic population growth 1973 Droop reserve (cell quota) dynamics
1928 Fisher & Tippitt
Weibull aging 1974 Rahn & Ar water loss in bird eggs
1932 Kleiber respiration scales with body weight3/ 4
1975 Hungate digestion
1932 Mayneord cube root growth of tumours 1977 Beer & Anderson development of salmonid embryos
DEB theory is axiomatic, based on mechanisms not meant to glue empirical models
Since many empirical models turn out to be special cases of DEB theory the data behind these models support DEB theory
This makes DEB theory very well tested against data

Classic energetics
Anabolism: synthetic pathwaysCatabolism: degradation pathwaysDuality: compounds as source for energy & building blocks
From: Mader, S. S. 1993 Biology, WCB
This decomposition occursat several places in DEBs

Static Energy Budgets Scope for Growth
From: Brafield, A. E. and Llewellyn, M. J. 1982 Animal energetics, Blackie, Glasgow
C energy from foodP production (growth)F energy in faecesU energy in urineR heat
Numbers: kJ in 28 d
Basic difference with dynamic budgets:Production is quantified as energy fixed in new tissue, not as energy allocated to growth: SEBs exclude overheadsHeat includes overheads of growth, reproduction and other processes it does not quantify maintenance costs

Production model
food faecesassimilation
feeding defecation
maintenance
offspring
reproductionreserve
structurestructure
growth

1- maturitymaintenance
maturityoffspring
maturationreproduction
Basic DEB scheme
food faecesassimilation
reserve
feeding defecation
structurestructure
somaticmaintenance
growth

Production models• no accommodation for embryonic stage; require additional state variables (no food intake, still maintenance costs and growth)
• no metabolic memory, no growth during starvation
• require switches in case of food shortage (reserves allocated to reproduction used for maintenance)
• no natural dynamics for reserve; descriptive rules for growth vs reprod.
• no explanation for body size scaling of metabolic rates, changes in composition of biomass, metabolic memory
• require complex regulation modelling for fate of metabolites (ATP vs building blocks; consistency problem with lower levels of org.)
• dividing organisms (with reserve) cannot be included
• typically have descriptive set points for allocation, no mechanisms (weight-for-age rules quantify allocation to reproduction)

Some DEB pillars
• life cycle perspective of individual as primary target embryo, juvenile, adult (levels in metabolic organization)
• life as coupled chemical transformations (reserve & structure)
• time, energy, entropy & mass balances
• surface area/ volume relationships (spatial structure & transport)
• homeostasis (stoichiometric constraints via Synthesizing Units)
• syntrophy (basis for symbioses, evolutionary perspective)
• intensive/extensive parameters: body size scaling

Biomass: reserve(s) + structure(s)
Reserve(s), structure(s): generalized compounds, mixtures of proteins, lipids, carbohydrates: fixed compositionCompounds in reserve(s): equal turnover times, no maintenance costs structure: unequal turnover times, maintenance costs
Reasons to delineate reserve, distinct from structure• metabolic memory• explanation of respiration patterns (freshly laid eggs don’t respire) • biomass composition depends on growth rate• fluxes are linear sums of assimilation, dissipation and growth basis of method of indirect calorimetry• explanation of inter-species body size scaling relationships

Change in body shape
Isomorph: surface area volume2/3
volumetric length = volume1/3
V0-morph: surface area volume0
V1-morph: surface area volume1
Ceratium
Mucor
Merismopedia
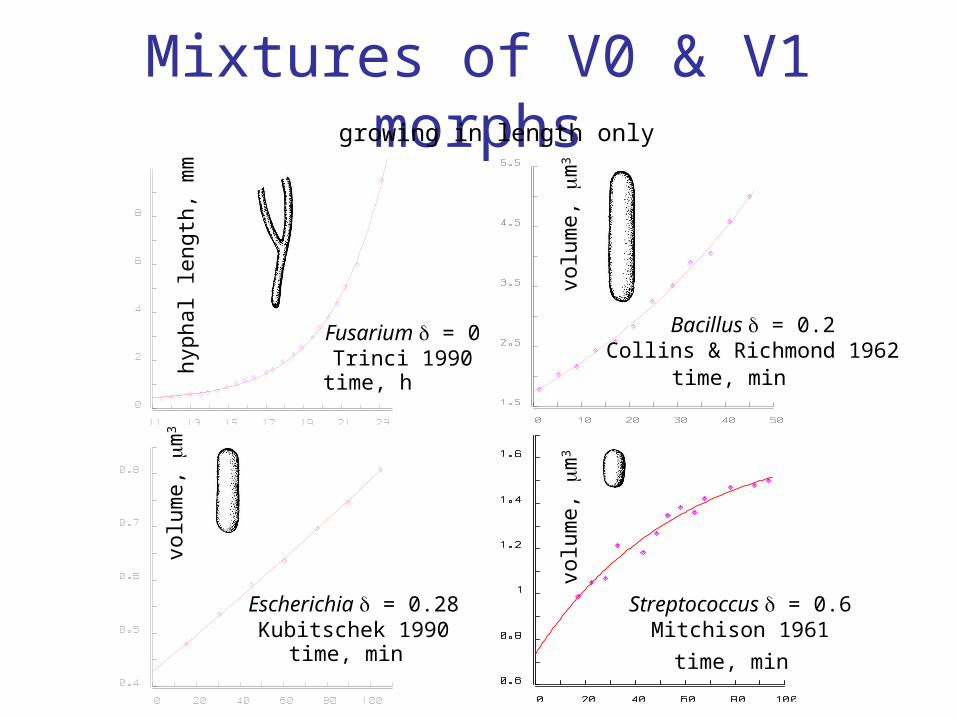
Mixtures of V0 & V1 morphs
volu
me,
m
3vo
lum
e,
m3
volu
me,
m
3
hyph
al le
ngth
, mm
time, h time, min
time, mintime, min
Fusarium = 0Trinci 1990
Bacillus = 0.2Collins & Richmond 1962
Escherichia = 0.28Kubitschek 1990
Streptococcus = 0.6Mitchison 1961
growing in length only

Respiration ontogeny in birds
age, d age, d
ml C
O2
d-1
ml O
2 d-1
altricialTroglodytes aëdon
precocialGallus domesticus
Observations: just prior to hatching • respiration shows a plateau in precocial, not in altricial birds • pore size and frequency in egg shell is such that O2 flux has constant resistance
Conclusion: ontogeny is constrained by diffusion limitation in precocial birds (Rahn et al 1990)
DEB theory: reserve dynamics controls ontogeny (same pattern in species without shells) Minimization of water loss causes observed constant flux resistance

Embryonic development
time, d time, d
wei
ght,
g
O2 c
onsu
mpt
ion,
ml/
h
l
ege
dτ
d
ge
legl
dτ
d
3
3,
3, l
dτ
dJlJJ GOMOO
; : scaled timel : scaled lengthe: scaled reserve densityg: energy investment ratio
Crocodylus johnstoniData from Whitehead 1987
yolk
embryo

Heat increment of feeding
O2 consumption increases sharply with feeding
Present situation: little understood expected increase due to chemistry of protein processing
only explains 10 % of observed increase
Explanation by DEB theory: elemental balance for assimilation process
fluxes of CO2, H2O, O2, N-waste
follow from fluxes of substrate, reserve, structure, products
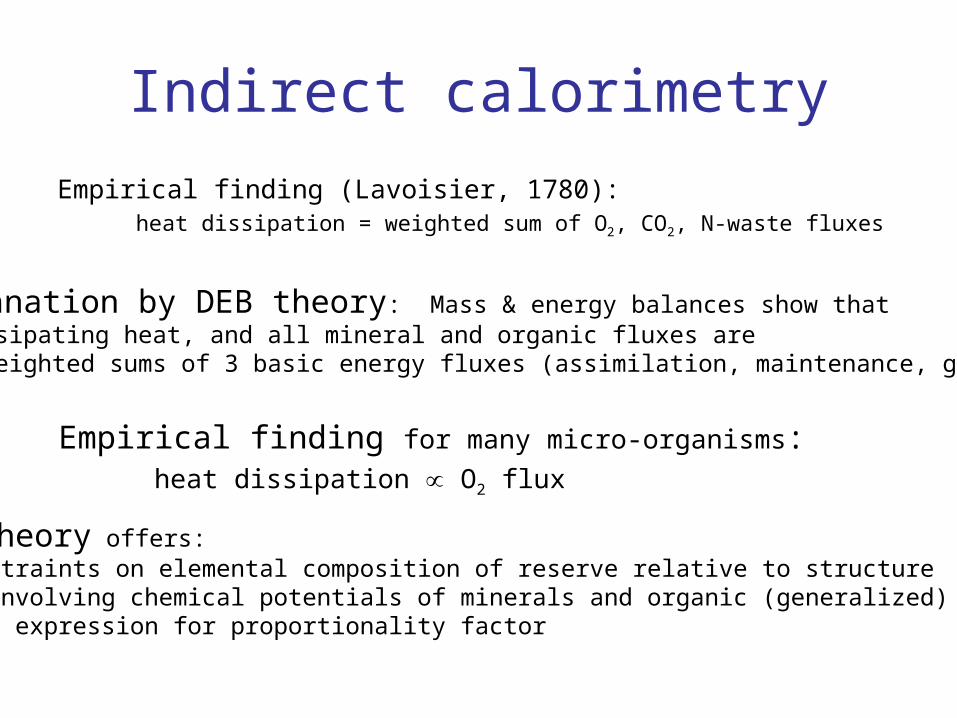
Indirect calorimetry
Empirical finding (Lavoisier, 1780): heat dissipation = weighted sum of O2, CO2, N-waste fluxes
Explanation by DEB theory: Mass & energy balances show that dissipating heat, and all mineral and organic fluxes are weighted sums of 3 basic energy fluxes (assimilation, maintenance, growth)
Empirical finding for many micro-organisms: heat dissipation O2 flux
DEB theory offers: • constraints on elemental composition of reserve relative to structure involving chemical potentials of minerals and organic (generalized) compounds• gives expression for proportionality factor

Biomass compositionData Esener et al 1982, 1983; Kleibsiella on glycerol at 35°C
nHW
nOW
nNW
O2
CO2Spec growth rate, h-1
Spec growth rate
Spec growth rate, h-1
Rel
ativ
e ab
unda
nce
Spe
c pr
od, m
ol.m
ol-1.h
-1
Wei
ght y
ield
, mol
.mol
-1
nHE 1.66 nOE 0.422 nNE 0.312nHV 1.64 nOV 0.379 nNV 0.189
kE 2.11 h-1 kM 0.021 h-1
yEV 1.135 yXE 1.490rm 1.05 h-1 g = 1
•μE-1 pA pM pG
JC 0.14 1.00 -0.49
JH 1.15 0.36 -0.42
JO -0.35 -0.97 0.63
JN -0.31 0.31 0.02
Entropy J/C-mol.K Glycerol 69.7 Reserve 74.9 Structure 52.0
Sousa et al 2004Interface, subm

Product Formation
throughput rate, h-1
glyc
erol
, eth
anol
, g/l
pyru
vate
, mg/
l
glycerol
ethanol
pyru
vate
Glucose-limited growth of SaccharomycesData from Schatzmann, 1975
DEB theory:
Product formation rate = wA . Assimilation rate + wM . Maintenance rate + wG . Growth rate
For pyruvate: wG<0
Leudeking & Piret (1959):
Product formation rate = wM . Maintenance rate + wG . Growth rate
Cannot explain observed pattern

Yield vs growth
1/spec growth rate, 1/h
1/yi
eld,
mm
ol g
luco
se/
mg
cells
Streptococcus bovis, Russell & Baldwin (1979)
Marr-Pirt (no reserve)DEB
spec growth rate
yield
Russell & Cook (1995): this is evidence for down-regulation of maintenance at high growth ratesDEB theory: high reserve density gives high growth rates structure requires maintenance, reserves do not
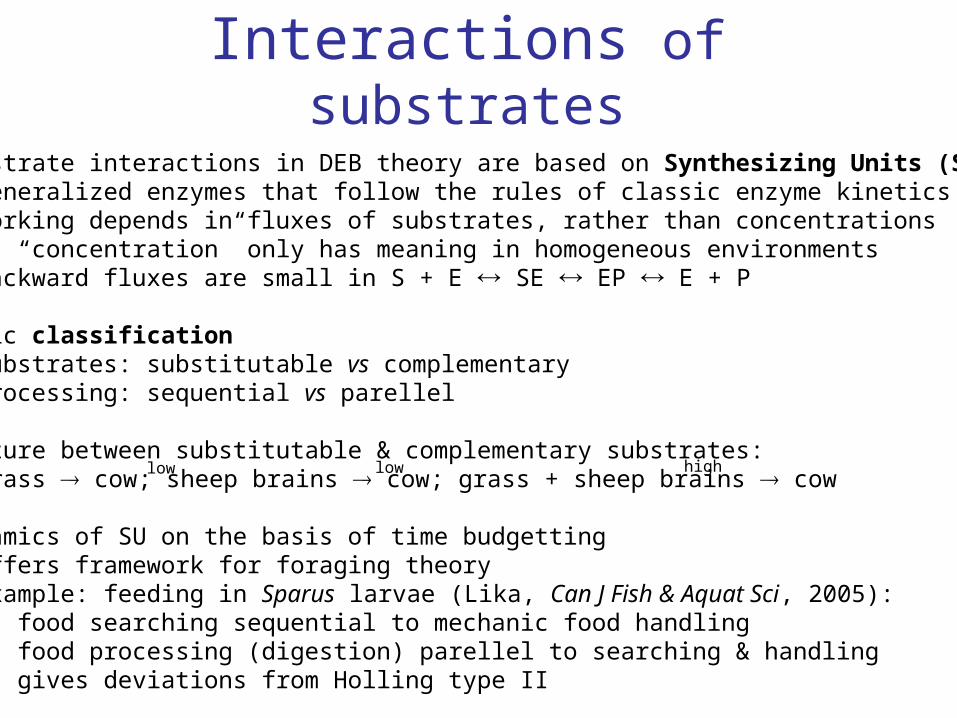
Interactions of substrates
Substrate interactions in DEB theory are based on Synthesizing Units (SUs): generalized enzymes that follow the rules of classic enzyme kinetics but• working depends in fluxes of substrates, rather than concentrations “concentration” only has meaning in homogeneous environments• backward fluxes are small in S + E SE EP E + P
Basic classification• substrates: substitutable vs complementary• processing: sequential vs parellel
Mixture between substitutable & complementary substrates: grass cow; sheep brains cow; grass + sheep brains cow
Dynamics of SU on the basis of time budgetting offers framework for foraging theory example: feeding in Sparus larvae (Lika, Can J Fish & Aquat Sci, 2005): food searching sequential to mechanic food handling food processing (digestion) parellel to searching & handling gives deviations from Holling type II
low low high
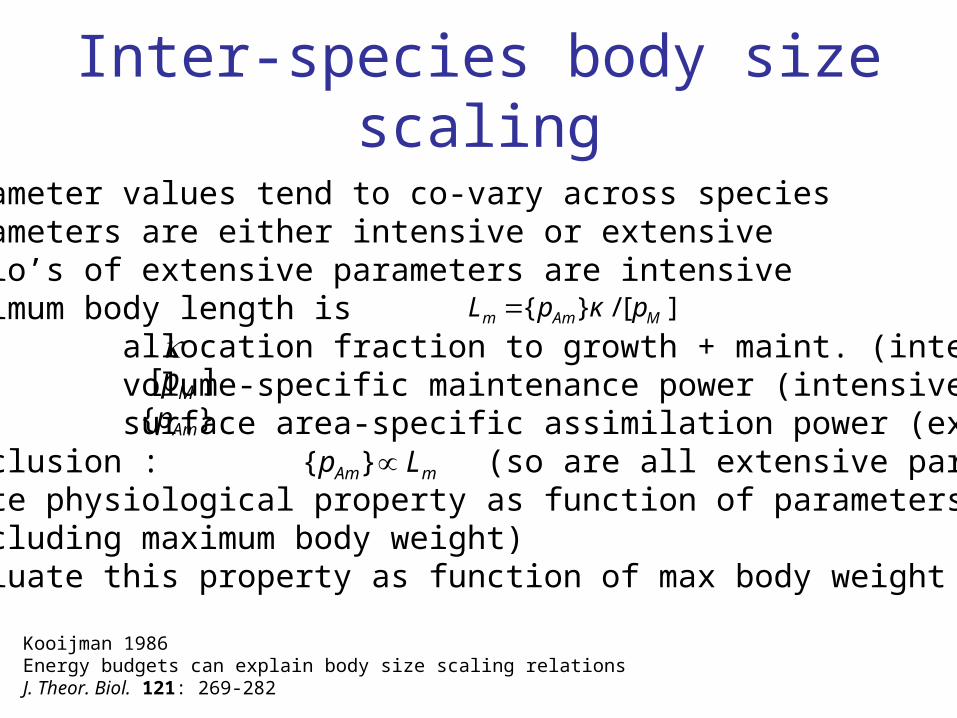
• parameter values tend to co-vary across species• parameters are either intensive or extensive• ratio’s of extensive parameters are intensive• maximum body length is allocation fraction to growth + maint. (intensive) volume-specific maintenance power (intensive) surface area-specific assimilation power (extensive)• conclusion : (so are all extensive parameters)• write physiological property as function of parameters (including maximum body weight)• evaluate this property as function of max body weight
Inter-species body size scaling
][/}{ MAmm pκpL
}{ Amp][ Mp
mAm Lp }{
Kooijman 1986Energy budgets can explain body size scaling relationsJ. Theor. Biol. 121: 269-282

Primary scaling relationships
Extensive parameters
K saturation constant
Lb length at birth
Lp length at puberty
{JXm} max spec feeding rate
{pAm} max spec assim rate
[Em] max reserve capacity
Intensive parameters
[pM] volume-spec maint. costs
{pT} surface-spec maint. costs
[EG] spec structure costs
ha aging acceleration
partitionning fraction
R reproduction efficiency
maximum length Lm = {pAm} / [pM]

Scaling of metabolic rate
intra-species inter-species
maintenance
growth
weight
nrespiratio3
32
dl
llls
43
32
ldld
lll
EV
h
structure
reserve
32 vll
l0l
0
3lllh
Respiration: contributions from growth and maintenanceWeight: contributions from structure and reserveStructure ; = length; endotherms 3l l
3lllh
0hl

Metabolic rate
Log weight, gLo
g m
etab
olic
rat
e,
w
endotherms
ectotherms
unicellulars
slope = 1
slope = 2/3
Length, cm
O2 c
onsu
mpt
ion,
l
/h
Inter-speciesIntra-species
0.0226 L2 + 0.0185 L3
0.0516 L2.44
2 curves fitted:
(Daphnia pulex)
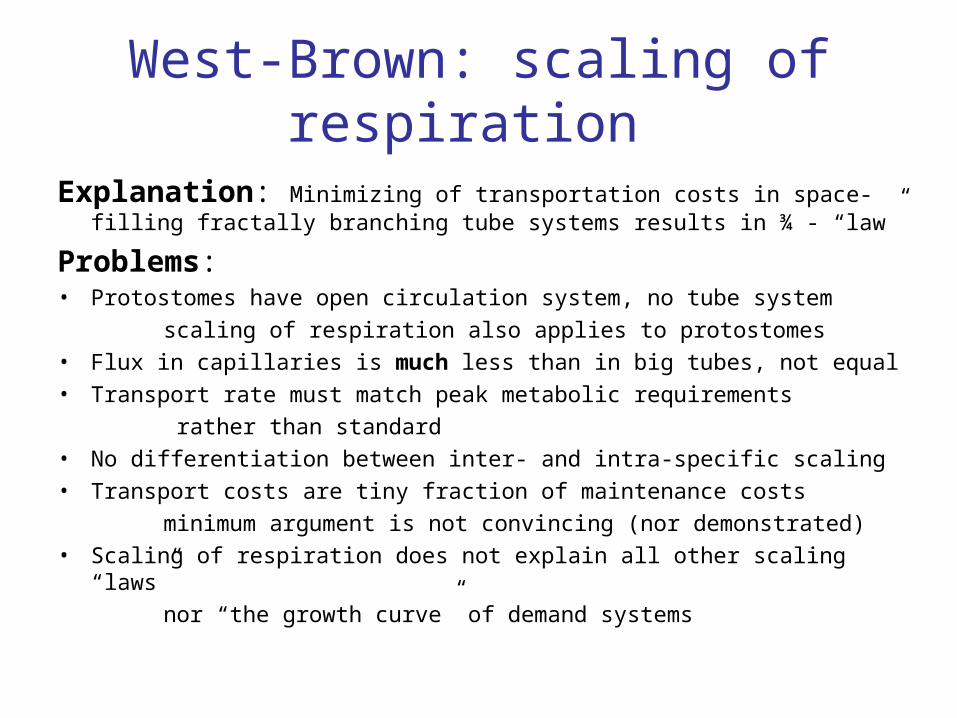
West-Brown: scaling of respiration
Explanation: Minimizing of transportation costs in space-filling fractally branching tube systems results in ¾ - “law”
Problems:• Protostomes have open circulation system, no tube system
scaling of respiration also applies to protostomes
• Flux in capillaries is much less than in big tubes, not equal
• Transport rate must match peak metabolic requirements
rather than standard
• No differentiation between inter- and intra-specific scaling
• Transport costs are tiny fraction of maintenance costs
minimum argument is not convincing (nor demonstrated)
• Scaling of respiration does not explain all other scaling “laws”
nor “the growth curve” of demand systems
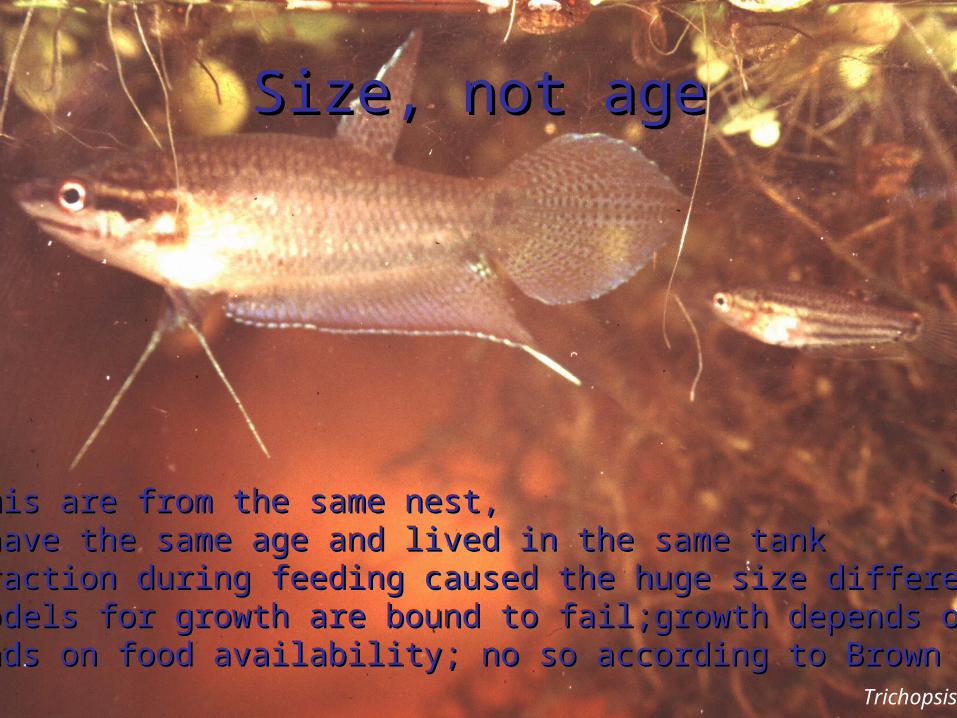
These gouramis are from the same nest, These gouramis are from the same nest, they have the same age and lived in the same tankthey have the same age and lived in the same tankSocial interaction during feeding caused the huge size differenceSocial interaction during feeding caused the huge size differenceAge-based models for growth are bound to fail;growth depends on food intake Age-based models for growth are bound to fail;growth depends on food intake Growth depends on food availability; no so according to Brown 2001, Growth depends on food availability; no so according to Brown 2001, NatureNature
Trichopsis vittatus
Size, not ageSize, not age

Banavar: scaling of respiration
Explanation: Dilution of biomass with transport material between maintenance-requiring nodes in efficient networks results in ¾ -”law”
Problems:• Transport rate must match peak metabolic requirements
rather than standard• No differentiation between inter- and intra-specific scaling• Efficiency criterion

Feeding rateslope = 1
poikilothermic tetrapodsData: Farlow 1976
Inter-species: JXm VIntra-species: JXm V2/3
Mytilus edulisData: Winter 1973
Length, cm
Filt
ratio
n ra
te, l
/h

Incubation time
10log egg weight, g 10log egg weight, g
10lo
g in
cuba
tion
tim
e, d
10lo
g in
cuba
tion
tim
e, d
lb equal° tube noses
slope = 0.25
Data from Harrison 1975
European birds
4/104
0
EaLE
Lab
m
mb
Incubation timeEgg weight
Conclusion: tube noses are special,not because of their long incubationbut because of their large eggsIntra-species scaling: large eggs short time to fledging

Von Bertalanffy growth rate
13/113/1 /3/3/3/3
vkvVkr MMB V
At 25 °C : maint rate coeff kM = 400 a-1
energy conductance v = 0.3 m a-1
25 °CTA = 7 kK
10log ultimate length, mm 10log ultimate length, mm
10lo
g vo
n B
ert
grow
th r
ate
, a-1
)exp()()( 3/13/13/13/1 arVVVaV Bb
3/1V
a
3/1V
3/1bV
1Br
↑
↑0

Some innovations by DEB theory
• Unifies all life on earth (bacteria, protoctists, fungi/animals, plants)
• Links levels of organisation• Explains body size scaling relationships• Deals with energetic and stoichiometric constraints• Individuals that follow DEB rules can merge smoothly
into a symbiosis that again follows DEB rules• Method for determining entropy of living biomass • Biomass composition depends on growth rate• Product formation has 3 degrees of freedom• Explains indirect calorimetry• Explains how yield of biomass depends on growth rate• Quantitative predictions have many practical applications