energy & greenhouse gas management · 2012-11-11 · energy & greenhouse gas management ......
TRANSCRIPT

Energy & Greenhouse Gas Management
ENERGY STARMonthly Partner Web Conference
October 21, 2009

2
• Monthly
• Topics are structured on a strategic approach to energy management
• Help you continually improve energy performance
• Opportunity to share ideas with others
• Slides are a starting point for discussion
• Open & interactive
About The Web Conferences

3
Web Conference Tips
• Mute – To improve sound quality, all phones will be muted.
• Use # 6 to un-mute and * 6 – to mute
• Presentation slides will be sent by email to all participants following the web conference.

4
Energy and Greenhouse Gas Management:
• John Parodi – Roche
• Kevin Shelton – Johnson Controls Inc.
• Walt Tunnessen – US EPA
• Discussion
• Announcements
Today’s Web Conference

Energy & GHG Management at Roche US
John Parodi
Director of Energy Management, Roche
Energy Star Web Conference
October 21, 2009

A Global PerspectiveAbout the Roche Group
Our Mission
Our aim as a leading healthcare company is to create, produce and market innovative solutions of high quality for unmet medical needs. Our products and services help to prevent, diagnose and treat diseases, thus enhancing people’s health and quality of life. We do this in a responsible and ethical manner and with a commitment to sustainable development respecting the needs of the individual, the society and the environment.

Global Energy and Greenhouse Gas (GHG) Goals
• Reduce energy per employee by 10% (2005-2010)
• Reduce GHG emissions per sales by 10% (2003-2008)
• Elimination of halogenated hydrocarbons

2004: Roche Joins Climate Leaders
• Original Goal to Reduce GHG at US & Puerto Rico Sites By 10% (Absolute)
• Base Year 2001
• Target Year 2008

2006: Roche Achieves First Climate Leaders Goal
200,000
220,000
240,000
260,000
280,000
300,000
320,000
340,000
360,000
2001 2002 2003 2004 2005 2006
Car
bon
Equi
v. (M
T)

2008: Achieve Second Goal
200,000
220,000
240,000
260,000
280,000
300,000
320,000
340,000
360,000
2001 2002 2003 2004 2005 2006 2007 2008
Car
bon
Equi
v. (M
T)

Roche Re-Selected for Dow Jones World Sustainability Index for Fifth Time

The “Green Light” for Energy Conservation
• Corporate directive on energy conservation issued late 2006
• Applicable to all Roche sites and activities globally
• Designed to “ensure that all decision-making at Roche supports efficient, appropriate and cost-effective energy use”
• Specifies the development of “energy conservation process” at each site
• Mandated standards
• Investments based on life cycle costs

Roche Approach to Energy Management
• Site-Level
– Site-Specific Goals
– Site Energy Manager
– Program/Project Implementation
• Corporate-Level
– Policies/Goals/Directives
– Site Support
– Roche Energy Team
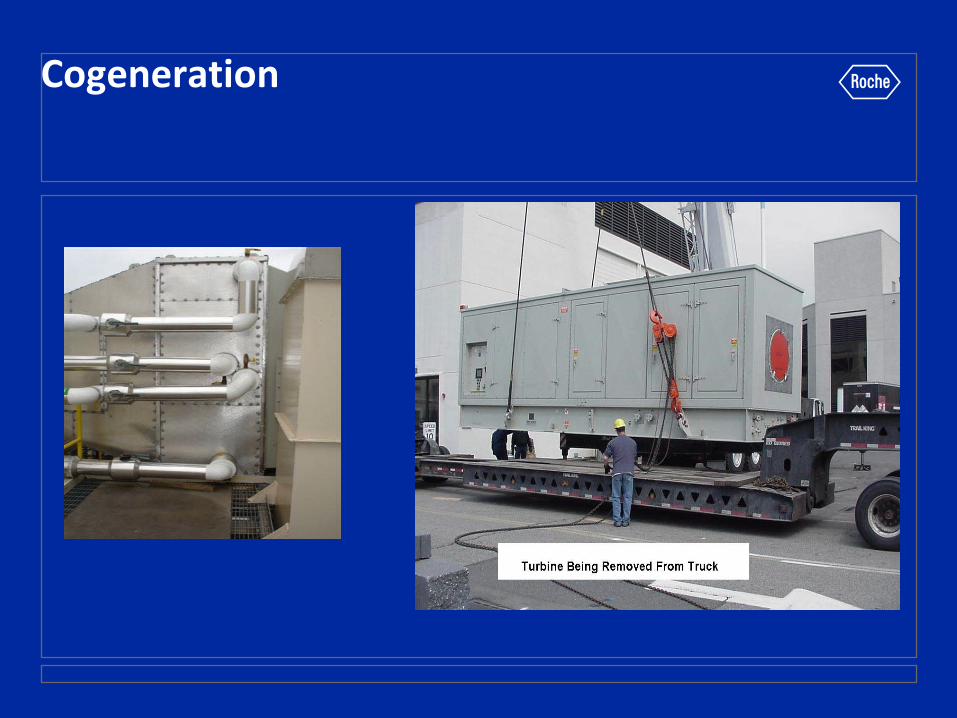
Cogeneration

Boiler Plant Improvements

Chiller Plant Improvements

Removing Halogenated Hydrocarbons
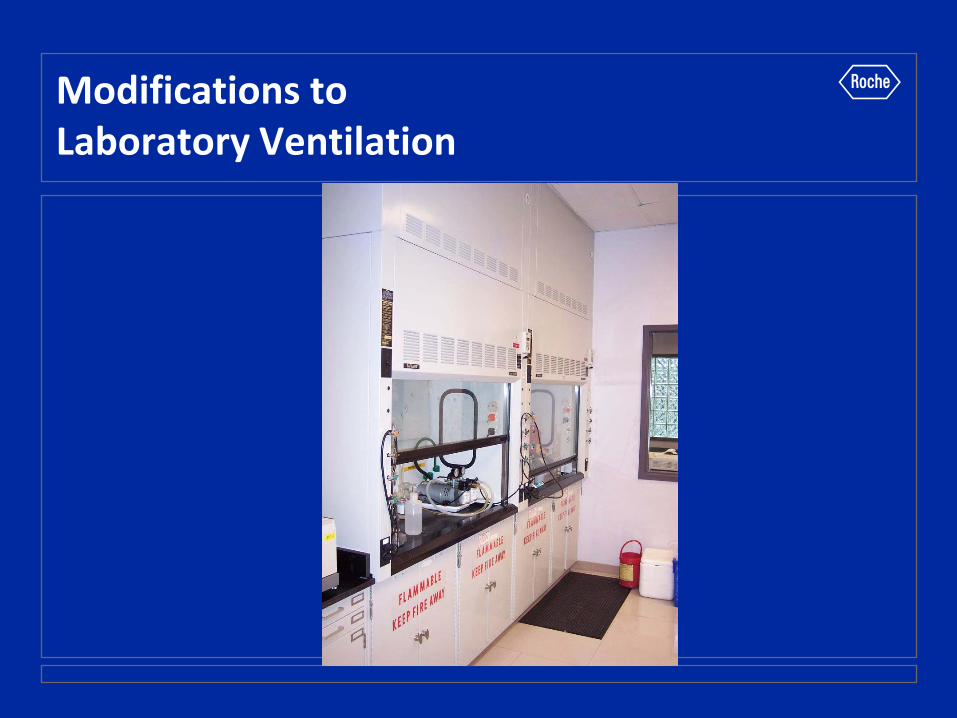
Modifications toLaboratory Ventilation

Lighting

RetroCommissioning

VFD’s

Fleet Efficiency
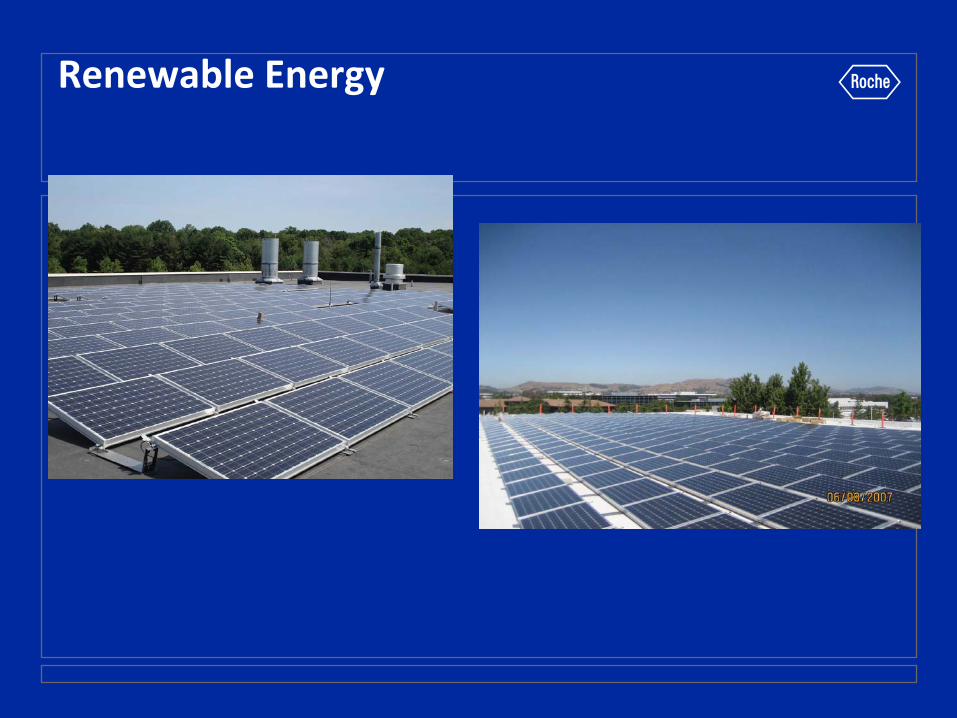
Renewable Energy

Employee Energy Awareness
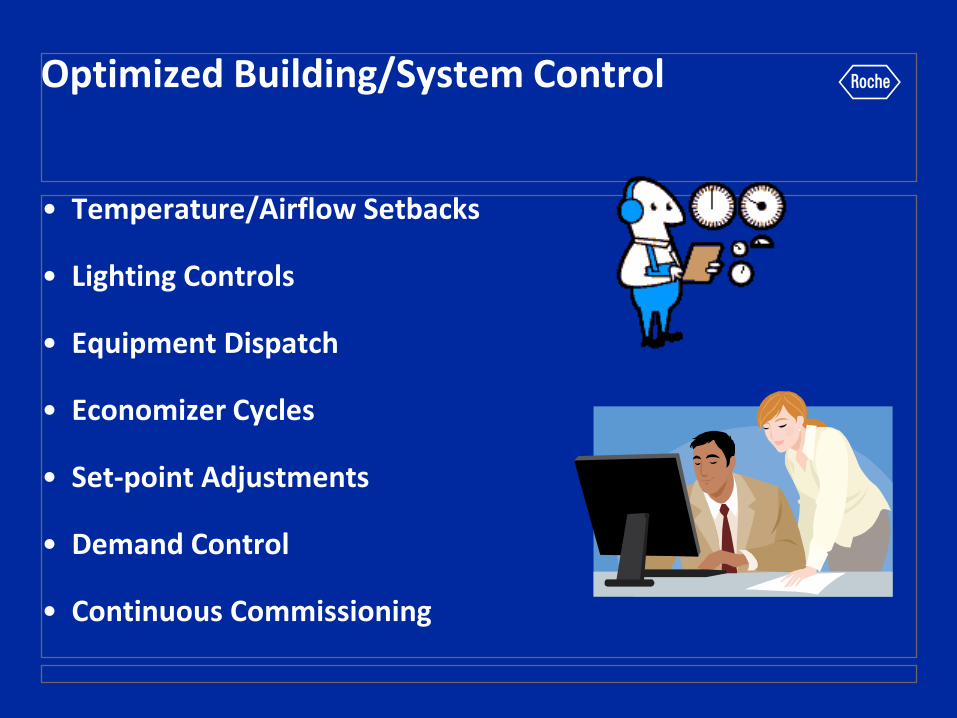
Optimized Building/System Control
• Temperature/Airflow Setbacks
• Lighting Controls
• Equipment Dispatch
• Economizer Cycles
• Set-point Adjustments
• Demand Control
• Continuous Commissioning

Where Do We Go From Here?
• Standard Design Requirements
• Continuous Commissioning
• Low-E Travel
– Vehicle Efficiency
– Virtual Travel
• Increased Employee Awareness
• Key Personnel Training
• Knowledge Sharing
• FOCUS ON PROJECT IMPLEMENTATION

Energy Management Best Practicesfor a more comfortable, safe and sustainable world
Kevin SheltonVP of Facilities, Real Estate & ConstructionOctober 21, 2009
Energy Star Monthly Partners Meeting
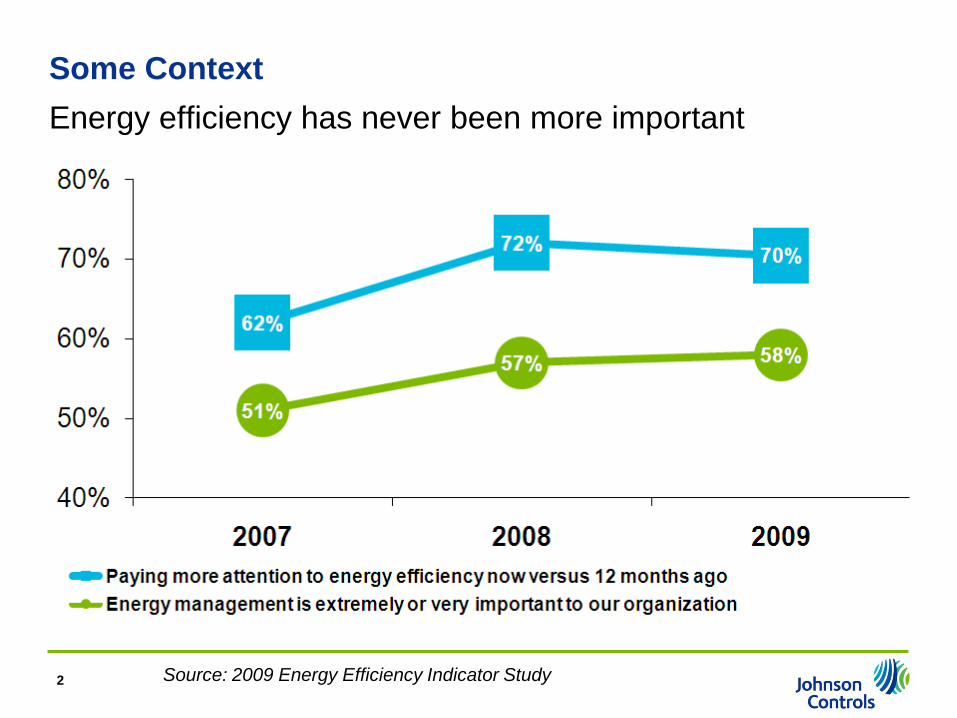
Some ContextEnergy efficiency has never been more important
Source: 2009 Energy Efficiency Indicator Study2

Sustainability is a cornerstone for Johnson Controls
3

Our carbon reduction commitment
4

5
Strategies for reducing our climate impact
Employee
Sq. ft. Btu
Sq. ft.
Mt CO2e
BtuCarbon
Intensity(Mt CO2e / $
Revenue)
=
Leaner CleanerGreener
WorkspaceOptimization
Renewable Energy
EnergyEfficiency
X XRevenue
Employee
Smarter
Productivity
X
Energy Management Best Practices• Integrated design• Energy efficiency retrofits• Energy Hunt program• Enterprise monitoring & reporting• On-site renewable energy

Integrated design in new construction & renovationBrengel Technology Center
Seven-story, 130,000 sq ft building
adjacent to our 100 year-old original HQ building downtown Milwaukee, WI
LEED-NC Silver certified
First LEED building to be certified Goldunder LEED-EB
6
Controllability
Minimum Energy Use

5 buildings, 500,000 sq ft
Targeting highest concentration of LEED Platinum certified buildings in the world
>90th %tile Energy Star ratings
272 wells for ground-source heat pumps reduce energy by 29%
Extensive daylight harvesting and shade control
385 kW combined ground and roof mounted photovoltaic arrays (Wisconsin’s largest PV system)
1,330 sf solar thermal collectors used to heat hot water in building
BMS integration to IT monitoring system in data center
Integrated design in new construction & renovationHeadquarters campus renovation

8
Monitoring for continuous energy optimization

Johnson Controls Manufacturing Footprint

Results to Date
Energy Hunt Program
1. Form Team
2. Kick-off Energy Hunt
3. Communicate Plant-wide
4. Measure, Implement,
Improve
5. Communicate Best Practices
Over 50 sites have undergone an Energy Hunt since March 2009
116 projects have been completed; 137 in the pipeline
$2.3M hard savings achieved; $1.1M savings expected with current projects in pipeline

Energy Hunt Program
11
Main Focus Areas of the Energy Hunt: • Utilities:- Chiller System- Steam System- Compressed Air- HVAC - Water Treatment
• Energy:- Utility Best Rates- Peak Load Management- Rebates or Incentives
• Lighting:- High Bay- Process- Office
• Operations:- Process or Procedure
improvement- Scrap and Waste reduction- Start up and shut down
procedures
• Motors, Fans, & Pumps:- Supply Systems- Exhaust Systems
• Process:- Hydraulic Systems- Injection Molding- Drying- Heating- Cooling- Material Handling- Painting- Stamping- Welding, Weld Gas
• Building Envelope:- Dock Doors- Building Operations

Energy Hunt Example: Southview Electric Peak Demand Management
12
Annual savings of $92K
Plant demand was peaking on Sunday night start up by turning on several machines simultaneously.
New procedure was written to stagger start the equipment eliminating the excess peak demand.
Plant eliminated 700 to 900 kW @ $8.64/month/kW

13
Lighting Retrofit Projects Retrofit of metal halide lighting with T-5 fluorescent in manufacturing facilities
Completed Projects (others pending)
Simple payback period: 1.9 years
Business Capital ($)Annual
Savings ($) Tons CO2
Automotive Experience $2,449,421 $1,312,903 10,108
BuildingEfficiency $1,965,956 $1,239,998 7,852
Power Solutions $1,755,838 $710,469 5,075
$6,171,215 $3,263,370 23,035
020406080
100120140
1:00
:00
AM
12:0
0:00
PM
11:0
0:00
PM
10:0
0:00
AM
9:00
:00
PM
8:00
:00
AM
7:00
:00
PM
6:00
:00
AM
5:00
:00
PM
4:00
:00
AM
3:00
:00
PM
2:00
:00
AM
1:00
:00
PM
12:0
0:00
AM
11:0
0:00
AM
10:0
0:00
PM
9:00
:00
AM
8:00
:00
PM
7:00
:00
AM
6:00
:00
PM
5:00
:00
AM
4:00
:00
PM
3:00
:00
AM
2:00
:00
PM
1:00
:00
AM
12:0
0:00
PM
11:0
0:00
PM
10:0
0:00
AM
9:00
:00
PM
8:00
:00
AM
7:00
:00
PM
Pow
er (k
W)
Rockwood Data LoggerBefore
Installation Activity
Plant Shutdown
After

14
Global Enterprise Monitoring and Reporting

Plant Sustainability Scorecard
15
Sample Sustainability Scorecard – Athens, TN Plant

Questions ?

Federal Mandatory GHG Reporting Rule
Overview
Walt TunnessenUS EPA Climate Protection Partnership Division

2
Purpose of the Rule
• Provide accurate and timely data to inform future climate change policies and programs
– Better understand relative emissions of specific industries, and of individual facilities within those industries
– Better understand factors that influence GHG emission rates and actions facilities could take to reduce emissions
• Collecting this information under the CAA: Does not require an endangerment finding Does not make greenhouse gases a regulated pollutant under the Prevention
of Significant Deterioration (PSD) program
• Does not require control of GHG
• Signed September 22, 2009

3
Key Elements of the Rule
• Annual reporting of GHG by:– Direct emitters (25 source categories)– Suppliers of fuel and industrial GHG (5 categories)– Motor vehicle and engine suppliers
• 25,000 metric tons CO2e per year or “All-in” reporting threshold for most sources; capacity-based thresholds where feasible
• Direct reporting to EPA electronically
• EPA verification of emissions data

4
Upstream Sources
• Suppliers of Coal-based Liquid Fuels• Suppliers of Petroleum Products• Suppliers of Natural Gas and Natural Gas Liquids• Suppliers of Industrial GHGs• Suppliers of Carbon Dioxide (CO2)
Downstream Sources
• General Stationary Fuel Combustion Sources
• Electricity Generation• Adipic Acid Production• Aluminum Production• Ammonia Manufacturing• Cement Production• Ferroalloy Production• Glass Production• HCFC-22 Production
and HFC-23 Destruction• Hydrogen Production• Iron and Steel Production• Lead Production
Mobile Sources •Vehicles and engines outside of the light-duty sector (light-duty in NPRM to EstablishLight-Duty Vehicle Greenhouse Gas Emission Standards and Corporate Fuel Economy Standards)
Source Categories in the Final Rule*
• Lime Manufacturing• Miscellaneous Uses of Carbonates• Nitric Acid Production• Petrochemical Production• Petroleum Refineries• Phosphoric Acid Production• Pulp and Paper Manufacturing• Silicon Carbide Production• Soda Ash Manufacturing• Titanium Dioxide Production• Zinc Production• Municipal Solid Waste Landfills• Manure Management
* EPA delayed inclusion of the following source categories as we consider the comments and options: Electronics Manufacturing, Ethanol Production, Fluorinated GHG Production, Food Processing, Magnesium Production, Oil and Natural Gas Systems, Sulfur Hexafluoride (SF6) from Electrical Equipment, Underground Coal Mines, Industrial Landfills, Wastewater Treatment, Suppliers of Coal

5
GHG’s to be reported
Direct emissions of:• CO2
• CH4 (methane)
• N2O (nitrous oxide)
• Fluorinated GHGs– HFCs (hydrofluorocarbons)– PFCs (perfluorocarbons)– SF6 (sulfur hexafluoride)– Other fluorinated gases (except CFC and HCFC and gases <1 mm
Hg @25oC)
• Indirect emissions, Scope 2 or Scope 3 emissions, as defined by the WRI GHG Protocol are not reported.

66
Level of Reporting
For Downstream sources:• Facility based reporting for all source categories for
which there are methods
• Annual Reporting to EPA Data collection will begin January 1, 2010 with first reports
submitted to EPA March 31, 2011.
Exception: Those facilities already reporting quarterly for existing mandatory programs (e.g., Acid Rain Program) will continue to report quarterly

77
Who must report?
1. Sites in “All in Source Categories”
2. Sites in “Threshold Sources Categories” with emissions-based threshold of 25,000 metric tons of carbon dioxide equivalent (CO2e) per year
3. Sites with “Stationary Fuel Combustion” units with emissions-based threshold of 25,000 metric tons of carbon dioxide equivalent (CO2e) per year for most sources (other than mobile sources)
Approximately 85% of total U.S. greenhouse gas emissions covered by rule (about 10,000 reporters)

8
All-in Source Categories
Electricity Generation if report CO2
year-round through Part 75
Adipic Acid Production
Aluminum Production
Ammonia Manufacturing
Cement Production
HCFC-22 Production
HFC-23 Destruction Processes that are not collocated with a HCFC-22 production facility and that destroy more than 2.14 metric tons of HFC-23 per year
Lime Manufacturing
Nitric Acid Production
Petrochemical Production
Petroleum Refineries
Phosphoric Acid Production
Silicon Carbide Production
Soda Ash Production
Titanium Dioxide Production
Municipal Solid Waste Landfillsthat generate CH4 equivalent to 25,000 metric tons CO2e or more per year
Manure Management Systemswith combined CH4 and N2O emissions in amounts equivalent to 25,000 metric tons CO2e or more per year.
*Source categories are defined in each subpart.
Sites meeting the definition of this source category must report

9
Source Categories with thresholds
Facilities meeting the definition of a source category must report if emissions from both process and stationary combustion units exceeds 25,000 metric ton of CO2e
– Ferroalloy Production. – Glass Production. – Hydrogen Production. – Iron and Steel Production. – Lead Production. – Pulp and Paper Manufacturing. – Zinc Production.

10
Stationary fuel combustion
• Stationary fuel combustion sources are devices that combust any solid, liquid, or gaseous fuel generally to:
– Produce electricity, steam, useful heat, or energy for industrial, commercial, or institutional use; or
– Reduce the volume of waste by removing combustible matter.
• These devices include, but are not limited to:– boilers, – combustion turbines, – engines,– incinerators, and – process heaters.
• But generally excludes:– Flares (unless otherwise required by another subpart), – portable equipment, and emergency generators, – emergency equipment, – ‘agricultural irrigation pumps, and – combustion of hazardous waste (except for co-fired fuels).

11
Assessing Applicability to the Rule
• A facility can have multiple source categories.
• You must evaluate each source category separately to assess applicability to the rule.– “All-in” source categories– Threshold categories– Stationary fuel combustion
• If rule applies, report emissions for all source categories for which methods are provided in the rule.
• All GHG, expect CO2 from biomass, must be converted to CO2e to determine total annual emissions.

12
Does the Rule Apply to My Facility?

13
How much is 25,000 MTCO2e?
• Equivalent to: Annual greenhouse gas emissions from the energy use of
approximately 2,300 homes
Annual greenhouse gas emissions from approximately 4,600 passenger vehicles
• Majority of commercial building owners not likely to meet reporting threshold
• Applicability Tool available online to help facilities assess whether they are required to report:– www.epa.gov/climatechange/emissions/GHG-
calculator/index.html

1414
GHG Calculation Methods
• Methods for calculating GHG emissions are provided in the rule’s subparts.
• Subpart C applies to stationary source combustion units.– There are four different “Tiers” for calculating GHG emissions under
Subpart C
• Monitoring and data requirements provided in Subparts.
• Most of methods follow established GHG inventory and calculation approaches for direct emissions.
• Will involve collecting energy data.
15
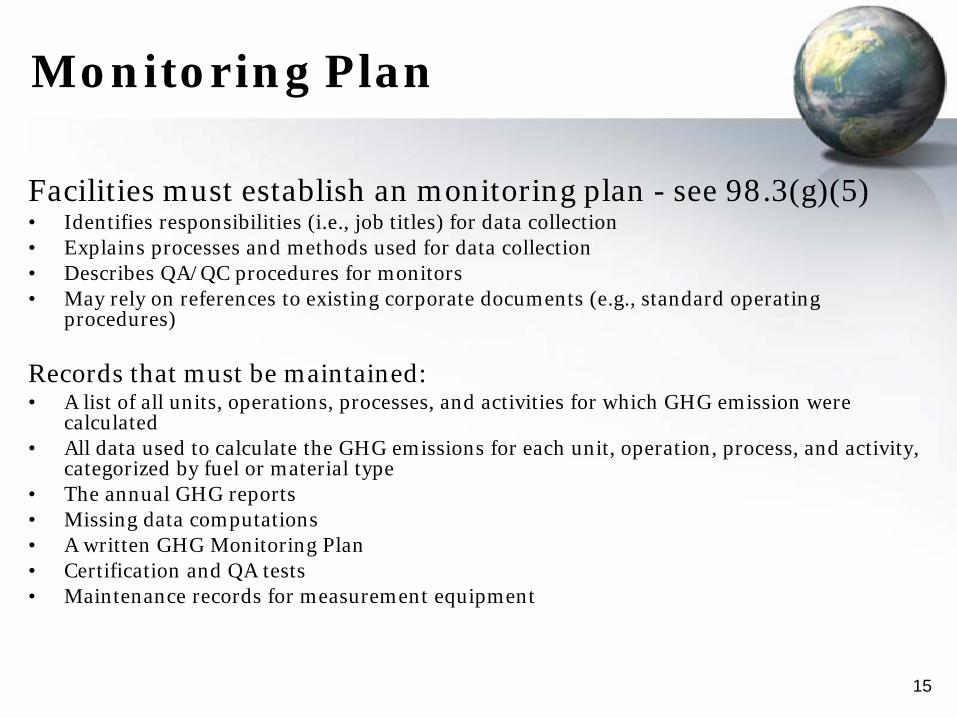
Monitoring Plan
Facilities must establish an monitoring plan - see 98.3(g)(5)• Identifies responsibilities (i.e., job titles) for data collection• Explains processes and methods used for data collection• Describes QA/QC procedures for monitors• May rely on references to existing corporate documents (e.g., standard operating
procedures)
Records that must be maintained:• A list of all units, operations, processes, and activities for which GHG emission were
calculated• All data used to calculate the GHG emissions for each unit, operation, process, and activity,
categorized by fuel or material type• The annual GHG reports• Missing data computations• A written GHG Monitoring Plan• Certification and QA tests• Maintenance records for measurement equipment
16
Electronic Data Reporting System
Facilities will report using an electronic reporting system:
• Electronic format and system under development
• Web-based system
– Will guide reporters through data entry and submission
– Built-in emissions calculations
• Mechanism to submit file directly using standard format (e.g., XML)

17
Emissions Verification
• Self certification– Designated representative certifies and submits report
– Rule allows one designated representative for each facility and supplier
• EPA verification– Reports submitted through an electronic system
– Built-in calculation and completeness checks for reporters
– Additional EPA electronic QA and consistency checks
– Electronic verification and targeted audits

18
Schedule for Monitoring and Reporting
1/1/10 Start collecting data using best available monitoring methods OR CEMS, if installed
3/31/10 Monitors installed
Monitors calibrated
Begin using required monitoring methods (if extension request not obtained)
12/31/10 Complete 2010 data collection
1/1/2011 Must have installed and certified CEMs for collecting CO2 emissions data
1/30/11 Submit certificate of representation
3/31/11 Submit GHG report for 2010
Ongoing Submit corrected report 45 days after each discovery
Ongoing Submit annual reports on 3/31 each year
19
Stopping Annual Reporting
• If annual reports demonstrate CO2e <25,000 metric tons/yr for 5 consecutive years.
• If annual reports demonstrate CO2e <15,000 metric tons/yr for 3 consecutive years.
• If you shut down all processes/units/supply operations covered by the rule.
(See 98.3(h)(i)), p. 621-622)

20
Technical Assistance
• On-line applicability tool: – Assists potential reporters in assessing whether they are required to
report
• Technical assistance materials (e.g., Information Sheets on rule subparts)
• EPA will host several trainings and webinars
• Telephone hotline
• For complete list of materials and training schedule, see: www.epa.gov/climatechange/emissions/ghgrulemaking.html

21
For More Information
• Preamble and final regulatory text available at our website– After publication in the FR at www.regulations.gov
• Additional information including a training schedule:www.epa.gov/climatechange/emissions/ghgrulemaking.html
• Hotline: Telephone: 1-877-GHG-1188
Email: [email protected]
This presentation is provided solely for informational purposes. It does not provide legal advice, have legally binding effect, or expressly or implicitly create, expand, or limit any legal rights, obligations, responsibilities, expectations, or benefits in regard to any person.

5
Discussion
• Use * 6 to un-mute phone
• # 6 to re-mute phone

6
November Web Conferences
Energy management financing strategies:
• David Hitchings, Northrop Grumman unique project accounting approach
• Derek Supple, JCI’s Survey on Energy Efficiency Indicator
Register at:Energystar.webex.com/meeting

7
• Thank you