energy & power industry update - harris williams & co....superstition.”if you have not...
TRANSCRIPT

Energy & Power Industry UpdateJune 2011
Member FINRA/SIPC
June 2011
www.harriswilliams.com
Energy & Power Industry UpdateJune 2011
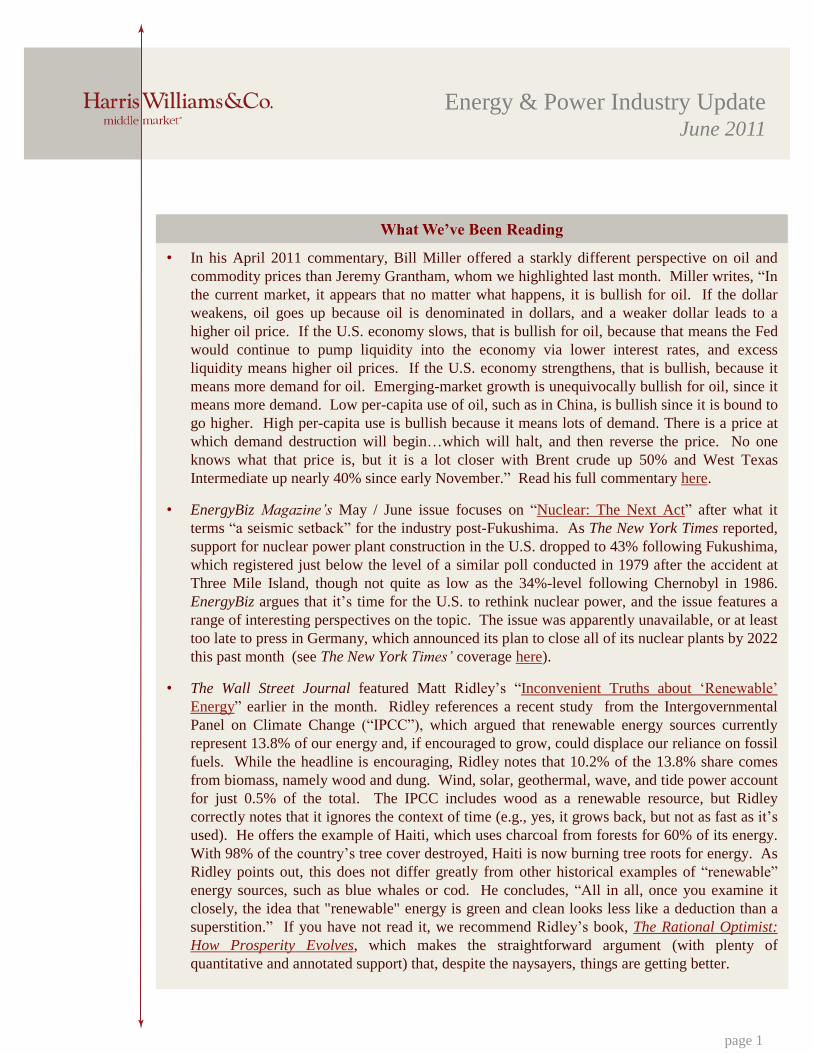
What We’ve Been Reading
page 1
• In his April 2011 commentary, Bill Miller offered a starkly different perspective on oil and
commodity prices than Jeremy Grantham, whom we highlighted last month. Miller writes, “In
the current market, it appears that no matter what happens, it is bullish for oil. If the dollar
weakens, oil goes up because oil is denominated in dollars, and a weaker dollar leads to a
higher oil price. If the U.S. economy slows, that is bullish for oil, because that means the Fed
would continue to pump liquidity into the economy via lower interest rates, and excess
liquidity means higher oil prices. If the U.S. economy strengthens, that is bullish, because it
means more demand for oil. Emerging-market growth is unequivocally bullish for oil, since it
means more demand. Low per-capita use of oil, such as in China, is bullish since it is bound to
go higher. High per-capita use is bullish because it means lots of demand. There is a price at
which demand destruction will begin…which will halt, and then reverse the price. No one
knows what that price is, but it is a lot closer with Brent crude up 50% and West Texas
Intermediate up nearly 40% since early November.” Read his full commentary here.
• EnergyBiz Magazine’s May / June issue focuses on “Nuclear: The Next Act” after what it
terms “a seismic setback” for the industry post-Fukushima. As The New York Times reported,
support for nuclear power plant construction in the U.S. dropped to 43% following Fukushima,
which registered just below the level of a similar poll conducted in 1979 after the accident at
Three Mile Island, though not quite as low as the 34%-level following Chernobyl in 1986.
EnergyBiz argues that it‟s time for the U.S. to rethink nuclear power, and the issue features a
range of interesting perspectives on the topic. The issue was apparently unavailable, or at least
too late to press in Germany, which announced its plan to close all of its nuclear plants by 2022
this past month (see The New York Times’ coverage here).
• The Wall Street Journal featured Matt Ridley‟s “Inconvenient Truths about „Renewable‟
Energy” earlier in the month. Ridley references a recent study from the Intergovernmental
Panel on Climate Change (“IPCC”), which argued that renewable energy sources currently
represent 13.8% of our energy and, if encouraged to grow, could displace our reliance on fossil
fuels. While the headline is encouraging, Ridley notes that 10.2% of the 13.8% share comes
from biomass, namely wood and dung. Wind, solar, geothermal, wave, and tide power account
for just 0.5% of the total. The IPCC includes wood as a renewable resource, but Ridley
correctly notes that it ignores the context of time (e.g., yes, it grows back, but not as fast as it‟s
used). He offers the example of Haiti, which uses charcoal from forests for 60% of its energy.
With 98% of the country‟s tree cover destroyed, Haiti is now burning tree roots for energy. As
Ridley points out, this does not differ greatly from other historical examples of “renewable”
energy sources, such as blue whales or cod. He concludes, “All in all, once you examine it
closely, the idea that "renewable" energy is green and clean looks less like a deduction than a
superstition.” If you have not read it, we recommend Ridley‟s book, The Rational Optimist:
How Prosperity Evolves, which makes the straightforward argument (with plenty of
quantitative and annotated support) that, despite the naysayers, things are getting better.

Energy & Power Industry UpdateJune 2011
LTM EBITDA Multiples1
Industry Observations
LTM Indexed Stock Performance1
Indexed LTM EBITDA Multiples1
• The Infrastructure and Industrial Services, Energy, and Power Stock experienced slight
declines in May in the face of economic headwinds.
• Many commodity prices have exhibited increased instability amidst rising fears of an economic
double-dip and recent economic uncertainty:
– Gasoline, at $2.98 per gallon, has fallen 12.4% since late-April highs.
– Coal prices have continued to rise as energy demand has rebounded along with the
economy.
– The North American Rotary Rig Count is more than double its six year low of 876.
60
80
100
120
140
160
180
Jun-10 Jul-10 Aug-10 Sep-10 Oct-10 Nov-10 Dec-10 Jan-11 Feb-11 Mar-11 Apr-11 May-11 Jun-11
S&P 500 Energy Power Industrial & Infrastructure Services
0
20
40
60
80
100
120
Jun-08 Sep-08 Dec-08 Mar-09 Jun-09 Sep-09 Dec-09 Mar-10 Jun-10 Sep-10 Dec-10 Mar-11 Jun-11
Energy Power Industrial & Infrastructure Services
page 2
Index
%
Change
S&P 25.64
Energy 50.51
Power 27.59
I & IS 38.45
Index
%
Change
Energy 7.09
Power (22.74)
I & IS (35.69)
Energy & Power Industry UpdateJune 2011
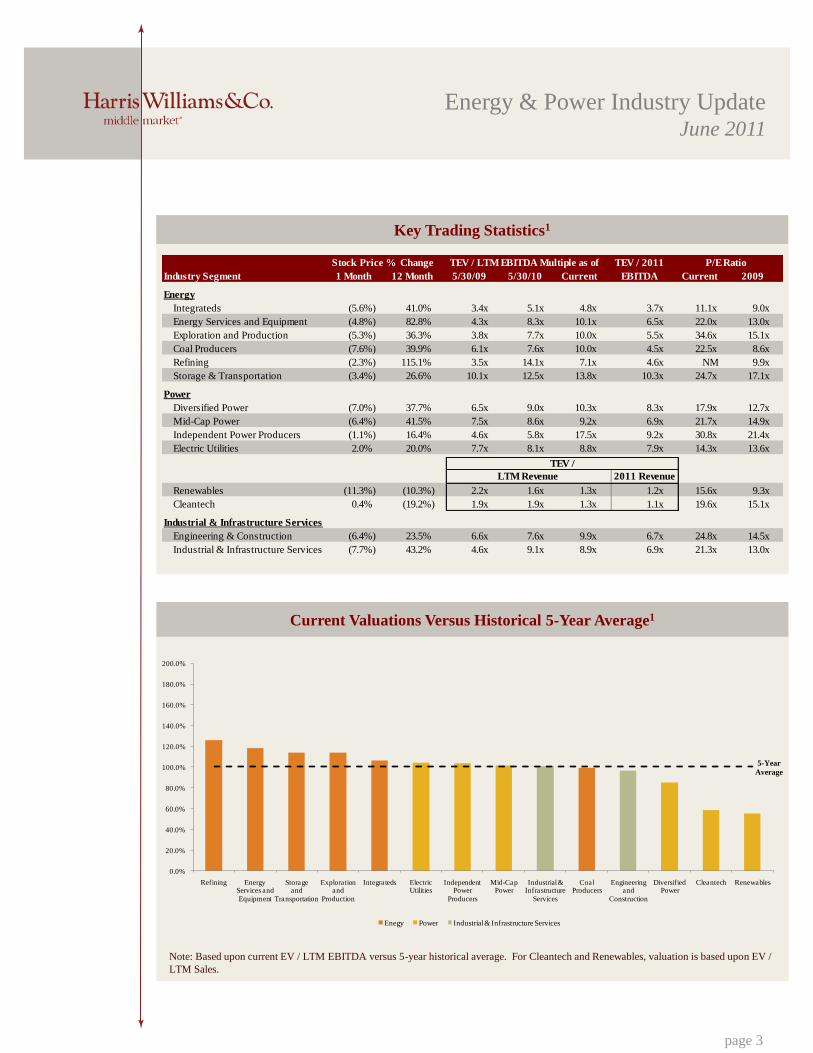
Key Trading Statistics1
Current Valuations Versus Historical 5-Year Average1
Note: Based upon current EV / LTM EBITDA versus 5-year historical average. For Cleantech and Renewables, valuation is based upon EV /
LTM Sales.
5-Year
Average
0.0%
20.0%
40.0%
60.0%
80.0%
100.0%
120.0%
140.0%
160.0%
180.0%
200.0%
Refining Energy Services and
Equipment
Storage and
Transportation
Exploration and
Production
Integrateds Electric Utilities
Independent Power
Producers
Mid-Cap Power
Industrial & Infrastructure
Services
Coal Producers
Engineering and
Construction
Diversified Power
Cleantech Renewables
page 3
0.0%
20.0%
40.0%
60.0%
80.0%
100.0%
120.0%
140.0%
160.0%
180.0%
200.0%
Enegy Power Industrial & Infrastructure Services
Enegy Power Industrial & Infrastructure Services
Stock Price % Change TEV / 2011 P/E Ratio
Industry Segment 1 Month 12 Month 5/30/09 5/30/10 Current EBITDA Current 2009
Energy
Integrateds (5.6%) 41.0% 3.4x 5.1x 4.8x 3.7x 11.1x 9.0x
Energy Services and Equipment (4.8%) 82.8% 4.3x 8.3x 10.1x 6.5x 22.0x 13.0x
Exploration and Production (5.3%) 36.3% 3.8x 7.7x 10.0x 5.5x 34.6x 15.1x
Coal Producers (7.6%) 39.9% 6.1x 7.6x 10.0x 4.5x 22.5x 8.6x
Refining (2.3%) 115.1% 3.5x 14.1x 7.1x 4.6x NM 9.9x
Storage & Transportation (3.4%) 26.6% 10.1x 12.5x 13.8x 10.3x 24.7x 17.1x
Power
Diversified Power (7.0%) 37.7% 6.5x 9.0x 10.3x 8.3x 17.9x 12.7x
Mid-Cap Power (6.4%) 41.5% 7.5x 8.6x 9.2x 6.9x 21.7x 14.9x
Independent Power Producers (1.1%) 16.4% 4.6x 5.8x 17.5x 9.2x 30.8x 21.4x
Electric Utilities 2.0% 20.0% 7.7x 8.1x 8.8x 7.9x 14.3x 13.6x
Renewables (11.3%) (10.3%) 2.2x 1.6x 1.3x 1.2x 15.6x 9.3x
Cleantech 0.4% (19.2%) 1.9x 1.9x 1.3x 1.1x 19.6x 15.1x
Industrial & Infrastructure Services
Engineering & Construction (6.4%) 23.5% 6.6x 7.6x 9.9x 6.7x 24.8x 14.5x
Industrial & Infrastructure Services (7.7%) 43.2% 4.6x 9.1x 8.9x 6.9x 21.3x 13.0x
2011 Revenue
TEV /
TEV / LTM EBITDA Multiple as of
LTM Revenue

Energy & Power Industry UpdateJune 2011
Gasoline and Ethanol1
Oil1 Natural Gas1
U.S. Rig Counts3
Electricity Prices1Coal1
0.00
20.00
40.00
60.00
80.00
100.00
120.00
Jun
-10
Jul-
10
Au
g-1
0
Sep
-10
Oct-
10
No
v-1
0
Dec-1
0
Jan
-11
Feb
-11
Ma
r-1
1
Ap
r-1
1
Ma
y-1
1
($ p
er b
bl)
0.00
1.00
2.00
3.00
4.00
5.00
6.00
Jun
-10
Jul-
10
Au
g-1
0
Sep
-10
Oct-
10
No
v-1
0
Dec-1
0
Jan
-11
Feb
-11
Ma
r-1
1
Ap
r-1
1
Ma
y-1
1
($ p
er M
MB
tu)
0.00
0.75
1.50
2.25
3.00
3.75
Jun
-10
Jul-
10
Au
g-1
0
Sep
-10
Oct-
10
No
v-1
0
Dec-1
0
Jan
-11
Feb
-11
Ma
r-1
1
Ap
r-1
1
Ma
y-1
1
($ p
er g
all
on
)
Gasoline Ethanol
0
500
1,000
1,500
2,000
2,500
Ma
r-1
0
Ap
r-1
0
Ma
y-1
0
Jun
-10
Jul-
10
Au
g-1
0
Sep
-10
Oct-
10
No
v-1
0
Dec-1
0
Jan
-11
Feb
-11
Ma
r-1
1
Ap
r-1
1
(# r
igs)
0.0
40.0
80.0
120.0
160.0
0.0
20.0
40.0
60.0
80.0
100.0
Jun
-10
Jul-
10
Au
g-1
0
Sep
-10
Oct-
10
No
v-1
0
Dec-1
0
Jan
-11
Feb
-11
Ma
r-1
1
Ap
r-1
1
Ma
y-1
1 ($ p
er t
on
-R
ott
erd
am
)
($ p
er t
on
-C
en
tra
l
Ap
pa
lach
ian
)
Central Appalachian Rotterdam
0.00
20.00
40.00
60.00
80.00
100.00
Jun
-10
Jul-
10
Au
g-1
0
Sep
-10
Oct-
10
No
v-1
0
Dec-1
0
Jan
-11
Feb
-11
Ma
r-1
1
Ap
r-1
1
Ma
y-1
1
($ p
er M
Wg
)
$100.29 per bbl
$61.00 per MWg
page 4
$4.63 per MMBtu
$2.65 per gallon
$2.98 per gallon
$77.05 per ton
$122.20 per ton
1,973 rigs
Energy & Power Industry UpdateJune 2011
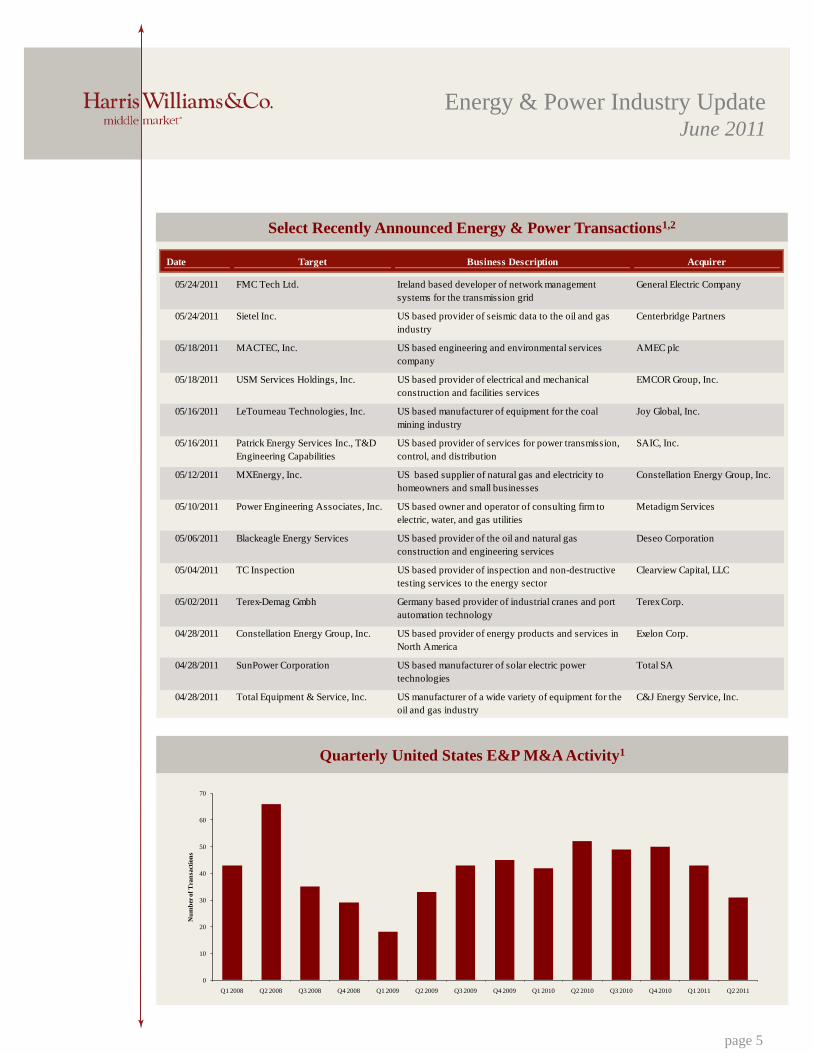
Quarterly United States E&P M&A Activity1
Select Recently Announced Energy & Power Transactions1,2
page 5
0
10
20
30
40
50
60
70
Q1 2008 Q2 2008 Q3 2008 Q4 2008 Q1 2009 Q2 2009 Q3 2009 Q4 2009 Q1 2010 Q2 2010 Q3 2010 Q4 2010 Q1 2011 Q2 2011
Nu
mb
er o
f T
ran
sact
ion
s
Date Target Business Description Acquirer
05/24/2011 FMC Tech Ltd. Ireland based developer of network management
systems for the transmission grid
General Electric Company
05/24/2011 Sietel Inc. US based provider of seismic data to the oil and gas
industry
Centerbridge Partners
05/18/2011 MACTEC, Inc. US based engineering and environmental services
company
AMEC plc
05/18/2011 USM Services Holdings, Inc. US based provider of electrical and mechanical
construction and facilities services
EMCOR Group, Inc.
05/16/2011 LeTourneau Technologies, Inc. US based manufacturer of equipment for the coal
mining industry
Joy Global, Inc.
05/16/2011 Patrick Energy Services Inc., T&D
Engineering Capabilities
US based provider of services for power transmission,
control, and distribution
SAIC, Inc.
05/12/2011 MXEnergy, Inc. US based supplier of natural gas and electricity to
homeowners and small businesses
Constellation Energy Group, Inc.
05/10/2011 Power Engineering Associates, Inc. US based owner and operator of consulting firm to
electric, water, and gas utilities
Metadigm Services
05/06/2011 Blackeagle Energy Services US based provider of the oil and natural gas
construction and engineering services
Deseo Corporation
05/04/2011 TC Inspection US based provider of inspection and non-destructive
testing services to the energy sector
Clearview Capital, LLC
05/02/2011 Terex-Demag Gmbh Germany based provider of industrial cranes and port
automation technology
Terex Corp.
04/28/2011 Constellation Energy Group, Inc. US based provider of energy products and services in
North America
Exelon Corp.
04/28/2011 SunPower Corporation US based manufacturer of solar electric power
technologies
Total SA
04/28/2011 Total Equipment & Service, Inc. US manufacturer of a wide variety of equipment for the
oil and gas industry
C&J Energy Service, Inc.

Energy & Power Industry UpdateJune 2011
Member FINRA/SIPC
June 2011
Stock Performance Net Debt / Current Price Change from Change from % of TEV / 2011 P/ERatio EBITDATEV / LTM EBITDA Multiple as ofCurrent Price Change from Change from % of TEV / 2011 P/E Ratio EBITDA
TEV 5/30/11 Prior Month Prior Year LTM High 5/30/09 5/30/10 Current EBITDA Current 2011 5/30/2010TEV / LTM EBITDA Multiple as of
Energy
IntegratedsExxon Mobil Corporation $416,136.5 $82.97 (5.7%) 37.2% 94.0% 4.7x 6.6x 6.7x 4.3x 11.8x 9.2x 0.1xChevron Corporation $202,928.0 $104.08 (4.9%) 40.9% 94.7% 3.5x 4.8x 4.9x 3.4x 10.0x 7.7x (0.2x)p $ , $ ( ) ( )ConocoPhillips $122,860.1 $73.18 (7.2%) 41.1% 89.5% 2.9x 5.4x 4.8x 3.8x 8.7x 8.2x 1.0xOccidental Petroleum Corporation $89,276.1 $108.00 (5.5%) 30.9% 91.6% 4.6x 7.6x 7.9x 5.2x 17.8x 11.1x 0.3xMarathon Oil Corporation $40,405.2 $53.80 (0.4%) 73.0% 99.0% 3.4x 4.8x 4.4x 3.5x 12.2x 8.7x 0.4xHess Corporation $30,456.1 $78.31 (8.9%) 47.2% 89.6% 0.0x 0.0x 4.5x 3.6x 10.4x 9.5x 0.7x
Median (5.6% ) 41.0% 92.8% 3.4x 5.1x 4.8x 3.7x 11.1x 9.0x 0.4x
Energy Services and EquipmentLarge Cap Diversified
S hl b Li i d $119 606 4 $85 40 (4 8%) 52 1% 89 3% 8 1 10 7 15 2 9 3 24 3 16 5 0 7Schlumberger Limited $119,606.4 $85.40 (4.8%) 52.1% 89.3% 8.1x 10.7x 15.2x 9.3x 24.3x 16.5x 0.7xHalliburton Company $47,845.9 $50.39 (0.2%) 102.9% 97.9% 4.9x 8.6x 10.5x 6.8x 21.8x 13.2x 0.7xBaker Hughes Incorporated $34,629.3 $74.21 (4.1%) 94.6% 93.6% 0.0x 0.0x 11.0x 6.4x 29.4x 14.0x 1.7xNational Oilwell Varco, Inc. $28,592.4 $72.83 (5.0%) 91.0% 88.0% 4.1x 5.0x 9.7x 7.4x 18.5x 14.0x (0.8x)Weatherford International Ltd. $21,602.4 $19.75 (8.5%) 39.9% 70.3% 8.0x 11.8x 11.1x 6.3x NM 12.3x 4.7x
Median (4.8% ) 91.0% 89.3% 4.9x 8.6x 11.0x 6.8x 23.1x 14.0x 0.7x
Mid and Small Cap Equipment and Service ProvidersCameron International Corporation $11,454.5 $47.98 (9.0%) 32.5% 76.0% 6.2x 8.9x 11.0x 8.0x 21.4x 13.7x (0.2x)p ( ) ( )Oil States International Inc. $4,878.0 $78.82 (5.0%) 101.9% 94.8% 2.9x 6.6x 11.1x 6.7x 22.1x 12.6x 2.8xRPC Inc. $3,820.6 $25.00 (7.6%) 232.2% 86.1% 4.7x 10.8x 8.4x 5.2x 18.3x 10.9x 1.2xExterran Holdings, Inc. $3,338.0 $21.46 (1.2%) (15.8%) 71.6% 6.1x 7.2x 8.1x 6.3x NM NM 3.2xComplete Production Services, Inc. $3,133.4 $33.08 (2.5%) 154.3% 95.2% 2.8x 11.1x 7.0x 4.5x 20.7x 10.0x 3.6xKey Energy Services Inc. $3,107.6 $17.71 (2.7%) 85.3% 93.6% 3.1x 17.5x 18.5x 5.9x NM 12.9x 5.9xDril-Quip, Inc. $2,686.9 $73.68 (3.8%) 51.3% 87.9% 9.4x 10.0x 16.3x 11.7x 30.1x 19.3x (1.6x)Basic Energy Services, Inc. $1,724.3 $27.66 (10.0%) 239.0% 87.7% 3.3x 24.4x 10.7x 5.4x NM 14.5x 18.4x
Median (4.4% ) 93.6% 87.8% 4.0x 10.4x 10.9x 6.1x 21.4x 12.9x 3.0x
page 6

Energy & Power Industry UpdateJune 2011
Member FINRA/SIPC
June 2011
Stock Performance Net Debt / Current Price Change from Change from % of TEV / 2011 P/ERatio EBITDATEV / LTM EBITDA Multiple as ofCurrent Price Change from Change from % of TEV / 2011 P/E Ratio EBITDA
TEV 5/30/11 Prior Month Prior Year LTM High 5/30/09 5/30/10 Current EBITDA Current 2011 5/30/2010TEV / LTM EBITDA Multiple as of
Construction and Equipment ContractorsTransocean Ltd. $29,525.1 $69.28 (4.8%) 22.0% 80.6% 5.7x 5.0x 8.3x 6.4x 52.3x 10.8x 1.3xNoble Corp. $13,622.1 $41.61 (3.3%) 43.1% 89.1% 4.0x 3.2x 13.2x 6.7x 23.3x 10.3x 1.2xNabors Industries Ltd. $11,745.6 $27.88 (9.0%) 46.5% 85.9% 4.6x 7.2x 7.8x 5.2x 55.1x 11.3x 3.3xDiamond Offshore Drilling Inc $10 629 0 $73 20 (3 5%) 16 0% 90 2% 5 0x 4 2x 6 3x 7 1x 11 1x 13 3x 0 2xDiamond Offshore Drilling Inc. $10,629.0 $73.20 (3.5%) 16.0% 90.2% 5.0x 4.2x 6.3x 7.1x 11.1x 13.3x 0.2xTechnip $9,476.2 $106.50 (5.7%) 62.0% 96.3% 2.3x 4.6x 8.6x NA 19.1x NA (1.7x)Subsea 7 SA $9,239.6 $26.48 0.6% 73.6% 92.4% 3.1x 5.9x 18.3x NA 20.0x NA (0.1x)Pride International Inc. $9,158.9 $41.50 (5.5%) 67.5% 93.9% 5.5x 9.8x 21.1x 8.8x 37.9x 12.3x 3.4xHelmerich & Payne Inc. $6,802.4 $62.34 (6.0%) 65.4% 88.5% 4.1x 6.7x 7.9x 5.9x 19.2x 14.0x 0.2xRowan Companies Inc. $6,048.0 $39.45 (5.4%) 59.3% 88.0% 3.0x 5.5x 11.5x 6.7x 19.5x 10.5x 1.7xPatterson-UTI Energy Inc. $5,256.5 $31.54 1.3% 124.8% 99.2% 2.7x 9.0x 8.2x 4.7x 26.6x 12.1x 1.5xOceaneering International, Inc. $4,167.0 $81.58 (6.7%) 76.3% 88.3% 6.9x 5.8x 9.2x 7.7x 21.6x 17.0x (0.4x)Hercules Offshore, Inc. $1,562.8 $6.29 0.2% 101.6% 90.0% 3.2x 10.8x 8.6x 9.6x NM NM 6.8x, $ , $Pioneer Drilling Co. $1,062.9 $14.72 (5.0%) 148.2% 90.6% 2.6x 10.5x 8.1x 4.7x NM 20.8x 4.9xCal Dive International Inc $773.8 $6.60 (16.0%) 19.5% 80.6% 5.1x 5.1x 11.5x 5.2x NM 13.6x 1.2x
Median (5.2% ) 63.7% 89.5% 4.1x 5.9x 8.6x 6.5x 21.6x 12.3x 1.3x
Exploration and ProductionLarge Cap
Apache Corp. $56,290.8 $123.40 (7.5%) 37.8% 92.0% 4.2x 4.9x 5.7x 4.2x 13.3x 9.3x 1.2xAnadarko Petroleum Corporation $49,766.0 $79.09 0.2% 51.1% 92.5% 4.9x 7.3x 9.1x 5.1x 150.2x 18.5x 2.0xD E C ti $38 996 8 $83 42 (8 3%) 30 6% 89 2% 4 1 6 1 7 9 5 2 22 0 10 4 0 7Devon Energy Corporation $38,996.8 $83.42 (8.3%) 30.6% 89.2% 4.1x 6.1x 7.9x 5.2x 22.0x 10.4x 0.7xEOG Resources, Inc. $32,644.7 $108.25 (4.2%) 3.3% 89.1% 4.0x 14.7x 13.6x 5.3x 155.3x 17.7x 1.8xChesapeake Energy Corporation $31,952.5 $31.20 (7.3%) 39.7% 86.8% 1.4x 4.6x 11.1x 5.3x 26.2x 9.8x 1.6xNoble Energy, Inc. $17,685.7 $92.61 (3.8%) 55.7% 93.6% 4.1x 8.2x 11.0x 5.5x 32.6x 14.0x 1.0xSouthwestern Energy Co. $16,276.3 $43.21 (1.5%) 14.9% 95.5% 6.9x 9.6x 10.3x 7.5x 26.6x 18.4x 0.8xMurphy Oil Corporation $13,077.7 $68.56 (11.5%) 28.4% 87.7% 3.6x 3.9x 4.5x 3.3x 14.4x 8.7x (0.1x)Pioneer Natural Resources Co. $12,774.1 $92.09 (9.9%) 44.6% 86.8% 5.6x 10.6x 13.6x 5.9x 69.2x 17.5x 2.1xNewfield Exploration Co. $12,177.9 $74.22 4.8% 42.6% 95.2% 1.2x 7.1x 10.2x 5.5x 37.9x 12.0x 1.9xUltra Petroleum Corp $9 013 2 $48 11 (5 3%) 4 5% 89 3% 7 6x 12 4x 10 7x 7 8x 22 6x 16 2x 2 5xUltra Petroleum Corp. $9,013.2 $48.11 (5.3%) 4.5% 89.3% 7.6x 12.4x 10.7x 7.8x 22.6x 16.2x 2.5xQuicksilver Resources Inc. $4,521.0 $14.28 (3.8%) 17.0% 89.4% 7.6x 3.0x 7.6x 8.0x 7.3x 38.6x 1.3x
Median (4.8% ) 34.2% 89.4% 4.1x 7.2x 10.2x 5.4x 26.4x 15.1x 1.5x
page 7
Energy & Power Industry UpdateJune 2011
Member FINRA/SIPC
June 2011
Stock Performance Net Debt / Current Price Change from Change from % of TEV / 2011 P/ERatio EBITDATEV / LTM EBITDA Multiple as ofCurrent Price Change from Change from % of TEV / 2011 P/E Ratio EBITDA
TEV 5/30/11 Prior Month Prior Year LTM High 5/30/09 5/30/10 Current EBITDA Current 2011 5/30/2010TEV / LTM EBITDA Multiple as of
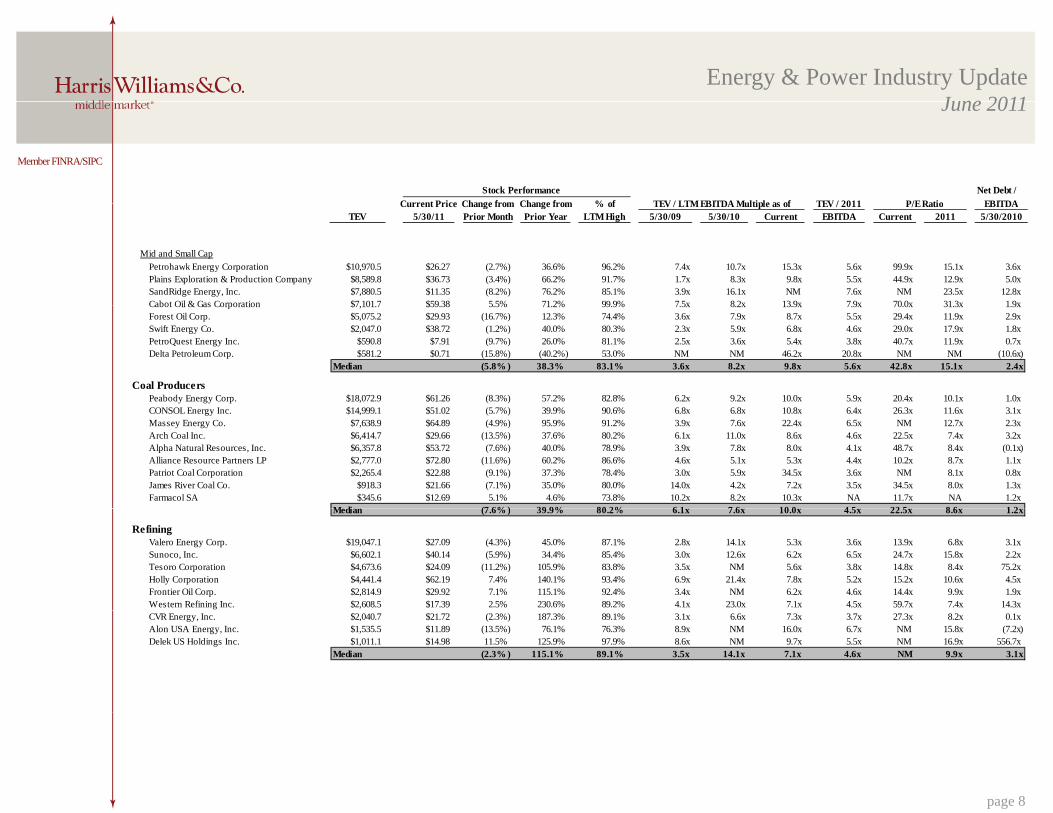
Mid and Small CapPetrohawk Energy Corporation $10,970.5 $26.27 (2.7%) 36.6% 96.2% 7.4x 10.7x 15.3x 5.6x 99.9x 15.1x 3.6xPlains Exploration & Production Company $8,589.8 $36.73 (3.4%) 66.2% 91.7% 1.7x 8.3x 9.8x 5.5x 44.9x 12.9x 5.0xSandRidge Energy, Inc. $7,880.5 $11.35 (8.2%) 76.2% 85.1% 3.9x 16.1x NM 7.6x NM 23.5x 12.8xCabot Oil & Gas Corporation $7 101 7 $59 38 5 5% 71 2% 99 9% 7 5x 8 2x 13 9x 7 9x 70 0x 31 3x 1 9xCabot Oil & Gas Corporation $7,101.7 $59.38 5.5% 71.2% 99.9% 7.5x 8.2x 13.9x 7.9x 70.0x 31.3x 1.9xForest Oil Corp. $5,075.2 $29.93 (16.7%) 12.3% 74.4% 3.6x 7.9x 8.7x 5.5x 29.4x 11.9x 2.9xSwift Energy Co. $2,047.0 $38.72 (1.2%) 40.0% 80.3% 2.3x 5.9x 6.8x 4.6x 29.0x 17.9x 1.8xPetroQuest Energy Inc. $590.8 $7.91 (9.7%) 26.0% 81.1% 2.5x 3.6x 5.4x 3.8x 40.7x 11.9x 0.7xDelta Petroleum Corp. $581.2 $0.71 (15.8%) (40.2%) 53.0% NM NM 46.2x 20.8x NM NM (10.6x)
Median (5.8% ) 38.3% 83.1% 3.6x 8.2x 9.8x 5.6x 42.8x 15.1x 2.4x
Coal ProducersPeabody Energy Corp. $18,072.9 $61.26 (8.3%) 57.2% 82.8% 6.2x 9.2x 10.0x 5.9x 20.4x 10.1x 1.0x
$ $CONSOL Energy Inc. $14,999.1 $51.02 (5.7%) 39.9% 90.6% 6.8x 6.8x 10.8x 6.4x 26.3x 11.6x 3.1xMassey Energy Co. $7,638.9 $64.89 (4.9%) 95.9% 91.2% 3.9x 7.6x 22.4x 6.5x NM 12.7x 2.3xArch Coal Inc. $6,414.7 $29.66 (13.5%) 37.6% 80.2% 6.1x 11.0x 8.6x 4.6x 22.5x 7.4x 3.2xAlpha Natural Resources, Inc. $6,357.8 $53.72 (7.6%) 40.0% 78.9% 3.9x 7.8x 8.0x 4.1x 48.7x 8.4x (0.1x)Alliance Resource Partners LP $2,777.0 $72.80 (11.6%) 60.2% 86.6% 4.6x 5.1x 5.3x 4.4x 10.2x 8.7x 1.1xPatriot Coal Corporation $2,265.4 $22.88 (9.1%) 37.3% 78.4% 3.0x 5.9x 34.5x 3.6x NM 8.1x 0.8xJames River Coal Co. $918.3 $21.66 (7.1%) 35.0% 80.0% 14.0x 4.2x 7.2x 3.5x 34.5x 8.0x 1.3xFarmacol SA $345.6 $12.69 5.1% 4.6% 73.8% 10.2x 8.2x 10.3x NA 11.7x NA 1.2x
M di (7 6% ) 39 9% 80 2% 6 1 7 6 10 0 4 5 22 5 8 6 1 2Median (7.6% ) 39.9% 80.2% 6.1x 7.6x 10.0x 4.5x 22.5x 8.6x 1.2x
RefiningValero Energy Corp. $19,047.1 $27.09 (4.3%) 45.0% 87.1% 2.8x 14.1x 5.3x 3.6x 13.9x 6.8x 3.1xSunoco, Inc. $6,602.1 $40.14 (5.9%) 34.4% 85.4% 3.0x 12.6x 6.2x 6.5x 24.7x 15.8x 2.2xTesoro Corporation $4,673.6 $24.09 (11.2%) 105.9% 83.8% 3.5x NM 5.6x 3.8x 14.8x 8.4x 75.2xHolly Corporation $4,441.4 $62.19 7.4% 140.1% 93.4% 6.9x 21.4x 7.8x 5.2x 15.2x 10.6x 4.5xFrontier Oil Corp. $2,814.9 $29.92 7.1% 115.1% 92.4% 3.4x NM 6.2x 4.6x 14.4x 9.9x 1.9xWestern Refining Inc. $2,608.5 $17.39 2.5% 230.6% 89.2% 4.1x 23.0x 7.1x 4.5x 59.7x 7.4x 14.3xCVR Energy, Inc. $2,040.7 $21.72 (2.3%) 187.3% 89.1% 3.1x 6.6x 7.3x 3.7x 27.3x 8.2x 0.1xAlon USA Energy, Inc. $1,535.5 $11.89 (13.5%) 76.1% 76.3% 8.9x NM 16.0x 6.7x NM 15.8x (7.2x)Delek US Holdings Inc. $1,011.1 $14.98 11.5% 125.9% 97.9% 8.6x NM 9.7x 5.5x NM 16.9x 556.7x
Median (2.3% ) 115.1% 89.1% 3.5x 14.1x 7.1x 4.6x NM 9.9x 3.1x
page 8

Energy & Power Industry UpdateJune 2011
Member FINRA/SIPC
June 2011
Stock Performance Net Debt / Current Price Change from Change from % of TEV / 2011 P/ERatio EBITDATEV / LTM EBITDA Multiple as ofCurrent Price Change from Change from % of TEV / 2011 P/E Ratio EBITDA
TEV 5/30/11 Prior Month Prior Year LTM High 5/30/09 5/30/10 Current EBITDA Current 2011 5/30/2010TEV / LTM EBITDA Multiple as of
Storage & TransportationKinder Morgan Energy Partners LP $36,206.9 $74.54 (3.6%) 17.4% 95.6% 10.7x 13.4x 13.3x 9.9x 45.1x 31.3x 5.2xEl Paso Corp. $33,090.1 $20.94 8.0% 84.7% 97.2% 2.4x 7.9x 13.2x 9.1x 37.2x 16.0x 4.7xPlains All American Pipeline, L.P. $15,489.5 $62.23 (3.1%) 8.1% 94.3% 10.2x 13.4x 14.2x 11.2x 24.7x 17.2x 5.7xEnbridge Energy Partners LP $13,739.1 $30.95 (8.7%) 24.4% 89.5% 9.9x 11.4x 29.2x 10.5x NM 19.4x 5.5xMagellan Midstream Partners LP $8,592.1 $59.23 (3.7%) 35.3% 93.9% 8.2x 15.0x 15.8x 13.3x 19.4x 16.6x 4.6xBuckeye Partners LP $8,442.0 $63.46 (2.5%) 11.9% 88.5% 11.2x 13.0x 22.7x 14.0x 27.0x 17.0x 7.4xSunoco Logistics Partners L.P. $4,190.0 $84.79 (5.8%) 28.8% 93.1% 8.2x 11.3x 11.5x 9.8x 9.1x 15.2x 4.5xHolly Energy Partners L.P $1,583.8 $55.41 1.1% 37.8% 90.8% 13.7x 12.0x 12.4x 10.0x 24.2x 20.0x 5.1x
Median (3.4% ) 26.6% 93.5% 10.1x 12.5x 13.8x 10.3x 24.7x 17.1x 5.2x
Power
Diversified PowerGeneral Electric Co. $592,936.9 $19.59 (4.2%) 19.8% 90.5% 19.2x 27.2x 20.7x 18.2x 15.5x 11.6x 16.6xSiemens AG $114,731.2 $129.13 (11.4%) 43.8% 91.0% 8.3x 7.2x 7.5x 6.5x 13.1x 11.3x 0.1xABB Ltd. $58,886.9 $26.53 (3.7%) 54.6% 94.3% 6.2x 7.3x 11.9x 8.6x 20.6x 15.0x (0.5x)Schneider Electric S.A. $46,437.7 $163.25 (7.7%) 62.4% 92.5% 6.2x 8.3x 10.0x NA 16.9x NA 1.0xEmerson Electric Co. $44,371.4 $54.07 (11.0%) 16.4% 86.9% 6.3x 9.9x 9.4x 8.1x 18.9x 13.9x 0.9xEaton Corporation $20,325.9 $51.09 (4.6%) 46.1% 90.4% 6.9x 9.7x 10.7x 7.6x 16.6x 11.2x 1.8xAlstom SA $20,232.4 $61.29 (8.0%) 27.8% 94.7% 6.4x 4.3x 6.7x NA 26.8x NA 0.9x$ , $ ( )Cooper Industries plc $10,692.1 $61.84 (6.2%) 31.7% 88.3% 6.6x 10.9x 12.5x 9.9x 21.7x 13.7x 0.6x
Median (7.0% ) 37.7% 90.8% 6.5x 9.0x 10.3x 8.3x 17.9x 12.7x 0.9x
Mid-Cap PowerAmetek Inc. $7,780.6 $42.98 (6.6%) 58.8% 91.4% 8.2x 11.9x 12.8x 10.5x 21.7x 16.7x 2.2xThomas & Betts Corp. $3,011.5 $54.26 (6.4%) 41.5% 87.7% 5.2x 8.3x 9.2x 6.9x 19.6x 13.4x 0.6xValmont Industries, Inc. $2,866.4 $99.74 (5.3%) 25.9% 86.0% 7.5x 9.2x 10.5x 7.7x 25.4x 14.9x 0.5xLittelfuse Inc. $1,306.8 $59.93 (3.7%) 65.8% 90.3% 11.8x 8.6x 8.5x 6.8x 15.8x 12.7x (0.6x)P ll I d t i I $288 6 $35 21 (10 9%) 19 8% 86 1% 6 3 3 2 6 2 5 4 39 0 16 6 (1 5 )Powell Industries, Inc. $288.6 $35.21 (10.9%) 19.8% 86.1% 6.3x 3.2x 6.2x 5.4x 39.0x 16.6x (1.5x)
Median (6.4% ) 41.5% 87.7% 7.5x 8.6x 9.2x 6.9x 21.7x 14.9x 0.5x
Independent Power ProducersNRG Energy, Inc. $13,784.4 $24.61 1.7% 5.4% 96.4% 4.3x 4.2x 6.0x 7.1x 41.3x 21.4x 2.6xGenOn Energy, Inc. $5,147.8 $4.00 1.8% NA 92.0% NA NA 23.0x 9.2x NM NA 1.9xDynegy Inc. $5,093.0 $6.09 (3.9%) 16.4% 91.3% 5.0x 7.4x 17.5x 12.6x NM NM 6.9xMirrabooka Investments Limited $245.5 $1.99 (6.5%) 43.9% 92.8% NM NM NM NA 20.2x NA NM
Median (1.1% ) 16.4% 92.4% 4.6x 5.8x 17.5x 9.2x 30.8x 21.4x 2.6x
page 9
Energy & Power Industry UpdateJune 2011
Member FINRA/SIPC
June 2011
Stock Performance Net Debt / Current Price Change from Change from % of TEV / 2011 P/ERatio EBITDATEV / LTM EBITDA Multiple as ofCurrent Price Change from Change from % of TEV / 2011 P/E Ratio EBITDA
TEV 5/30/11 Prior Month Prior Year LTM High 5/30/09 5/30/10 Current EBITDA Current 2011 5/30/2010TEV / LTM EBITDA Multiple as of
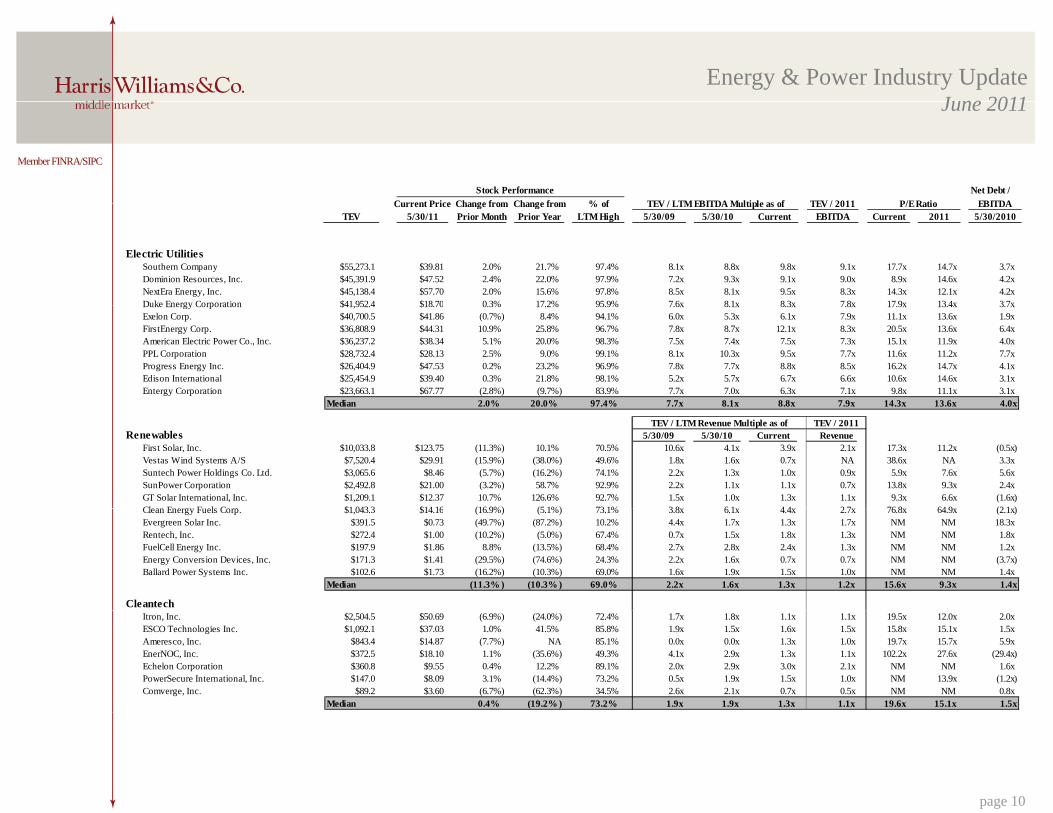
Electric UtilitiesSouthern Company $55,273.1 $39.81 2.0% 21.7% 97.4% 8.1x 8.8x 9.8x 9.1x 17.7x 14.7x 3.7xDominion Resources, Inc. $45,391.9 $47.52 2.4% 22.0% 97.9% 7.2x 9.3x 9.1x 9.0x 8.9x 14.6x 4.2xNextEra Energy, Inc. $45,138.4 $57.70 2.0% 15.6% 97.8% 8.5x 8.1x 9.5x 8.3x 14.3x 12.1x 4.2xDuke Energy Corporation $41 952 4 $18 70 0 3% 17 2% 95 9% 7 6x 8 1x 8 3x 7 8x 17 9x 13 4x 3 7xDuke Energy Corporation $41,952.4 $18.70 0.3% 17.2% 95.9% 7.6x 8.1x 8.3x 7.8x 17.9x 13.4x 3.7xExelon Corp. $40,700.5 $41.86 (0.7%) 8.4% 94.1% 6.0x 5.3x 6.1x 7.9x 11.1x 13.6x 1.9xFirstEnergy Corp. $36,808.9 $44.31 10.9% 25.8% 96.7% 7.8x 8.7x 12.1x 8.3x 20.5x 13.6x 6.4xAmerican Electric Power Co., Inc. $36,237.2 $38.34 5.1% 20.0% 98.3% 7.5x 7.4x 7.5x 7.3x 15.1x 11.9x 4.0xPPL Corporation $28,732.4 $28.13 2.5% 9.0% 99.1% 8.1x 10.3x 9.5x 7.7x 11.6x 11.2x 7.7xProgress Energy Inc. $26,404.9 $47.53 0.2% 23.2% 96.9% 7.8x 7.7x 8.8x 8.5x 16.2x 14.7x 4.1xEdison International $25,454.9 $39.40 0.3% 21.8% 98.1% 5.2x 5.7x 6.7x 6.6x 10.6x 14.6x 3.1xEntergy Corporation $23,663.1 $67.77 (2.8%) (9.7%) 83.9% 7.7x 7.0x 6.3x 7.1x 9.8x 11.1x 3.1x
Median 2.0% 20.0% 97.4% 7.7x 8.1x 8.8x 7.9x 14.3x 13.6x 4.0x
Renewables 5/30/09 5/30/10 CurrentFirst Solar, Inc. $10,033.8 $123.75 (11.3%) 10.1% 70.5% 10.6x 4.1x 3.9x 2.1x 17.3x 11.2x (0.5x)Vestas Wind Systems A/S $7,520.4 $29.91 (15.9%) (38.0%) 49.6% 1.8x 1.6x 0.7x NA 38.6x NA 3.3xSuntech Power Holdings Co. Ltd. $3,065.6 $8.46 (5.7%) (16.2%) 74.1% 2.2x 1.3x 1.0x 0.9x 5.9x 7.6x 5.6xSunPower Corporation $2,492.8 $21.00 (3.2%) 58.7% 92.9% 2.2x 1.1x 1.1x 0.7x 13.8x 9.3x 2.4xGT Solar International, Inc. $1,209.1 $12.37 10.7% 126.6% 92.7% 1.5x 1.0x 1.3x 1.1x 9.3x 6.6x (1.6x)Clean Energy Fuels Corp $1 043 3 $14 16 (16 9%) (5 1%) 73 1% 3 8x 6 1x 4 4x 2 7x 76 8x 64 9x (2 1x)
RevenueTEV / LTM Revenue Multiple as of TEV / 2011
Clean Energy Fuels Corp. $1,043.3 $14.16 (16.9%) (5.1%) 73.1% 3.8x 6.1x 4.4x 2.7x 76.8x 64.9x (2.1x)Evergreen Solar Inc. $391.5 $0.73 (49.7%) (87.2%) 10.2% 4.4x 1.7x 1.3x 1.7x NM NM 18.3xRentech, Inc. $272.4 $1.00 (10.2%) (5.0%) 67.4% 0.7x 1.5x 1.8x 1.3x NM NM 1.8xFuelCell Energy Inc. $197.9 $1.86 8.8% (13.5%) 68.4% 2.7x 2.8x 2.4x 1.3x NM NM 1.2xEnergy Conversion Devices, Inc. $171.3 $1.41 (29.5%) (74.6%) 24.3% 2.2x 1.6x 0.7x 0.7x NM NM (3.7x)Ballard Power Systems Inc. $102.6 $1.73 (16.2%) (10.3%) 69.0% 1.6x 1.9x 1.5x 1.0x NM NM 1.4x
Median (11.3% ) (10.3% ) 69.0% 2.2x 1.6x 1.3x 1.2x 15.6x 9.3x 1.4x
CleantechItron, Inc. $2,504.5 $50.69 (6.9%) (24.0%) 72.4% 1.7x 1.8x 1.1x 1.1x 19.5x 12.0x 2.0xESCO Technologies Inc. $1,092.1 $37.03 1.0% 41.5% 85.8% 1.9x 1.5x 1.6x 1.5x 15.8x 15.1x 1.5xAmeresco, Inc. $843.4 $14.87 (7.7%) NA 85.1% 0.0x 0.0x 1.3x 1.0x 19.7x 15.7x 5.9xEnerNOC, Inc. $372.5 $18.10 1.1% (35.6%) 49.3% 4.1x 2.9x 1.3x 1.1x 102.2x 27.6x (29.4x)Echelon Corporation $360.8 $9.55 0.4% 12.2% 89.1% 2.0x 2.9x 3.0x 2.1x NM NM 1.6xPowerSecure International, Inc. $147.0 $8.09 3.1% (14.4%) 73.2% 0.5x 1.9x 1.5x 1.0x NM 13.9x (1.2x)Comverge, Inc. $89.2 $3.60 (6.7%) (62.3%) 34.5% 2.6x 2.1x 0.7x 0.5x NM NM 0.8x
Median 0.4% (19.2% ) 73.2% 1.9x 1.9x 1.3x 1.1x 19.6x 15.1x 1.5x
page 10

Energy & Power Industry UpdateJune 2011
Member FINRA/SIPC
June 2011
Stock Performance Net Debt / Current Price Change from Change from % of TEV / 2011 P/ERatio EBITDATEV / LTM EBITDA Multiple as ofCurrent Price Change from Change from % of TEV / 2011 P/E Ratio EBITDA
TEV 5/30/11 Prior Month Prior Year LTM High 5/30/09 5/30/10 Current EBITDA Current 2011 5/30/2010TEV / LTM EBITDA Multiple as of
Industrial & Infrastructure Services
Engineering & ConstructionFluor Corporation $9,621.5 $68.90 (1.5%) 46.8% 90.9% 5.1x 5.4x 12.8x 7.1x 34.0x 17.2x (1.9x)J b E i i G I $5 449 7 $45 82 (7 6%) 9 7% 82 2% 5 9 7 5 9 9 7 8 23 7 14 8 (0 5 )Jacobs Engineering Group Inc. $5,449.7 $45.82 (7.6%) 9.7% 82.2% 5.9x 7.5x 9.9x 7.8x 23.7x 14.8x (0.5x)KBR, Inc. $4,859.9 $37.58 (2.1%) 71.0% 96.9% 3.8x 5.3x 8.7x 6.7x 14.9x 14.3x (1.3x)McDermott International Inc. $4,725.9 $21.34 (7.6%) (3.8%) 81.6% 7.0x 15.1x 10.6x 7.8x 20.2x 13.1x (1.4x)Dresser-Rand Group Inc. $4,438.7 $52.37 (0.3%) 64.5% 93.7% 6.2x 6.9x 16.1x 8.5x 33.5x 15.8x 0.8xURS Corporation $3,734.8 $43.93 (1.8%) (1.5%) 90.9% 8.2x 7.7x 6.0x 4.9x 13.8x 10.8x 0.4xQuanta Services, Inc. $3,733.8 $19.71 (9.1%) (4.9%) 81.5% 10.5x 9.9x 10.7x 6.8x 37.1x 17.3x (1.3x)Chicago Bridge & Iron Company N.V. $3,423.0 $37.89 (6.5%) 90.7% 89.2% 14.8x 5.2x 9.3x 6.8x 17.7x 13.4x (1.0x)Shaw Group Inc. $2,143.9 $36.50 (6.2%) 7.0% 87.7% 7.1x 5.9x 6.7x 5.0x 77.3x 13.4x (1.5x)MYR Group Inc $413 4 $22 64 (9 2%) 37 3% 85 3% 7 8x 8 2x 8 8x 5 9x 25 9x 15 7x (0 9x)MYR Group, Inc. $413.4 $22.64 (9.2%) 37.3% 85.3% 7.8x 8.2x 8.8x 5.9x 25.9x 15.7x (0.9x)Pike Electric Corporation $371.5 $8.71 (14.3%) (11.8%) 83.0% 4.6x 10.1x 10.0x 6.4x NM 27.7x 2.1xENGlobal Corp. $117.1 $3.91 (4.2%) 47.0% 68.8% 5.1x 42.1x NM 4.3x NM 7.0x 8.3x
Median (6.4% ) 23.5% 86.5% 6.6x 7.6x 9.9x 6.7x 24.8x 14.5x (0.9x)
Industrial & Infrastructure ServicesEMCOR Group Inc. $1,551.7 $30.55 (1.5%) 22.3% 93.3% 3.4x 4.0x 5.8x 4.8x NM 12.7x (1.6x)Cape plc $1,099.7 $8.67 (7.9%) 188.3% 91.6% 4.7x 3.9x 7.4x NA 12.7x NA 0.7xTeam Inc $501 8 $22 98 (7 9%) 52 8% 80 0% 5 6x 9 1x 9 8x 7 5x 21 3x 15 4x 1 3xTeam Inc. $501.8 $22.98 (7.9%) 52.8% 80.0% 5.6x 9.1x 9.8x 7.5x 21.3x 15.4x 1.3xMistras Group, Inc. $479.3 $16.96 (7.4%) 42.0% 91.9% 0.0x 11.1x 10.7x 8.0x 30.0x 21.8x 0.8xMatrix Service Co. $283.1 $13.52 (6.6%) 37.4% 92.6% 4.6x NM 8.7x 5.1x 38.3x 13.0x NMFurmanite Corporation $255.9 $7.07 (15.6%) 44.3% 82.2% 5.0x 18.8x 9.0x 6.9x 19.1x 12.1x 0.3x
Median (7.7% ) 43.2% 91.7% 4.6x 9.1x 8.9x 6.9x 21.3x 13.0x 0.7x
page 11
Energy & Power Industry UpdateJune 2011
page 12
Harris Williams & Co. is the premier middle market advisor
with a two-decade legacy of sell side excellence serving
clients worldwide.
Experience
Focus
Market Intelligence
Stability
Global Reach
Exceptional Results
Middle market leader – closed nearly 200 transactions in the last four years.
Execution focus with unparalleled senior-level attention.
Over 10,000 conversations with buyers and lenders each year.
Unparalleled retention of senior professionals.
Approximately 20% of our transactions are cross-border.
Best-in-class execution produces unmatched closing rate.
• Locations
London, UK
Richmond, VA
Boston, MA
Cleveland, OH
London, UK
Minneapolis, MN
Philadelphia, PA
San Francisco, CA

Energy & Power Industry UpdateJune 2011
page 13
Harris Williams & Co.’s Energy & Power Group has a broad
range of experience including products, services, and
technologies that support or enhance the overall energy and
power infrastructure.
Key Niches:
• Cleantech, Energy Efficiency, and Renewables
• Power Products, Services, and Technologies
• Oil & Gas Products, Services, and Technologies
• Industrial & Infrastructure Services
• Engineering & Construction
For more information on Harris Williams & Co.’s Energy & Power Group as well as archived
copies of the Energy & Power Industry Update, please visit our website. Archived copies of the
Group’s industry whitepapers, including Transmission & Distribution Infrastructure and ESCOs
– Enabling Energy Efficiency, can also be found on the site.

Energy & Power Industry UpdateJune 2011
page 14
Mr. Armstrong co-leads the Energy & Power Group and was Harris Williams & Co.’s second employee, joining the
firm in 1993. In 1999, Mr. Armstrong founded the San Francisco office and has over 19 years of transactional
experience focused in middle market mergers and acquisitions assignments. Having directed over 125 mergers and
acquisitions transactions during his career, Mr. Armstrong has worked across industries including energy and power,
consumer products, building products, business services, distribution, retailing, specialty chemicals, and technology.
As Co-Head of the Energy & Power Group, Mr. Armstrong specializes on the Power segment. Prior to joining Harris
Williams & Co., Mr. Armstrong was with Wheat First Butcher Singer (now Wells Fargo). He earned a B.S. with a
concentration in Finance from the University of Virginia's McIntire School of Commerce and is also a Chartered
Financial Analyst. Mr. Armstrong was past president and director of the San Francisco Chapter of ACG and is
currently a director of the Greater Richmond YMCA.
Mr. Spitzer founded and co-leads the Energy & Power Group at Harris Williams & Co. Over his investment banking
career, Mr. Spitzer has advised clients on a variety of merger and acquisition and strategic advisory assignments, as
well as corporate financings. Mr. Spitzer has advised a diverse range of manufacturing and service businesses in the
energy and power industries. Key niche focus areas have included demand response solutions, power quality
equipment, infrastructure and industrial services, and oilfield products and services. Prior to focusing on energy and
power companies, Mr. Spitzer developed experience in numerous industries including industrial manufacturing,
chemicals, automotive, aerospace and defense, business services, and consumer products. Prior to joining Harris
Williams & Co., Mr. Spitzer worked in the General Industrial Group at Banc of America Securities, LLC and in the
Investment Banking Group at Goldman Sachs & Co. Mr. Spitzer earned an M.B.A. with Honors from Columbia
Business School, where he served as the Caplan Fellow. Mr. Spitzer earned a B.A. in Economics from the University
of Virginia.
Mr. Lucas re-joined Harris Williams & Co. following the completion of an M.B.A. from The Wharton School at the
University of Pennsylvania. Prior to business school, Mr. Lucas served as an Associate with Harris Williams & Co.,
working on mergers and acquisitions transactions in a broad range of industries, including general industrial,
consumer products, plastics, and waste equipment/services. Before re-joining Harris Williams & Co., Mr. Lucas
worked as an Associate with Graham Partners, a private equity group in Philadelphia. Previous experience also
includes work as an Investment Banking Analyst with JP Morgan. Mr. Lucas earned a B.S. in Commerce, with a
concentration in Finance from The McIntire School of Commerce at the University of Virginia.
Prior to joining Harris Williams & Co., Mr. White worked as an Associate in the Equity Capital Markets Group at
SunTrust Robinson Humphrey. Previous experience also includes work in the Capital Finance Group at Wachovia
Securities (now Wells Fargo) where he focused on acquisition financing, growth capital, and workout situations. Mr.
White earned an M.B.A. from the Goizueta Business School at Emory University and a B.S. in Business
Administration from the University of North Carolina at Chapel Hill.
Tiff B. Armstrong
Managing [email protected]
+1 (804) 648-0072
Andrew G. Spitzer
Managing [email protected]
+1 (804) 915-0174
Brian S. Lucas
+1 (804) 932-1323
Matthew G. White
Vice [email protected]
+1 (804) 915-0131
Prior to joining Harris Williams & Co., Mr. Semple worked as a Global Banking Associate at Deutsche Bank. Within
energy and power, Mr. Semple has advised a diverse range of businesses, including providers of energy efficiency
and clean technology products and services, oilfield products and services, transmission distribution products and
services, and power generation equipment. He earned an M.B.A. from the Darden School of Business at the
University of Virginia and a B.A. from Trinity College in Hartford, Connecticut.
Luke R. Semple
Vice [email protected]
+1 (804) 648-1158
Sources:
1. Capital IQ.
2. MergerMarket.
3. Baker Hughes.
Harris Williams & Co. (www.harriswilliams.com), a member of The PNC Financial Services Group, Inc.
(NYSE:PNC), is the premier middle market advisor with a two-decade legacy of sell side excellence serving
clients worldwide. The firm is focused exclusively on the middle market providing sell side and acquisition
advisory, restructuring advisory, board advisory, private placements and capital markets advisory services.
Investment banking services are provided by Harris Williams LLC, a registered broker-dealer and member of
FINRA and SIPC, and Harris Williams & Co. Ltd, an Appointed Representative of Sturgeon Ventures LLP, which
is Authorised and Regulated by the Financial Services Authority. Harris Williams & Co. is a trade name under
which Harris Williams LLC and Harris Williams & Co. Ltd conduct business in the U.S. and Europe, respectively.
THIS REPORT MAY CONTAIN REFERENCES TO REGISTERED TRADEMARKS, SERVICE MARKS
AND COPYRIGHTS OWNED BY THIRD-PARTY INFORMATION PROVIDERS. NONE OF THE
THIRD-PARTY INFORMATION PROVIDERS IS ENDORSING THE OFFERING OF, AND SHALL
NOT IN ANY WAY BE DEEMED AN ISSUER OR UNDERWRITER OF, THE SECURITIES,
FINANCIAL INSTRUMENTS OR OTHER INVESTMENTS DISCUSSED IN THIS REPORT, AND
SHALL NOT HAVE ANY LIABILITY OR RESPONSIBILITY FOR ANY STATEMENTS MADE IN THE
REPORT OR FOR ANY FINANCIAL STATEMENTS, FINANCIAL PROJECTIONS OR OTHER
FINANCIAL INFORMATION CONTAINED OR ATTACHED AS AN EXHIBIT TO THE REPORT. FOR
MORE INFORMATION ABOUT THE MATERIALS PROVIDED BY SUCH THIRD PARTIES, PLEASE
CONTACT US AT +1 804-648-0072.
The information and views contained in this report were prepared by Harris Williams & Co. (“Harris Williams”).
It is not a research report, as such term is defined by applicable law and regulations, and is provided for
informational purposes only. It is not to be construed as an offer to buy or sell or a solicitation of an offer to buy or
sell any financial instruments or to participate in any particular trading strategy. The information contained herein
is believed by Harris Williams to be reliable but Harris Williams makes no representation as to the accuracy or
completeness of such information. Harris Williams and/or its affiliates may be market makers or specialists in, act
as advisers or lenders to, have positions in and effect transactions in securities of companies mentioned herein and
also may provide, may have provided, or may seek to provide investment banking services for those companies. In
addition, Harris Williams and/or its affiliates or their respective officers, directors and employees may hold long
or short positions in the securities, options thereon or other related financial products of companies discussed
herein. Opinions, estimates and projections in this report constitute Harris Williams’ judgment and are subject to
change without notice. The financial instruments discussed in this report may not be suitable for all investors, and
investors must make their own investment decisions using their own independent advisors as they believe
necessary and based upon their specific financial situations and investment objectives. Also, past performance is
not necessarily indicative of future results. No part of this material may be copied or duplicated in any form or by
any means, or redistributed, without Harris Williams’ prior written consent.
Copyright © 2011 Harris Williams & Co., all rights reserved.
1001 HaxallPoint
9th Floor
Richmond, VA 23219
Phone: +1 (804) 648-0072
Fax: +1 (804) 648-0073
www.harriswilliams.com
Two International Place
24th Floor
Boston, MA 02110
Phone: +1 (617) 482-7501
Fax: +1 (617) 482-7503
1900 East 9th Street
20th Floor
Cleveland, OH 44114
Phone: +1 (216) 689-2400
Fax: +1 (216) 689-2401
63 Brook Street
London, W1K 4HS
Phone: +44 20 7518 8900
Fax: +44 20 7526 2187
222 South Ninth Street
Suite 3350
Minneapolis, MN 55402
Phone: +1 (612) 359-2700
Fax: +1 (612) 359-2701
1600 Market Street
21st Floor
Philadelphia, PA 19103
Phone: +1 (267) 675-5900
Fax: +1 (267) 675-5901
575 Market Street
31st Floor
San Francisco, CA 94105
Phone: +1 (415) 288-4260
Fax: +1 (415) 288-4269
page 15
© 2011. Investment banking services are provided by Harris Williams LLC, a registered broker-dealer and member of FINRA and SIPC, and Harris Williams &
Co. Ltd, an Appointed Representative of Sturgeon Ventures LLP, which is authorised and regulated by the FSA. Harris Williams & Co. is a trade name under
which Harris Williams LLC and Harris Williams & Co. Ltd conduct business in the U.S. and Europe, respectively.
Energy & Power Industry UpdateJune 2011