estimating the costs of education development: case...
TRANSCRIPT
2010/ED/EFA/MRT/PI/39
Background paper prepared for the Education for All Global Monitoring Report 2010
Reaching the marginalized
Estimating the costs of education development - Case Study for Democratic Republic of Congo,
Nigeria and Sudan for EFA GMR 2010 - Part I: Synthesis Report
Gwang-Chol Chang, Raphaëlle Martinez and Hilaire Mputu 2009
This paper was commissioned by the Education for All Global Monitoring Report as background information to assist in drafting the 2010 report. It has not been edited by the team. The views and opinions expressed in this paper are those of the author(s) and should not be attributed to the EFA Global Monitoring Report or to UNESCO. The papers can be cited with the following reference: “Paper commissioned for the EFA Global Monitoring Report 2010, Reaching the marginalized” For further information, please contact [email protected]

Estimating the costs of education development Case Study for Democratic Republic of Congo, Nigeria and Sudan for EFA GMR 2010 Part I: Synthesis Report By Gwang-Chol Chang (Nigeria) Raphaëlle Martinez (Sudan) Hilaire Mputu (Democratic Republic of Congo) 5 June 2009
Contents
Introduction .............................................................................................................................. 3
I. Overview of baseline data and information processes .................................................. 5 Population data ...................................................................................................................... 6
Education system ................................................................................................................... 7
Education data ....................................................................................................................... 8
Domestic financial resources ............................................................................................... 10
International aid ................................................................................................................... 12
II. Financial simulations in case study countries .......................................................... 14 Scenario 1: ‘Status-Quo’ ..................................................................................................... 14
Selected indicators ............................................................................................................ 14 Resource requirements ..................................................................................................... 18 Conclusions to Scenario 1 ................................................................................................ 21
Scenario 2: ‘National Education Plan’ ................................................................................ 23 Selected indicators ............................................................................................................ 23 Resource requirements ..................................................................................................... 26 Conclusions to Scenario 2 ................................................................................................ 29
Scenario 3: ‘EFA-Fast Track Initiative’ .............................................................................. 31 Selected indicators ............................................................................................................ 31 Resource requirements ..................................................................................................... 34 Conclusions to Scenario 3 ................................................................................................ 37
Scenario 4: ‘Inclusion’ ........................................................................................................ 39 Preliminary considerations ............................................................................................... 39 Policy assumptions and targets ........................................................................................ 40 Resource requirements ..................................................................................................... 44 Conclusions to Scenario 4 ................................................................................................ 45
Conclusions ............................................................................................................................. 47
Annex ....................................................................................................................................... 50
Annex 1. References ............................................................................................................ 50
Annex 2. Educational systems in case study countries ....................................................... 51
2
Introduction The EFA Global Monitoring Report (GMR) Team commissioned to the UNESCO Section of Education Policy Analysis and Strategies (ED/ESB/EPS) a case study for estimating the costs of achieving EFA in three African countries (Democratic Republic of Congo, Nigeria and Sudan), taking into account the issues of marginalization in education. A few criteria were taken into consideration in selecting these three countries, including: the size of population, the challenges faced by the case-study countries in achieving EFA, focus on Africa and the complexity of conducting costing exercises due to the lack of detailed policies and data. Several objectives have been attached to this study, which are not limited to the following:
1. Provide a detailed analysis of the resource requirements, including financial, for achieving the EFA goals in three case study countries, from a sector-wide education development perspective.
2. Analyse and evaluate different policy and financing strategies and options associated with reaching marginalised groups within case study countries.
3. Estimate external financing gaps according to distinctive policy assumptions and evaluate the feasibility of the scenarios used to generate the estimated costs.
The commission specified that the cost implications should be considered for the whole education sector, to situate, for example, the impacts of increased primary school access on the demand for post-primary education, as well as on achieving the literacy goal. Four scenarios, customized to fit case study countries’ educational structures and contexts, had to be prepared, with necessary cross-country comparative analysis according to the assumptions and findings of these scenarios:
1. Status-quo scenario, to assess the resource implications of achieving EFA goals based on the past trends of education development and existing cost structures.
2. National plan scenario, to examine the resource implications and feasibility of available policies and strategies contained in national education plans and programmes.
3. EFA-FTI scenario, to appraise the implications of achieving EFA goals based on FTI-proposed benchmarks.
4. “Inclusion” scenario, addressing marginalisation in education and including more detailed strategies for reaching and teaching the marginalised, in a sector-wide development framework.
To this end, a costing model template was developed based on UNESCO-designed generic model, called Education Policy and Strategy Simulation (EPSSim), which was further customized to reflect the specifics of selected countries’ structures. Figure 1 provides an illustration of the structure of the education simulation model used to conduct this study:
Based on baseline and assumptions on intake or registration rates and the flow of students through the education system (i.e. promotion, repetition and dropout rates), enrolments are projected over time. Once enrolment projections are made, the resource requirements to accommodate these enrolments are estimated yearly and over the projected period, using various resource utilization assumptions (e.g. pupil/teacher ratios, class size, staff workload, textbook policy, physical space utilisation patterns, etc.). Using per-input unit costs, the
3

simulation model estimates the total annual cost requirements (both recurrent and capital) for education development, which are compared with the resources (both domestic and external) that are likely to be available to the education system over the projection period in order to assess the feasibility of the assumptions underlying the projections. For details, see UNESCO (2005).
Fig. 1: A simplified flow structure of the simulation model
Three staff members from the UNESCO Section of Education Policy Analysis and Strategies (ED/ESB/EPS) were mobilized to conduct the costing exercise in each of the selected countries, with help from local experts (Ibrahim El-Dasis for Sudan, François Kubindikila for Democratic Republic of Congo and Rosemary Nwangwu for Nigeria). Part 1 of the study is the synthesis of the three country case studies, whose details can be found in Part 2 of this report. It contains the main features of the above four scenarios of education development to achieve EFA in the case study countries. For details, please refer to each individual country case study, as well as to the related data and information contained in Part 2 of the present report.
4

I. Overview of baseline data and information processes
As noted earlier, an education finance simulation model has been developed to appraise the implications and feasibility of four possible scenarios:
1. Status quo scenario 2. National plan scenario 3. EFA-FTI scenario 4. Inclusion scenario
The education finance simulation model has been tailored as far as possible to fit the specifics of three countries’ education systems, including the resource framework and the expenditure blocks. The level of sophistication and disaggregation of the model has relied upon the key features of the education system per level of education as well as on the available data to set the baseline of the base year. The structure of the model was also guided by the need to elaborate on specific interventions for addressing and reaching the marginalization issues in education, as required by this GMR commission. Adaptations in terms of the structure and the level of aggregation have been made to fit the requirements of the given task. The baseline data and policy information are used, by education level (pre-primary through to higher education, including non-formal) and by major category of inputs (pupils, teachers, material and infrastructure), with necessary linkages between them. Several difficulties have been faced in conducting the costing of education development. In addition to the unreliability of the population data by age and the complexity of political structure of all the three case study countries, data and information on school provision and related costs have been either insufficient or very diverging across different governance structures. To the extent possible, the data and policy information used in this study are those collected directly from the case study countries and compiled during this costing exercise. It is worth noting that two of the case study countries are post-conflict countries, with notable difficulties in data management. Although not a post-conflict, Nigeria is another case of such complexity and difficulty of data management. In compiling baseline data and policy assumptions for constructing simulations and conducting scenarios, when some specific, necessary data and information were not available and/or inconsistent, approximations and estimates were made by triangulating data from different information sources. Below are explained the data sources as well as a few of the difficulties encountered during data collection, processing and analysis for this costing exercise. For detailed information on the baseline data used in the simulation models for three case study countries, please refer to Part II on country case studies.
5

Population data Democratic Republic of Congo (DRC): The demographic data used in this study are estimates provided by UN Population Division (UNPD). They are based on the latest scientific population census conducted in 1984. The population growth rate is estimated at 3.2 percent per annum. To calculate the required indicators and to project the enrolments, the population data are grouped according to the age structure of the education system (6-6-5). Nigeria: A population census was carried out in 2006. However, the population data so far released are for total population aggregates only, and these by state, local government area (LGA) and by sex, reportedly on contentious grounds. As disaggregated data was needed to carry out enrolment projections, approximations have been done as follows: the 2006 Nigeria Population Census was used as the basis for calculating disaggregated 2006 population data, applying 1991 census-based, projected population structure. Annual growth rate for total population is 2.8 percent, and this rate and 1991-based age structure are taken constant throughout the projection period. Sudan: The last official national population census dates back to 1993. Recently, population censuses for both Northern and Southern Sudan were conducted in the framework of the Comprehensive Peace Agreement (CPA), but the official results are yet to be released. Consequently, United Nations Population Division (UNPD) population projections were used as the basis for the simulations. These estimates put Sudan total population at 39.6 million in 2008. According to the United Nations Population Fund (UNFPA) estimates, Southern Sudan population ranges between 7.5 and 9.5 millions. As a proxy, Southern Sudan population is estimated in the model at 8.5 million applying the same population structure (UNPD) for both parts of Sudan while one would assume that population under 15 years-old might be more important in Southern Sudan (around 50%) than in Northern Sudan (45%). As a whole, Sudan population growth rate is estimated at 2.55%. According to the above assumptions, the population data for three countries are calculated for 2008 as presented in Table 1. Table 1: Population in 2008, total and disaggregates by school level (thousands)
DRC** Nigeria Sudan SSA, % of case North South Incl. Sudan study countries
Total 62,800 147,950 30,980 8,499 782,842 32%Pop growth % 3.2% 2.8% 2.55% 2.55% 2.4%
Pre-school age pop 6,576 14,719 1,689 462 NA NAPrimary school-age pop 10,749 25,695 6,314 1,724 NA NASecondary school-age pop* 8,687 20,901 2,096 750 NA NA
Junior secondary 11,119 NA NASenior secondary 9,782 NA NA
Higher education age pop 6,025 13,921 3,332 911 NA NAPopulation 15 and above 33,153 80,098 18,723 5,151 NA NANote: * Disaggregates by junior and secondary levels apply to Nigeria only ** 2007 population projections In sum, as explained above and in Part 2 of the study, population data are yet to be settled in three case study countries. For this GMR case study, UNPD projections have been used for DRC. For Nigeria, 2006 population census data were used as the basis, but using the
6

projected age structure of 1991. In regard to Sudan, UNPD projections, complemented by UNFPA estimates, formed the basis for the simulation. In 2008, there were about 250 million inhabitants in three case study countries, representing some 32% of total African population. The annual population growth ranges from 2.5% to 3.2% in case study countries. Education system Table 2 presents the snapshot of the educational structures, their duration by level, as well as the corresponding school ages, for each of the case study countries. Secondary education is disaggregated by lower and upper level for Nigeria only. Table 2: Educational structure of case study countries (duration and corresponding ages)
DRC Nigeria Sudan North South
Pre-school 3 (ages 3-5) 3 (ages 3-5) 2 (ages 4-5) 2 (ages 4-5) Primary 6 (ages 6-11) 6 (ages 6-11) 8 (ages 6-13) 8 (ages 6-13) Secondary 6 (ages 12-17) 6 (ages 12-17) 3 (ages 14-16) 4 (ages 14-17)
Junior 3 (ages 12-14) Senior 3 (ages 15-17)
Higher education 5 (ages 18-22) 5 (ages 18-22) 5 (ages 17-21) 5 (ages 18-22) DRC: Between 1997 and 2003, there was a single Ministry of Education for the three subsectors (primary, secondary and higher education. The Ministry is now divided into two: a Ministry of Primary and Secondary Education, on the one hand, and a Ministry of Higher Education on the other. The administration of the primary and secondary education is assured by four types of entities: (i) the central government and the Ministries of Education; (ii) provincial administrations; (iii) the representatives of the four religious congregations; and pupils/students parents. In such a complex administrative framework, the sharing of responsibilities is a serious issue which, in practice, is determined by access to and control over the resource. Despite duality, lack of clarity and overlapping responsibilities between these entities, the system of education administration functions in DRC. The administration of higher education is the responsibility of the Ministry of Higher Education. There are three administrative councils, one for each type of higher education, namely universities, teacher training institutions, and higher technological institutes. Nigeria: Nigeria is a federal system, comprised of 36 states and the Federal Capital Territory, as well as some 700 Local Government Areas (LGAs). Current arrangements in the overall division of labour between the three tiers of government (federal, state and local government) in the delivery of educational services are the result of constitutional provision and of multiple adjustments over the years. The Federal Government, according to the constitutional provisions, is mainly responsible for policy formulation, co-ordination and monitoring. Direct control by the Federal government is predominantly at the tertiary level. The Federal Government also runs a handful of institutions (around a hundred across the country) at the secondary level (the “Unity” Schools and technical colleges). There are also numerous parastatals responsible at federal level for different levels and types of education (such as Universal Basic Education Commission – UBEC, National University Commission – NUC, etc. to name a few). Most of such parastatals are often replicated at state level. At state level, there are one or several ministries
7
governing educational provision in the state. State Ministries of Education are responsible for the state education policies in line with national policy and standards. The bulk of secondary schools in the country are under the purview of state governments, which are also directly responsible for a considerable proportion of the nation’s tertiary institutions. States take also responsibility for development of basic education (nine year education after early childhood care and development). Local Government Area (LGA) is run by a Local Government Council. The LGA’s primary responsibility in education delivery is to provide funds for primary teachers’ salaries in its area as well as for non-teaching staff. Government Education Authority (LGEA) is established in each LGA, headed by the Education Secretary and working often under the control of the SUBEB. Sudan: Although both education systems (Government of National Unity -GoNU for the 15 Northern States and Government of Southern Sudan- GoSS for the 10 Southern States) are very similar and can constitute a good basis on which to potentially elaborate a common system in the future, the parties agreed on having two systems running in parallel, at least for the duration of the Interim Period (until 2011 according to the Comprehensive Peace Agreement- CPA). The adoption of a federal system in 1994 created a decentralized 3-tier governance system for running general education (from ECCE to secondary education including non formal education provision): (i) the localities, mahalyas for Northern States or payam for Southern States, (ii) the State Ministries of Education (SMoE), and (iii) the central ministries of education, the Federal Ministry of General Education (FMoGE) for the North, and the Ministry of Education, Science, and Technology (MoEST) for the South. According to the CPA, GoNU and GoSS have concurrent responsibilities in Higher Education. Higher Education provision in the whole Sudan falls under the jurisdiction of the Federal Ministry of Higher Education and Scientific Research (MoHESR-GoNU) while higher education in Southern Sudan gets a semi-autonomous status with an appointment of an Undersecretary and related directorates to be yet established within the MoEST. Education data DRC: For the first time since two decades1, comprehensive education censuses have been carried out for two consecutive years (2006/07 and 2007/08), but for the moment, only the 2006/07 data have been released. This study relies mainly on administrative data from the 2006/07 census, complemented by some data from household surveys (MICS, EDS, DHS, etc.) as well as other official documents and sources (RESEN, DCRP, SECOPE, etc.). In the context of the revival of the EMIS, this approach allowed improving the consistency and robustness of the data and indicators used in this study. Nigeria: Annual school censuses (ASC) are carried out since 2004/05 until 2007/08, but only 2005/06 (ASC) has been released. It is reported that there was a sizeable number of non-reporting schools. There are numerous problems with ASC or Nigeria EMIS data, as public 1 The latest comprehensive yearbooks have been released in 1987 for primary and secondary education, in 1981 for higher education. In 2001, a statistical yearbook has been produced for primary and secondary education, but it has covered only 9 out of the 11 provinces of DRC. The 2006/07 census was the very first that produced the statistics on illiteracy and non formal education, under the auspices of Ministry of social affairs.
8

schools reportedly tend to inflate the figures whereas sizeable portion of private schools does not report to the census. On the other hand, another survey, titled “Report of the National Personnel Audit 2006” was carried out by UBEC in 2006, but giving a different picture. There were some other exercises, including household surveys, which gives information on attendance, rather than on enrolments. The above findings apply to other aspects, including teachers and other staff. For example, the UBEC audit report gives a much higher figure of teaching staff than the ASC’s. Considering the above, the data that are used for this GMR exercise have been recalculated on the basis of the ASC data 2006, with necessary triangulation with other sources. The data on other resources such as classrooms, streams, labs, textbooks, etc. have been estimated by comparing the NEMIS data with education-related results of various surveys. Sudan: Sudan is slowly recovering from an acute data lack. Northern Sudan does not have so far an established and operational Educational Information Management System (EMIS) which would centralize and cross-check all types of education data. However, FMoGE publishes yearly a statistical book that keeps record of the number of enrolments and teachers from pre-school education to secondary education including non-formal. In this study, the latest statistical yearbook has been taken as baseline reference, 2007/2008. Other information such as infrastructures, learning materials related data were estimated on the basis of the norms and standards as defined by the FMoGE Directorates in charge. In Southern Sudan, the Ministry of Education, Science and Technology (MoEST) has been establishing and testing an EMIS since 2006. The coverage has been substantially increased throughout the last 3 years. EMIS 2008 (reference year in this study) covers primary schools, alternative education schools, secondary schools and higher education institutes. Overall data coverage rate is as follows:
Primary Schools: 87% Alternative Schools System: 52% Secondary Schools: 98% Higher Education: 95%
For the sake of the study, all education data were estimated at 100% values of the number of students, teachers, and infrastructures. With a 52% actual data coverage rate, alternative education system (AES) estimates are the most questionable, but were, nonetheless, used in the simulation as AES represents a significant share of the total 1st cycle enrolment in Southern Sudan. Table 3: Education development status in three countries in base year
DR Congo Nigeria Sudan (2008) SSA* (2007) (2006) North South (2006)
Literacy 67%* 66% 61%* 20% 62%GER
Pre-school 2.6% 12% 22% NA 14%Primary 82% 96% 79% 77% 95%Secondary 32% 36% 31% 3% 24%
Junior 41% Senior 26%
Higher 4% 15% 11% 1% 5%Gross completion rate (primary) 39% 74% (36%)** 38% 7% 67%***Pupil/teacher ratio-PTR (primary) 38 52 33 51 45Note:
9

* Source GMR 2009, which refers to 2000-06 for DRC literacy rate and to 2006 for Sub-Saharan Africa (SSA) indicators. ** The figure in the brackets is the completion rate of junior secondary in Nigeria *** Survival rate to last grade 2006 for Sub-Saharan Africa (SSA). In brief, in any of the three case study countries, a functional EMIS is not in place: educational data are far from being complete; school data have been collected through annual censuses, but more time, capacities and resources seem required for ministries to produce reliable data and information. For this GMR case study, different sources have been used: ministries of education were the principal sources, which data were reviewed and complemented in light of the findings of various surveys and studies. Domestic financial resources DR Congo: After more than two decades of economic decline, the DRC’s public finances are seriously affected by a striking fall in domestic revenues. This was further exacerbated by the disruption in external aids flows following the imposition of economic sanctions in the early nineties. The public education spending – which was pre-eminent (at about a quarter of the government budget) in 1980 – is now fallen at around 10% of the total public expenditure. It should be noted that, over the last decade, this share has even fallen at less than 3%, leading to an increased financing of education by households. At present, the education sector is highly dependent on direct household financing, with all perverse effect that this may encompass, especially when teachers’ salaries are paid by parents. Presently, households constitute an important financing source for the public education sector in DRC. It is estimated that households finance about half of the cost of the primary education. The situation is positively evolving since 2002/03 when the households’ contribution was estimated at around four-fifths of total education resources. Actually, households contribute to covering a variety of charges including teachers’ salaries, school operating and administration expenses as well as inspection and examination costs. When comparing with other countries, the unit education cost paid by households is low in DRC (i.e.: US$13.5 for primary education; US$37 for secondary and US$150 for higher education). But, in the context of DRC economy, this is onerous for poor parents, as most of them cannot afford this cost, especially for secondary and higher education. Nigeria: Understanding the flows and utilization of financial resources of Nigerian education system is a real challenge. Some specific surveys and audits were useful, but give either conflicting pictures or imprecise situation. For example, “Report of the National Personnel Audit 2006” gives information on wages and allowances, but for junior secondary levels only. Due to lack of accurate data and information on educational resources, many of these had to be estimated on the basis of several findings, including the “State Education Public Expenditure Reviews” (SEPERs), education sector analyses at federal and state levels, as well as the expenditure structure of 2009. However, these estimates will have to be further checked with concerned institutions and specialists and revised accordingly where necessary. In 2006, Nigeria’s GDP per capita was around US$950. The consolidated Government finance amounted to around US$ 38.6 billion, which corresponded to 29% of GDP. This government finance (from federation account) is allocated to each tier of government according to the following formula (40.64% for Federal, 36.58% for States and 19.30% for
10

LGAs). Out of these allocations, plus internal generated revenues collected at each tier of government, it was estimated that Federal government would allocate 8.8%, states 18% and LGAs 25% of their respective resources for education: based on these assumptions, total educational spending would amount to US$5.96 billion in Nigeria, representing 15.5% of total government finance and 4.5% of GDP in 2006. Sudan: The flow of funding is rather difficult to appraise as the decentralization process is still very evolving and subject to improvements. But, broadly, in Northern Sudan, funds are transferred from Federal to State level and complemented by States’ own revenues, which ones are in turn transferred to the localities for managing pre-school and basic education (including non formal education) by paying, inter alia, staff salaries. The States oversee the development of secondary education. Since 2007, most of the education expenditures, other than for higher education, are at State and Locality levels. It is worth noting that average households contribution to education expenses (primary and secondary levels) was estimated by an EC study. Indeed, numerous studies highlight the significant contribution of the households that basically support the equivalent of about 1/3 of the total government spending on education. In Southern Sudan, the flow of funding is rather identical: since 2008, it mainly consists in conditional and unconditional grants transfer from the central level to the States and localities. The management and supervision of primary and alternative education is the mandate of the Sates. The States are expected to identify the areas where schools are to be constructed, to recruit staff and administer the payroll and to oversee the distribution and use of the instructional materials to be supplied. As for secondary education and like the primary and alternative education levels, the States take a crucial role in identification and supervision of projects and programmes. National secondary schools will however continue to be overseen by MoEST until the States develop the capacities to manage them Higher education remains a federal competency and funds are disbursed to the universities for their own management, supposedly complemented with tertiary institutions own additional incomes. Table 4: Domestic resources in three case study countries in base year (US$)
DRC Nigeria Sudan (2008) SSA (2007) (2006) North South (2006)
GDP (000) 9,000,000 133,003,351 38,615,599* 10,593,268* NAGDP per capita 140 950 1,246 1,246 826GDP growth % 7% 6% 6% 6% NAFinance as % of GDP 30.4% 29.0% 21.5% 21.1% NAEducation as % of GDP 3.1% 4.5% 2.8%** 1.3% NAEducation as % of total resources
10.2% 15.5% 13.0% 5.9% NA
Note: *Breakdown derived from total GDP in 2008, USD 49 mln, on the basis of the GDP per capita and assuming an “equitable” distribution of national wealth. ** including Higher Education spending Macro-economic data are based on the estimates of international financial agencies. For the sake of the GMR case study, estimates on government finance and educational expenditure have been made on the basis of the information given by national institutions and partner
11

agencies. For Nigeria, as the information on educational expenditure for the whole country were not available, especially the one spent at state and local levels, estimation has been conducted in light of the UNESCO experience drawn from country planning support, as well as the various reviews and studies produced by other agencies. International aid DR Congo: The external assistance in DRC is characterized by a paradoxical combination of a relatively big number of donors (with at least 20 agencies, including NGOs) with relatively small amounts of total aid, estimated at US$800 million disbursed per annum. Given the enormous challenges faced by the DRC, this aid is inadequate (around US$15 per capita per annum). This raises a serious concern as regards the real donor capacity to contribute to the country’s political and economic stability and development. In order to lessen country’s administrative burden (of dealing with individual donors) and to enhance the impact of the external aid, the key donors in DRC have decided to coordinate themselves within the framework of a Country Assistance Framework (CAF). The CAF aims at harmonizing donors’ approach and instruments so as to minimize the transaction costs. As of 2009, the CAF is composed of 14 DRC’s key partners, including: (i) multilateral organizations – the World Bank, the IMF, the UN and; (ii) bilateral agencies, namely Belgium, CIDA, French Cooperation, GTZ (Germany), JICA, China, the Netherlands, SIDA, DFID and USAID. The external aid to education has been marginal as compared to public expenditures and also when considering the share of the total external aid allocated to education. For instance, for the period 2003-2005, the education sector has received only 5% of the total external aid given to DRC. According to the CAF, the external aid to education is being increased, starting with the World Bank commitment to support government effort to abolish school fees. Based on current donor commitments, a rough estimate of total external aid would amount to US$250 million for 2-3 years. Major part of this aid is expected from the World Bank, the Belgium and DFID. Most of the bilateral agencies – Belgium being an exception – are involved in much smaller projects. Similarly, many international NGOs include education among their priority activities, particularly in conflict-affected areas. Nigeria: International aid to education is said marginal, compared to the domestic resources spent for education. Donor aid has been estimated to represent 1.2% of domestic resources for education, representing around US$ 70 million in 2006. Most aid is concentrated in a few states, notably in the northern part of Nigeria, where educational challenges are particularly high. Sudan: The Ministry of International Cooperation estimated the overall donor support to education in 2008 to be about 13% of total government spending in Northern States. As for Southern States, the MoEST Directorate on external partners’ coordination launched itself (with support of some external agencies) in tracking the partners’ projects and amounts pledged and disbursed. In 2008, foreign actual spending was about 22% of total government resources for education when their support was actually budgeted at more than 60% of the total government spending.
12

For both Northern and Southern Sudan, the aid support predictability is aligned on the Interim Period (2005-2011). However, and as observed in the case of Southern Sudan, the gap between funds pledged and actually spent can be substantial. Information on external aid to education was difficult to obtain. There has been no authoritative report giving full picture of aid flow for educational development in any of the case study countries. However, on the basis of the analysis of sparse information and field experience, some estimation was possible to figure out the contours of international aid in education. According to our findings, educational aid seems relatively important for DRC and Sudan than for Nigeria, even though it turns out to be largely insufficient to meet up the educational challenges of these two countries.
13

II. Financial simulations in case study countries
Scenario 1: ‘Status-Quo’ (This scenario is to answer the question on how the education systems would evolve if the past trends and shortcomings were left to continue unimproved, whether or not EFA goals would be achieved and what are the related costs and financing gaps.) In order to understand how the education system would evolve through 2015 and beyond if the current policy, education provision and levels of spending continued, a ‘status-quo’ scenario has been developed. This scenario projects enrolment and costs of the system based on the past trends of education development in each of the case study countries. Estimating the past trends was a difficult exercise, as the data were not available for more than two years in all three case study countries, to actually derive them. As over the past years, the situation has been improving in case study countries, such trends have been reflected in defining the targets of this scenario2. For example, promotion rates in primary school are expected to evolve as observed over the past two to five years throughout the course of the projection period. As noted above, the base year is different according to country: 2007 for DR Congo, 2006 for Nigeria and 2008 for Sudan (North and South), used to take into account the latest data available in each country. In this and other scenarios, the resource requirements do not include those costs that are not explicitly educational, such as teacher housing, transportation, school uniforms, school health care (except for HIV/AIDS in the last scenario), etc. although it is recognised that such financial items could have important impact on schooling. The household costs and financing gaps, therefore, do not include such items in the following simulations. It is assumed that GDP would grow, on annual average, over the coming years by 7% for DR Congo, 6% for Nigeria and 6% for Sudan. Although IMF gives lower projections for 2009 and 2010, it is expected that around 7% GDP growth is plausible afterwards. In the inclusion scenario (or scenario 4), three other financing assumptions are applied to the “basic” inclusion scenario for assessing the financial feasibilities under different macro-economic development prospects. For details about the target setting, please refer to country case studies in Part 2.
Selected indicators In the Status Quo scenario, the recent past and current situations were different across countries, and most targets, different between countries, have been assigned for achievement by 2015. Table 5 summarises the indicators used to project the enrolments, educational resources and the implication of this scenario. On the other hand, in DR Congo and Sudan, as these education systems have been taking in the backlogs of out-of-school children and dropouts of several past years, it is not surprising
2 For more information on the simulated targets set as policy parameters, please refer to Part II on country case studies.
14

15
to note that intake rates at primary grade 1 are currently very high, especially in Southern Sudan, which are expected to decrease gradually over the coming years. As concerns Nigeria, the number of classes and classrooms was estimated on the basis of the NEMIS data: it is highly possible that schools have “deflated” these numbers when reporting to Annual School Census.
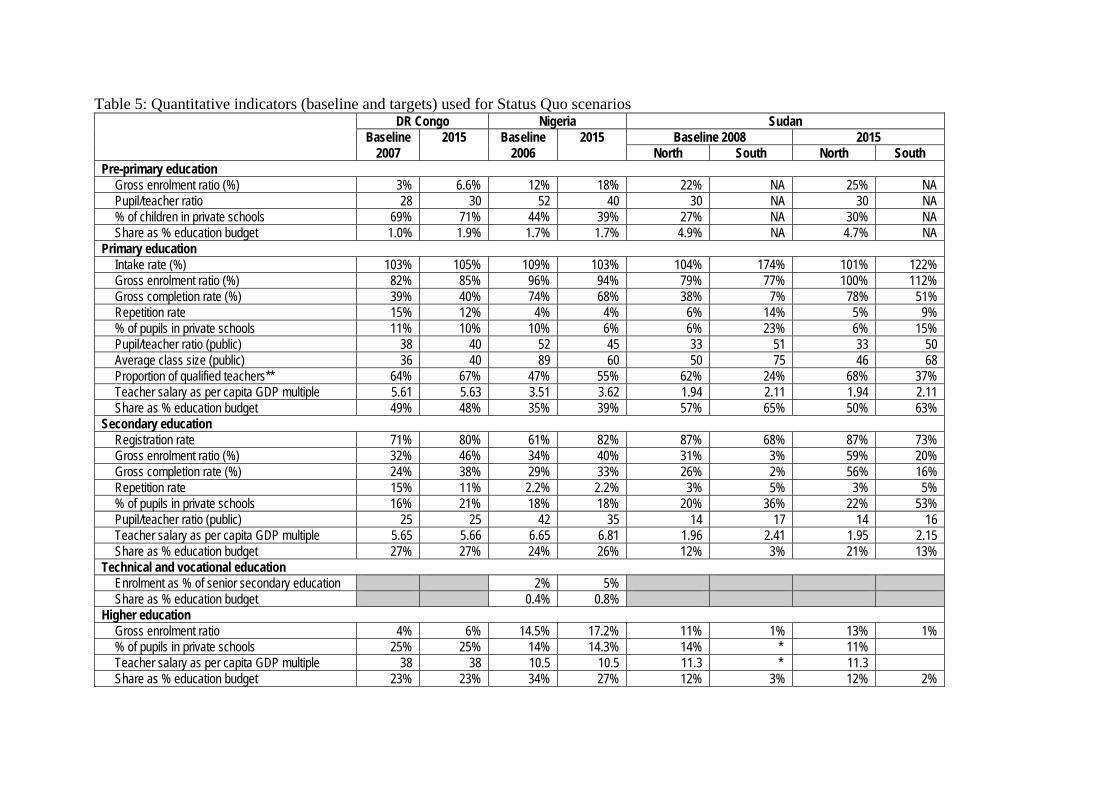
Table 5: Quantitative indicators (baseline and targets) used for Status Quo scenarios DR Congo Nigeria Sudan Baseline 2015 Baseline 2015 Baseline 2008 2015 2007 2006 North South North South
Pre-primary education Gross enrolment ratio (%) 3% 6.6% 12% 18% 22% NA 25% NA Pupil/teacher ratio 28 30 52 40 30 NA 30 NA % of children in private schools 69% 71% 44% 39% 27% NA 30% NA Share as % education budget 1.0% 1.9% 1.7% 1.7% 4.9% NA 4.7% NA
Primary education Intake rate (%) 103% 105% 109% 103% 104% 174% 101% 122% Gross enrolment ratio (%) 82% 85% 96% 94% 79% 77% 100% 112% Gross completion rate (%) 39% 40% 74% 68% 38% 7% 78% 51% Repetition rate 15% 12% 4% 4% 6% 14% 5% 9% % of pupils in private schools 11% 10% 10% 6% 6% 23% 6% 15% Pupil/teacher ratio (public) 38 40 52 45 33 51 33 50 Average class size (public) 36 40 89 60 50 75 46 68 Proportion of qualified teachers** 64% 67% 47% 55% 62% 24% 68% 37% Teacher salary as per capita GDP multiple 5.61 5.63 3.51 3.62 1.94 2.11 1.94 2.11 Share as % education budget 49% 48% 35% 39% 57% 65% 50% 63%
Secondary education Registration rate 71% 80% 61% 82% 87% 68% 87% 73% Gross enrolment ratio (%) 32% 46% 34% 40% 31% 3% 59% 20% Gross completion rate (%) 24% 38% 29% 33% 26% 2% 56% 16% Repetition rate 15% 11% 2.2% 2.2% 3% 5% 3% 5% % of pupils in private schools 16% 21% 18% 18% 20% 36% 22% 53% Pupil/teacher ratio (public) 25 25 42 35 14 17 14 16 Teacher salary as per capita GDP multiple 5.65 5.66 6.65 6.81 1.96 2.41 1.95 2.15 Share as % education budget 27% 27% 24% 26% 12% 3% 21% 13%
Technical and vocational education Enrolment as % of senior secondary education 2% 5% Share as % education budget 0.4% 0.8%
Higher education Gross enrolment ratio 4% 6% 14.5% 17.2% 11% 1% 13% 1% % of pupils in private schools 25% 25% 14% 14.3% 14% * 11% Teacher salary as per capita GDP multiple 38 38 10.5 10.5 11.3 * 11.3 Share as % education budget 23% 23% 34% 27% 12% 3% 12% 2%

17
DR Congo Nigeria Sudan Baseline 2015 Baseline 2015 Baseline 2008 2015
Non formal education Literacy rate (15 and +) 66% 69% 20% 30% Share as % education budget 0.7% 1.3% 1.6% 8% 1.6% 8%
Macro-economic framework
GDP (million) 9,000 17,704 133,003 224,706 38 652 10 557 58 118 15 873 777 Education expenditure as % of GDP 3.1% 3.1% 4.5% 4.5% 2.8% 1.7% 2.8% 1.7% Education recurrent as % of ed budget 88% 88% 81% 81% 73% 85% 81% 85%
Note: Secondary education indicators for Sudan are reflecting all types of education (academic, technical and vocational) * Higher Education lies under GoNU, indicators represent for both Northern & Southern Sudan ** For DRC, qualified teachers are those having at least “the Diplôme d’Etat” (baccalauréat).
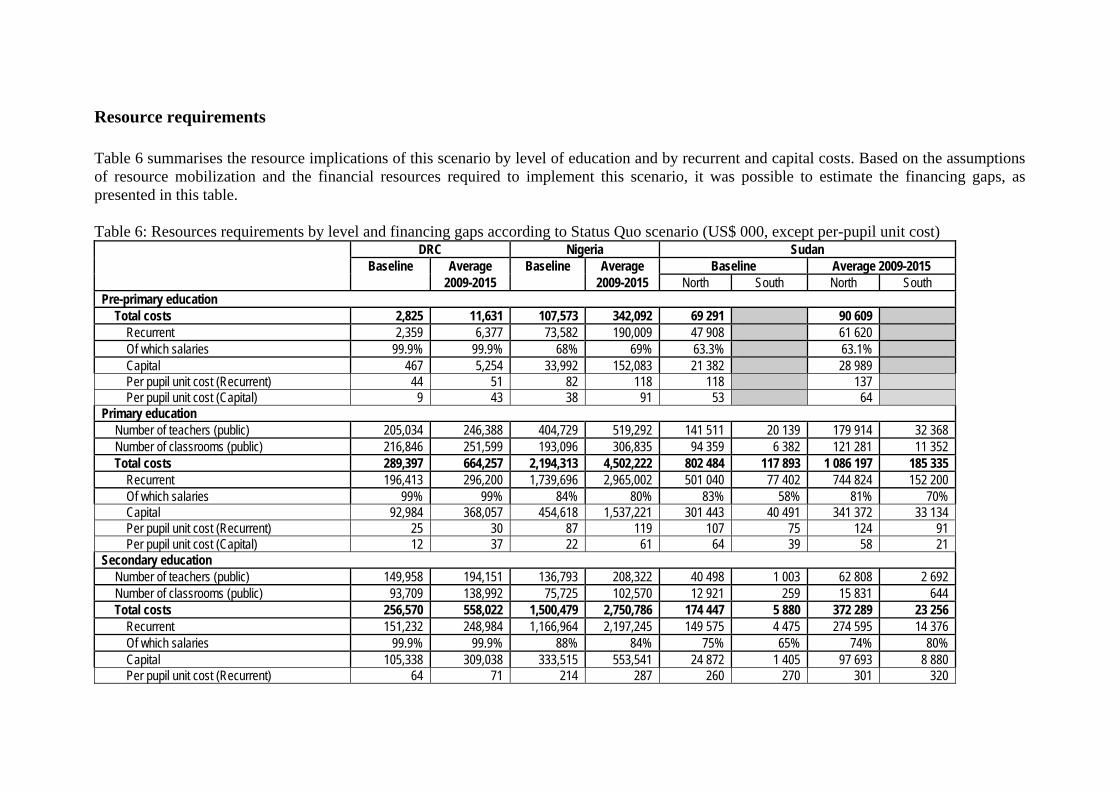
Resource requirements Table 6 summarises the resource implications of this scenario by level of education and by recurrent and capital costs. Based on the assumptions of resource mobilization and the financial resources required to implement this scenario, it was possible to estimate the financing gaps, as presented in this table. Table 6: Resources requirements by level and financing gaps according to Status Quo scenario (US$ 000, except per-pupil unit cost)
DRC Nigeria Sudan Baseline Average Baseline Average Baseline Average 2009-2015 2009-2015 2009-2015 North South North South
Pre-primary education Total costs 2,825 11,631 107,573 342,092 69 291 90 609
Recurrent 2,359 6,377 73,582 190,009 47 908 61 620 Of which salaries 99.9% 99.9% 68% 69% 63.3% 63.1% Capital 467 5,254 33,992 152,083 21 382 28 989 Per pupil unit cost (Recurrent) 44 51 82 118 118 137 Per pupil unit cost (Capital) 9 43 38 91 53 64
Primary education Number of teachers (public) 205,034 246,388 404,729 519,292 141 511 20 139 179 914 32 368 Number of classrooms (public) 216,846 251,599 193,096 306,835 94 359 6 382 121 281 11 352 Total costs 289,397 664,257 2,194,313 4,502,222 802 484 117 893 1 086 197 185 335
Recurrent 196,413 296,200 1,739,696 2,965,002 501 040 77 402 744 824 152 200 Of which salaries 99% 99% 84% 80% 83% 58% 81% 70% Capital 92,984 368,057 454,618 1,537,221 301 443 40 491 341 372 33 134 Per pupil unit cost (Recurrent) 25 30 87 119 107 75 124 91 Per pupil unit cost (Capital) 12 37 22 61 64 39 58 21
Secondary education Number of teachers (public) 149,958 194,151 136,793 208,322 40 498 1 003 62 808 2 692 Number of classrooms (public) 93,709 138,992 75,725 102,570 12 921 259 15 831 644 Total costs 256,570 558,022 1,500,479 2,750,786 174 447 5 880 372 289 23 256
Recurrent 151,232 248,984 1,166,964 2,197,245 149 575 4 475 274 595 14 376 Of which salaries 99.9% 99.9% 88% 84% 75% 65% 74% 80% Capital 105,338 309,038 333,515 553,541 24 872 1 405 97 693 8 880 Per pupil unit cost (Recurrent) 64 71 214 287 260 270 301 320
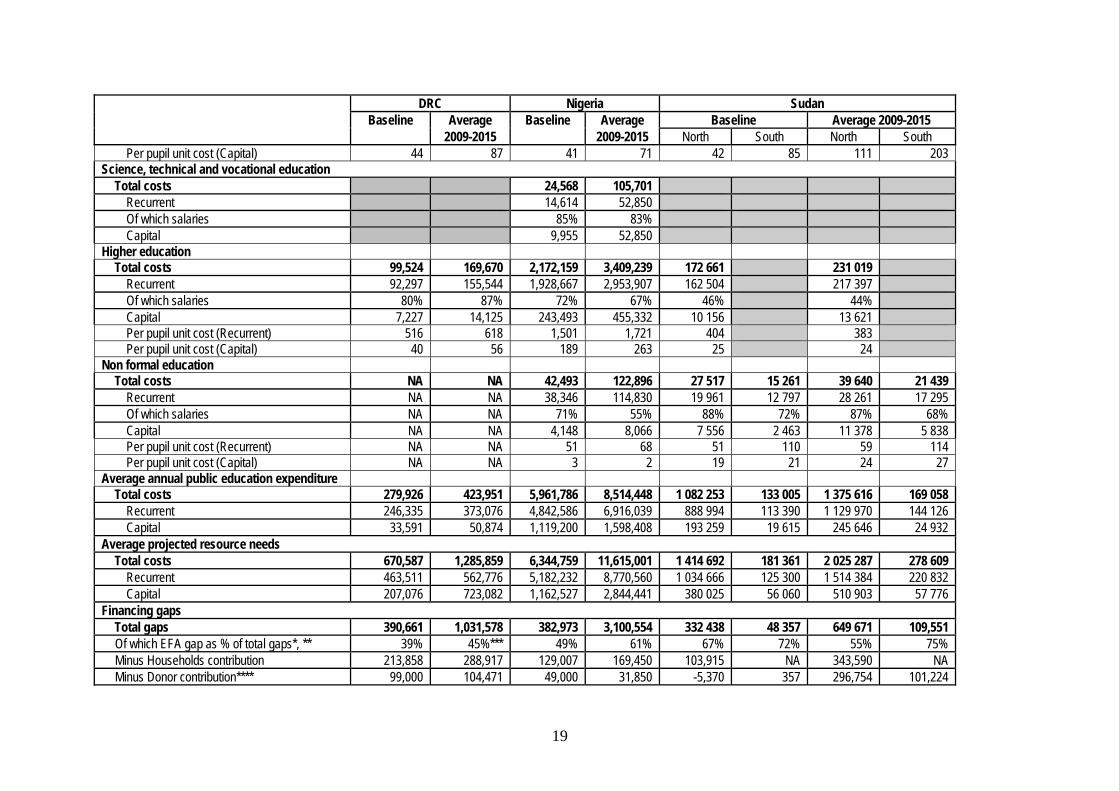
DRC Nigeria Sudan Baseline Average Baseline Average Baseline Average 2009-2015 2009-2015 2009-2015 North South North South
Per pupil unit cost (Capital) 44 87 41 71 42 85 111 203 Science, technical and vocational education
Total costs 24,568 105,701 Recurrent 14,614 52,850 Of which salaries 85% 83% Capital 9,955 52,850
Higher education Total costs 99,524 169,670 2,172,159 3,409,239 172 661 231 019
Recurrent 92,297 155,544 1,928,667 2,953,907 162 504 217 397 Of which salaries 80% 87% 72% 67% 46% 44% Capital 7,227 14,125 243,493 455,332 10 156 13 621 Per pupil unit cost (Recurrent) 516 618 1,501 1,721 404 383 Per pupil unit cost (Capital) 40 56 189 263 25 24
Non formal education Total costs NA NA 42,493 122,896 27 517 15 261 39 640 21 439
Recurrent NA NA 38,346 114,830 19 961 12 797 28 261 17 295 Of which salaries NA NA 71% 55% 88% 72% 87% 68% Capital NA NA 4,148 8,066 7 556 2 463 11 378 5 838 Per pupil unit cost (Recurrent) NA NA 51 68 51 110 59 114 Per pupil unit cost (Capital) NA NA 3 2 19 21 24 27
Average annual public education expenditure Total costs 279,926 423,951 5,961,786 8,514,448 1 082 253 133 005 1 375 616 169 058
Recurrent 246,335 373,076 4,842,586 6,916,039 888 994 113 390 1 129 970 144 126 Capital 33,591 50,874 1,119,200 1,598,408 193 259 19 615 245 646 24 932
Average projected resource needs Total costs 670,587 1,285,859 6,344,759 11,615,001 1 414 692 181 361 2 025 287 278 609
Recurrent 463,511 562,776 5,182,232 8,770,560 1 034 666 125 300 1 514 384 220 832 Capital 207,076 723,082 1,162,527 2,844,441 380 025 56 060 510 903 57 776
Financing gaps Total gaps 390,661 1,031,578 382,973 3,100,554 332 438 48 357 649 671 109,551 Of which EFA gap as % of total gaps*, ** 39% 45%*** 49% 61% 67% 72% 55% 75% Minus Households contribution 213,858 288,917 129,007 169,450 103,915 NA 343,590 NA Minus Donor contribution**** 99,000 104,471 49,000 31,850 -5,370 357 296,754 101,224
19

20
Notes: * EFA is considered comprising pre-school, primary and non formal education. ** Excluding pre-school education for Southern Sudan, due to lack of information *** Excluding NFE for DR Congo, due to lack of information **** Average estimated, based on 2009 donor contribution

Conclusions to Scenario 1 In this scenario, we tried to see how the education systems would evolve if the past trends and shortcomings were left to continue unimproved, whether or not EFA goals would be achieved and what are the related costs and financing gaps. This scenario projected enrolment and related resource requirements on the basis of the past trends of education development in each of the case study countries.
It is observed that in DRC and Nigeria, universal primary education goal will not be achieved, let alone at other levels of education. In Northern Sudan, 100% GER will be reached in 2015 but it is probably too premature to talk of a universalization of primary education, as several phenomena can inflate the gross ratio. As for Southern Sudan, GER is far above 100% in 2015, as a result of the past four years trend, during which a massive schooling initiative called “Go To School” has aimed to raise the number primary school intakes. Table 7 presents the cost required to implement this scenario as well as the associated financing gaps.
Table 7: Average annual cost requirements and financing gaps (US$ 000), 2009-2015
DRC Nigeria Sudan Total North South
Average annual public education expenditure 423,951 8,514,448 1,375,616 169,058 10,483,073 Recurrent 373,076 6,916,039 1,129,970 144,126 8,563,211 Capital 50,874 1,598,408 245,646 24,932 1,919,860
Average projected resource needs 1,285,859 11,615,001 2,025,287 278,609 15,204,756 Recurrent 562,776 8,770,560 1,514,384 220,832 11,068,552 Capital 723,082 2,844,441 510,903 57,777 4,136,203
Total financing gaps 1,031,578 3,100,554 649,672 109,551 4,891,355 Gaps as % of public education expenditure 243% 36% 47% 65% 47% Of which Gap of capital costs 672,208 1,246,033 265,258 32,845 2,216,344 Gap of capital costs as % of total gaps 65% 40% 41% 30% 45% Of which EFA funding gap 464,210 1,884,980 355,311 82,188 2,786,689 EFA gap as % of total gaps 45% 61% 55% 75% 57%
Financing gap by level of education Preschool education 5,022 197,346 8,073 1,362 211,803 Primary education 459,188 1,624,339 329,608 76,293 2,489,428 Secondary 1st cycle (Nigeria) -- 531,131 -- na 531,131 Secondary 443,979 235,789 187,796 16,494 884,058 TVET -- 45,491 11,165 na 56,656 Higher 62,970 395,124 59,067 1,965 519,126 NFE -- 63,295 17,630 4,534 85,459 Other cross-cutting expenditures 60,420 8,038 36,332 6,368 111,158
Financing gap minus household & donor contributions 638,190 3,096,004 296,754 101,224 4,132,172
Household contribution 288,917 169,450 306,081 na 764,448 Donor contribution 104,471 40,425 46,837 8,327 200,060
Gaps as % of public education expenditure, 151% 36% 22% 60% 39% after inclusion of stakeholder contribution
The three case-study countries would require, on average, US$ 15.2 billion, yearly from 2009 to 2015 for their educational development, whereas the financing gaps represent 47% (around US$ 4.9 billion yearly), if stakeholders’ contributions (households and donors’ share) were not taken into account. In these, the gaps for the development of the EFA components would be particularly high (US$ 2.8 billion each year) and the gaps related to capital costs would represent about 45% (US$ 2.2 billion each year). The table indicates that household contribution to education is particularly important in DR Congo and Northern Sudan. Even after taking into account the contribution of stakeholders (households3 and donors), the expected funding gaps in the three case study countries are US$ 4.1 billion each year. In other words, total additional financial resources to mobilize during 7 years from 2009 to 2015 will be around US$ 28.9 billion in the three case study countries.
3 It was not possible to estimate the household contribution for Southern Sudan. For DRC, one key assumption is maintaining the households’ contributions at their current level. This assumption applies also to all the four scenarios included in this study.
22

23
Scenario 2: ‘National Education Plan’ (This scenario is to weigh the resource implications if available strategies contained in national education plans are applied, whether or not EFA goals can be achieved and what are the related costs and financing gaps.) There are different levels and sets of policies and plans in case study countries. In DR Congo, there is no education plan document per se yet, several policy statements have been made on different occasions by national authorities. These have been compiled to form the basis for the National Plan scenario. In Nigeria, there are two major policy documents that constituted the basis for this scenario: 10-year education development plan prepared in 2006 and the Roadmap for Nigerian Education Sector, issued in March 2009. These two documents conflict in some target indicators, to the extent possible, a medium value has been taken for the sake of simulation in this scenario. In Sudan, the situation is more complex. There is the 5-year Strategic Plan for 2007-2011 in Northern Sudan, which builds upon the EFA Master Plan 2005 and is integrated into the wider 25-year National Plan. The latter provides policies and strategies for the realization of MDG 2 and the EFA goals. MoHESR has also worked on a 5 years plan from which some major policy options have been retained. However, there is neither a plan nor policy statements which could be used for building a national plan scenario in the case of Southern Sudan. Therefore, no scenario was constructed for Southern Sudan. For details of each of national plan scenarios, please refer to country-specific case studies.
Selected indicators Table 8 summarises the indicators used to project the implication of this scenario. The baseline data are the same as in Status Quo scenario and presented here again for the purpose of comparison between the base year and the target year. As in Status Quo scenario, it is assumed that GDP would grow, on annual average, over the coming years by 7% for DR Congo, 6% for Nigeria and 6% for Sudan.

Table 8: Quantitative indicators (baseline and targets) used for National Plan scenarios DR Congo Nigeria Sudan Baseline 2015 Baseline 2015 Baseline 2008 2015 2007 2006 North South North South**
Pre-primary education Gross enrolment ratio (%) 3% 6.6 12% 37% 22% NA 60% Pupil/teacher ratio 28 30 52 35 30 NA 30 % of children in private schools 69% 71% 44% 50% 27% NA 33% Share as % education budget 1.0% 1.9 1.7% 1.7% 4.9% NA 22.7%
Primary education Intake rate (%) 103% 105% 109% 103% 104% 174% 102% Gross enrolment ratio (%) 82% 99% 96% 98% 79% 77% 101% Gross completion rate (%) 39% 76% 74% 83% 38% 7% 79% Repetition rate 15% 5% 4% 4% 6% 14% 5% % of pupils in private schools 11% 10% 10% 8% 6% 23% 8% Pupil/teacher ratio (public) 38 40 52 30 33 51 33 Average class size (public) 36 40 89 30 50 75 46 Proportion of qualified teachers** 64% 67% 47% 80% 62% 24% 68% Teacher salary as per capita GDP multiple 5.61 5.63 3.51 4.14 1.94 2.11 1.94 Share as % education budget 49% 48% 35% 34% 57% 65% 41%
Secondary education Registration rate 71% 72% 61% 96% 87% 68% 87% Gross enrolment ratio (%) 32% 68% 34% 51% 31% 3% 60% Gross completion rate (%) 24% 57% 29% 38% 26% 2% 57% Repetition rate 15% 10% 2.2% 2.3% 3% 5% 3% % of pupils in private schools 16% 16% 18% 17% 20.1% 36% 22.4% Pupil/teacher ratio (public) 25 40 42 26 14 16.5 14 Teacher salary as per capita GDP multiple 5.65 5.66 6.65 7.25 1.96 2.41 1.95 Share as % education budget 27% 27% 23.6% 23.3% 12.3% 3% 17.3%
Technical and vocational education Enrolment as % of secondary education 2% 14.3% Share as % education budget 0.4% 0.4%
Higher education Gross enrolment ratio 4% 7% 15% 30% 11% 1% 12% % of pupils in private schools 25% 26% 14% 11% 14% * 14% Teacher salary as per capita GDP multiple 38 38 11 11 11 * 11 Share as % education budget 23% 23% 34% 35% 12% 3% 9%

25
DR Congo Nigeria Sudan Baseline 2015 Baseline 2015 Baseline 2008 2015
Non formal education Literacy rate (15 and +) 66% 70% 20% Share as % education budget 0.7% 0.8% 1.6% 8% 1.6%
Macro-economic framework
GDP (million) 9,000 16,546 133,003 224,706 38 652 10 557 58.118 Education expenditure as % of GDP 3.1% 3.1% 4.5% 4.5% 2.8% 1.3% 3.6% Education recurrent as % of ed budget 88% 88% 81% 81% 73% 85% 69.2%
Note: Secondary education indicators for Sudan are reflecting all types of education (academic, technical and vocational) * The National Plan Scenario was not simulated for Southern Sudan. For more explanation, please see the country case study ** For DRC, qualified teachers are those having at least “the Diplôme d’Etat” (baccalauréat).

Resource requirements Table 9 summarises the resource implications of this scenario by level of education and by recurrent and capital costs. Table 9: Resources requirements by level and financing gaps according to National Plan scenario (US$ 000)
DRC Nigeria Sudan Baseline Average Baseline Average Baseline Average 2009-2015 2009-2015 2009-2015 North South North South**
Pre-primary education Total costs 2,825 11,631 107,573 861,813 69 291 292,663
Recurrent 2,359 6,377 73,582 373,214 47 908 118,254 Of which salaries 100% 100% 68% 63% 63% 63% Capital 467 5,254 33,992 488,599 21 382 174,408 Per pupil unit cost (Recurrent) 44 51 94 150 118 137 Per pupil unit cost (Capital) 9 43 65 182 53 199
Primary education Number of teachers (public) 205,034 271,290 404,729 878,824 141 511 20 139 179,914 Number of classrooms (public) 216,846 276,889 193,096 763,487 94 359 6 382 121,281 Total costs 364,188 959,219 2,194,313 8,662,526 802 484 117 893 1,111,269
Recurrent 256,144 481,929 1,739,696 4,261,043 501 040 77 402 769,896 Of which salaries 77% 68% 84% 78% 83% 58% 79%
Capital 108,044 477,290 454,618 4,401,483 301 443 40 491 341,372 Per pupil unit cost (Recurrent) 33 45 92 166 107 75 128 Per pupil unit cost (Capital) 14 44 31 167 64 39 58
Secondary education Number of teachers (public) 149,958 174,067 136,793 440,140 40 498 1 003 63,934 Number of classrooms (public) 93,709 124,699 75,725 221,048 12 921 259 16,115 Total costs 236,228 649,429 1,500,479 4,637,556 174 447 5 880 378,800
Recurrent 167,574 273,673 1,166,964 3,312,544 149 575 4 475 279,528 Of which salaries 90% 81% 88% 84% 75% 65% 74% Capital 68,654 375,756 333,515 1,325,012 24 872 1 405 99,272 Per pupil unit cost (Recurrent) 71 62 213 362 260 270 301 Per pupil unit cost (Capital) 29 83 65 135 42 85 112
Science, technical and vocational education

DRC Nigeria Sudan Baseline Average Baseline Average Baseline Average 2009-2015 2009-2015 2009-2015 North South North South**
Total costs 24,568 258,370 Recurrent 14,614 142,079 Of which teacher salaries 85% 84% Capital 9,955 116,291
Higher education Total costs 100,857 194,470 2,172,159 5,415,461 172 661 225,234
Recurrent 92,297 174,561 1,928,667 4,337,943 162 504 207,449 Of which salaries 80% 88% 72% 68% 46% 47% Capital 8,560 19,909 243,493 1,077,518 10 156 17,784 Per pupil unit cost (Recurrent) 516 607 1,501 1,665 404 348 Per pupil unit cost (Capital) 48 69 292 417 25 30
Non formal education Total costs NA NA 42,493 130,444 27 517 15 261 39,640
Recurrent NA NA 38,346 127,464 19 961 12 797 28,261,968 Of which salaries NA NA 71% 55% 87.60% 72% 87.11% Capital NA NA 4,148 2,980 7 556 2 463 11,378 Per pupil unit cost (Recurrent) NA NA 51 68 51 110 59 Per pupil unit cost (Capital) NA NA 3 2 19 21 24
Average annual public education expenditure
Total costs 279,926 423,951 5,961,786 8,514,448 1 082 253 133 005 1,676,970 Recurrent 246,335 373,076 4,842,586 6,916,039 888 994 113 390 1,344,449 Capital 33,591 50,874 1,119,200 1,598,408 193 259 19 615 332,522
Average projected resource needs Total costs 726,568 1,677,298 6,344,759 20,551,276 1 414 692 181 361 2,253,140
Recurrent 539,773 769,884 5,182,232 13,020,971 1 034 666 125 300 1,591,075 Capital 186,795 907,415 1,162,527 7,530,305 380 025 56 060 662,065
Financing gaps Total gaps 446,641 1,447,818 382,973 12,036,828 332 438 48 357 576,170 Of which EFA gap as % of total gaps* 51%*** 52%*** 49% 56% 67% 72% 73% Minus household contribution 232,783 1,107,380 253,967 11,791,889 103,915 NA 265,869 Minus household & donor contribution 133,783 1,002,909 204,967 11,787,339 -5,370 357 219,032
27

28
Note: * EFA is considered comprised of pre-school, primary and non formal education. ** The National Plan Scenario was not simulated for Southern Sudan. For more explanation, please see the country case study *** Excluding NFE for DR Congo, due to lack of information

Conclusions to Scenario 2 In this scenario, we tried to weigh the resource implications if available strategies contained in national education plans or policy statements are applied, whether or not EFA goals can be achieved and what are the related costs and financing gaps. It is observed that in all countries, existing policies call for achieving the universal primary education goal, as illustrated in Table 1.8. Other levels of education would also be appreciably improved. The case of Northern Sudan is different as the National Plan scenario calls for more resources allocated to education while the education targets are not so ambitious; this results in a significant decrease of the financing gap. However the education indicators are not so much improved compared to the status quo scenario. Table 1.10 presents the cost required to implement such scenario and indicates the associated financing gaps. Table 1.10: Average annual cost requirements and financing gaps (US$ 000), 2009-2015
DRC Nigeria Sudan Total North South*
Average annual public education expenditure 423,951 8,514,448 1,676,970 10,615,369 Recurrent 373,076 6,916,039 1,344,449 8,633,564 Capital 50,874 1,598,408 332,522 1,981,804
Average projected resource needs 1,677,298 20,551,276 2,253,140 24,481,714 Recurrent 769,884 13,020,971 1,591,075 15,381,930 Capital 907,415 7,530,305 662,065 9,099,785
Total financing gaps 1,447,818 12,036,828 576,170 14,060,816 Gaps as % of public education expenditure 342% 141% 35% 132% Of which Gap of capital costs 856,541 6,104,931 329,543 7,291,015 Gap of capital costs as % of total gaps 59% 51% 57% 52% Of which EFA funding gap 752,865 6,687,429 393,789 7,834,083 EFA gap as % of total gaps 52% 56% 68% 56%
Financing gap by level of education Preschool education 5,022 717,068 192,045 914,135 Primary education 754,149 5,866,757 188,936 6,809,842 Secondary 1st cycle (Nigeria) -- 2,093,422 na 2,093,422 Secondary 535,386 612,853 157,812 1,306,051 TVET -- 224,312 9,690 234,002 Higher 87,720 2,401,346 15,613 2,504,679 NFE -- 103,604 12,808 116,412 Other cross-cutting expenditures 65,540 17,467 -735 82,272
Financing gap minus household & donor contributions 1,002,909 12,032,278 219,032 13,254,219
Household contribution 340,437 169,450 310,301 820,188 Donor contribution 104,471 40,425 46,837 191,733
Gaps as % of public education expenditure, 229% 138% 13% 125% after inclusion of stakeholder contribution
Note: * No projection made for Southern Sudan. For explanation, refer to the case study in Part 2 The three case-study countries would require, on average US$ 24.5 billion, yearly from 2009 to 2015 for their educational development, whereas the financing gaps over public domestic resources would represent 132% (around US$ 14 billion yearly)! In these, the gaps for the

development of the EFA components would be around 56% (US$ 7.8 billion each year) and the gaps related to capital costs would represent about 52% (US$ 7.3 billion each year). Only Sudan’s National Plan scenario shows a significant decrease of the financial gap (from 21% to13% due to the increase of the government resources allocated to education (+1% of GDP). If the contribution of stakeholders (households 4 and donors) is taken into account, the expected funding gaps in three case study countries are US$ 13 billion each year, representing a total financial gap of US$ 92.8 billion during the forthcoming 7 years from 2009 to 2015.
4 It was not possible to estimate the household contribution for Southern Sudan.
30

31
Scenario 3: ‘EFA-Fast Track Initiative’ (This scenario is to assess the cost implications if regional and international benchmarks, including EFA/FTI indicative framework, were applied, whether or not EFA goals would be achieved and what are the related costs and financing gaps.) The FTI benchmarks, as well as some macro-economic assumptions, have been related. To the extent possible, these benchmarks were used to estimate the resource requirements with necessary adaptations to country contexts. For example, if EFA-FTI benchmarks recommend 10% or lower repetition rates, much lower rates were considered on the understanding of past trends. The same applies to the proportion of private education and other indicators. Further discussion was conducted within the case study team in regard to other goals and levels of education, which are not explicitly covered in the EFA framework, including EFA Goal 1 (ECCE), possibly EFA goal 4 (continuing education), EFA goal 3 linked to NFE (learning needs for youth and adults), and the post-primary levels. In general, the benchmarks for non-EFA areas have been lowered than in “national plan” scenarios, on the understanding that priority should go towards achieving the EFA goals by 2015. For details on how FTI and other benchmarks were applied in this scenario, please refer to each of the case study countries’ reports in Part 2.
Selected indicators Table 11 summarises the indicators used to project the implication of this scenario. The baseline data are the same as in the previous scenarios and presented here again for the purpose of comparison between the base year and the target year. As in previous scenarios, it is assumed that, in nominal terms, GDP would grow, on annual average, over the coming years by 7% for DR Congo, 6% for Nigeria and 6% for Sudan.

Table 11: Quantitative indicators (baseline and targets) used for the EFA/FTI scenarios
DR Congo Nigeria Sudan Baseline 2015 Baseline 2015 Baseline 2008 2015 2007 2006 North South North South
Pre-primary education Gross enrolment ratio (%) 3% 15% 12% 52% 22% NA 60% Pupil/teacher ratio 28 35 52 35 30 NA 30 % of children in private schools 69% 44% 44% 65% 27% NA 33% Share as % education budget 1.0% 1.9% 1.7% 4.5% 4.9% NA 16.7%
Primary education Intake rate (%) 103% 105% 109% 103% 104% 174% 104% 100% Gross enrolment ratio (%) 82% 99% 96% 98% 79% 77% 107% 105% Gross completion rate (%) 39% 76% 74% 82% 38% 7% 91% 66% Repetition rate 15% 5% 4% 4% 6% 14% 4% 7% % of pupils in private schools 11% 10% 10% 10% 6% 23% 10% 13% Pupil/teacher ratio (public) 38 40 52 40 33 51 40 43 Average class size (public) 36 40 89 40 50 75 43 57 Proportion of qualified teachers** 64% 67% 47% 80% 62% 24% 80% 37% Teacher salary as per capita GDP multiple 5.61 5.63 3.33 3.29 1.94 2.11 3.33 3.49 Share as % education budget 49% 48% 35% 40% 57% 65% 44% 63%
Secondary education Registration rate 71% 84% 61% 84% 87% 68% 92% 80% Gross enrolment ratio (%) 32% 64% 36% 45% 31% 3% 76% 41% Gross completion rate (%) 24% 53% 29% 34% 26% 2% 72% 32% Repetition rate 15% 10% 2.2% 2.3% 3% 5% 3% 5% % of pupils in private schools 16% 34% 18% 24% 20.1% 36% 43.4% 53% Pupil/teacher ratio (public) 25 40 42 43 14 16.5 13 16.1 Teacher salary as per capita GDP multiple 5.65 5.66 6.45 6.13 1.96 2.41 3.41 3.57 Share as % education budget 27% 27% 24% 29% 12% 3% 23% 20%
Technical and vocational education Enrolment as % of secondary education 2% 29% Share as % education budget 0.4% 3.0%
Higher education Gross enrolment ratio 4% 7% 15% 18% 11% 1% 15% 3% % of pupils in private schools 25% 26% 14% 14% 14% * 14%

33
DR Congo Nigeria Sudan Baseline 2015 Baseline 2015 Baseline 2008 2015
Teacher salary as per capita GDP multiple 38 38 11 9 11 * 11 Share as % education budget 23% 23% 34% 20% 12% 3% 9% 1%
Non formal education Literacy rate (15 and +) 66% 84% 20% 31% Share as % education budget 0.7% 1% 1.6% 8% 1.9% 7%
Macro-economic framework
GDP (million) 9,000 16,546 133,003 224,706 38 652 10 557 58,118 15,874 Education expenditure as % of GDP 3.1% 5.7% 4.5% 5.5% 2.8% 1.3% 3.6% 2.6% Education recurrent as % of ed budget 88% 77% 81% 81% 73% 85% 80% 79%
Note: Secondary education indicators for Sudan are reflecting all types of education (academic, technical and vocational) * Higher Education lies under GoNU, indicators represent for both Northern & Southern Sudan ** For DRC, qualified teachers are those having at least “the Diplôme d’Etat” (baccalauréat).

Resource requirements Table 12 summarises the resource implications of this scenario by level of education and by recurrent and capital costs. Table 12: Resources requirements by level and financing gaps according to EFA/FTI scenario (US$ 000)
DRC Nigeria Sudan Baseline Average Baseline Average Baseline Average 2009-2015 2009-2015 2009-2015 North South North South
Pre-primary education Total costs 3,509 49,057 107,573 787,139 69,291 289,747
Recurrent 2,359 20,361 73,582 384,657 47,908 168,155 Of which salaries 100% 100% 68% 56% 63.3% 63.8% Capital 1,150 28,696 33,992 402,482 21,382 121,592 Per pupil unit cost (Recurrent) 44 43 104 157 118 188 Per pupil unit cost (Capital) 21 65 66 154 53 139
Primary education Number of teachers (public) 205,034 266,949 404,729 614,083 141,511 20 139 162,874 34,118 Number of classrooms (public) 216,846 266,949 193,096 380,267 94,359 6 382 128,868 12,087 Total costs 343,524 934,501 2,194,313 4,770,494 802,484 117 893 1,299,660 263,461
Recurrent 256,144 476,179 1,739,696 3,305,869 501,040 77 402 984,862 229,759 Of which salaries 77% 68% 84% 75% 83% 58% 78% 72% Capital 87,380 458,322 454,618 1,464,625 301,443 40 491 314,798 33,702 Per pupil unit cost (Recurrent) 33 44 92 132 107 75 160 142 Per pupil unit cost (Capital) 11 42 20 58 64 39 52 22
Secondary education Number of teachers (public) 149,958 136,363 136,793 224,696 40,498 1 003 66,586 4,528 Number of classrooms (public) 93,709 105,053 75,725 117,710 12,921 259 16,475 1,083 Total costs 265,064 445,232 1,500,479 2,501,250 174,447 5 880 511,725 51,170
Recurrent 167,574 219,308 1,166,964 1,962,355 149,575 4 475 436,342 35,311 Of which salaries 90% 79% 88% 83% 75% 65% 78% 82% Capital 97,490 225,925 333,515 538,894 24,872 1 405 75,383 15,859 Per pupil unit cost (Recurrent) 71 56 213 254 260 270 432 427 Per pupil unit cost (Capital) 41 56 27 60 42 85 76 219
Science, technical and vocational education

DRC Nigeria Sudan Baseline Average Baseline Average Baseline Average 2009-2015 2009-2015 2009-2015 North South North South
Total costs 24,568 148,732 Recurrent 14,614 98,069 Of which teacher salaries 85% 81% Capital 9,955 50,664
Higher education Total costs 102,774 200,976 2,172,159 2,616,995 172,661 253,694
Recurrent 92,297 171,288 1,928,667 2,145,960 162,504 235,799 Of which salaries 80% 88% 72% 58% 46% 47% Capital 10,477 29,688 243,493 471,035 10,156 17,895 Per pupil unit cost (Recurrent) 516 505 1,501 1,245 404 416 Per pupil unit cost (Capital) 59 85 190 269 25 31
Non formal education Total costs NA NA 42,493 300,025 27,517 15 261 46,849 32,276,
Recurrent NA NA 38,346 297,045 19,961 12 797 38,892 26,501 Of which salaries NA NA 71% 53% 88% 72% 89% 70% Capital NA NA 4,148 2,980 7,556 2 463 7,957 7,995, Per pupil unit cost (Recurrent) NA NA 51 66 51 110 81 148 Per pupil unit cost (Capital) NA NA 3 1 19 21 17 33
Average annual public education expenditure
Total costs 279,926 643,889 5,961,786 9,768,218 1,082,253 133 005 1,676,970 267,508 Recurrent 246,335 516,423 4,842,586 7,934,566 888,994 113 390 1,344,449 218,051 Capital 33,591 127,467 1,119,200 1,833,652 193,259 19 615 332,522 49,456
Average projected resource needs Total costs 737,339 1,484,524 6,344,759 12,074,977 1,414,692 181 361 2,607,210 397,852
Recurrent 539,773 713,347 5,182,232 8,809,813 1,034,666 125 300 2,051,738 329,455 Capital 197,567 771,177 1,162,527 3,265,164 380,025 56 060 555,472 68,397
Financing gaps Total gaps 457,413 1,041,610 382,973 2,306,759 332,438 48 357 930,240 130,345 Of which EFA gap as % of total gaps** 45% 64% 49% 90% 67% 72% 68% 78% Minus household contribution 243,555 709,399 253,967 2,135,980 103,915 NA 619,040 NA Minus household & donor contribution 144,555 604,928 204,967 2,131,430 -5,370 357 572,204 122,018
Note:
35
36
* Higher Education lies under GoNU, indicators represent for both Northern & Southern Sudan ** EFA is considered comprised of pre-school, primary and non formal education. *** Excluding pre-school education for Southern Sudan, due to lack of information **** Excluding NFE for DR Congo, due to lack of information

Conclusions to Scenario 3 In this scenario, we tried to assess the cost implications if selected regional and international benchmarks, including the EFA-FTI indicative framework, were applied, whether or not EFA goals would be achieved and what related costs and financing gaps could be. It is observed that in all countries, universal primary education goal could be achieved and all other education levels would have appreciably improved. Table 13 presents the cost required to implement this scenario as well as the associated financing gaps. Table 13: Annual cost requirements and financing gaps (US$ 000), 2009-2015
DRC Nigeria Sudan Total North South
Average annual public education expenditure 643,889 9,768,218 1,676,970 267,508 12,356,585 Recurrent 516,423 7,934,566 1,344,449 218,051 10,013,489 Capital 127,467 1,833,652 332,522 49,456 2,343,097
Average projected resource needs 1,484,524 12,074,977 2,607,210 397,852 16,564,563 Recurrent 713,347 8,809,813 2,051,738 329,455 11,904,353 Capital 771,177 3,265,164 555,472 68,397 4,660,210
Total financing gaps 1,041,610 2,318,848 930,240 130,345 4,421,043 Gaps as % of public education expenditure 162% 24% 53% 48% 36% Of which Gap of capital costs 643,710 1,431,512 222,951 18,941 2,317,114 Gap of capital costs as % of total gaps 62% 62% 24% 15% 52% Of which EFA funding gap 666,630 2,078,126 620,933 101,600 3,455,200 EFA gap as % of total gaps 64% 89.60% 67% 78% 78%
Financing gap by level of education Preschool education 38,836 451,337 189,129 -517 678,785 Primary education 623,216 1,178,035 414,543 96,592 2,312,386 Secondary 1st cycle (Nigeria) -- 197,389 na na 197,389 Secondary 272,026 -250,057 248,178 27,539 297,686 TVET -- 178,089 14,201 na 192,290 Higher 43,649 190,774 45,535 249 280,207 NFE -- 448,754 17,262 5,525 471,541 Other cross-cutting expenditures 63,883 -75,473 1,394 -3,635 -13,831
Financing gap minus household & donor contributions 604,928 2,314,298 572,204 122,018 3,613,448 Household contribution 332,211 169,450 311,200 na 812,861 Donor contribution 104,471 40,425 46,837 8,327 200,060 Gaps as % of public education expenditure, 93% 22% 31% 43% 29% after inclusion of stakeholder contribution If EFA-FTI scenario was to be implemented, the three case-study countries would require, on average, US$ 16.6 billion, yearly from 2009 to 2015 for their educational development, whereas the financing gaps represent 36% over domestic public resources (around US$ 4.4 billion yearly). In these, the gaps for the development of the EFA components would be around 78% (US$ 3.5 billion each year) and the gaps related to capital costs would represent about 52% (US$ 2.3 billion each year) Taking into consideration the contribution of stakeholders, the expected funding gaps in three case study countries are US$ 3.6 billion each year. In other words, the total additional

38
financial resources to mobilize during 7 years from 2009 to 2015 will be around US$ 25.3 billion in three case study countries. It appears that the EFA/FTI scenario is slightly more expensive than the Status Quo scenario. The financing gap is, however, less as the share of GDP allocated to education has been assumed to increase in the coming years, except for Northern Sudan. The case of Northern Sudan is again different as the National Plan scenario mainly called for more resources to be allocated to education while the education targets were not so ambitious; it resulted that in the EFA-FTI scenario, the financial gap is increased as the education indicators are much improved compared to the National Plan Scenario while the finance devoted to education remain the same as in the latter. Definitely, National Plan scenario is very expensive, especially in DR Congo and Nigeria, calling for improvement in policy design and service delivery. Overall, with National Plan scenario, the funding gap in DRC and Nigeria is incomparably higher in case study countries than with other scenarios. Table 14 presents the information on the resource requirements as well as the respective funding gaps across the previous three scenarios in three case study countries. Table 14: Annual cost requirements and financing gaps in three scenarios (US$ 000), 2009-2015 DRC Nigeria Sudan Total Status quo scenario North South
Average annual public education expenditure 423,951 8,514,448 1,375,616 169,058 10,483,073 Average projected resource needs 1,285,859 11,615,001 2,025,288 278,610 15,204,758 Financing gaps 1,031,578 3,100,554 649,672 109,551 4,891,355 Gaps as % of public education expenditure 243% 36% 47% 64% 47% Of which EFA funding gap 464,210 1,884,980 355,311 82,188 2,786,689 Minus household & donor contribution 638,190 2,926,553 296,754 101,224 3,962,721 Gaps as % of public education expenditure, 151% 34% 21% 58% 38% after inclusion of stakeholder contribution
National plan scenario Average annual public education expenditure 423,951 8,514,448 1,676,970 10,615,369 Average projected resource needs 1,677,298 20,551,276 2,253,141 24,481,715 Financing gaps 1,447,818 12,036,828 576,170 14,060,816 Gaps as % of public education expenditure 342% 141% 35% 132% Of which EFA funding gap 752,865 6,687,429 393,789 7,834,083 Minus household & donor contribution 1,002,909 11,787,339 229,592 13,019,840 Gaps as % of public education expenditure, 237% 138% 13% 123% after inclusion of stakeholder contribution
EFA-FTI scenario Average annual public education expenditure 643,889 9,768,218 1,676,970 267,508 12,356,585 Average projected resource needs 1,484,524 12,074,977 2,607,211 397,853 16,564,565 Financing gaps 1,041,610 2,306,759 930,240 130,345 4,408,954 Gaps as % of public education expenditure 162% 24% 53% 48% 36% Of which EFA funding gap 666,630 2,066,037 620,933 101,600 3,455,200 Minus household & donor contribution 604,928 2,131,430 572,204 122,018 3,430,580 Gaps as % of public education expenditure, after inclusion of stakeholder contribution
94%
24%
34%
46%
29%

Scenario 4: ‘Inclusion’ (This scenario is to estimate the resource implication by addressing marginalisation in education, in a sector-wide development framework, and the related costs and financing gaps.) As specified in the terms of reference of the GMR commission, the last task was to create a scenario for addressing the issues of marginalisation in education, which should include more detailed strategies for reaching and teaching the marginalised groups, and related costs. This scenario, developed in collaboration with the UNESCO GMR team and other research partners, would contain estimates of disaggregated costs for educating marginalized groups. Below are presented the results of such work in three case study countries.
Preliminary considerations Before conducting the costing of the inclusion scenario, all the previous scenarios were reviewed. The third “EFA-FTI” scenario appeared to be a workable one, which could be tapped on for furthering the costing of an “inclusive education” scenario. In other words, the EFA scenario was chosen as the basis to be elaborated. Several other questions were raised, including the following:
What is marginalization in education? Is it to be addressed in non formal only or both in formal and non formal educational settings?
In our costing exercise, what levels of education should attend to this issue of marginalization?
Achieving 100% NER or 100% competition rates assumes that there should be no dropouts at all at formal primary education level. Then, is 0% dropout rate possible, especially in case study countries? The answer is obviously no, at least in the foreseeable coming years.
If there are children who drop out from primary schools or who have never been to school and are not intending to do so, alternative basic education opportunities will have to be provided in non formal setting, as it is already a massive phenomenon in Southern Sudan and Ethiopia. On the same vein, this is to admit that 100% NER or completion rate will be practically impossible!
This reflection led to the conclusion that in the GMR costing exercise, marginalization issues should be dealt with in both formal and non formal environments. In non formal setting, alternative education (through various modalities and practices, including equivalency, school re-integration, alternative education programmes, etc.) would be encouraged. In addition to literacy teaching, some specific non formal programmes would be promoted for providing marginalized, dropouts and out-of-school children with basic literacy, numeracy and life skills. In formal education, three categories of marginalization were considered important for the purpose of the GMR costing: HIV/AIDS response, disabilities and other kinds of marginalization (extreme poverty, minorities, nomadic children, demobilized soldiers, etc.) to be contextualized according to case study countries.

Below are presented the data, policy assumptions, benchmarks, their sources of information, as well as the methods used for estimating some data and information in case those data were not readily available.
Policy assumptions and targets The following tables present the categories of marginalization addressed in the GMR costing exercise, the assumptions on targets, as well as the additional costs required to attend to these issues in formal education. Table 15: Target assumptions for addressing marginalization in formal education Categories DRC Nigeria Sudan Unit cost (additional) North South Dropout rate in primary 2% 1% 1% 2% To be considered in alternative
education programmes HIV/AIDS
% of AIDS orphan children 2.77% 1.63% NA NA 100% of recurrent unit cost % of HIV-positive pupils 0.37% 0.34% 0.2% 0.2%* 50% of recurrent unit cost % of HIV prevalence of teachers 3.68% 3.17% 1.4% 1.6% 20% more of teacher salary AIDS mortality rate 7.89% 6.4% 4.6% 4.6% Teacher replacement Staff absenteeism in year units due to HIV/AIDS related illnesses
10% 10% 10% 10% Teacher replacement
Providing HIV-positive staff with treatment, counselling, etc.
NA NA NA NA 5% more of teacher salary
Disabled children % of children physically disabled 2.0% 1.0% 0.7% (**) 0.7%* (**) 30% of recurrent unit cost % of children mentally disabled 1.5% NA NA 30% of recurrent unit cost
Other issues of marginalization % of extremely poor children 16.3% 15% 33% 30% of recurrent unit cost Abandoned/Street Children: 0.13% NA NA NA 30% of recurrent unit cost Children affected by armed conflicts 0.10% NA NA NA 30% of recurrent unit cost Pygmy Children 0.80% NA NA NA 30% of recurrent unit cost Adolescent mothers (26% of girls of sec. school pop.)
26% NA NA NA 30% of recurrent unit cost
Orphans (due to other causes than HIV/AIDS)
7.55% NA NA NA 100% of recurrent unit cost
% of the nomadic children NA 5.4% NA NA 10% of recurrent unit cost *For Sudan, the % of HIV-positive and disabled children is reported over total primary school age-population for inclusion of out-of-schools within the system. For secondary education, the % is reported over secondary education pupils as incentives for encouraging their schooling and preventing drop-out. (**) Total % of disabled whether they are physically or mentally challenged. To address the issues of marginalization in non formal education, a few additional options were considered as presented in Table 15. As noted in the above table, dropout rate has been assumed to decrease down to 1-2% only by 2015, and most of the dropouts would be taken care of through various non formal education programmes. Such drastic reduction of the dropouts from formal schools would have been possible by means of targeted support to the marginalized groups in formal education as indicated in this table.
40
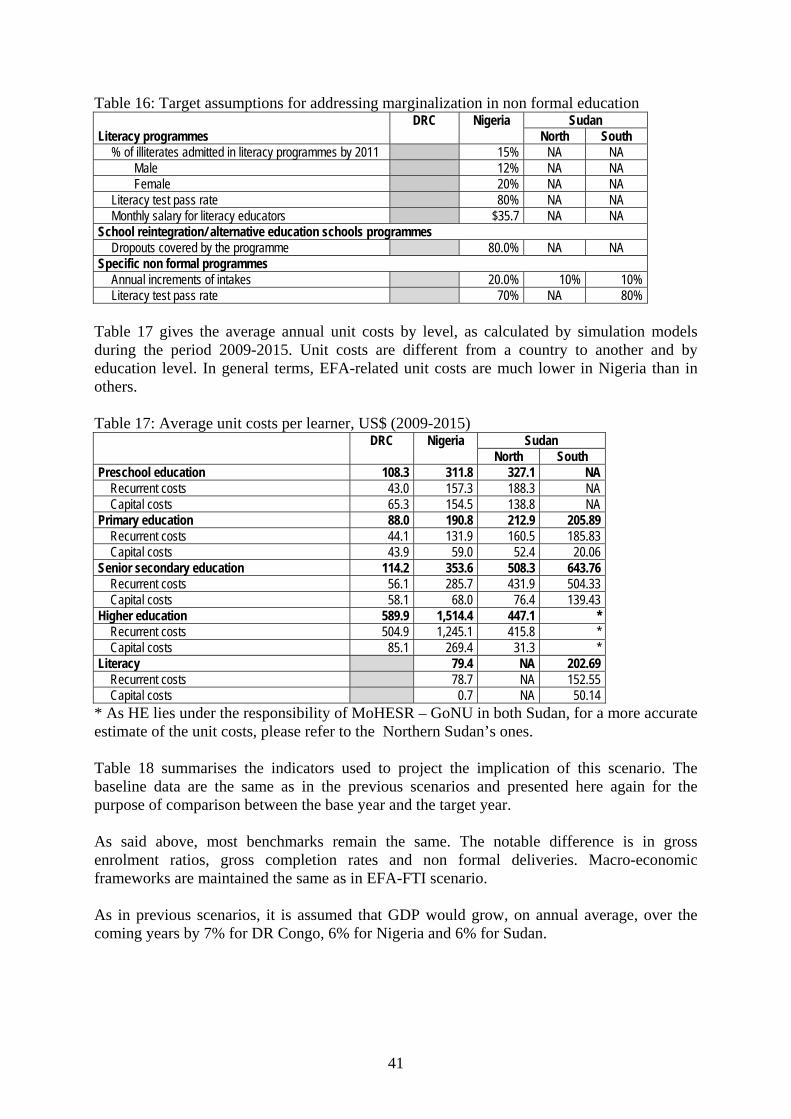
41
Table 16: Target assumptions for addressing marginalization in non formal education DRC Nigeria Sudan Literacy programmes North South
% of illiterates admitted in literacy programmes by 2011 15% NA NA Male 12% NA NA Female 20% NA NA
Literacy test pass rate 80% NA NA Monthly salary for literacy educators $35.7 NA NA
School reintegration/ alternative education schools programmes Dropouts covered by the programme 80.0% NA NA
Specific non formal programmes Annual increments of intakes 20.0% 10% 10% Literacy test pass rate 70% NA 80%
Table 17 gives the average annual unit costs by level, as calculated by simulation models during the period 2009-2015. Unit costs are different from a country to another and by education level. In general terms, EFA-related unit costs are much lower in Nigeria than in others. Table 17: Average unit costs per learner, US$ (2009-2015)
DRC Nigeria Sudan North South
Preschool education 108.3 311.8 327.1 NA Recurrent costs 43.0 157.3 188.3 NA Capital costs 65.3 154.5 138.8 NA
Primary education 88.0 190.8 212.9 205.89 Recurrent costs 44.1 131.9 160.5 185.83 Capital costs 43.9 59.0 52.4 20.06
Senior secondary education 114.2 353.6 508.3 643.76 Recurrent costs 56.1 285.7 431.9 504.33 Capital costs 58.1 68.0 76.4 139.43
Higher education 589.9 1,514.4 447.1 * Recurrent costs 504.9 1,245.1 415.8 * Capital costs 85.1 269.4 31.3 *
Literacy 79.4 NA 202.69 Recurrent costs 78.7 NA 152.55 Capital costs 0.7 NA 50.14
* As HE lies under the responsibility of MoHESR – GoNU in both Sudan, for a more accurate estimate of the unit costs, please refer to the Northern Sudan’s ones. Table 18 summarises the indicators used to project the implication of this scenario. The baseline data are the same as in the previous scenarios and presented here again for the purpose of comparison between the base year and the target year. As said above, most benchmarks remain the same. The notable difference is in gross enrolment ratios, gross completion rates and non formal deliveries. Macro-economic frameworks are maintained the same as in EFA-FTI scenario. As in previous scenarios, it is assumed that GDP would grow, on annual average, over the coming years by 7% for DR Congo, 6% for Nigeria and 6% for Sudan.

Table 18: Quantitative indicators (baseline and targets) used for the inclusion scenarios DR Congo Nigeria Sudan Baseline 2015 Baseline 2015 Baseline 2008 2015 2007 2006 North South North South
Pre-primary education Gross enrolment ratio (%) 3% 15% 12% 52% 22% NA 60% Pupil/teacher ratio 28 35 52 35 30 NA 30 % of children in private schools 69% 44% 44% 65% 27% NA 33% Share as % education budget 1.0% 1.9% 1.7% 6.0% 4.9% NA 15.9%
Primary education Intake rate (%) 103% 105% 109% 103% 104% 174% 104% 100% Gross enrolment ratio (%) 82% 100% 96% 100% 79% 77% 107% 105% Gross completion rate (%) 39% 79% 74% 86% 38% 7% 91% 66% Repetition rate 3% 3% 4% 4% 6% 14% 4% 7% % of pupils in private schools 11% 10% 10% 10% 6% 23% 10% 13% Pupil/teacher ratio (public) 38 40 52 40 33 51 40 43 Average class size (public) 36 40 89 40 50 75 43 57 Proportion of qualified teachers** 64% 67% 47% 80% 62% 24% 80% 37% Teacher salary as per capita GDP multiple 5.61 5.63 3.33 3.29 1.94 2.11 3.33 3.49 Share as % education budget 49% 48% 35% 40% 57% 65% 44% 60%
Secondary education Registration rate 71% 84% 61% 84% 87% 68% 92% 80% Gross enrolment ratio (%) 32% 66% 36% 50% 31% 3% 76% 42% Gross completion rate (%) 22% 55% 29% 34% 26% 2% 72% 32% Repetition rate 15% 10% 2.2% 2.3% 3% 5% 3% 5% % of pupils in private schools 16% 34% 18% 24% 20.1% 36% 43.4% 53% Pupil/teacher ratio (public) 25 40 42 43 14 17 13 16 Teacher salary as per capita GDP multiple 5.65 5.66 6.45 6.13 1.96 2.41 3.41 3.57 Share as % education budget 27% 27% 24% 25% 12% 3% 23% 21%
Technical and vocational education Enrolment as % of secondary education 2% 28.6% Share as % education budget 0.4% 5%
Higher education Gross enrolment ratio 4% 7% 15% 18% 11% 1% 15% 3% % of pupils in private schools 25% 26% 14% 14% 14% * 14% Teacher salary as per capita GDP multiple 38 38 11 9 11 * 11
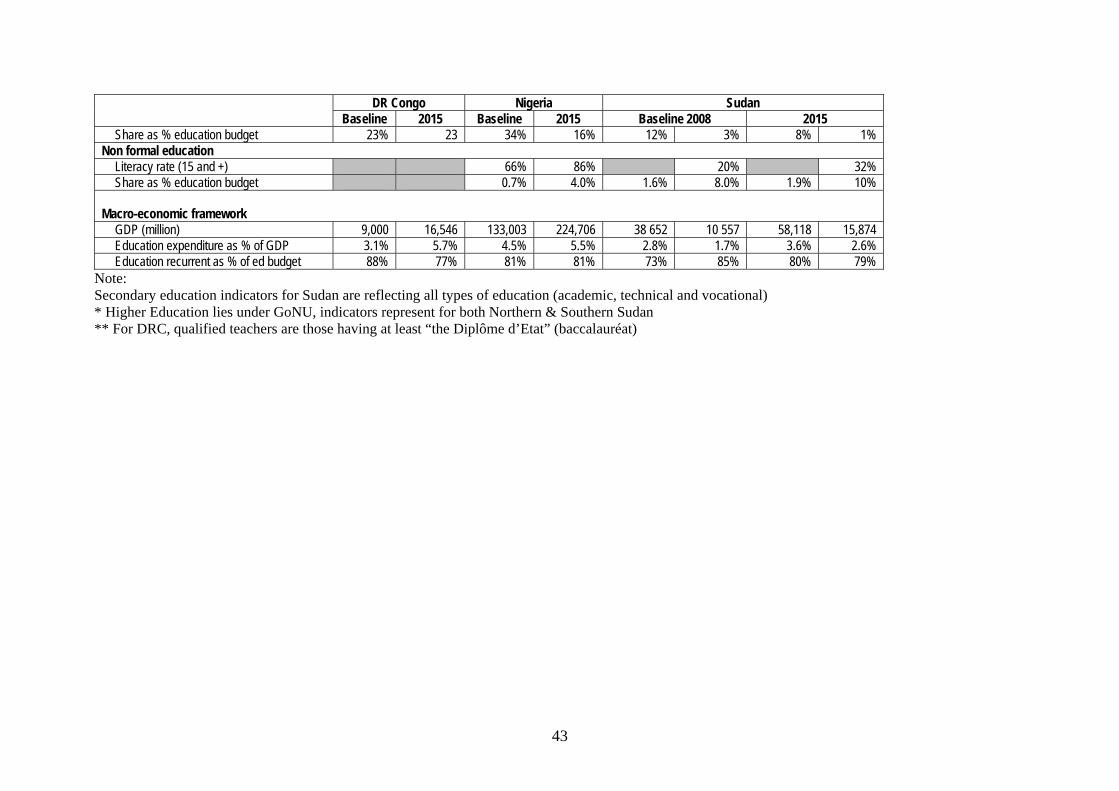
43
DR Congo Nigeria Sudan Baseline 2015 Baseline 2015 Baseline 2008 2015
Share as % education budget 23% 23 34% 16% 12% 3% 8% 1% Non formal education
Literacy rate (15 and +) 66% 86% 20% 32% Share as % education budget 0.7% 4.0% 1.6% 8.0% 1.9% 10%
Macro-economic framework
GDP (million) 9,000 16,546 133,003 224,706 38 652 10 557 58,118 15,874 Education expenditure as % of GDP 3.1% 5.7% 4.5% 5.5% 2.8% 1.7% 3.6% 2.6% Education recurrent as % of ed budget 88% 77% 81% 81% 73% 85% 80% 79%
Note: Secondary education indicators for Sudan are reflecting all types of education (academic, technical and vocational) * Higher Education lies under GoNU, indicators represent for both Northern & Southern Sudan ** For DRC, qualified teachers are those having at least “the Diplôme d’Etat” (baccalauréat)

Resource requirements Table 19 gives the average annual financial requirements as well as the financing gaps over public education expenditure during the period 2009-2015. The financing gaps by subsector have been calculated on the basis of the subsector allocations specified in Table 20. Table 19: Average annual financial requirements and funding gaps, US$ 000 (2009-2015)
DRC Nigeria Sudan Total North South
GDP 13,630,562 189,951,489 49,129,147 13,418,612 266,129,810 Public expenditure on education as % of GDP 4.7% 5.1% 3.4% 2.0% 4.6%
Public expenditure on education 643,889 9,768,218 1,676,970 267,508 12,356,585 Cost estimates for this scenario 1,818,548 12,655,366 2,714,327 443,711 17,631,952
Distribution by level 100.0% 100.0% 100.0% 100.0% 100.0% Preschool education 1.5% 5.8% 10.0% 1.0% 5.9% Primary education 48.4% 40.9% 51.0% 66.0% 43.9% Secondary education 26.9% 21.9% 18.0% 11.0% 21.5% TVET education 2.5% 1.0% na 1.9% Higher education 23.0% 21.1% 10.0% 2.0% 19.1% Non formal education 4.0% 2.0% 10.0% 3.4% Cross-cutting expenditures 0.2% 3.7% 8.0% 11.0% 4.2%
Total financing gaps 1,174,658 2,887,148 1,034,994 176,203 5,273,003 Gaps as % of public education expenditure 185% 30% 62% 64% 43% Of which Gap of capital costs 691,015 1,464,945 230,807 24,106 2,410,873 Gap of capital costs as % of total gaps 59% 51% 22% 14% 46% Of which EFA funding gap 735,358 2,057,298 686,097 135,884 3,614,637 EFA gap as % of total gaps 63% 71% 66% 77% 69%
Financing gap by level of education Preschool education 38,836 1,463,025 189,129 -517 1,690,473 Primary education 696,521 415,620 462,357 120,405 1,694,903 Secondary education 322,650 12,990 274,652 35,586 645,878 TVET education 356,505 8,750 na 365,255 Higher education 43,649 239,953 34,141 588 318,331 Non formal education 43,393 22,742 15,996 82,131 Cross-cutting expenditures 73,001 45,191 10,487 -446 128,233
Financing gap minus household & donor contributions 730,681 2,711,561 676,958 167,877 4,287,077
Household contribution 339,506 171,038 311,200 na 821,744 Donor contribution 104,471 31,850 46,837 8,327 191,485
Gaps as % of public education expenditure, 113% 28% 37% 59% 35% after inclusion of stakeholder contribution
* excluding pre-school education ** See North Sudan Table 20: Subsector allocations of domestic educational resources (base year and 2015)
DRC Nigeria Sudan North Sudan South 2007 2015 2006 2015 2008 2015 2008 2015
ECCE 1.0% 2.0% 1.7% 6.0% 6.0% 6.0% 1.5% 2.0% Primary 49.0% 48.0% 33.8% 40.0% 55.0% 50.0% 64.5% 60.0% Secondary 26.9% 26.9% 23.3% 25.0% 12.0% 15.0% 4.0% 20.0% TVET 0.4% 5.0% 0.6% 5.0% Higher 23.0% 23.0% 35.4% 16.0% 12.5% 12.3% 2.5% 2.5% Non formal 0.7% 4.0% 1.6% 2.0% 10.0% 10.0% Cross-cutting 0.1% 0.1% 4.7% 4.0% 12.3% 9.7% 17.5% 5.5%

Note: In DRC, literacy and Non formal education are under Ministry of Social Affairs, and do not depend on Ministry of Education. As indicated in Table 20, it is assumed that the three case study countries would allocate different shares of their national income for education (ranging from 2 to 5%). It is worth noting that the duration of primary education in Sudan (both North and South) is longer than in the two other countries. Regardless of their respective duration and if we take pre-primary, primary, and non formal education as EFA-related subsectors, the annual financing gaps for EFA would be around US$ 3.6 billion from 2009 to 2015, representing 69% over domestic education resources in the three case study countries. Table 20: Cost breakdown, US$000 (2009-2015) DRC Nigeria Sudan Total North South Total Total costs, excluding "inclusion" 1,754,236 12,064,262 2,624,561 409,159 3,033,720 16,852,218 Inclusion costs 64,312 591,103 87,402 34,213 121,615 777,030
HIV/AIDS-related costs 29,052 159,639 10,138 1,694 11,832 200,523 Primary Education 15,531 73,192 1,427 518 1,945 90,668 Secondary Education 7,120 55,918 651 114 765 63,803 Life skills Education 28 18,704 5,248 880 6,128 24,860 Overhead and other costs 6,373 11,825 2,812 182 2,994 21,192
Other inclusion costs 35,260 431,464 77,264 32,519 109,783 576,507 Primary Education 5,247 227,248 46,387 23,295 69,682 302,177 Secondary Education 28,334 183,670 25,823 7,097 32,920 244,924 Overhead and other costs 1,679 20,546 5,054 2,127 7,181 29,406
Total costs, including "inclusion" 1,818,548 12,655,366 2,714,327 443,711 3,158,038 17,631,952 % of inclusion costs 3.5% 4.7% 3.2% 7.7% 3.9% 4.4% Inclusion costs amount to some US$ 777 million, representing around 4.4% of total educational costs. The details of the inclusion aspects considered for each of the case study countries are explained in Part II. On the other hand, it should be noted that some costs required for the inclusion scenario might come from other ministries, including the Ministry of Health (in relation to the HIV/AIDS response).
Conclusions to Scenario 4 In this scenario, the resource requirements for addressing marginalisation in education have been assessed, in a sector-wide development perspective, as well as the financing gaps. Table 21 compares the EFA-FTI scenario with the inclusion scenario, in terms of resource requirements and financing gaps. Given that marginalization issues should be addressed in both formal and non formal educational settings, several discrete assumptions have been made:
In non formal setting, alternative education, and literacy and other non formal programmes would be promoted for providing marginalized, dropouts and out-of-school children with basic literacy, numeracy and life skills.
In formal education, some specific issues of marginalization were considered, including: HIV/AIDS response, disabilities and other issues (extreme poverty,
45

46
minorities, nomadic children, demobilized soldiers, etc.) with necessary contextualization across case study countries.
Overall, in order to implement these policy assumptions, the inclusion scenario is around 6-7% more expensive than the EFA-FTI scenario and financing gaps are 18% higher than in the EFA-FTI scenario. Table 21: Comparison between EFA-FTI and Inclusion Scenarios
DRC Nigeria Sudan Total EFA-FTI scenario North South
Average annual public education expenditure 643,889 9,768,218 1,676,970 267,508 12,356,585 Average projected resource needs 1,484,524 12,074,977 2,607,211 397,853 16,564,565 Financing gaps 1,041,610 2,306,759 930,240 130,345 4,408,954 Gaps as % of public education expenditure 162% 24% 53% 48% 36% Of which EFA funding gap 666,630 2,066,037 620,933 101,600 3,455,200 Households contribution 332,211 1,195,457 572,204 NA NA
Inclusion scenario Average annual public education expenditure 643,889 9,768,218 1,676,970 267,508 12,356,585 Average projected resource needs 1,818,548 12,655,366 2,714,327 443,711 17,631,952 Financing gaps 1,174,658 2,887,148 1,034,994 176,203 5,273,003 Gaps as % of public education expenditure 182% 30% 62% 64% 43% Of which EFA funding gap 735,358 2,098,761 686,097 135,884 3,656,100 Households contribution 339,506 1,195,457 676,958 NA NA
Difference of gaps between EFA-FTI and inclusion scenarios 133,048 580,389 104,754 45,858 864,049
As % of EFA-FTI Gap 12.8% 25.2% 11.26% 35.18% 19.60% * excluding pre-school The three case-study countries would require, on average, US$ 18 billion yearly from 2009 to 2015 for adequately addressing marginalization in their educational development, whereas the financing gaps represent some 45% over domestic public resources. The gaps for the EFA components would be around 70% of total public gap. The table indicates that some US$ 864 million more would be additionally required by year to attend to marginalization issues in education and advance the EFA goals.
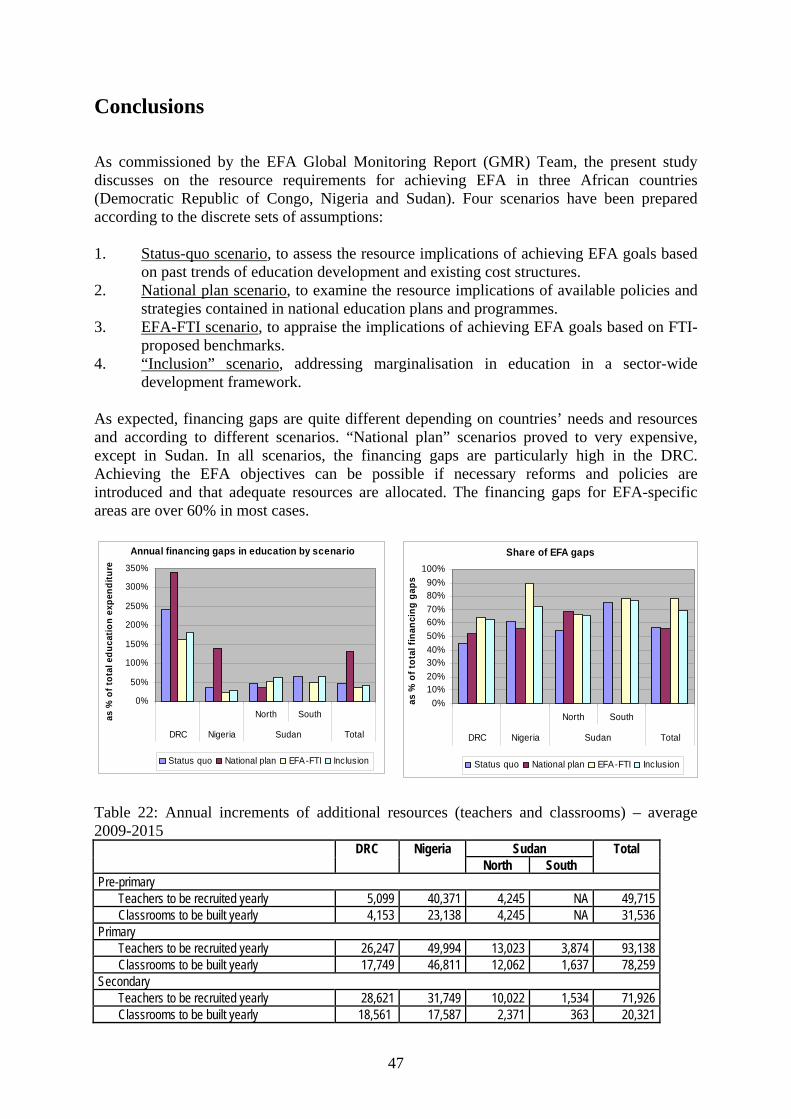
Conclusions
As commissioned by the EFA Global Monitoring Report (GMR) Team, the present study discusses on the resource requirements for achieving EFA in three African countries (Democratic Republic of Congo, Nigeria and Sudan). Four scenarios have been prepared according to the discrete sets of assumptions: 1. Status-quo scenario, to assess the resource implications of achieving EFA goals based
on past trends of education development and existing cost structures. 2. National plan scenario, to examine the resource implications of available policies and
strategies contained in national education plans and programmes. 3. EFA-FTI scenario, to appraise the implications of achieving EFA goals based on FTI-
proposed benchmarks. 4. “Inclusion” scenario, addressing marginalisation in education in a sector-wide
development framework. As expected, financing gaps are quite different depending on countries’ needs and resources and according to different scenarios. “National plan” scenarios proved to very expensive, except in Sudan. In all scenarios, the financing gaps are particularly high in the DRC. Achieving the EFA objectives can be possible if necessary reforms and policies are introduced and that adequate resources are allocated. The financing gaps for EFA-specific areas are over 60% in most cases.
Annual financing gaps in education by scenario
0%
50%
100%
150%
200%
250%
300%
350%
North South
DRC Nigeria Sudan Total
as %
of t
otal
edu
catio
n ex
pend
iture
Status quo National plan EFA-FTI Inclusion
Share of EFA gaps
0%10%20%30%40%50%60%70%80%90%
100%
North South
DRC Nigeria Sudan Total
as %
of t
otal
fina
ncin
g ga
ps
Status quo National plan EFA-FTI Inclusion
Table 22: Annual increments of additional resources (teachers and classrooms) – average 2009-2015
DRC Nigeria Sudan Total North South Pre-primary
Teachers to be recruited yearly 5,099 40,371 4,245 NA 49,715 Classrooms to be built yearly 4,153 23,138 4,245 NA 31,536
Primary Teachers to be recruited yearly 26,247 49,994 13,023 3,874 93,138 Classrooms to be built yearly 17,749 46,811 12,062 1,637 78,259
Secondary Teachers to be recruited yearly 28,621 31,749 10,022 1,534 71,926 Classrooms to be built yearly 18,561 17,587 2,371 363 20,321
47

The additional resources to mobilize (especially teachers and classrooms) in the three case study countries are appreciable, as illustrated in Table 22. In these three countries alone, on average, some 93 thousands new teachers will have to be recruited yearly and 78 thousands new classrooms built each year at primary level. If one adds the needs for pre-primary and secondary education, some 200 thousands new teachers will have to be recruited and some 130 thousand new classrooms built each year from now until 2015. Addressing marginalization in education is a necessity if countries want to achieve the EFA goals. This involves more resources. Financing gaps are especially high in DRC and Sudan and governments will need to increase their allocations to education. DRC and Sudan are currently trying to lessen the enormous gaps by increasing financial burden on families. Another important question is that resources need to be better and transparently utilized. The proportion of the gaps of the EFA components is particularly high at around 75%. International aid seems very insufficient in all three case study countries. Some 3.5 billion dollars may need to be invested yearly by international partners, to achieve the EFA goals while addressing marginalization issues in the three case study countries. Further macro-economic and financing assumptions for Inclusion Scenario Given the uncertainty of the macro-economic development and resource allocations for education in three case studies, three more variants of the inclusion scenario were created to help discuss on the magnitude of the financing gaps under various hypotheses of possible financing frameworks, as follows:
High-case variant to reflect an optimistic hypothesis of financial perspectives Low-case, considering pessimistic economic and financial development hypotheses Middle-case situation, in between the two above macro-economic projections
Only three macro-economic and financing indicators were changed to weigh the financing gaps of the simulation costs calculated under the above Inclusion Scenario (GDP growth rate, Government expenditure as percentage of GDP and share of education in government finance). The results of such exercises are presented in Table 23. For more details, refer to Part II on country case studies. Table 23: Inclusion scenario (basic inclusion and high, low and middle-case assumptions), average annual financing gaps (2009-2015)
DRC Nigeria Sudan Total North South Total simulation costs (000) 1,818,548 12,655,366 2,714,327 443,711 17,631,952
Recurrent costs 1,000,066 9,356,770 2,150,998 370,149 12,877,983 Capital costs 818,482 3,298,597 563,329 73,562 4,753,970
Inclusion Scenario - Base GDP Growth Rate 7% 6% 6% 6% Public expenditure on education (000) 643,889 9,576,308 1,676,970 267,508 12,164,675
Public spending on education as % of GDP 4.6% 5.5% 3.4% 2.0% Public spending on education as % of Gvt Finance 15.3% 18.8% 15.8% 9.2%
Financing gaps (000) 1,174,658 2,724,259 1,037,356 176,203 5,112,476 Financing gaps (%) after inclusion of stakeholder contribution 113% 25% 62% 66%
High case GDP Growth Rate 10% 8% 10% 10%
48

Public expenditure on education (000) 1,447,823 13,991,259 2,120,672 318,435 17,878,189 Public spending on education as % of GDP 8.6% 8.0% 3.6% 2.0% Public spending on education as % of Gvt Finance 22.3% 20.0% 16.9% 9.2%
Financing gaps (000) 514,639 -928,713 593,655 188,086 367,667 Financing gaps (%) after inclusion of stakeholder contribution 9% -7% 28% 59%
Middle case GDP Growth Rate 7.50% 6.20% 6% 6% Public expenditure on education (000) 853,533 8,487,329 1,375,616 169,391 10,885,869
Public spending on education as % of GDP 6.0% 4.5% 2.8% 1.3% Public spending on education as % of Gvt Finance 18.3% 15.5% 13.0% 6.0%
Financing gaps (000) 987,351 3,885,768 1,338,710 274,320 6,486,149 Financing gaps (%) after inclusion of stakeholder contribution 63% 42% 97% 162%
Low case GDP Growth Rate 5% 4.80% 4.60% 4.60% Public expenditure on education (000) 440,540 6,694,254 1,300,801 160,175 8,595,770
Public spending on education as % of GDP 3.6% 3.5% 2.8% 1.3% Public spending on education as % of Gvt Finance 11.7% 14.0% 13.0% 6.0%
Financing gaps (000) 1,294,707 5,220,107 1,413,525 283,536 8,211,875 Financing gaps (%) after inclusion of stakeholder contribution 188% 75% 109% 177%
Under the various macro-economic and financing assumptions indicated in Table 23, the financing gaps can be very different as illustrated in Fig. 2. The gaps would be marginal according to High-case assumptions (even down to surplus in the case of Nigeria), but very large according to the Low-case variant of the Inclusion scenario. Fig. 2: Financing gaps (US$000) according to macro-financing assumptions
-1,000,000
0
1,000,000
2,000,000
3,000,000
4,000,000
5,000,000
6,000,000
InclusionScenario - Base
High case Middle case Low case
Scenario assumptions
Fina
ncin
g ga
ps (0
00)
DRCNigeriaSudan
49

Annex
Annex 1. References UNESCO. 2005. Education Policy and Strategy Simulation model (EPSSim) 2.1: User’s
guide. Paris, UNESCO. UNESCO. 2008. Global Monitoring Report 2009: Education for All – Governance Matters.
Paris, UNESCO.
50

Annex 2. Educational systems in case study countries DRC Nigeria Sudan Basic Primary (6 years) Primary (6 years) Basic (8 years) Junior Secondary (3 years)
Post-Basic Cycle d'orientation (collège) (2 years) Senior Secondary (3 years) Secondary Academic + technical (3 years): North
Humanités (Lycée) (4 years) Secondary Academic + technical & science (4 years): South Vocational (2 years) : North To be confirmed Higher Universités University University: North Instituts supérieurs de commerce Polytechnics Colleges: North Instituts supérieurs téchniques Monotechnics 3 universities to be repatriated: South Teacher ED Université pédagogique nationale Colleges of Education included in University: North Instituts supérieurs pédagogiques Some in University Distance learning (through Kenyan University) : South State Teacher Training Institute: South Country education Centres : South Diaspora Skill Transfer Programme : South Pre-school Crèches/Jardin d'enfants Nurseries pre-school (2 years) : NORTH Ecoles maternelles (pré-primaire) Kindergarten ECCE (2 years) : South Non formal Literacy Literacy: North and others Centres d'alphabétisation Nomadic (formal) Adolescents: North Centres de rattrapage scolaire Islamiyya (either formal or non formal) Vocational (senior sec, formal)
Apprentissage professionnel Technical (formal) Alternative Education System: South Formal, non formal to be confirmed
NGOs-run centres
Continuing education (for junior and senior)
51