experimentation and evaluation of tyre pyrolysis oil -...
TRANSCRIPT
Experimentation and Evaluation of
Tyre Pyrolysis Oil
Thesis submitted in partial fulfillment of the requirements for the degree of
Bachelor of Technology in Mechanical Engineering
By
Department of Mechanical Engineering
National Institute of Technology, Rourkela
2013-2014
Shubharanshu Shekhar Mahapatra
110ME0300
Dept. of Mechanical Engineering
Under the Guidance of
Dr. Saroj Kumar Patel
Associate Professor
Dept. of Mechanical Engineering
I
National Institute of Technology
Rourkela
CERTIFICATE
This is to certify that the thesis entitled, “Experimentation and Evaluation of Tyre Pyrolysis Oil”
submitted by Shubharanshu Shekhar Mahapatra in partial fulfillment of the requirements for the
award of Bachelor of Technology in Mechanical Engineering at the National Institute of
Technology, Rourkela is an authentic work carried out by him under my supervision and guidance.
To the best of my knowledge, the matter embodied in the thesis has not been submitted to any
other University/ Institute for the award of any Degree or Diploma.
Date: 09-05-2014 Dr. Saroj Kumar Patel
Department of Mechanical Engineering
National Institute of Technology
Rourkela
II
ACKNOWLEDGEMENT
I wish to express my sincere gratitude to Dr Saroj Kumar Patel for his inspiring encouragement,
guidance and efforts taken throughout the entire course of this work. His organizational skills
helped immensely for the smooth running of the research work.
I also would like to thank Dr S. Murugan for his brainstorming sessions and providing the
equipment and Lab facility to do research and test the fuel in a DI diesel engine.
We are grateful to Prof. S.K. Sarangi, Director, and Prof K.P Maity, Head of the Department,
Mechanical Engineering, for their active interest and support.
We would also like to thank Mrs Kapura Tudu, Ph.D.scholar for her constant help in conducting
the experiments. Last but not the list I would like to thank all my friends who have helped me to
complete the project on time.
Shubharanshu Shekhar Mahapatra
110ME0300

III
ABSTRACT
Scrap tyre consists of organic matter that is often disposed illegally in open lands, ultimately
causing an environmental problem. Pyrolysis is considered as a useful technique for recycling of
scrap tyres by using which liquid, gases, carbon black and steel wires are obtained. The difficulty
in using Tyre Pyrolysis Oil (TPO) as an energy source is its complex chemical composition. The
following report discusses about how the oil can be effectively utilized by separating it according
to composition using the process of fractional distillation. From 1.5 Litre of TPO 350 ml of distilled
oil is obtained in the temperature range of 200-270 0C which is blended with diesel to be used as
high grade fuel to run a DI 4 stroke single cylinder diesel engine. The TPO left in the flask after
distillation is found to have high viscosity, high fire point and high pour point; as a result of which
it is utility is found in being used as a base for manufacture of lubricants. By employing such
techniques the commercial value of TPO is increased and also better results were obtained. With
increase in utility of TPO it is expected that more such manufacturing plants will come up. This
will help to recycle more percentage of waste tyres from among the 1 billion scrap tyres generated
each year around the world.

IV
Table of Contents
CERTIFICATE………………………………………………………………………………....... i
ACKNOWLEDGEMENT .............................................................................................................. ii
ABSTRACT…………………………………………………………………………………… iii
INTRODUCTION
1.1 Waste Products and their Classification ........................................................................... 2
1.1.1 Special Waste .......................................................................................................... 2
1.1.2 Liquid Waste ........................................................................................................... 2
1.1.3 Hazardous Waste ..................................................................................................... 3
1.1.4 General Solid Waste ................................................................................................ 3
1.2 Waste Tyres ...................................................................................................................... 3
1.3 Methods of Waste Tyre Recycling ................................................................................... 4
1.4 Motivation……………………………………………………………………………….5
LITERATURE REVIEW
2.1 Tyre Pyrolysis Oil……………………………………………………………………..8
2.2 TPO as a Fuel in IC Engine…………………………………………………………..9
PROPERTIES AND CHARACTERIZATION ............................................................................ 10
3.1 General ............................................................................................................................. 11
3.2 Production of Tyre Pyrolysis Oil ..................................................................................... 11
3.3 Analysis of Tyre Pyrolysis Oil ......................................................................................... 12
3.4 GC-MS Analysis of TPO………………………………………………………………..13
EXPERIMENTAL SETUP AND METHODOLOGY
4.1 General ............................................................................................................................. 16
4.2 Distillation Setup .............................................................................................................. 16
4.3 Engine Experimental Setup .............................................................................................. 17
4.4 Data collection for performance parameters .................................................................... 19
4.4.1 Brake thermal efficiency (BTE) ....................................................................... 19
4.5.1 Brake Specific Energy Consumption (BSEC)………………………………..20
V
4.5 Engine Parameters measurement Devices ........................................................................ 20
4.5.1 Piezo electric transducer................................................................................... 20
4.5.2 Proximity Sensors ............................................................................................ 21
4.5.3 Analog to Digital Converter ............................................................................. 21
4.5.4 Gas Analyzer .................................................................................................... 21
4.5.5 Smoke Analyzer ............................................................................................... 22
4.6 Research Methodology ..................................................................................................... 22
RESULTS AND DISCUSSION
5.1 Fractionally Distilled TPO Phase 1. ................................................................................. 25
5.2 Fractionally Distilled TPO Phase 2 .................................................................................. 27
5.3 Results from Engine run with LFPO blends .................................................................... 28
5.3.1 Combustion Parameters........................................................................................... 28
5.3.1.1 Cylinder Pressure vs Crank Angle .............................................................. 28
5.3.1.2 Cylinder Peak Pressure ............................................................................... 29
5.3.1.3 HeatReleaseRate………………………………………………………….. 30
5.3.1.4 Combustion Duration .................................................................................. 31
5.3.2 Performance Parameters .......................................................................................... 32
5.3.2.1 Brake Specific Energy Consumption vs Brake Power…………………….32
5.3.3 Emission Parameters ............................................................................................... 32
5.3.3.1 NOx Emission…………………………………………………………......32
5.3.3.2 Smoke Opacity ............................................................................................ 33
5.4 Discussion on Combustion of 40LFPO ............................................................................ 34
5.5 Discussion on 40LFPO as a fuel ...................................................................................... 35
5.6 Discussion on TPO distillate collected at >2700C………………………………………36
CONCLUSION…………………………………………………………………………………..37
REFERENCES ............................................................................................................................. 38

VI
List of Figures
Figure 1.1 Classification of Waste
Figure 4.1 Distillation Setup
Figure 4.2 Engine Experimental Setup
Figure 4.3 Schematic Representation of Test Engine
Figure. 4.4 Photographic view of Kistler pressure transducer
Figure 5.1 Image of Fractionally Distilled Tyre Pyrolysis Oil
Figure 5.2 (a) Distillate 200-270 0C (b) Distillate> 2700C
Figure 5.3 Cylinder Pressure vs Crank Angle
Figure 5.4. Cylinder Peak Pressure vs Brake Power
Figure 5.5 Heat Release Rate vs Crank Angle
Figure 5.6 Combustion Duration vs Brake Power
Figure 5.7 Brake specific Energy Consumption vs Brake Power
Figure 5.8 NO emission vs Brake Power
Figure 5.9 Smoke Opacity vs Brake Power
List of Tables
Table 2.1 FTIR Analysis of TPO
Table 2.2 GC-MS Analysis of major compounds present in TPO
Table 4.1 Details of Test Engine
Table 5.1 Properties of Distilled TPO at different Temperature Ranges
Table 5.2 Properties of TPO distillates
VII
NOMENCLATURE
BSEC – Brake specific Energy Consumption
bTDC – Before Top Dead Center
BTE – Brake Thermal Efficiency
CA – Crank Angle
FTIR - Fourier Transform Infrared Spectroscopy
GC-MS – Gas Chromatography Mass Spectroscopy
LFPO – Light Fraction Pyrolysis Oil
NOx – Oxides of Nitrogen
P – Instantaneous Pressure
TPO – Tyre Pyrolysis Oil
V – Instantaneous Volume
�̇� - Heat Release Rate
xxLFPO – xx percent of LFPO in 1 L blend.
γ - Ratio of specific heat
θ – Measure of Crank Angle in Degree

1
Chapter 1
Introduction
2
INTRODUCTION
1.1 Waste Products and their Classification
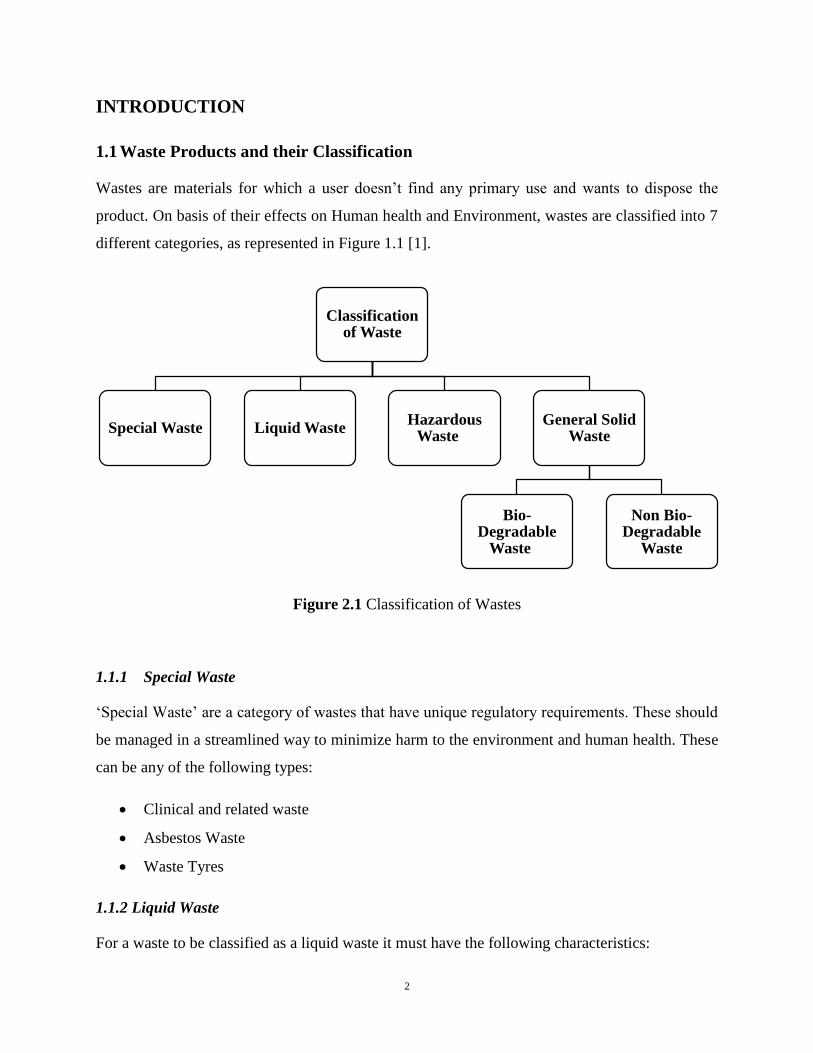
Wastes are materials for which a user doesn’t find any primary use and wants to dispose the
product. On basis of their effects on Human health and Environment, wastes are classified into 7
different categories, as represented in Figure 1.1 [1].
Figure 2.1 Classification of Wastes
1.1.1 Special Waste
‘Special Waste’ are a category of wastes that have unique regulatory requirements. These should
be managed in a streamlined way to minimize harm to the environment and human health. These
can be any of the following types:
Clinical and related waste
Asbestos Waste
Waste Tyres
1.1.2 Liquid Waste
For a waste to be classified as a liquid waste it must have the following characteristics:
Classification of Waste
Special Waste Liquid WasteHazardous
WasteGeneral Solid
Waste
Bio-Degradable
Waste
Non Bio-Degradable
Waste

3
Has an angle of repose less than 5 degrees above horizontal
Becomes free-flowing at below 60 0C or when it is transported
Is generally not capable of being picked up by a spade or shovel
1.1.3 Hazardous Waste
Wastes exhibiting characteristics like toxicity, corrosiveness, flammability and reactivity are
categorized under hazardous waste. European Pollution Authority (EPA) has classified hazardous
waste as:
Containers that previously contained goods that are deemed dangerous for transportation,
from which residues have not been washed or vacuumed out.
Coal tar or pitch waste.
Lead acid or nickel-cadmium batteries.
Lead paint waste from residential and educational areas
Nuclear waste.
1.1.4 General Solid Waste
General solid waste are grouped into two categories
1. Bio-degradable
2. Non Bio-degradable
Bio-degradable waste products: This is a type of waste that can be broken down by microbes or
other living organism in a reasonable amount of time. Ex: Wood, Vegetable waste.
Non Bio-degradable products: These are products which either cannot be broken down by
microbes or it takes a long duration for them to do so. Ex Plastic
1.2 Waste Tyres
Tyre consists of vulcanized rubbers (including styrene butadiene (SBR), natural rubber (NR) and
polybutadiene (BR)), carbon black, steel, textile cord and small amount of other additives [2].
They are produced in huge volumes and have a low lifespan. Durability of waste tyres is especially
low in India due to poor road conditions and harsh climate. Owing to large number of vehicles and
4
low lifespan of tyres it is estimated that 190 million tons of waste tyres are being generated each
year in India alone [2].
1.3 Methods of Waste Tyre Recycling
Waste tyres are recycled in different ways which are:
1. Retreading
2. Landfills
3. Using as construction Materials
4. Incarnations
5. Tyre Derived Fuel
Retread is a manufacturing process designed to extend the lifespan of worn out tyres. The old tread
is removed and a new tread is applied to the bare casing using specialized tools. This procedure is
regularly carried out in airplane tyres as they are worn out very frequently and the necessity for
them to be in good condition. On an average 4.5 gallons of oil is saved through this process
compared to manufacture of a new tyre. In case of commercial vehicles, the savings can go upto
12.5 gallons of oil.
Land filling is the most common way of disposing waste tyres, accounting up to 53% of the total
waste tyre generated. But it has a serious impact on land usage, fertility of land and is a potential
hazard as it is prone to fires. Tyres are very difficult to extinguish when they catch fire. Citing this
many countries have banned this form of disposal of waste tires.
Incineration and TDF are two waste to energy technologies that are available for the treatment of
waste tyres. In incineration, energy recovery systems are used to recover the energy. TDF or tyre
derived fuel the energy remains in a liquid form that can be used in combustors, IC engine etc.
The importance of finding use for waste tyres can be deduced from the fact that we produce nearly
1 billion waste tyres each year. The composition of passenger vehicle tyres is approximately 85%
carbon, 10–15% fabric materials and 0.9–1.25% sulfur. The typical percentages of the rubber mix
are 55% synthetic rubber (polybutadiene) and 45% natural rubber (latex) in passenger vehicle
tyres. Thus, the abundant organic matter (OM) contents of tyres can be converted into useful
products for energy sources. Pyrolysis is one of the methods to derive alternative fuels, in which
5
organic substances are converted into useful energy. One of the methods to derive alternative fuels
is pyrolysis in which waste substances are converted into useful energy. Pyrolysis is a thermo
chemical conversion process in which an irreversible chemical change is caused by the action of
heat in absence of oxygen. This process yields value added products such as fuels or chemicals in
the form of solid, liquid or gas. Without oxygen, the process splits the chemical bonds and leaves
the energy stored in the organic substance. The main advantages of pyrolysis include compactness,
simple equipment, low pressure operation, negligible waste product and high energy conversion
efficiency of the order of 83%.
The oil obtained after pyrolysis is termed as Tyre Pyrolysis Oil (TPO). Pyrolysis of tyres yield
liquid fuel, gases, carbon black and steel wires. Tyre Pyrolysis Oil can be directly used as fuel in
Combustors and IC engines. Although using in such systems is effective, the complex composition
poses huge challenges for use of TPO as a combustion fuel. Presence of Phenolic, Quinoline and
PAH compounds leads to high emissions and high maintenance cost.
To address the drawbacks of using TPO, in this investigation vaccum distillation technique was
used. TPO was distilled and separated in temperature ranges of 170 -190 0C, 190 -210 0C, 210 –
230 0C and 230 -270 0C. Not only this technique separated the TPO according to its composition,
but also made it a cleaner fuel by removing all the sulfur content present in TPO. Test showed that
the distillate had no sulfur content. Instead of wasting the high boiling point substances that
remained in the flask, it has been tried to be used as base stock for manufacturing lubricants.
1.4 Motivation
The aim of this research work is to make TPO a profitable fuel having varied usage. Statistics
show that only 25% of waste tyre are recycled to generate TPO. One of the major cause is high
time of recovery of invested funds and other cause is the limited use of TPO. This led to the
development of fuel processing technique that diversifies the field of use of TPO.
TPO by distillation is a very important procedure that is often looked upon. If TPO is directly used
as fuel, the presence of PAHs and aromatic compounds release many harmful anthropogenic gases
into the atmosphere. There is sulfur content present in it, which means that it is almost impossible
for the fuel to pass stringent emission standards when used in IC engines in future. By distilling it
we obtain a very clean fuel which is completely free from sulfur and PAHs. The added advantage
6
gained is that the present fuel doesn’t require oxygen rich environment for combustion. This
prevents the use of highly oxygenated fuels which give high NOx emissions. Lubricants do not
undergo combustion and seldom come in direct human exposure. So the risk of releasing harmful
toxic gases is greatly reduced compared to all other methods of disposing scrap tyres. Thus the
remains of the distillation can be used to manufacture low grade lubricants.
The research work was carried out to make TPO an environmental friendly fuel and also increase
its commercial value.

7
Chapter 2
Literature Review

8
LITERATURE REVIEW
Tyre Pyrolysis Oil is one of the product of pyrolysis of tyres. For the past 20 years it is being used
as a fuel. Researchers have successfully blended TPO with diesel to run CI engines. Researchers
have also characterized the fuel to understand the constituents present in it. Their research and
findings are listed below.
2.1 Tyre Pyrolysis Oil
Bhatt et al [2] have studied the suitability of TPO as a fuel to be used in IC engines. According to
their research about 190 million tonnes of tyres are produced each year in India alone. They
analyzed the properties of TPO and concluded that it can be used as fuel for industrial furnaces
and boilers in power plants due to their high calorific value, low ash and sulphur content. But TPO
has higher density, kinematic viscosity and lower cetane value compared to that of diesel. This
limits its use as a fuel in IC engines. They proposed to use TPO blended with diesel fuel in various
proportions by volume keeping the blend quality under permissible limits.
During early years of work, Murena et al [3] did a study on the product produced by hydrogenative
pyrolysis of waste tyres. They investigated the temperature ranges between which solid phase and
liquid phase products are formed. In order to maximize gaseous products, the temperature of the
plant was proposed to be kept at 4000C. They studied the compunds present in both phases and
also the residual char left after pyrolysis. GC-MS analysis of TPO was extensively done by Islam
et al [4]. Their report revealed that fixed bed fire-tube heating pyrolysis is a viable option for
producing the fuel. The TPO yields from such a plant has fuel properties like diesel, viscosity and
hydrogen content similar to that of diesel. For the present work TPO produced from such a setup
was taken and the properties were verified.
One of the major problems of TPO is its sulphur content. Before it can be used as a fuel the sulphur
content has to be minimized. Curmali et al [5] reported different methods of desulphurization.
They found that pyrolysis done at 5000C yielded low sulphur TPO. Their research revealed,
treating TPO with CaO, Ca(OH)2 derivatives, formic acid - H2O2 or acetic acid – H2O2 was
effective for desulphurization of TPO. In the present report, slow distillation of TPO was found
effective in desulphurization of TPO.

9
2.2 TPO as a Fuel in IC Engines
Williams et al [6] studied the compounds present in TPO along with its combustion in a ceramic
lined furnace. Their investigation revealed that TPO has PAH in high concentrations. They found
high SO2 and NOx emissions. To avoid PAH, they proposed combustion under excess oxygen
conditions. Sharma and Murugan [7] created an oxygen rich environment by blending TPO with
an oxygenated fuel i.e Jatropha Methyl Ester. They reported NOx and SO2 emissions comparable
to that of diesel when used in an IC engine. S. Murugan et al found that TPO when blended with
diesel showed anomalous combustion and performance characteristics. They reported that TPO
when blended with diesel in ratio of 30 - 40 % by volume, gives better combustion and
performance than all other blends.
Ramaswamy et al [8], in their research work tested that CI engines can run upto 90% distilled TPO
blend, above which the engine fails becomes dysfunctional. They carried out distillation <2000C
which the kerosene range. Findings of their research showed higher smoke, HC emissions but
lower NOx emissions compared to that of diesel when used to run a DI diesel engine.
Studies carried out on aromatic fuel have shown that they give lower performance and higher
emission compared to that of diesel fuel. They are low cetane fuel with longer ignition delay. In a
special case, when aromatic compounds are connected with long chain alkanes, have good cetane
numbers compared to other aromatic compounds [9]. Pioneering work carried out by Kidoguchi
et al [10] provide effect of cetane number and aromatic content of a fuel on combustion and
emission characteristics of an IC engine. They have reported that:
Keeping aromatic content constant, decreasing the cetane number increases NOx
emissions and decreases particulate emissions.
With increase in aromatic content both NOx and particulate emission increases.
Other surveys included patent search on lubricating oil and distillation products of crude oil. The
present work relates TPO distillation products with that of distillation products of crude oil. From
these surveys it was concluded that many have worked on characteristics on TPO and it being used
as a fuel. But the focus has not been on studying the combustion process and also on improving
TPO as a source from which valuable products can be derived
10
Chapter 3
PROPERTIES AND
CHARACTERIZATION

11
PROPERTIES AND CHARACTERIZATION
3.1 General
Pyrolysis is a thermo-chemical conversion process in which an irreversible chemical change
caused by the action of heat in absence of oxygen [11]. Tyre is composed of 85% Carbon, 10 –
15% fabric material and 0.9-1.25% Sulphur [2]. Pyrolysis of tyres yeilds products like [12] :
1. Fuel Oil – (40 – 45 %)
2. Carbon Black – (30 – 35%)
3. Steel Wire – (3 – 5%)
4. Non Condensable Gases – (8 – 10%)
5. Moisture – (3 - 5%)
The Tyre Pyrolysis Oil obtained is a blackish liquid with pungent odour. In an unrefined state it
contains small particulate carbon suspended in the liquid medium.
3.2 Production of Tyre Pyrolysis Oil
Tyre Pyrolysis Oil used for this research work was obtained from a pilot plant located in the city
of Rourkela. The schematic illustration of the plant is given in Figure 3.1. The plant is a rotary
type, pyrolysis reactor. The dimensions of the reactor is approximately 6.6 m in length, diameter
is 2.8 m and has a capacity of 10 tons per batch. The reactor is rotated with the help of electrical
motors. Initially it is fired up with waste wood and then coal is used to keep it burning. In the plant,
shredded tyres are fed into the reactor. The front end of the reactor has a door with fasteners and
can be opened or closed by unlocking or locking the fasteners respectively. The other end of the
reactor is connected to a sealing element and a flexible connection. The volatile vapour which is
formed during pyrolysis pass through the oil separator where heavy oil is separated by gravity and
collected in an oil tank. A damper is provided at the outlet of the oil separator that connects to a
series of water cooled pipes. The volatile gases pass through these condenser pipes where the light
fractions are converted into liquid. A cooling tower is used to bring the temperature of coolant near
atmospheric temperature. The whole setup and its accessories are operated by motor and pumps
with the help of a control panel. The initial temperature at which volatile vapour evolve is 1600C.
During the process, carbon black and steel wires are also generated.
12
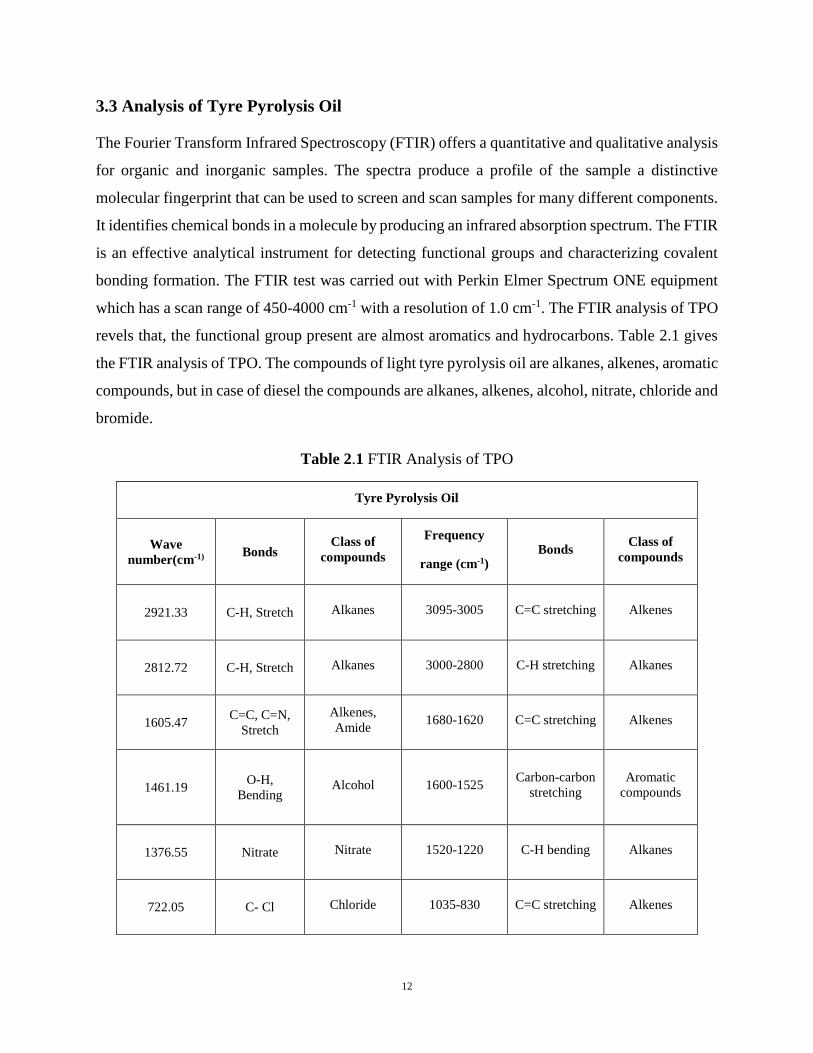
3.3 Analysis of Tyre Pyrolysis Oil
The Fourier Transform Infrared Spectroscopy (FTIR) offers a quantitative and qualitative analysis
for organic and inorganic samples. The spectra produce a profile of the sample a distinctive
molecular fingerprint that can be used to screen and scan samples for many different components.
It identifies chemical bonds in a molecule by producing an infrared absorption spectrum. The FTIR
is an effective analytical instrument for detecting functional groups and characterizing covalent
bonding formation. The FTIR test was carried out with Perkin Elmer Spectrum ONE equipment
which has a scan range of 450-4000 cm-1 with a resolution of 1.0 cm-1. The FTIR analysis of TPO
revels that, the functional group present are almost aromatics and hydrocarbons. Table 2.1 gives
the FTIR analysis of TPO. The compounds of light tyre pyrolysis oil are alkanes, alkenes, aromatic
compounds, but in case of diesel the compounds are alkanes, alkenes, alcohol, nitrate, chloride and
bromide.
Table 2.1 FTIR Analysis of TPO
Tyre Pyrolysis Oil
Wave
number(cm-1) Bonds Class of
compounds
Frequency
range (cm-1) Bonds
Class of
compounds
2921.33 C-H, Stretch Alkanes 3095-3005 C=C stretching Alkenes
2812.72 C-H, Stretch Alkanes 3000-2800 C-H stretching Alkanes
1605.47 C=C, C=N,
Stretch
Alkenes,
Amide 1680-1620 C=C stretching Alkenes
1461.19 O-H,
Bending Alcohol 1600-1525
Carbon-carbon
stretching
Aromatic
compounds
1376.55 Nitrate Nitrate 1520-1220 C-H bending Alkanes
722.05 C- Cl Chloride 1035-830 C=C stretching Alkenes

13
3.4 GC-MS Analysis of TPO
The Gas chromatography (“GC”) and mass spectrometry (“MS”) make an effective combination
for chemical analysis. Gas chromatography (GC) is used to separate mixtures into individual
components using a temperature-controlled capillary column. Smaller molecules with lower
boiling points are travel down the column more quickly than larger molecules with higher boiling
point. The mass spectrometry (MS) is used to identify the various components from their mass
spectra. Each compound has a unique or near unique mass spectrum that can be compared with
mass spectral databases and thus identified. Through use of standards, quantification is also
possible. The compounds detected in TPO by GC-MS analysis is given in Table 2.2.
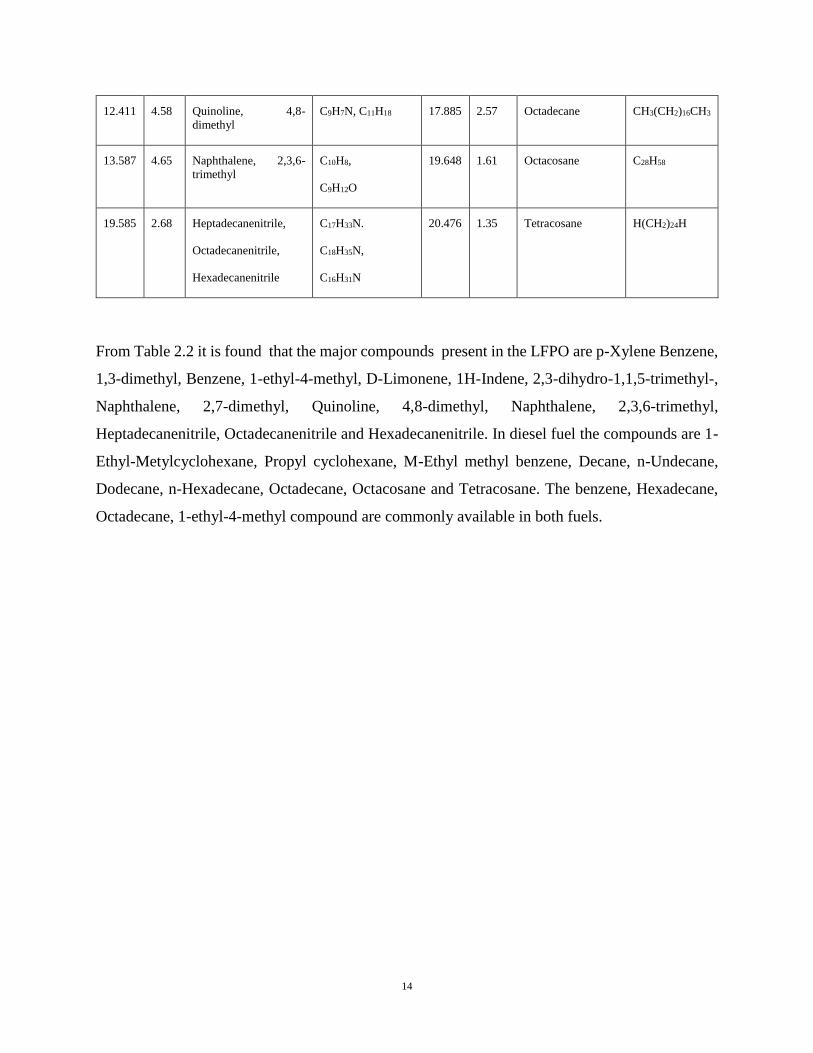
Table 2.2 GC-MS Analysis of major compounds present in TPO
GC-MS Analysis of TPO
R.
time
Area
(%)
Name of compound Molecular
formula
R.
time
Area
(%)
Name of
compound
Molecular
formula
3.290 4.85 p-Xylene Benzene, 1,3-
dimethyl-
C8H10 or
C6H4(CH3)2,
C10H14
3.065 0.98 1-Ethyl-
Metylcyclohexane
C9H18
4.859 6.24 Benzene,
C9H12 3.359 1.06 Propyl cyclohexane C6H11CH2-
CH2CH3
5.236 2.17 Benzonitrile C6H5CN 3.782 1.04 M-Ethyl methyl
benzene
C9H12
5.962 15.24 Benzene, 1,2,3,4-
tetramethyl, o-Cymene
C20H26O,
CH3C6H4CH(CH3)2
4.274 3.51 Decane C10H22
6.035 5.19 D-Limonene C10H16 5.822 2.14 n-Undecane C11H24
10.45 2.19 1H-Indene, 2,3-
dihydro-1,1,5-
trimethyl-
C9H8 7.356 2.71 Dodecane CH3(CH2)10CH3
12.207 3.77 Naphthalene, 2,7-
dimethyl
C10H8,
C10H6(CH3)2
15.959 3.38 n-Hexadecane CH3
(CH2)14 CH3
14
12.411 4.58 Quinoline, 4,8-
dimethyl
C9H7N, C11H18 17.885 2.57 Octadecane CH3(CH2)16CH3
13.587 4.65 Naphthalene, 2,3,6-
trimethyl
C10H8,
C9H12O
19.648 1.61 Octacosane C28H58
19.585 2.68 Heptadecanenitrile,
Octadecanenitrile,
Hexadecanenitrile
C17H33N.
C18H35N,
C16H31N
20.476 1.35 Tetracosane H(CH2)24H
From Table 2.2 it is found that the major compounds present in the LFPO are p-Xylene Benzene,
1,3-dimethyl, Benzene, 1-ethyl-4-methyl, D-Limonene, 1H-Indene, 2,3-dihydro-1,1,5-trimethyl-,
Naphthalene, 2,7-dimethyl, Quinoline, 4,8-dimethyl, Naphthalene, 2,3,6-trimethyl,
Heptadecanenitrile, Octadecanenitrile and Hexadecanenitrile. In diesel fuel the compounds are 1-
Ethyl-Metylcyclohexane, Propyl cyclohexane, M-Ethyl methyl benzene, Decane, n-Undecane,
Dodecane, n-Hexadecane, Octadecane, Octacosane and Tetracosane. The benzene, Hexadecane,
Octadecane, 1-ethyl-4-methyl compound are commonly available in both fuels.
15
Chapter 4
Experimental Setup
and Methodology
16
4. EXPERIMENTAL SETUP AND METHODOLOGY
4.1 General
All the experimental setups and instruments used will be discussed in this section. The procedure
followed to grade the oil will be conversed about. All the setups are mentioned in chronological
order of their usage. The significance of combustion, performance and emission parameters
calculated will also be elaborated.
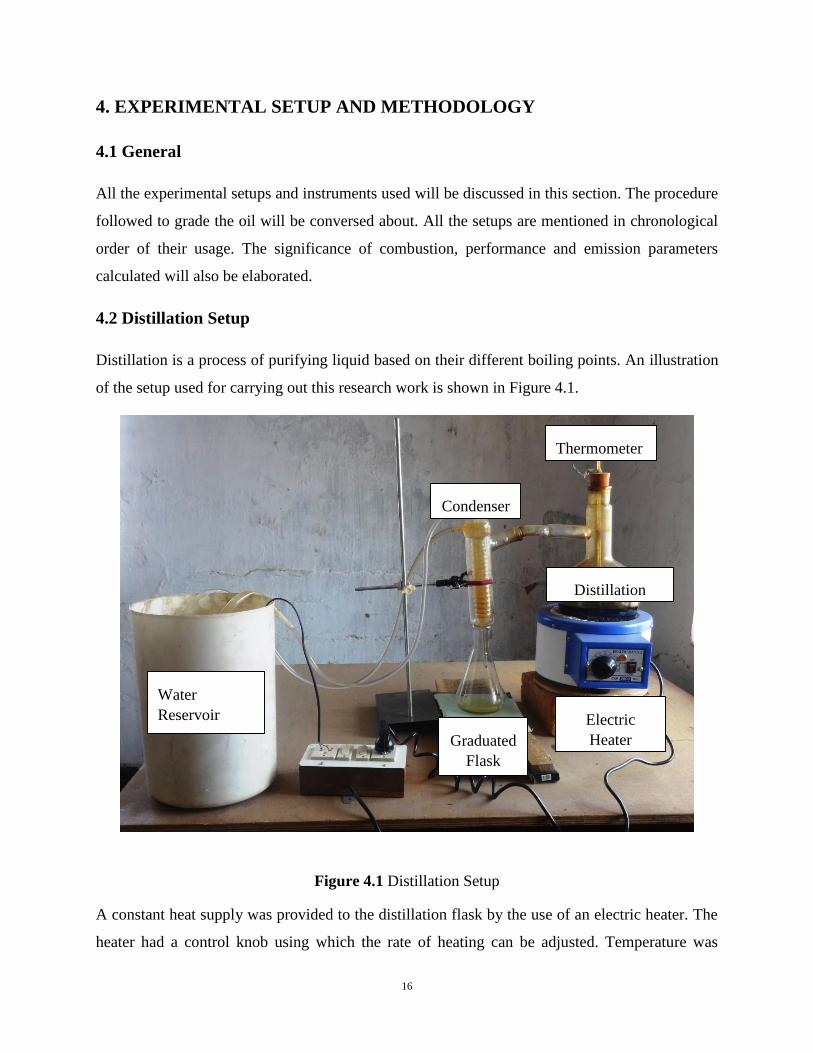
4.2 Distillation Setup
Distillation is a process of purifying liquid based on their different boiling points. An illustration
of the setup used for carrying out this research work is shown in Figure 4.1.
Figure 4.1 Distillation Setup
A constant heat supply was provided to the distillation flask by the use of an electric heater. The
heater had a control knob using which the rate of heating can be adjusted. Temperature was
Electric
Heater
Distillation
Thermometer
Condenser
Graduated
Flask
Water
Reservoir

17
measured using a thermometer which had a range from 00C to 3600C. The vaporized liquid passes
through a water cooled condenser and collected in a flask. The process of fractionating the liquid
according to temperature was done manually. A pump was used to maintain constant flow of water
into the condenser.
A constant heat supply was provided to the distillation flask by the use of an electric heater. The
heater had a control knob using which the rate of heating can be adjusted. Temperature was
measured using a mercury thermometer which had a range from 00C to 3600C. The vaporized
liquid passes through a water cooled condenser and collected in a flask. The process of
fractionating the liquid according to temperature was done manually. A pump was used to maintain
constant flow of water into the condenser.
4.3 Engine Experimental Setup
For this experimental work a single cylinder, 4 stroke, air cooled, DI diesel engine was used.
The specification of the engine are given in Table 4.1.
Table 4.1 Details of Test Engine
Make/model Kirloskar TAF 1
Brake power (kW) 4.4
Rated speed (rpm) 1500
Bore (mm) 87.5
Piston type Bowl-in-piston
Compression ratio 17.5:1
Nozzle opening pressure (bar) 200
Injection type 23 BTDC
Cooling System Air cooling

18
The engine has stroke length of 87.5mm and piston diameter of 55mm. It piston is bowl in type
piston. An internal view of the engine is given in Figure 4.2.
Figure 4.2 Engine Experimental Setup
An electrical dynamometer connected to a resistive load bank, was used to load the engine. The
fuel measuring system consisted of a burette fitted with two optical proximity sensors, one at the
top and other at the bottom. As the fuel passed through the higher level optical sensor, the sensor
gave a signal to the data acquisition system (DAS) to start the counter. Once the fuel reached the
lower level sensor, the sensor gave a signal to the DAS to stop the counter time and refill the
burette. From this, the time taken for the consumption of fuel for a fixed volume was calculated.
A differential pressure sensor fitted in the air box measures the air consumption. The differential
pressure sensor was used to measure the pressure difference between the orifice plates. The
Smoke meter Gas analyzer
Diesel engine
Alternator
Computer
19
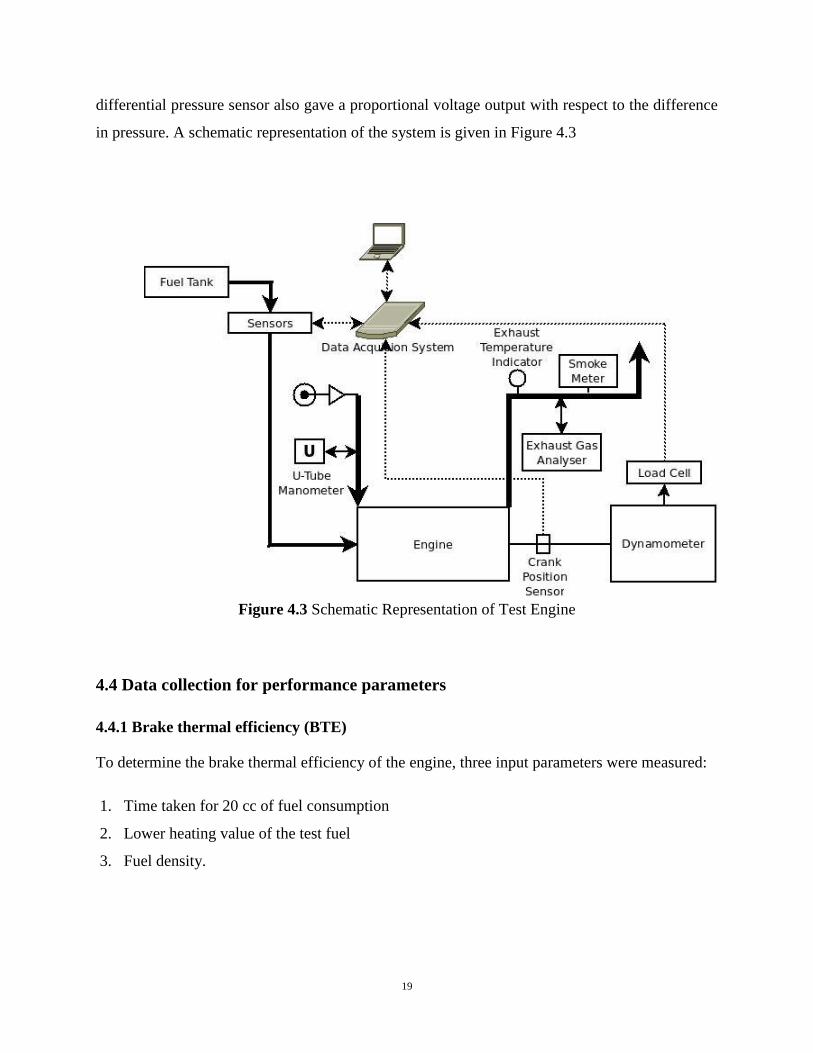
differential pressure sensor also gave a proportional voltage output with respect to the difference
in pressure. A schematic representation of the system is given in Figure 4.3
Figure 4.3 Schematic Representation of Test Engine
4.4 Data collection for performance parameters
4.4.1 Brake thermal efficiency (BTE)
To determine the brake thermal efficiency of the engine, three input parameters were measured:
1. Time taken for 20 cc of fuel consumption
2. Lower heating value of the test fuel
3. Fuel density.
20
Brake Thermal Efficiency (BTE) can be calculated as:
BTE = (brake power x 3600 x 100/ (volumetric fuel flow rate per hour x fuel density x
calorific value of fuel)). (4.1)
4.4.2 Brake specific Energy consumption (BSEC)
To determine the brake specific fuel consumption the formula used is:
BSEC = (Calorific value of fuel x volumetric fuel flow rate per hour x fuel density/brake power)
(4.2)
The BTE and BSEC were displayed in the form of excel sheet generated by the data acquisition
system software (Engine test express) using the above mentioned expressions.
4.5 Engine Parameters measurement Devices
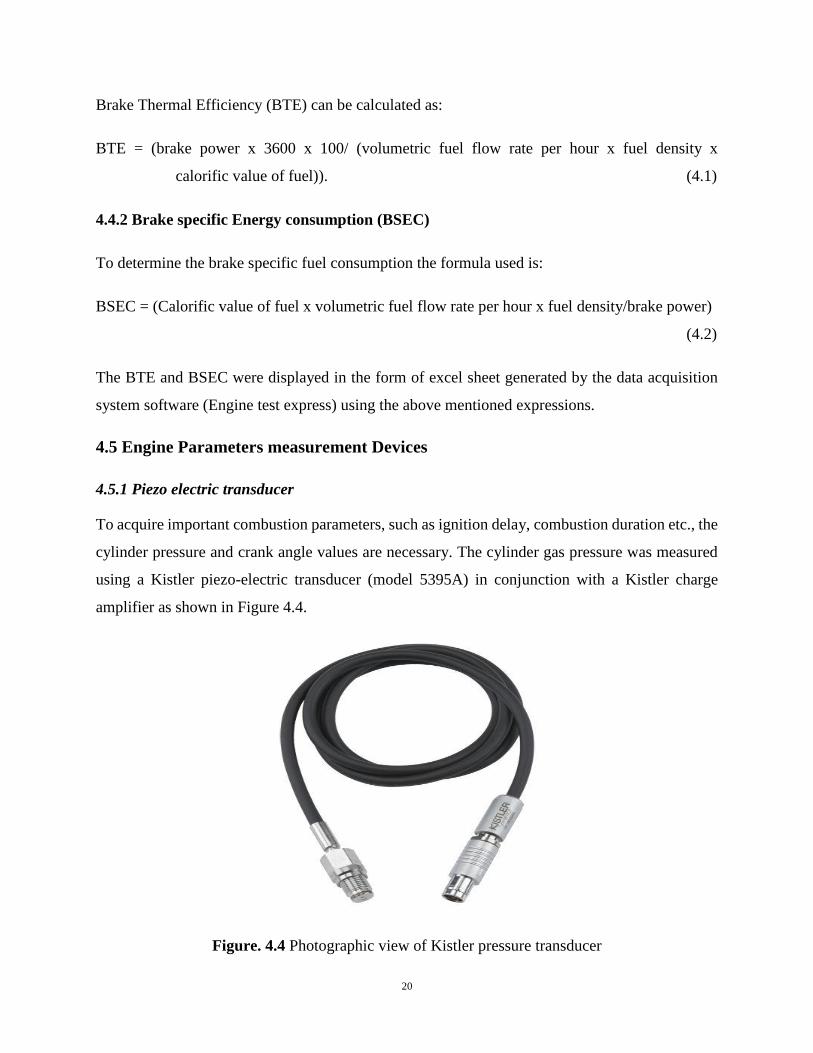
4.5.1 Piezo electric transducer
To acquire important combustion parameters, such as ignition delay, combustion duration etc., the
cylinder pressure and crank angle values are necessary. The cylinder gas pressure was measured
using a Kistler piezo-electric transducer (model 5395A) in conjunction with a Kistler charge
amplifier as shown in Figure 4.4.
Figure. 4.4 Photographic view of Kistler pressure transducer

21
The cylinder gas pressure data was recorded as the average of 20 cycles of data, with a resolution
of 0.5°CA using a data acquisition system. These data were averaged over that period, recorded in
excel sheet and parameters like pressure vs crank angle values, the peak pressure, occurrence of
the peak pressure, maximum rate of pressure rise, and heat release rate were calculated.
The TDC marker (Kistler model 5015A1000) was placed near the engine flywheel. At the TDC
position, a small metallic deflector was fitted. The setup was aligned in such a way that the sensor
gives out a square wave output, exactly when the piston is at the TDC.
4.5.2 Proximity Sensors
Proximity Sensors were used to measure fuel flow rate. It measures the time gap between 20 ml
of fuel consumed. Two sensors are placed at the ends of a graduated tube. It notes the time when
the fuel column passes through each of the sensors. After the column has passed the lower sensor
the system is reset to take the next set of data. All the readings are sent to the Data Acquisition
System.
4.5.3 Analog to Digital Converter
The analog signals from the sensors were fed into the Analog to Digital Converter (ADC) and then
passed to the display unit, through the data acquisition cord and microcontroller. The analog
signals were converted into digital using the ADC, which was finally fed to a display unit through
the data acquisition system. Using the data acquisition system graphical analysis, evaluating the
differential equation, computing the mathematical expression, display, control and recording were
done for various engine operating parameters, like instantaneous pressure, crank angle,
temperature, and the heat release rate. From this other combustion parameters such as ignition
delay, cumulative heat release rate, mass fraction burned and combustion duration were computed.
A computer was used to process and store the data during investigation.
4.5.4 Gas Analyzer
The exhaust gas sample was analysed by a 5 Gas analyzer (Make: AVL India, Model: 444) fitted
with a DiGas sampler, conforming to ARAI certification: ARAI/TA(4G-RV)/AVL/DiGas
444/0910-12. The principle for measuring the CO, HC, CO2 emissions was the NDIR (non-
dispersive infrared), and for the NO and O2, it was electrochemical. The CO, CO2, O2 emissions
22
were measured in volume percentage, while the total unburnt hydrocarbon TUHC was measured
in ppm (vol.) of n-hexane equivalent, and the NO emission was measured in ppm (vol.) during
each run of the engine operation.
4.5.5 Smoke Analyzer
The smoke emission was measured by a partial-flow sampling AVL (Austria) 437 diesel smoke
meter, certified by ARAI, Pune, India, as per ARAI/TA(SM-RV)/AVL/437/1011-02. It is based
on loss of light intensity due to smoke generated and reported as %age opacity based on beer
lambert’s law.
4.6 Research Methodology
The distillation was carried out during night time scheduled 5 pm – 11 pm. The procedure was
carried out in two phases.
In the first phase the following temperature ranges were chosen:
1. 190 - 210 0C
2. 210 - 230 0C
3. 230 - 250 0C
These were done on the basis of quantity of distillate obtained, which was negligible below the
specified range. Study was done on the fuel properties of the three distillates obtained.
In the second phase the temperature range were based on crude oil distillation ranges. The three
ranges which were chosen are:
1. 140 - 200 0C (Below 140 no liquid was obtained)
2. 200 - 270 0C
3. Above 270
These ranges represent kerosene range, diesel range and lubricating oil range respectively. Each
cycle was carried out for 6 hours in which 1.5 litres (capacity of distillation flask) of TPO was
distilled. The fractionating of distillate was done manually by observing the temperature in the
thermometer. A constant heat supply of 40 watt was supplied continuously to the distillation flask
using an electric heater. Temperatures were checked manually and the fractions were taken out
23
from the collection flask at the desired temperature points. During the distillation process it was
observed that at temperature range of 175-1800C there was great turmoil in the distillation flask.
This may be due to the falling of cold condensate on the flask walls falling into the hot TPO. To
avoid overflow of the hot TPO the heating rate was reduced to 20 Watt once 1700C was reached.
The distillates were sent to labs for analysis. Based on those properties different usage of the
distillates were found.
The distillate in diesel range was selected and blended with diesel in proportions (20%, 40% and
60%). These blends were used to run a single cylinder, 4 stroke, air cooled, DI diesel engine. The
combustion, performance and emission parameters were recorded and compared to that of diesel.
All data collected from the engine were stored in a computer in excel sheet. Graphs were drawn to
study and analyze combustion, performance and emission parameters.

24
Chapter 5
Results and
Discussions
25
RESULTS AND DISCUSSION
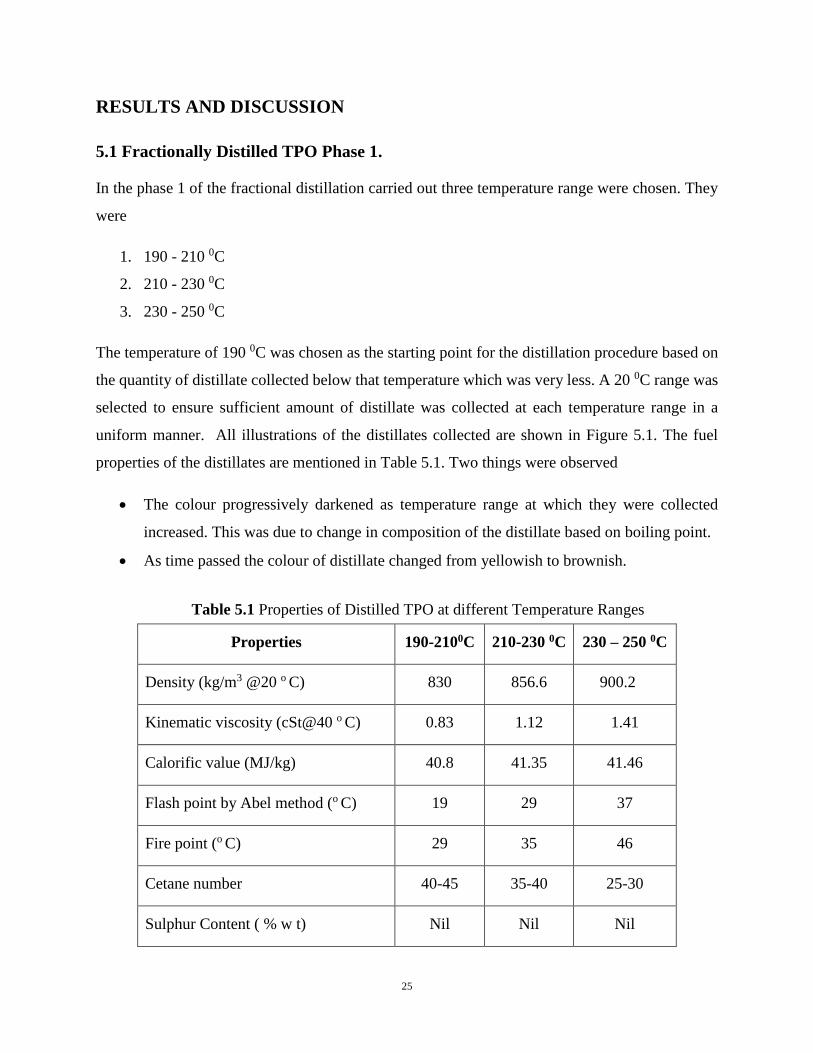
5.1 Fractionally Distilled TPO Phase 1.
In the phase 1 of the fractional distillation carried out three temperature range were chosen. They
were
1. 190 - 210 0C
2. 210 - 230 0C
3. 230 - 250 0C
The temperature of 190 0C was chosen as the starting point for the distillation procedure based on
the quantity of distillate collected below that temperature which was very less. A 20 0C range was
selected to ensure sufficient amount of distillate was collected at each temperature range in a
uniform manner. All illustrations of the distillates collected are shown in Figure 5.1. The fuel
properties of the distillates are mentioned in Table 5.1. Two things were observed
The colour progressively darkened as temperature range at which they were collected
increased. This was due to change in composition of the distillate based on boiling point.
As time passed the colour of distillate changed from yellowish to brownish.
Table 5.1 Properties of Distilled TPO at different Temperature Ranges
Properties 190-2100C 210-230 0C 230 – 250 0C
Density (kg/m3 @20 o C) 830 856.6 900.2
Kinematic viscosity (cSt@40 o C) 0.83 1.12 1.41
Calorific value (MJ/kg) 40.8 41.35 41.46
Flash point by Abel method (o C) 19 29 37
Fire point (o C) 29 35 46
Cetane number 40-45 35-40 25-30
Sulphur Content ( % w t) Nil Nil Nil

26
Figure 5.1 Image of Fractionally Distilled Tyre Pyrolysis Oil
27
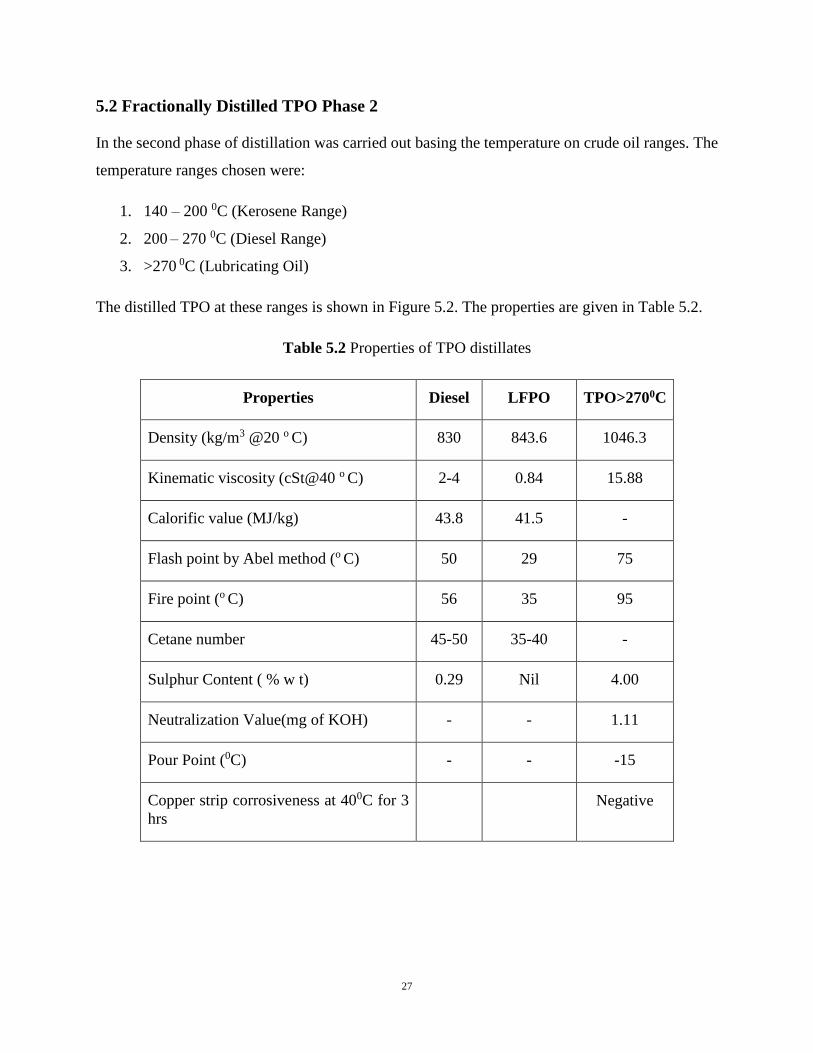
5.2 Fractionally Distilled TPO Phase 2
In the second phase of distillation was carried out basing the temperature on crude oil ranges. The
temperature ranges chosen were:
1. 140 – 200 0C (Kerosene Range)
2. 200 – 270 0C (Diesel Range)
3. >270 0C (Lubricating Oil)
The distilled TPO at these ranges is shown in Figure 5.2. The properties are given in Table 5.2.
Table 5.2 Properties of TPO distillates
Properties Diesel LFPO TPO>2700C
Density (kg/m3 @20 o C) 830 843.6 1046.3
Kinematic viscosity (cSt@40 o C) 2-4 0.84 15.88
Calorific value (MJ/kg) 43.8 41.5 -
Flash point by Abel method (o C) 50 29 75
Fire point (o C) 56 35 95
Cetane number 45-50 35-40 -
Sulphur Content ( % w t) 0.29 Nil 4.00
Neutralization Value(mg of KOH) - - 1.11
Pour Point (0C) - - -15
Copper strip corrosiveness at 400C for 3
hrs
Negative
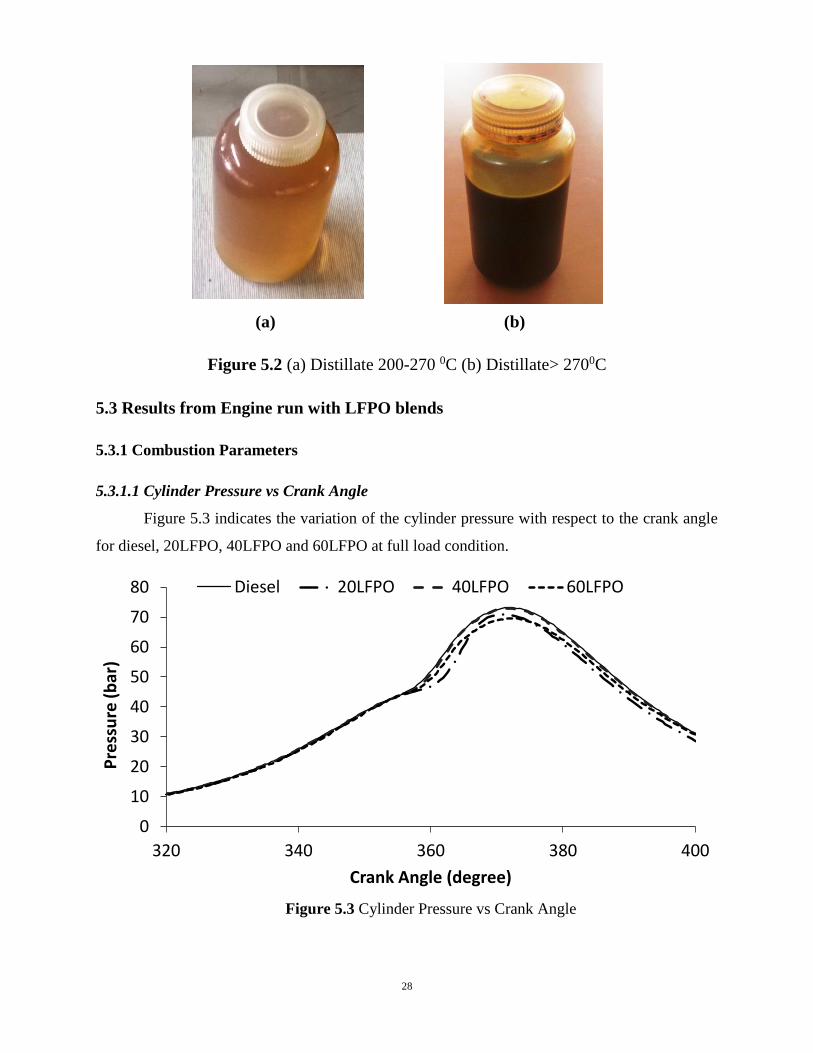
28
(a) (b)
Figure 5.2 (a) Distillate 200-270 0C (b) Distillate> 2700C
5.3 Results from Engine run with LFPO blends
5.3.1 Combustion Parameters
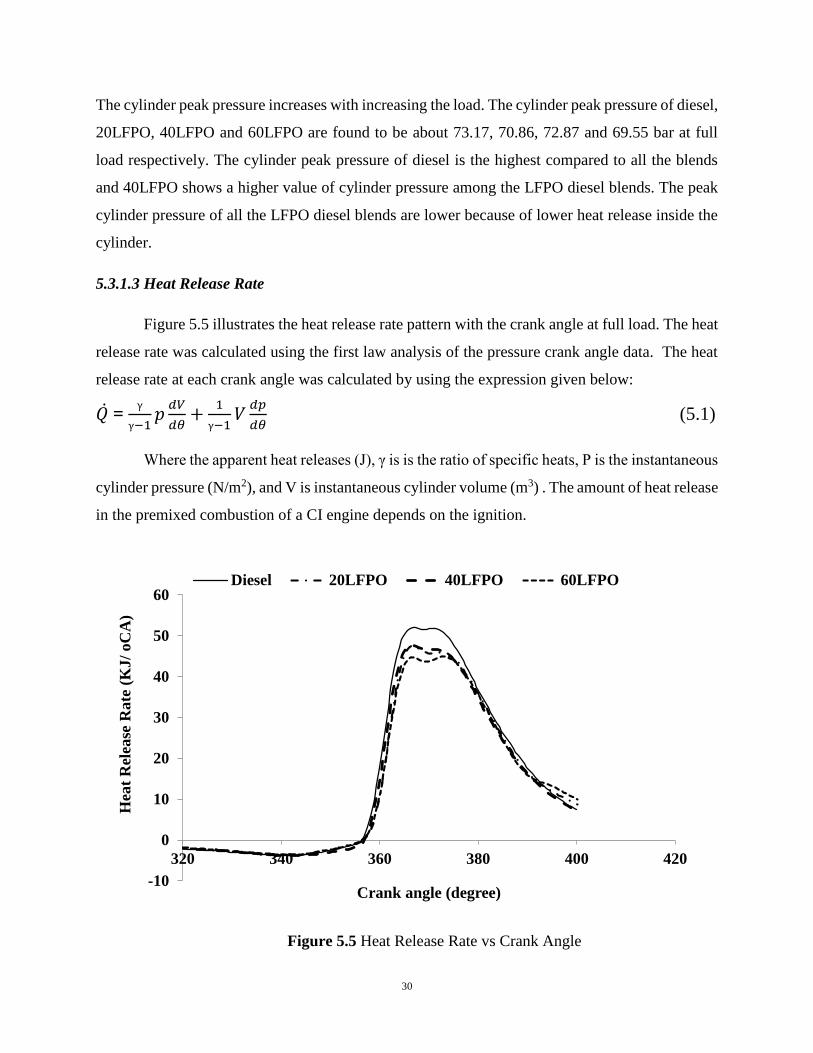
5.3.1.1 Cylinder Pressure vs Crank Angle
Figure 5.3 indicates the variation of the cylinder pressure with respect to the crank angle
for diesel, 20LFPO, 40LFPO and 60LFPO at full load condition.
Figure 5.3 Cylinder Pressure vs Crank Angle
0
10
20
30
40
50
60
70
80
320 340 360 380 400
Pre
ssu
re (
bar
)
Crank Angle (degree)
Diesel 20LFPO 40LFPO 60LFPO

29
The start of fuel injection (SOI) is set at 230 bTDC. It is observed from the figure 5.3, that the
combustion starts later by about 0.4230CA, 0.360CA and 0.420CA for 20LFPO, 40LFPO and
60LFPO respectively, compared to that of diesel at full load. Combustion starts later for LFPO-
diesel blends may be due to poor ignition quality and higher density of LFPO-diesel bends.
This is one of the most important graphs for combustion analysis. The pressure inside the cylinder
depends on factors like: combustion, heat transfer rate, crevice region, instantaneous cylinder
volume and leakage. The significance of this graph, also known as the p-θ diagram, are as follows:
It indicates the process occurring near the TDC clearly.
Gives information about instantaneous pressure at each crank angle degree.
Gives the peak cylinder pressure, rate of pressure rise and maximum rate of pressure rise.
Quantitatively defines the combustion process.
Heat release rate, ignition delay, combustion duration, mass fraction burnt and gas
condition for pollutant formation can be inferred from this diagram.
5.3.1.2 Cylinder Peak Pressure
Figure 5.4 shows the variation of the cylinder peak pressure at different values of brake power.
Figure 5.4. Cylinder Peak Pressure vs Brake Power
0
10
20
30
40
50
60
70
80
0 1.1 2.2 3.3 4.4
Cyli
nd
er P
eak
Pre
ssu
re (
bar)
Brake Power (kW)
Diesel 20LFPO 40LFPO 60LFPO
30
The cylinder peak pressure increases with increasing the load. The cylinder peak pressure of diesel,
20LFPO, 40LFPO and 60LFPO are found to be about 73.17, 70.86, 72.87 and 69.55 bar at full
load respectively. The cylinder peak pressure of diesel is the highest compared to all the blends
and 40LFPO shows a higher value of cylinder pressure among the LFPO diesel blends. The peak
cylinder pressure of all the LFPO diesel blends are lower because of lower heat release inside the
cylinder.
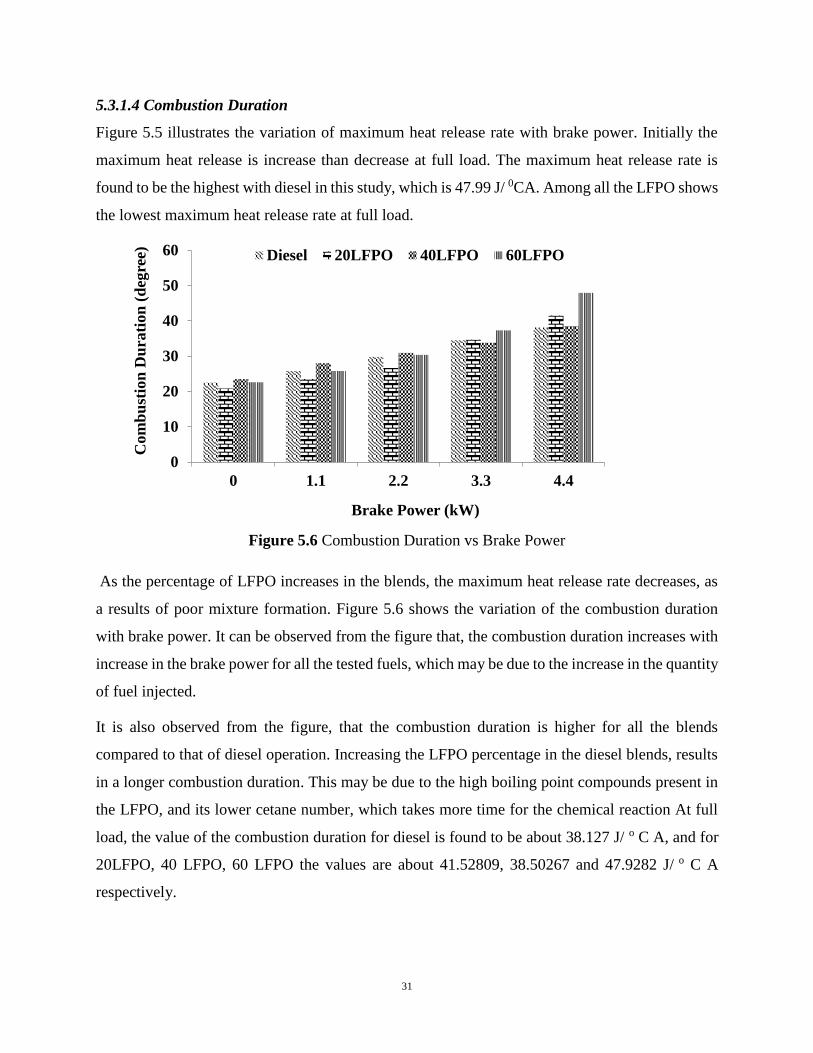
5.3.1.3 Heat Release Rate
Figure 5.5 illustrates the heat release rate pattern with the crank angle at full load. The heat
release rate was calculated using the first law analysis of the pressure crank angle data. The heat
release rate at each crank angle was calculated by using the expression given below:
𝑄 ̇ = γ
γ−1𝑝
𝑑𝑉
𝑑𝜃+
1
γ−1𝑉
𝑑𝑝
𝑑𝜃 (5.1)
Where the apparent heat releases (J), γ is is the ratio of specific heats, P is the instantaneous
cylinder pressure (N/m2), and V is instantaneous cylinder volume (m3) . The amount of heat release
in the premixed combustion of a CI engine depends on the ignition.
Figure 5.5 Heat Release Rate vs Crank Angle
-10
0
10
20
30
40
50
60
320 340 360 380 400 420
Hea
t R
elea
se R
ate
(K
J/
oC
A)
Crank angle (degree)
Diesel 20LFPO 40LFPO 60LFPO
31
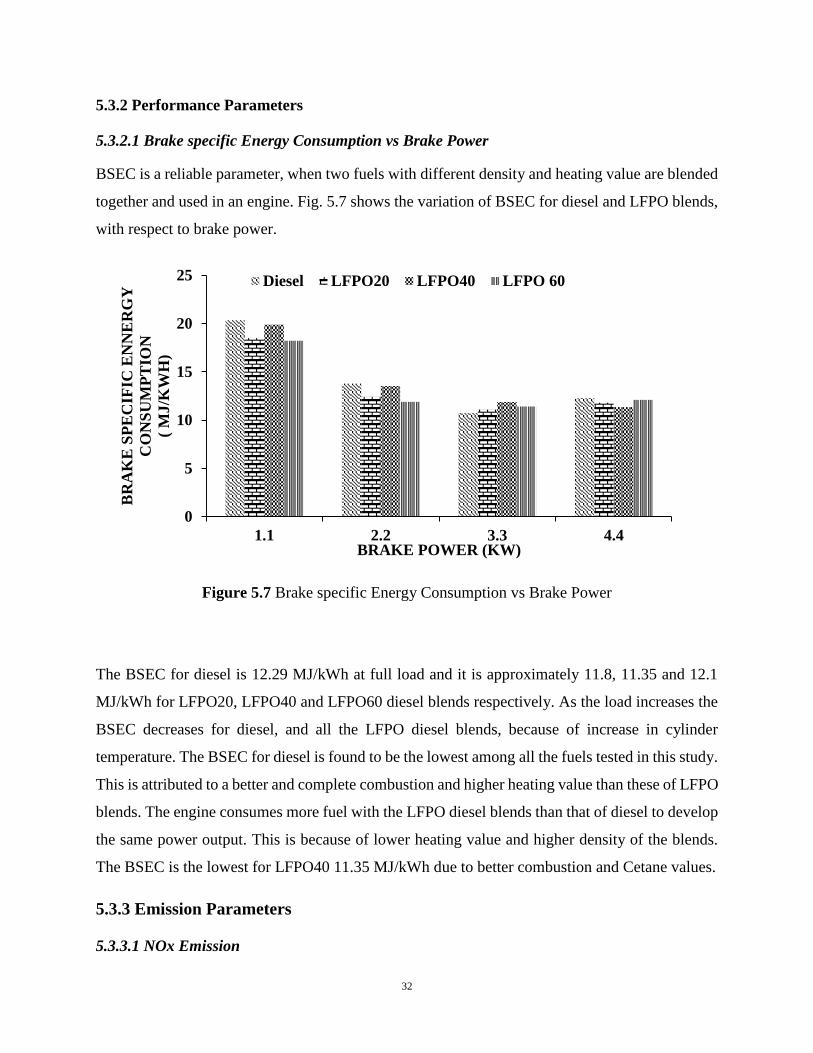
5.3.1.4 Combustion Duration
Figure 5.5 illustrates the variation of maximum heat release rate with brake power. Initially the
maximum heat release is increase than decrease at full load. The maximum heat release rate is
found to be the highest with diesel in this study, which is 47.99 J/ 0CA. Among all the LFPO shows
the lowest maximum heat release rate at full load.
Figure 5.6 Combustion Duration vs Brake Power
As the percentage of LFPO increases in the blends, the maximum heat release rate decreases, as
a results of poor mixture formation. Figure 5.6 shows the variation of the combustion duration
with brake power. It can be observed from the figure that, the combustion duration increases with
increase in the brake power for all the tested fuels, which may be due to the increase in the quantity
of fuel injected.
It is also observed from the figure, that the combustion duration is higher for all the blends
compared to that of diesel operation. Increasing the LFPO percentage in the diesel blends, results
in a longer combustion duration. This may be due to the high boiling point compounds present in
the LFPO, and its lower cetane number, which takes more time for the chemical reaction At full
load, the value of the combustion duration for diesel is found to be about 38.127 J/ o C A, and for
20LFPO, 40 LFPO, 60 LFPO the values are about 41.52809, 38.50267 and 47.9282 J/ o C A
respectively.
0
10
20
30
40
50
60
0 1.1 2.2 3.3 4.4
Com
bu
stio
n D
ura
tion
(d
egre
e)
Brake Power (kW)
Diesel 20LFPO 40LFPO 60LFPO
32
5.3.2 Performance Parameters
5.3.2.1 Brake specific Energy Consumption vs Brake Power
BSEC is a reliable parameter, when two fuels with different density and heating value are blended
together and used in an engine. Fig. 5.7 shows the variation of BSEC for diesel and LFPO blends,
with respect to brake power.
Figure 5.7 Brake specific Energy Consumption vs Brake Power
The BSEC for diesel is 12.29 MJ/kWh at full load and it is approximately 11.8, 11.35 and 12.1
MJ/kWh for LFPO20, LFPO40 and LFPO60 diesel blends respectively. As the load increases the
BSEC decreases for diesel, and all the LFPO diesel blends, because of increase in cylinder
temperature. The BSEC for diesel is found to be the lowest among all the fuels tested in this study.
This is attributed to a better and complete combustion and higher heating value than these of LFPO
blends. The engine consumes more fuel with the LFPO diesel blends than that of diesel to develop
the same power output. This is because of lower heating value and higher density of the blends.
The BSEC is the lowest for LFPO40 11.35 MJ/kWh due to better combustion and Cetane values.
5.3.3 Emission Parameters
5.3.3.1 NOx Emission
0
5
10
15
20
25
1.1 2.2 3.3 4.4
BR
AK
E S
PE
CIF
IC E
NN
ER
GY
CO
NS
UM
PT
ION
( M
J/K
WH
)
BRAKE POWER (KW)
Diesel LFPO20 LFPO40 LFPO 60

33
The parameter affecting formations of NOx in a CI engine are the combustion duration,
temperature, higher compression ratio, pressure and the availability of oxygen. Figure. 5.8 depicts
the variation of NO emission with brake power for diesel and the LFPO diesel blends.
Figure 5.8 NO emission vs Brake Power
The NO emission per kWh for diesel and all the LFPO diesel blends decrease as the load increases.
The value of NO emission is found to be the highest for diesel at full load among all the fuels
tested in this study. This may be due to higher heating value and complete combustion than the all
given blends. The value of NO emission higher for diesel is 1.290 g/kWh at full load. While
increasing the LFPO percentage, the NO emission decreases.
5.3.3.2 Smoke Opacity
Smoke occurs due to the incomplete combustion inside the combustion chamber, and normally
formed in the rich zone. Figure.5.9. illustrates the smoke emission measured in the engine exhaust,
for the fuels tested in this study.
With the increase in load, the air fuel ratio decreases as the amount of fuel injected increases, and
hence results in higher smoke. The smoke emission for diesel is found to be the lowest at full load
among all the fuels in this study. The LFPO has high density and viscosity, so high smoke emission
0
1
2
3
4
5
6
1.1 2.2 3.3 4.4
NO
(g/k
Wh
)
Brake Power (kW)
Diesel LFPO20 LFPO40 60LFPO
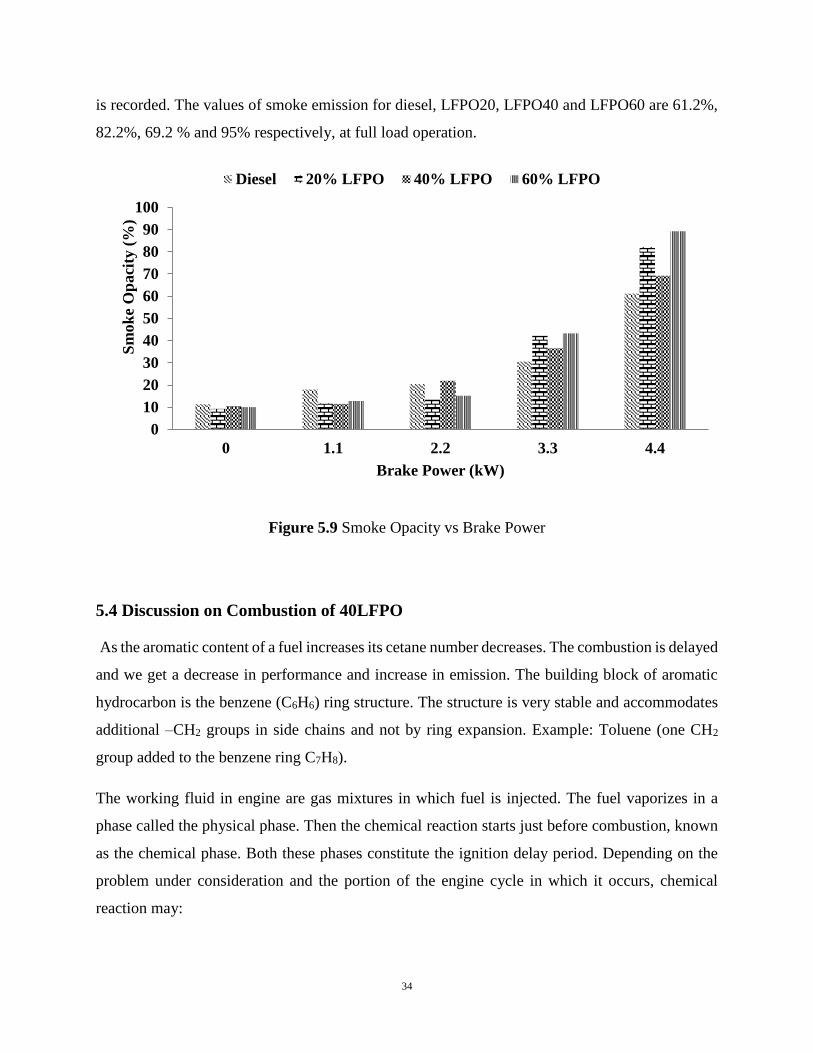
34
is recorded. The values of smoke emission for diesel, LFPO20, LFPO40 and LFPO60 are 61.2%,
82.2%, 69.2 % and 95% respectively, at full load operation.
Figure 5.9 Smoke Opacity vs Brake Power
5.4 Discussion on Combustion of 40LFPO
As the aromatic content of a fuel increases its cetane number decreases. The combustion is delayed
and we get a decrease in performance and increase in emission. The building block of aromatic
hydrocarbon is the benzene (C6H6) ring structure. The structure is very stable and accommodates
additional –CH2 groups in side chains and not by ring expansion. Example: Toluene (one CH2
group added to the benzene ring C7H8).
The working fluid in engine are gas mixtures in which fuel is injected. The fuel vaporizes in a
phase called the physical phase. Then the chemical reaction starts just before combustion, known
as the chemical phase. Both these phases constitute the ignition delay period. Depending on the
problem under consideration and the portion of the engine cycle in which it occurs, chemical
reaction may:
0
10
20
30
40
50
60
70
80
90
100
0 1.1 2.2 3.3 4.4
Sm
ok
e O
paci
ty (
%)
Brake Power (kW)
Diesel 20% LFPO 40% LFPO 60% LFPO

35
1. Be so slow that they have a negligible effect on mixture composition (the mixture
composition is essentially frozen)
2. Be so rapid that the mixture state changes and the composition remains in chemical
equilibrium.
3. Be one of the rate controlling processes that determine how the composition of the mixture
changes with time.
There is a special case when the aromatic content of a fuel can increase the Cetane number. It
happens when an aromatic ring is connected to a long chain alkyl group. The reaction of this alkyl
group provides sufficient energy to break the aromatic ring releasing large amount of energy. The
increase in the aromatic content with increase in proportion of LFPO the kinetics of reaction favors
alkyl aromatics formation for 40LFPO and 60LFPO and gives rise to the following situations:
• At low fraction (20LFPO) blends Cetane number remains constant with increase in
aromatic content.
• At medium fraction (40LFPO) blends Cetane number is improved due to condensation of
aromatics with long chained alkanes.
• At higher fraction (60 LFPO) blends Cetane number decreases along with increase in
aromatic content.
Thus in 40LFPO we get better performance and emissions compared to 20LFPO and 60LFPO
blends.
5.5 Discussion on 40LFPO as a fuel
Based on combustion, performance and emission characteristics of the three blends of
LFPO (20, 40 and 60) it was found that 40LFPO gave the best results. All data obtained for
40LFPO were close to that of diesel. It satisfies the emission standards required. Thus it is a new
blend of fuel that can be used to run a DI diesel Engine.

36
5.6 Discussion on TPO distillate collected <2700C
Properties like pour point, neutralization point, flash point, corrosiveness and Kinematic
viscosity were checked to find out if it can be used as base oil for manufacture of lubricants. The
distillate is non corrosive and has high kinematic viscosity. A low pour point of -150C ensures that
it can flow at very low temperatures also. All these properties correspond to the properties of base
oil used for lubricants. The down side of this oil being used as base oil rest on the fact that it has
high aromatic content which is undesirable.
37
CONCLUSION
The results obtained show the high potential of tyre pyrolysis oil of being used in various fields.
The different grades of oil obtained after distillation increases its commercial value. But the focus
of this report is on its environmental impact. Although some TPO plants have come up, only 20 –
25% of scrap tyres are being recycled by this process. Making the production of TPO more
lucrative, will result in more percentage of scrap tyres recycled in this manner. As a result scrap
tyres won’t be disposed of into the environment in form of landfills or wastes; rather they will be
properly processed and converted to useful products. The fact that pyrolysis of waste tyres is
considered to be a useful solution to protect the environment, it can also be made cost-effective.
Fractionating the TPO by distillation is a very important procedure that is often overlooked. If
TPO is directly used as a fuel, the presence of PAHs and aromatic compounds release many
harmful anthropogenic gases into the atmosphere. The sulfur content present in it means that it is
almost impossible for the fuel to pass stringent emission standards when used in IC engines in
future. By distilling it we obtain a very clean fuel which is completely free from sulfur and PAHs.
Lubricants don’t undergo combustion and seldom come to direct human exposure. So the risk of
releasing harmful toxic gases is greatly reduced compared to all other methods of disposing scrap
tyres. Thus the remains of the distillation can be used to manufacture low grade lubricants.
There were some new findings related to the combustion of TPO and the anomalous results its
blends with diesel fuel give. Theoretical studies on combustion helped immensely to solve this
problem. Formation of alkyl aromatics during combustion improves combustion due to which
40LFPO gives better combustion and emission characteristics compared to other fuel blends.
Future Work
The basic work done in fractionating the TPO,
• Improving the fuel created – 40 LFPO.
• Using the liquid fractions and gases collected in the kerosene range to power up stoves
and lights.
• Manufacturing a Lubricating Oil from TPO as feedstock.
• Modifying Engine Parameters to match the properties of 40 LFPO.

38
REFERENCES
[1] "Wikipedia," [Online]. Available: http://en.wikipedia.org/wiki/EPA
[2] P. M. Bhatt and P. D. Patel, "Suitability of Tyre Pyrolysis Oil as an Alternative Fuel for Internal Combustion
Engine," International Journal of Advanced Engineering Research and Studies, vol. 1, no. 4, pp. 61-65, 2012.
[3] M. Murena, E. Garufi, R. B. Smith and F. Gioia, "Hydrogenative Pyrolysis of Waste Tires," Journal of Hazardous
Material, vol. 50, pp. 79-98, 1996.
[4] M. R. Islam, M. Praveen and H. Hanui, "Innovation in Pyrolysis Technology for Management of Scrap Tire: A
Solution of Energy and Environment," Internationa Journal of Environmental Science and Development, vol.
1, pp. 264-271, 2010.
[5] I. Cumali and A. Huseyin, "Fuel Production from Waste Vehicle Tires by Catalytic Pyrolysis and its Application
in a Diesel Engine," Fuel Processing Technology, vol. 92, pp. 1129-1135, 2011.
[6] P. T. williams, B. P. Bottrill and A. M. Cunliffe, "Combustion of Tyre Pyrolysis Oil," Institution of Chemical
Engineers, vol. 76, pp. 957-963, 1998.
[7] A. Sharma and S. Murugan, "Investigation on the behaviour of a DI Diesel Engine Fueled with Jatropha Methyl
Ester (JME) and Tyre Pyrolysis Oil (TPO) blends," Fuel, vol. 108, pp. 699-708, 2013.
[8] S. Murugan, M. C. Ramaswamy and G. Nagarajan, "Performance, Emission and Combustion studies of a DI
Diesel Engine using Distilled Tyre Pyrolysis Oil-Diesel Blends," Fuel Processing Technology, vol. 89, pp. 152-
159, 2008.
[9] Heywood, Internal Combustion Engine Fundamenta's, New Delhi: McGraw Hill Education, 2013.
[10] Y. Kidoguchi, C. Yang and R. Kato, "E!ects of Fuel Cetane Number and Aromatics on Combustion Process and
Emissions of a direct-injection Diesel Engine," Society of Automotive Engineers, vol. 21, pp. 469-475, 2000.
[11] "Wikipedia," [Online]. Available: http://en.wikipedia.org/wiki/Pyrolysis.
[12] A. I. Rushdi, A. Y. BaZeyad, A. S. Al-Awadi and K. F. Al-Mutlaq, "Chemical Characteristics of Oil-like Products
from Hydrous Pyrolysis of Scrap Tires at Temperatures 150-400," Fuel, pp. 578-584, 2013.