failure modes and effects criticality analysis and ... · the failure modes and effects criticality...
TRANSCRIPT
ISDRS 2011, December 7-9, 2011, College Park, MD, USA
ISDRS 2011 – http://www.ece.umd.edu/ISDRS2011
Student Paper
Failure Modes and Effects Criticality Analysis and Accelerated Life Testing of LEDs for Medical Applications
M. Sawanta and A. Christoua
aUniversity of Maryland, Mechanical Engineering Department, Reliability Engineering Program,
College Park MD USA, [email protected]
While use of LEDs in fiber optics and lighting applications is common, their use in medical diagnostic applications is not very extensive. Since the precise value of light intensity will be used to interpret patient results, understanding failure modes [1-4] is very important. We used the Failure Modes and Effects Criticality Analysis (FMECA) tool to identify the critical failure modes. FMECA involves identification of various failure modes, their effects on the system (LED optical output in this context), their frequency of occurrence, severity and the criticality of the failure modes. The competing failure modes/mechanisms were degradation of: active layer (where electron-hole recombination occurs to emit light), electrodes (provides electrical contact to the semiconductor chip), Indium Tin Oxide (ITO) surface layer (used to improve current spreading & light extraction), plastic encapsulation (protective polymer layer) and packaging failures (bond wires, heat sink separation). A FMECA table is constructed and the criticality is calculated by estimating the failure effect probability (β), failure mode ratio (α), failure rate (λ) and the operating time. Once the critical failure modes were identified, the next steps were generation of prior time to failure distribution and comparing with our accelerated life test data. To generate the prior distributions, data and results from previous investigations were utilized [5-33] where reliability test results of similar LEDs were reported. From the graphs or tabular data, we extracted the time required for the optical power output to reach 80% of its initial value. This is our failure criterion for the medical diagnostic application. Analysis of published data for different LED materials (AlGaInP, GaN, AlGaAs), the Semiconductor Structures (DH, MQW) and the mode of testing (DC, Pulsed) was carried out. The data was categorized according to the materials system and LED structure such as AlGaInP-DH-DC, AlGaInP-MQW-DC, GaN-DH-DC, GaN-DH-DC etc. Although the reported testing was carried out at different temperature and current, the reported data was converted to the present application conditions of the medical environment. Comparisons between the model data and accelerated test results carried out in the present are reported. The use of accelerating agent modeling and regression analysis was also carried out. We have used the Inverse Power Law model with the current density J as the accelerating agent and the Arrhenius model with temperature as the accelerating agent. Finally, our reported methodology is presented as an approach for analyzing LED suitability for the target medical diagnostic applications. Keywords: FMECA, LED, Medical application, Accelerated Life Testing
ISDRS 2011, December 7-9, 2011, College Park, MD, USA
ISDRS 2011 – http://www.ece.umd.edu/ISDRS2011
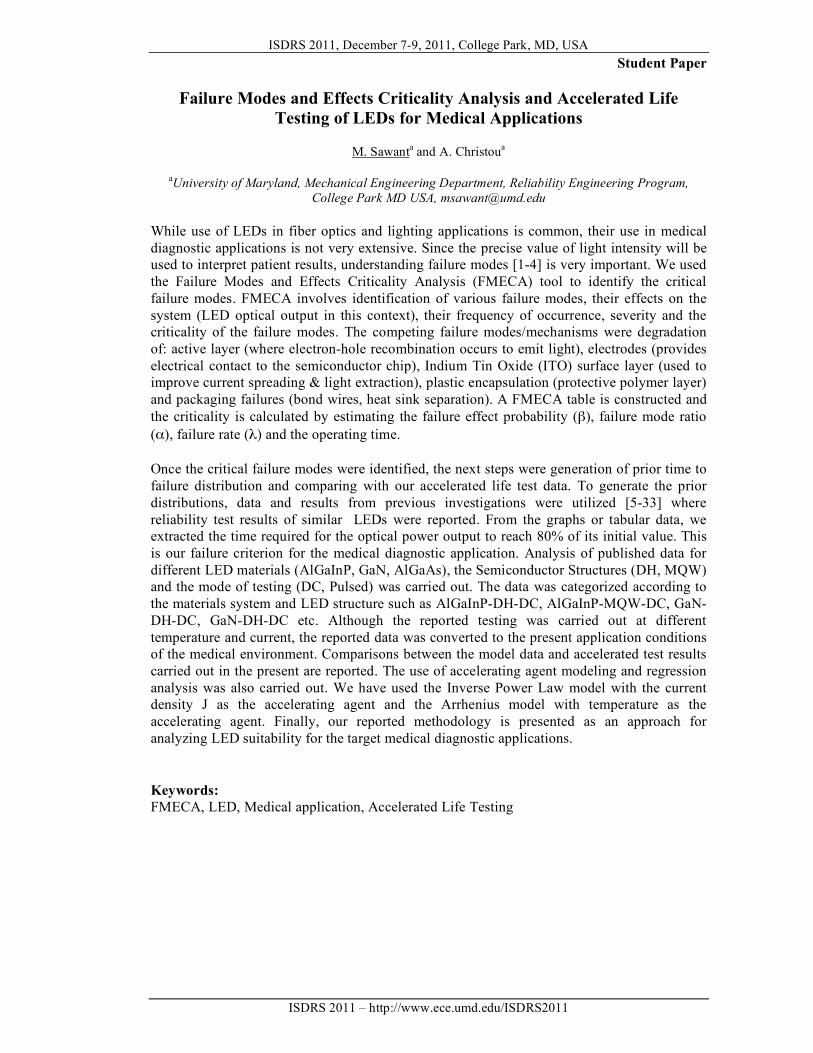
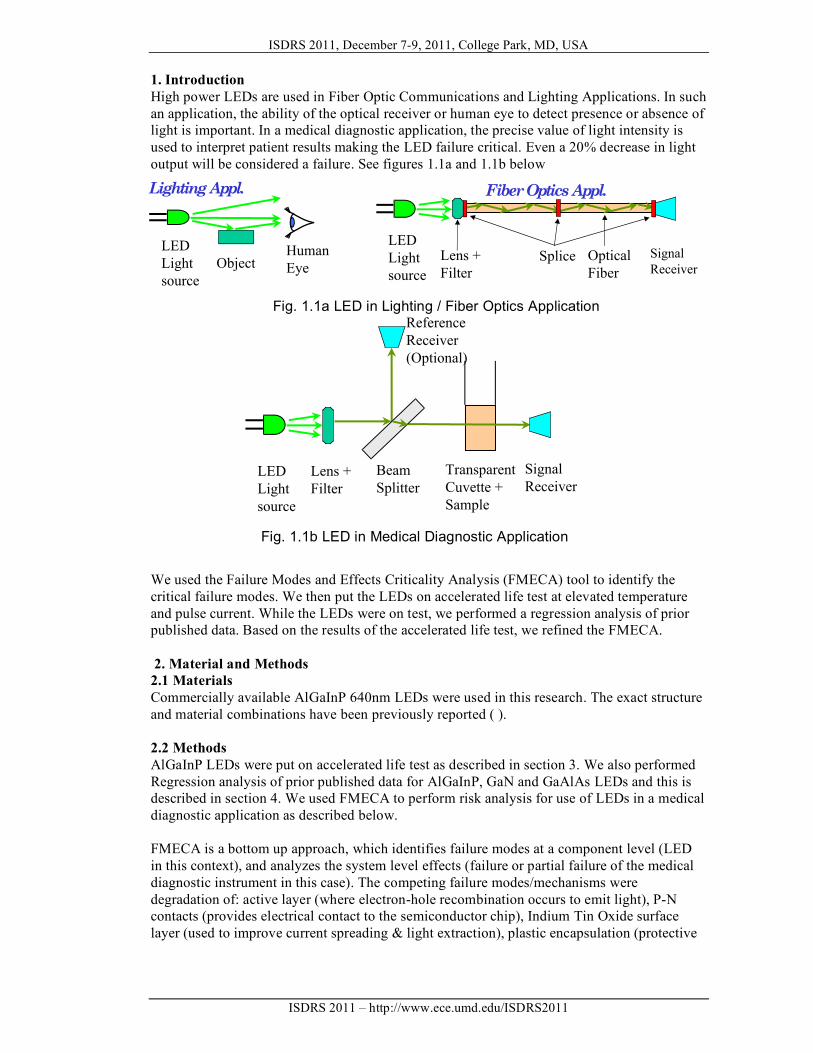
1. Introduction High power LEDs are used in Fiber Optic Communications and Lighting Applications. In such an application, the ability of the optical receiver or human eye to detect presence or absence of light is important. In a medical diagnostic application, the precise value of light intensity is used to interpret patient results making the LED failure critical. Even a 20% decrease in light output will be considered a failure. See figures 1.1a and 1.1b below
We used the Failure Modes and Effects Criticality Analysis (FMECA) tool to identify the critical failure modes. We then put the LEDs on accelerated life test at elevated temperature and pulse current. While the LEDs were on test, we performed a regression analysis of prior published data. Based on the results of the accelerated life test, we refined the FMECA. 2. Material and Methods 2.1 Materials Commercially available AlGaInP 640nm LEDs were used in this research. The exact structure and material combinations have been previously reported ( ). 2.2 Methods AlGaInP LEDs were put on accelerated life test as described in section 3. We also performed Regression analysis of prior published data for AlGaInP, GaN and GaAlAs LEDs and this is described in section 4. We used FMECA to perform risk analysis for use of LEDs in a medical diagnostic application as described below. FMECA is a bottom up approach, which identifies failure modes at a component level (LED in this context), and analyzes the system level effects (failure or partial failure of the medical diagnostic instrument in this case). The competing failure modes/mechanisms were degradation of: active layer (where electron-hole recombination occurs to emit light), P-N contacts (provides electrical contact to the semiconductor chip), Indium Tin Oxide surface layer (used to improve current spreading & light extraction), plastic encapsulation (protective
LED
Light
source
Human
EyeObject
Lighting Appl. Fiber Optics Appl.
LED
Light
source
Lens +
Filter
Splice Signal
ReceiverOptical
Fiber
Fig. 1.1a LED in Lighting / Fiber Optics Application
LED
Light
source
Lens +
Filter
Beam
Splitter
Transparent
Cuvette +
Sample
Signal
Receiver
Reference
Receiver
(Optional)
Fig. 1.1b LED in Medical Diagnostic Application
ISDRS 2011, December 7-9, 2011, College Park, MD, USA
ISDRS 2011 – http://www.ece.umd.edu/ISDRS2011
polymer layer) and packaging failures (bond wires, heat sink separation). A FMECA table is constructed and the criticality is calculated by estimating the failure effect probability (β), failure mode ratio (α), failure rate (λ) and the operating time (t). Criticality is given by equation (1) shown below:
Cm = βαλt (1)
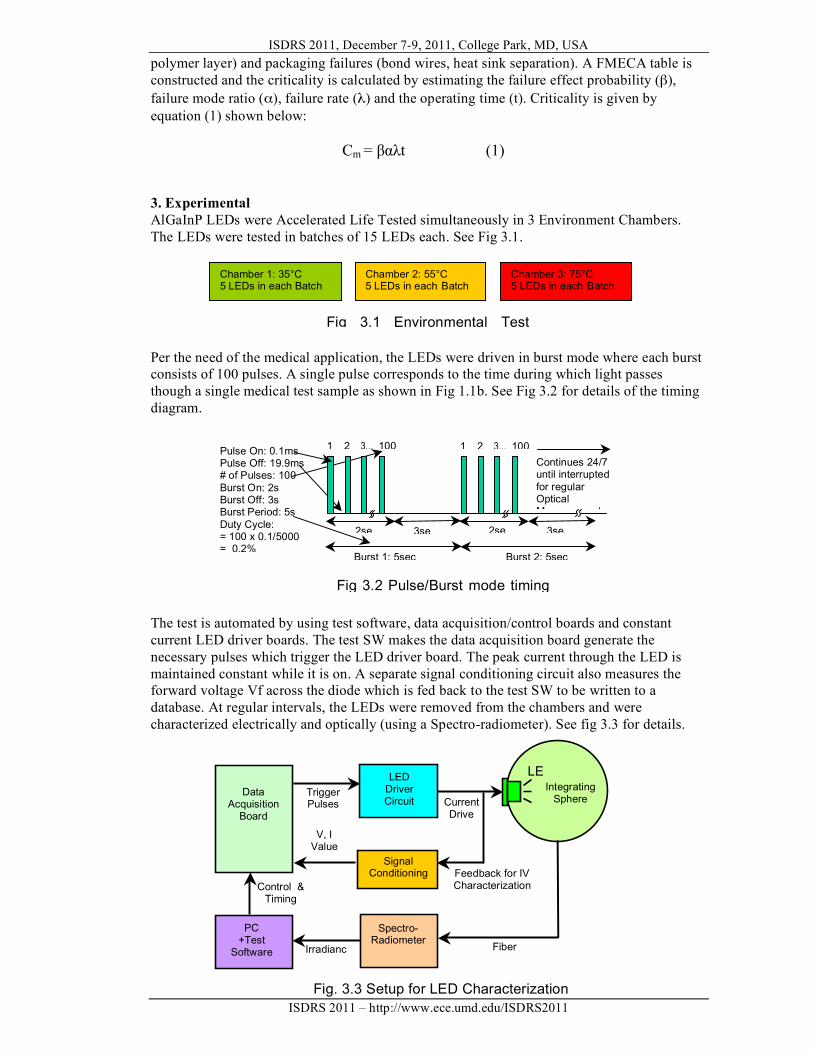
3. Experimental AlGaInP LEDs were Accelerated Life Tested simultaneously in 3 Environment Chambers. The LEDs were tested in batches of 15 LEDs each. See Fig 3.1.
Per the need of the medical application, the LEDs were driven in burst mode where each burst consists of 100 pulses. A single pulse corresponds to the time during which light passes though a single medical test sample as shown in Fig 1.1b. See Fig 3.2 for details of the timing diagram.
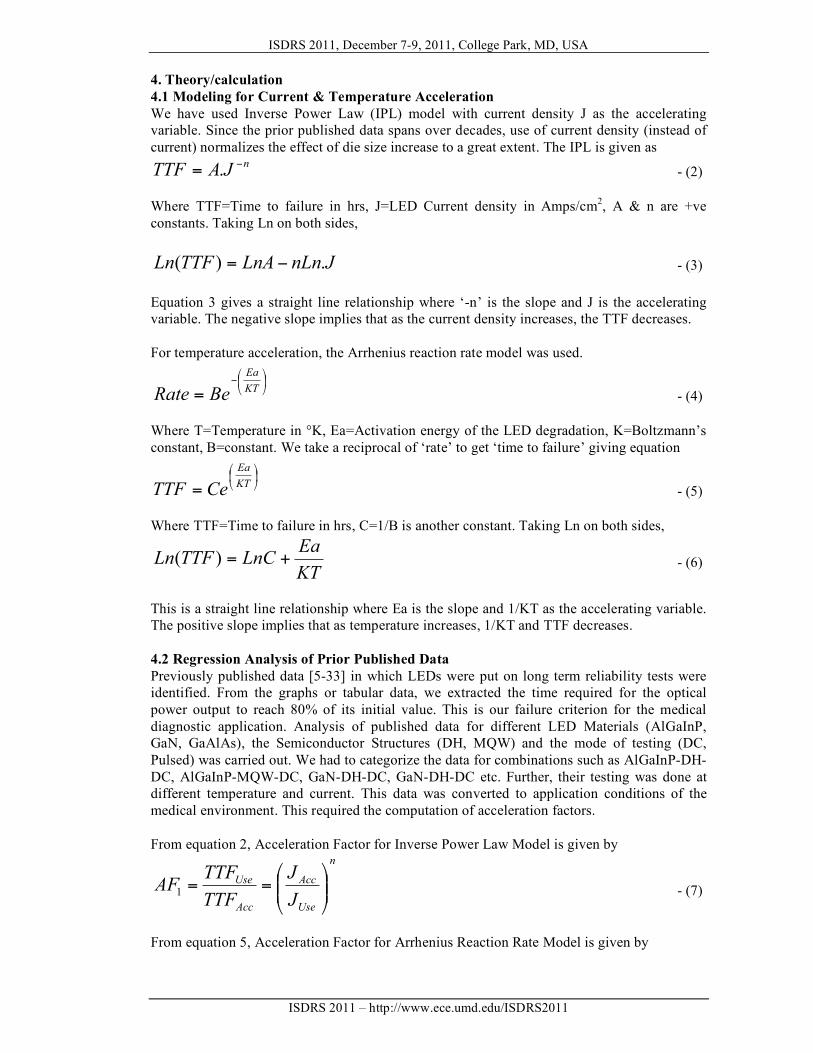
The test is automated by using test software, data acquisition/control boards and constant current LED driver boards. The test SW makes the data acquisition board generate the necessary pulses which trigger the LED driver board. The peak current through the LED is maintained constant while it is on. A separate signal conditioning circuit also measures the forward voltage Vf across the diode which is fed back to the test SW to be written to a database. At regular intervals, the LEDs were removed from the chambers and were characterized electrically and optically (using a Spectro-radiometer). See fig 3.3 for details.
Chamber 1: 35°C 5 LEDs in each Batch
Chamber 2: 55°C 5 LEDs in each Batch
Chamber 3: 75°C 5 LEDs in each Batch
Fig 3.1 Environmental Test Conditions
2sec
3sec
Burst 1: 5sec Burst 2: 5sec
Continues 24/7 until interrupted for regular Optical Measurements
1 2 100 3...
Fig 3.2 Pulse/Burst mode timing diagram
Pulse On: 0.1ms Pulse Off: 19.9ms # of Pulses: 100 Burst On: 2s Burst Off: 3s Burst Period: 5s Duty Cycle: = 100 x 0.1/5000 = 0.2%
1 2 100 3...
2sec
3sec
Fig. 3.3 Setup for LED Characterization
Current Drive
Integrating Sphere
Feedback for IV Characterization Control &
Timing
Irradiance
Fiber
PC +Test
Software
Spectro- Radiometer
Signal Conditioning
LED Data
Acquisition Board
Trigger Pulses
V, I Value
LED Driver Circuit
ISDRS 2011, December 7-9, 2011, College Park, MD, USA
ISDRS 2011 – http://www.ece.umd.edu/ISDRS2011
4. Theory/calculation 4.1 Modeling for Current & Temperature Acceleration We have used Inverse Power Law (IPL) model with current density J as the accelerating variable. Since the prior published data spans over decades, use of current density (instead of current) normalizes the effect of die size increase to a great extent. The IPL is given as
nJATTF!
= . - (2) Where TTF=Time to failure in hrs, J=LED Current density in Amps/cm2, A & n are +ve constants. Taking Ln on both sides,
JnLnLnATTFLn .)( != - (3) Equation 3 gives a straight line relationship where ‘-n’ is the slope and J is the accelerating variable. The negative slope implies that as the current density increases, the TTF decreases. For temperature acceleration, the Arrhenius reaction rate model was used.
!"
#$%
&'
= KT
Ea
BeRate - (4) Where T=Temperature in °K, Ea=Activation energy of the LED degradation, K=Boltzmann’s constant, B=constant. We take a reciprocal of ‘rate’ to get ‘time to failure’ giving equation
!"
#$%
&
= KT
Ea
CeTTF - (5) Where TTF=Time to failure in hrs, C=1/B is another constant. Taking Ln on both sides,
KT
EaLnCTTFLn +=)( - (6)
This is a straight line relationship where Ea is the slope and 1/KT as the accelerating variable. The positive slope implies that as temperature increases, 1/KT and TTF decreases. 4.2 Regression Analysis of Prior Published Data Previously published data [5-33] in which LEDs were put on long term reliability tests were identified. From the graphs or tabular data, we extracted the time required for the optical power output to reach 80% of its initial value. This is our failure criterion for the medical diagnostic application. Analysis of published data for different LED Materials (AlGaInP, GaN, GaAlAs), the Semiconductor Structures (DH, MQW) and the mode of testing (DC, Pulsed) was carried out. We had to categorize the data for combinations such as AlGaInP-DH-DC, AlGaInP-MQW-DC, GaN-DH-DC, GaN-DH-DC etc. Further, their testing was done at different temperature and current. This data was converted to application conditions of the medical environment. This required the computation of acceleration factors. From equation 2, Acceleration Factor for Inverse Power Law Model is given by
n
Use
Acc
Acc
Use
J
J
TTF
TTFAF !!
"
#$$%
&==
1 - (7)
From equation 5, Acceleration Factor for Arrhenius Reaction Rate Model is given by
ISDRS 2011, December 7-9, 2011, College Park, MD, USA
ISDRS 2011 – http://www.ece.umd.edu/ISDRS2011
!!"
#$$%
&'
== AccUseTTK
Ea
Acc
Usee
TTF
TTFAF
11
2 - (8)
We used the Ea value provided/estimated from the published article or assumed it (0.43eV based on MIL-HDBK-217C). Ea would be the same for same LED data in a specific article. Similarly, if any article had data at different J (but same temperature), we estimated the n value. For all other articles, where Ea or n was unavailable, we used iterative regression as follows. Using equation 8, we converted all TTF data to use Temperature TUse. We used linear regression for equation 3 to estimate n. Using this ‘n’ value and equation 7, we now re-converted all TTF data to use current density Juse. We now used linear regression for equation 6 to improve our estimate of Ea. It is quickly evident that normalizing the data for temperature, affects the regression analysis for n and normalizing the data for current density, affects the regression analysis of Ea. Thus an iterative approach was used to get best possible regression fits thereby accommodating the effects of both current density and temperature. Overall Acceleration Factor is given by
!!"
#$$%
&'
!!"
#$$%
&== AccUse
TTK
Ean
Use
Acce
J
JxAFAFAF
11
21 - (9)
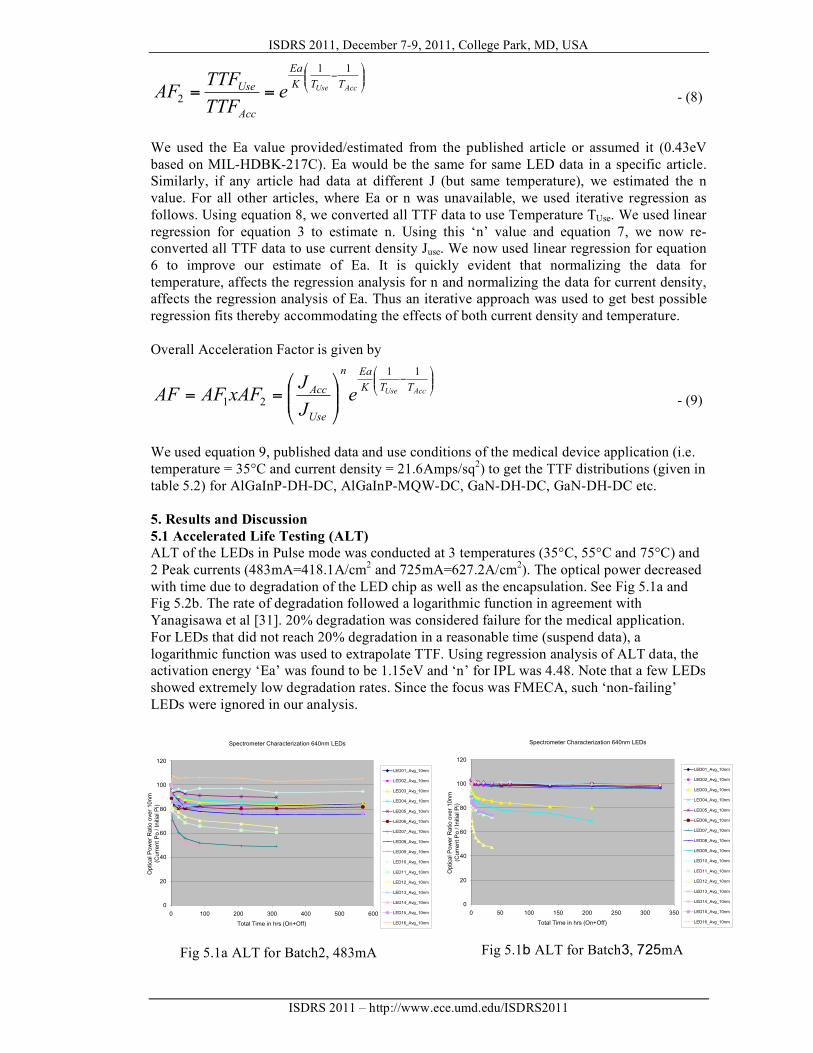
We used equation 9, published data and use conditions of the medical device application (i.e. temperature = 35°C and current density = 21.6Amps/sq2) to get the TTF distributions (given in table 5.2) for AlGaInP-DH-DC, AlGaInP-MQW-DC, GaN-DH-DC, GaN-DH-DC etc. 5. Results and Discussion 5.1 Accelerated Life Testing (ALT) ALT of the LEDs in Pulse mode was conducted at 3 temperatures (35°C, 55°C and 75°C) and 2 Peak currents (483mA=418.1A/cm2 and 725mA=627.2A/cm2). The optical power decreased with time due to degradation of the LED chip as well as the encapsulation. See Fig 5.1a and Fig 5.2b. The rate of degradation followed a logarithmic function in agreement with Yanagisawa et al [31]. 20% degradation was considered failure for the medical application. For LEDs that did not reach 20% degradation in a reasonable time (suspend data), a logarithmic function was used to extrapolate TTF. Using regression analysis of ALT data, the activation energy ‘Ea’ was found to be 1.15eV and ‘n’ for IPL was 4.48. Note that a few LEDs showed extremely low degradation rates. Since the focus was FMECA, such ‘non-failing’ LEDs were ignored in our analysis.
Fig 5.1a ALT for Batch2, 483mA
Spectrometer Characterization 640nm LEDs
0
20
40
60
80
100
120
0 100 200 300 400 500 600
Total Time in hrs (On+Off)
Op
tica
l P
ow
er
Ra
tio
ove
r 1
0n
m
(Cu
rre
nt
Po
/ I
nitia
l P
i)
LED01_Avg_10nm
LED02_Avg_10nm
LED03_Avg_10nm
LED04_Avg_10nm
LED05_Avg_10nm
LED06_Avg_10nm
LED07_Avg_10nm
LED08_Avg_10nm
LED09_Avg_10nm
LED10_Avg_10nm
LED11_Avg_10nm
LED12_Avg_10nm
LED13_Avg_10nm
LED14_Avg_10nm
LED15_Avg_10nm
LED16_Avg_10nm
Fig 5.1b ALT for Batch3, 725mA
Spectrometer Characterization 640nm LEDs
0
20
40
60
80
100
120
0 50 100 150 200 250 300 350
Total Time in hrs (On+Off)
Op
tica
l P
ow
er
Ra
tio
ove
r 1
0n
m
(Cu
rre
nt
Po
/ I
nitia
l P
i)
LED01_Avg_10nm
LED02_Avg_10nm
LED03_Avg_10nm
LED04_Avg_10nm
LED05_Avg_10nm
LED06_Avg_10nm
LED07_Avg_10nm
LED08_Avg_10nm
LED09_Avg_10nm
LED10_Avg_10nm
LED11_Avg_10nm
LED12_Avg_10nm
LED13_Avg_10nm
LED14_Avg_10nm
LED15_Avg_10nm
LED16_Avg_10nm
ISDRS 2011, December 7-9, 2011, College Park, MD, USA
ISDRS 2011 – http://www.ece.umd.edu/ISDRS2011
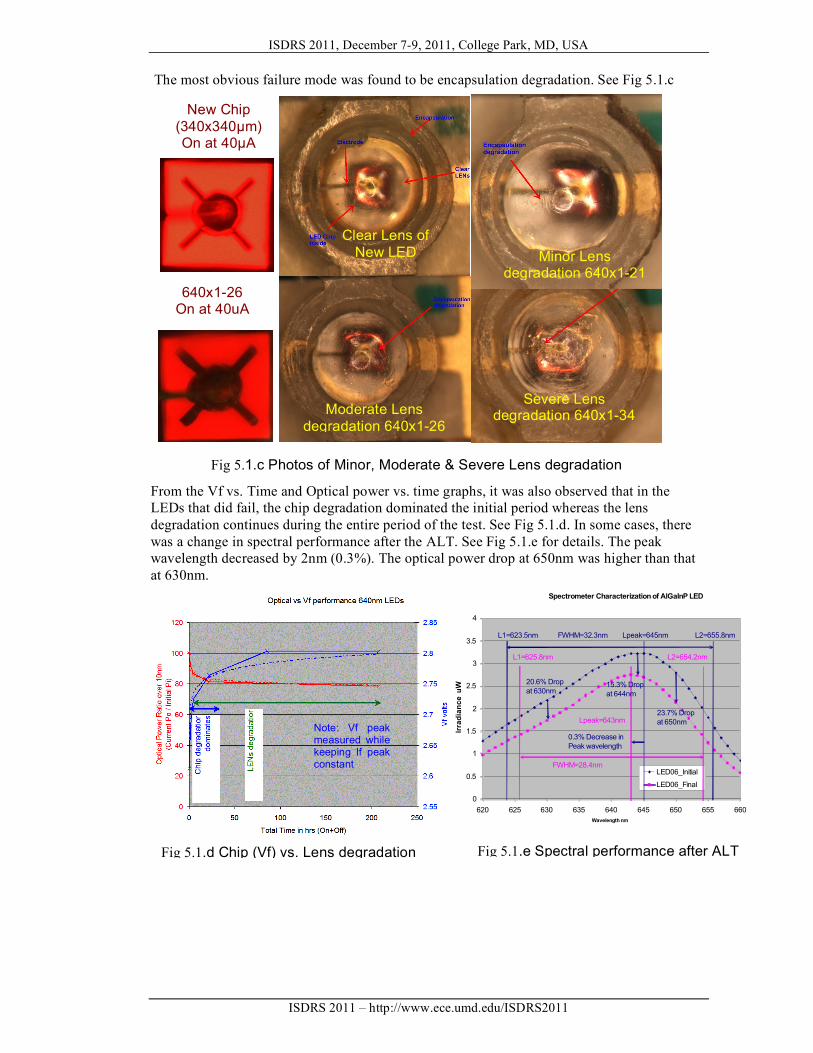
The most obvious failure mode was found to be encapsulation degradation. See Fig 5.1.c
From the Vf vs. Time and Optical power vs. time graphs, it was also observed that in the LEDs that did fail, the chip degradation dominated the initial period whereas the lens degradation continues during the entire period of the test. See Fig 5.1.d. In some cases, there was a change in spectral performance after the ALT. See Fig 5.1.e for details. The peak wavelength decreased by 2nm (0.3%). The optical power drop at 650nm was higher than that at 630nm.
Fig 5.1.e Spectral performance after ALT
Spectrometer Characterization of AlGaInP LED
0
0.5
1
1.5
2
2.5
3
3.5
4
620 625 630 635 640 645 650 655 660
Wavelength nm
Irra
dia
nc
e u
W
LED06_Initial
LED06_Final
L1=623.5nm Lpeak=645nm L2=655.8nmFWHM=32.3nm
L1=625.8nm L2=654.2nm
Lpeak=643nm
FWHM=28.4nm
20.6% Drop
at 630nm
23.7% Drop
at 650nm
15.3% Drop
at 644nm
0.3% Decrease in
Peak wavelength
Note: Vf peak measured while keeping If peak constant
Fig 5.1.d Chip (Vf) vs. Lens degradation
Clear Lens of New LED Minor Lens
degradation 640x1-21
Severe Lens degradation 640x1-34 Moderate Lens
degradation 640x1-26
640x1-26 On at 40uA
New Chip (340x340µm) On at 40µA
Fig 5.1.c Photos of Minor, Moderate & Severe Lens degradation
ISDRS 2011, December 7-9, 2011, College Park, MD, USA
ISDRS 2011 – http://www.ece.umd.edu/ISDRS2011
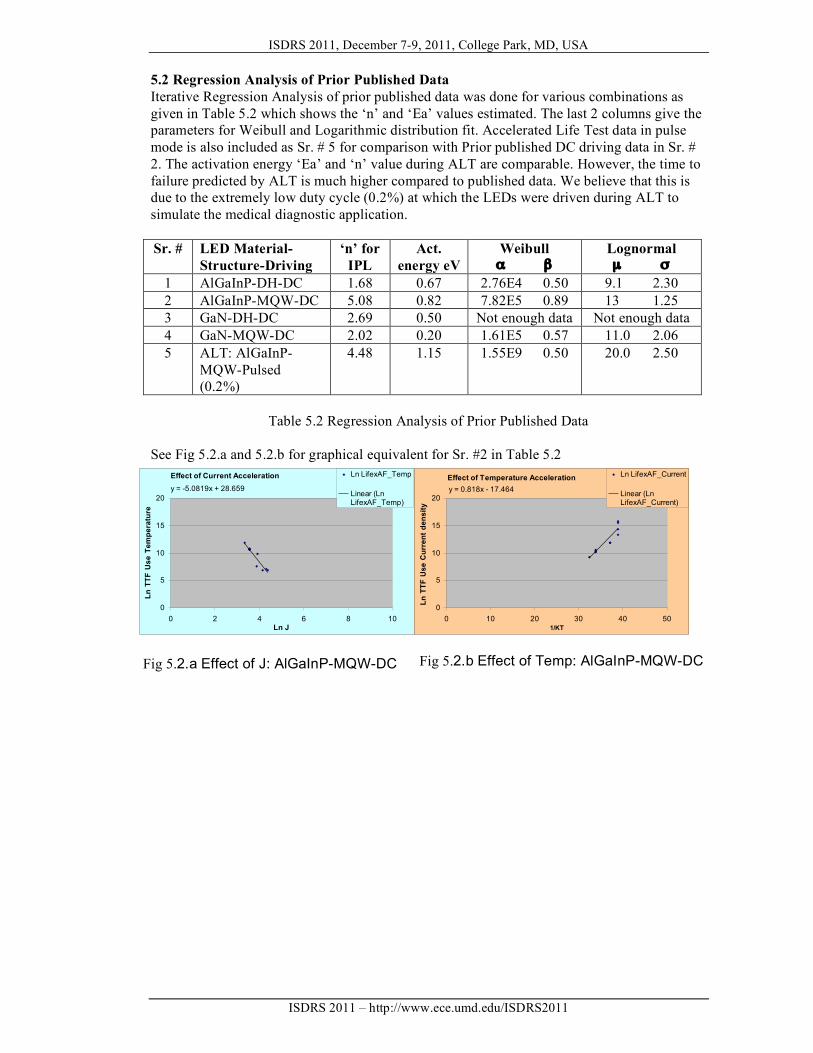
5.2 Regression Analysis of Prior Published Data Iterative Regression Analysis of prior published data was done for various combinations as given in Table 5.2 which shows the ‘n’ and ‘Ea’ values estimated. The last 2 columns give the parameters for Weibull and Logarithmic distribution fit. Accelerated Life Test data in pulse mode is also included as Sr. # 5 for comparison with Prior published DC driving data in Sr. # 2. The activation energy ‘Ea’ and ‘n’ value during ALT are comparable. However, the time to failure predicted by ALT is much higher compared to published data. We believe that this is due to the extremely low duty cycle (0.2%) at which the LEDs were driven during ALT to simulate the medical diagnostic application. Sr. # LED Material-
Structure-Driving ‘n’ for
IPL Act.
energy eV Weibull α β
Lognormal µ σ
1 AlGaInP-DH-DC 1.68 0.67 2.76E4 0.50 9.1 2.30 2 AlGaInP-MQW-DC 5.08 0.82 7.82E5 0.89 13 1.25 3 GaN-DH-DC 2.69 0.50 Not enough data Not enough data 4 GaN-MQW-DC 2.02 0.20 1.61E5 0.57 11.0 2.06 5 ALT: AlGaInP-
MQW-Pulsed (0.2%)
4.48 1.15 1.55E9 0.50 20.0 2.50
Table 5.2 Regression Analysis of Prior Published Data
See Fig 5.2.a and 5.2.b for graphical equivalent for Sr. #2 in Table 5.2
Fig 5.2.a Effect of J: AlGaInP-MQW-DC
Effect of Current Acceleration
y = -5.0819x + 28.659
0
5
10
15
20
0 2 4 6 8 10Ln J
Ln
TT
F U
se
Te
mp
era
ture
Ln LifexAF_Temp
Linear (LnLifexAF_Temp)
Effect of Temperature Acceleration
y = 0.818x - 17.464
0
5
10
15
20
0 10 20 30 40 501/KT
Ln
TT
F U
se
Cu
rre
nt
de
ns
ity
Ln LifexAF_Current
Linear (LnLifexAF_Current)
Fig 5.2.b Effect of Temp: AlGaInP-MQW-DC
ISDRS 2011, December 7-9, 2011, College Park, MD, USA
ISDRS 2011 – http://www.ece.umd.edu/ISDRS2011
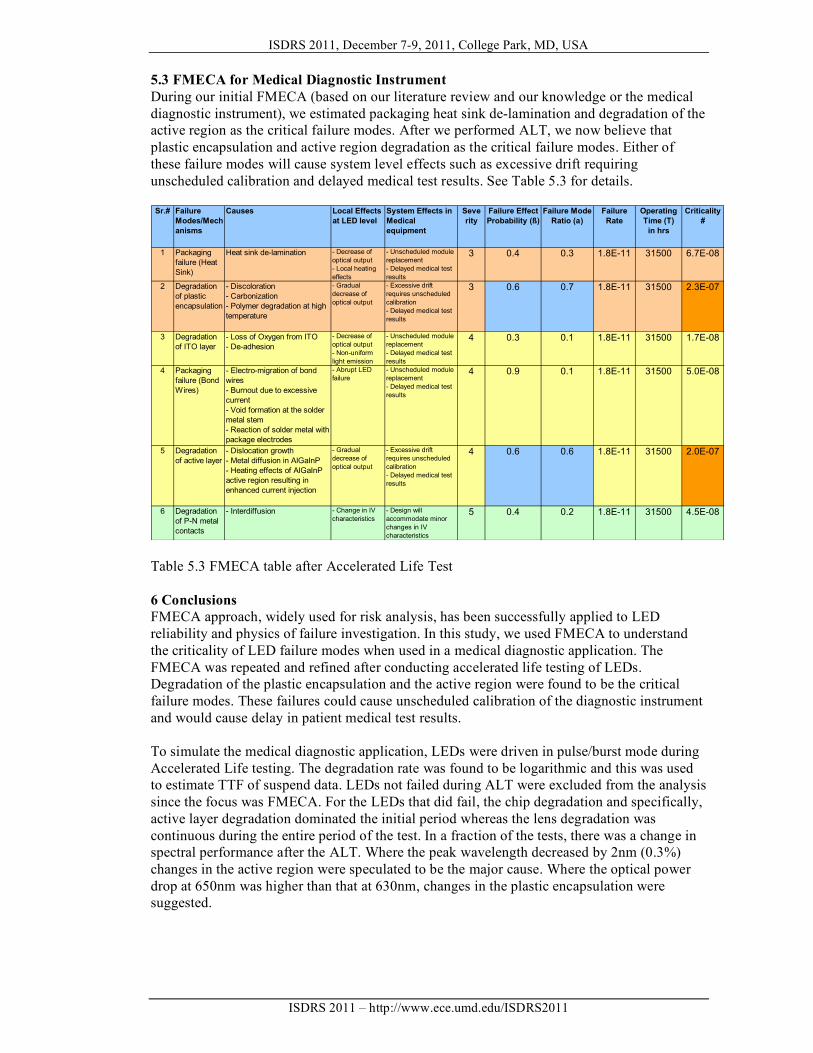
5.3 FMECA for Medical Diagnostic Instrument During our initial FMECA (based on our literature review and our knowledge or the medical diagnostic instrument), we estimated packaging heat sink de-lamination and degradation of the active region as the critical failure modes. After we performed ALT, we now believe that plastic encapsulation and active region degradation as the critical failure modes. Either of these failure modes will cause system level effects such as excessive drift requiring unscheduled calibration and delayed medical test results. See Table 5.3 for details.
Table 5.3 FMECA table after Accelerated Life Test 6 Conclusions FMECA approach, widely used for risk analysis, has been successfully applied to LED reliability and physics of failure investigation. In this study, we used FMECA to understand the criticality of LED failure modes when used in a medical diagnostic application. The FMECA was repeated and refined after conducting accelerated life testing of LEDs. Degradation of the plastic encapsulation and the active region were found to be the critical failure modes. These failures could cause unscheduled calibration of the diagnostic instrument and would cause delay in patient medical test results. To simulate the medical diagnostic application, LEDs were driven in pulse/burst mode during Accelerated Life testing. The degradation rate was found to be logarithmic and this was used to estimate TTF of suspend data. LEDs not failed during ALT were excluded from the analysis since the focus was FMECA. For the LEDs that did fail, the chip degradation and specifically, active layer degradation dominated the initial period whereas the lens degradation was continuous during the entire period of the test. In a fraction of the tests, there was a change in spectral performance after the ALT. Where the peak wavelength decreased by 2nm (0.3%) changes in the active region were speculated to be the major cause. Where the optical power drop at 650nm was higher than that at 630nm, changes in the plastic encapsulation were suggested.
Sr.# Failure
Modes/Mech
anisms
Causes Local Effects
at LED level
System Effects in
Medical
equipment
Seve
rity
Failure Effect
Probability (ß)
Failure Mode
Ratio (a)
Failure
Rate
Operating
Time (T)
in hrs
Criticality
#
1 Packaging
failure (Heat
Sink)
Heat sink de-lamination - Decrease of
optical output
- Local heating
effects
- Unscheduled module
replacement
- Delayed medical test
results
3 0.4 0.3 1.8E-11 31500 6.7E-08
2 Degradation
of plastic
encapsulation
- Discoloration
- Carbonization
- Polymer degradation at high
temperature
- Gradual
decrease of
optical output
- Excessive drift
requires unscheduled
calibration
- Delayed medical test
results
3 0.6 0.7 1.8E-11 31500 2.3E-07
3 Degradation
of ITO layer
- Loss of Oxygen from ITO
- De-adhesion
- Decrease of
optical output
- Non-uniform
light emission
- Unscheduled module
replacement
- Delayed medical test
results
4 0.3 0.1 1.8E-11 31500 1.7E-08
4 Packaging
failure (Bond
Wires)
- Electro-migration of bond
wires
- Burnout due to excessive
current
- Void formation at the solder
metal stem
- Reaction of solder metal with
package electrodes
- Abrupt LED
failure
- Unscheduled module
replacement
- Delayed medical test
results
4 0.9 0.1 1.8E-11 31500 5.0E-08
5 Degradation
of active layer
- Dislocation growth
- Metal diffusion in AlGaInP
- Heating effects of AlGaInP
active region resulting in
enhanced current injection
- Gradual
decrease of
optical output
- Excessive drift
requires unscheduled
calibration
- Delayed medical test
results
4 0.6 0.6 1.8E-11 31500 2.0E-07
6 Degradation
of P-N metal
contacts
- Interdiffusion - Change in IV
characteristics
- Design will
accommodate minor
changes in IV
characteristics
5 0.4 0.2 1.8E-11 31500 4.5E-08

ISDRS 2011, December 7-9, 2011, College Park, MD, USA
ISDRS 2011 – http://www.ece.umd.edu/ISDRS2011
From the graphs or tabular data in prior published articles, we extracted the time required for the optical power output to reach 80% of its initial value. Iterative Regression Analysis was carried out to estimate the activation energy ‘Ea’ and ‘n’ for IPL. The activation energy ‘Ea’ and ‘n’ value during ALT are comparable. However, the time to failure during ALT is much higher compared to published data. We believe that this is due to the extremely low duty cycle (0.2%) at which the LEDs were driven during ALT to simulate the medical diagnostic application. 7 Acknowledgements The laboratory facilities for this research were provided by Siemens Healthcare Diagnostics. However, Siemens had no role in the study design; in the collection, analysis and interpretation of data; in the writing of the report; and in the decision to submit the article for publication. References [1] Aris Christou, ‘Photonic Materials, Devices and Reliability’, 2006 [2] Mitsuo Fukuda, ‘Reliability & Degradation of Semiconductor Lasers & LEDs’, 1991 [3] Shuji Nakamura & S.F. Chichibu, ‘Introduction to Nitride Semiconductor Blue Lasers & LEDs’, 2000 [4] K. Wada & S.W. Pang, ‘Defects in Optoelectronic Materials’, 2001 [5] Ali Mosleh, ‘Bayesian Methods for Risk and Reliability’, 2007 [6] Vanderwater et al. ‘High-brightness AlGaInP light emitting diodes', Proceedings of the IEEE, Vol. 85, Issue
11, Pages 1752-1764, Nov. 1997 [7] Grillot et al. ‘Sixty Thousand Hour Light Output Reliability of AlGaInP LEDs', IEEE Transactions on Device
and Material Reliability, Vol. 6, No.4, Pages 564-574, Dec 2006 [8] Kish et al. ‘Highly reliable and efficient semiconductor wafer-bonded AlGaInP/GaP LEDs', Electronics Letters,
Vol. 32, Issue 2, Pages132–136, Jan 1996. [9] Chang et al. ‘AlGaInP multiquantum well light-emitting diodes', IEE Proc.-Optoelectron., Vol. 144, No. 6,
December 1997 [10] Kish et al. ‘High luminous flux semiconductor wafer-bonded AlGaInP/GaP large-area emitters', Electronics
Letters, Vol. 30, Issue 21, Pages 1790-1792, October 1994 [11] Krames et al. ‘Status and Future of High-Power LEDs for Solid-State Lighting', Journal of Display
Technology, Vol. 3, Issue 2, Pages 160–175, June 2007 [12] Streubel et al. ‘High Brightness AlGaInP Light-Emitting Diodes', IEEE Journal of Selected Topics in Quantum
Electronics, Pages 321–332, March-April 2002 [13] Altieri et al. ‘Analysis of internal quantum efficiency of high-brightness AlGaInP LEDs', The 4th International
Conference on Numerical Simulation of Optoelectronic Devices Proceedings NUSOD '04, Pages 13-14, August 2004
[14] Liang et al. ‘Comparison of temperature dependent electroluminescence of InGaN/GaN and AlGaInP based LEDs', Optoelectronics, The 6th Chinese Symposium Proceedings Pages 196-199, Sept. 2003.
[15] Philips, ‘LUXEON Reliability Datasheet RD25’, Pages 9-10, July 2006 [16] Lin et al. ‘Highly reliable operation of indium tin oxide AlGaInP light emitting diodes', Electronics Letters,
Vol. 30, No.21, October 1994 [17] Su et al. ‘High Reliability of AlGaInP LEDs with tensile strain barrier-reducing Layer', IEEE Photonics
Technology Letters, Vol. 16, Issue 1, Pages 30–32, Jan. 2004 [18] Lacey et al. 'The Reliability of AlGaInP visible LEDs', Quality & Reliability Engineering, Vol. 16, Issue 1,
Pages 45 – 49, 2000. [19] Dutta et al. ‘High Brightness and Reliable AlGaInP-Based LED for POF Data Links', IEEE Photonics
Technology Letters, Vol. 9, No 12, December 1997. [20] Meneghini et al. 'A review on the Reliability of GaN based LEDs', IEEE Transactions on Device and Materials
Reliability, Vol. 8, No. 2, June 2008. [21] Meneghini et al. ' A review on the physical mechanisms that limit the reliability of GaN based LEDs', IEEE
Transactions on Electron Devices, Vol. 51, Issue. 1, Jan 2010. [22] Levada et al. ' Analysis of DC Current Accelerated Life Tests of GaN LEDs Using a Weibull-Based Statistical
Model', IEEE Transactions on Device and Materials Reliability, Vol. 5, No. 4, Dec 2005. [23] Buso et al. 'Performance Degradation of High-Brightness LEDs Under DC and Pulsed Bias', IEEE
Transactions on Device and Materials Reliability, Vol. 8, No. 2, June 2008. [24] Trevisanello et al. 'Accelerated life test of High Brightness LEDs', IEEE Transactions on Device and Materials
Reliability, Vol. 8, No. 2, June 2008. [25] Meneghesso et al. 'Degradation mechanisms of GaN-based LEDs after accelerated DC current aging', Electron
Devices Meeting Digest, Pages 103-106, Dec 2002. [26] Levada et al. ' High Brightness InGaN LED degradation at high injection current bias', 44th Annual
International Reliability Physics Symposium Proc., Pages 615-616, Mar 2006.

ISDRS 2011, December 7-9, 2011, College Park, MD, USA
ISDRS 2011 – http://www.ece.umd.edu/ISDRS2011
[27] Meneghesso et al. 'Failure mechanisms of GaN-based LEDs related with instabilities in doping profile and deep levels', 42nd Annual International Reliability Physics Symposium Proceedings, Pages 474-478, April 2004.
[28] Osinski et al. 'AlGaN/InGaN/GaN blue light emitting diode degradation under pulsed current stress', Applied Physics Letters, 69 (7), August 1996.
[29] Barton et al. 'Life tests and failure mechanisms of GaN-AlGaN-InGaN LEDs', 35th Annual International Reliability Physics Symposium Proc, Pages 276-281, April 1997.
[30] Barton et al. 'Degradation mechanisms in GaN/AlGaN/InGaN LEDs and LDs', 10th Conf. on Semiconducting & Insul. Materials Proc., Pages 259-262, June 1998.
[31] Yanagisawa T., 'Estimation of the degradation of InGaN/A1GaN Blue LEDs', Microelectronic Reliability, Vol. 37, No. 8, pp. 1239-1241, 1997.
[32] Yanagisawa T. ' The degradation of GaAlAs red LEDs under continuous and low-speed pulse operations ', Microelectronics Reliability 38, pp. 1627-1630, 1998.
[33] Narendran et al. 'Life of LED-Based White Light Sources', IEEE/OSA Journal of Display Technology, Vol. 1, NO. 1, September 2005.