feasibility report - hdmc.mrc.gov.in · pricewaterhousecoopers tata consulting engineers limited...
TRANSCRIPT
Feasibility Report
25 Aug 17
Hubballi-Dharwad Smart City –
Underground Drainage System
of Tolankere catchment Area

Feasibility Report – Underground Drainage System of Tolankere Catchment area –Hubballi Dharwad Smart City Limited
Prepared for Hubballi Dharwad Smart City Limited Page 2 of 58
REVISION STATUS
Sl.
No.
Revision
No
Prepared
By
Checked
By
Passed
By
Submitted
On Purpose
1 RO SD SKAC PRN 25-08-2017 For Client
Submission

Feasibility Report – Underground Drainage System of Tolankere Catchment area –Hubballi Dharwad Smart City Limited
Prepared for Hubballi Dharwad Smart City Limited Page 3 of 58
This document has been prepared solely for HDSCL, being the express addressee to this document.
PwC and TCE does not accept or assume any liability, responsibility or duty of care for any use of or
reliance on this document by anyone, other than (i) HDSCL, to the extent agreed in the relevant
contract for the matter to which this document relates (if any), or (ii) as expressly agreed by PwC
and TCE in writing in advance.
This publication (and any extract from it) may not be copied, paraphrased, reproduced, or
distributed in any manner or form, whether by photocopying, electronically, by internet, within
another document or otherwise, without the prior written permission of PwC and TCE. Further, any
quotation, citation, or attribution of this publication, or any extract from it, is strictly prohibited
without PwC‟s and TCE‟s prior written permission.
PricewaterhouseCoopers Tata Consulting Engineers Limited Aminbhavi & Hegde Consulting
Engineers Pvt Ltd
© 2016 PricewaterhouseCoopers Private Limited, Tata Consulting Engineers Limited, Aminbhavi &
Hegde Consulting Engineers Pvt Ltd. All rights reserved.
In this document, PwC refers to PricewaterhouseCoopers Private Limited (a limited liability
company in India) an India member firm and may sometimes refer to the PwC network.
Each member firm is a separate legal entity.
Please see www.pwc.com/structure for further details.
TCE refers to Tata Consulting Engineers Limited. Please refer to www.tce.co.in/ for further details.
Feasibility Report – Underground Drainage System of Tolankere Catchment area –Hubballi Dharwad Smart City Limited
Prepared for Hubballi Dharwad Smart City Limited Page 4 of 58
Table of Contents
1. Executive Summary ................................................................................................ 11
2. Project Introduction .............................................................................................. 13
2.1 Background ..................................................................................................................................... 13
2.2 City Overview ............................................................................................................................. 13
2.3 Smart City Mission ..................................................................................................................... 14
2.4 Project Idea and Scope ............................................................................................................... 15
2.5 Necessity of the project .............................................................................................................. 16
2.6 Project Description ..................................................................................................................... 16
2.7 Industry Overview ...................................................................................................................... 17
2.8 Regional Profile .......................................................................................................................... 18
2.9 City Connectivity ........................................................................................................................ 19
2.10 Climatic Conditions ............................................................................................................... 20
2.11 Land Use Pattern of the city .................................................................................................. 20
3. Existing System and its Analysis ............................................................................ 22
3.1 Introduction .................................................................................................................................... 22
3.2 Existing Sewerage System .......................................................................................................... 22
3.3 Past/Ongoing Projects and Proposals ........................................................................................ 25
3.4 Existing Sewerage System Analysis............................................................................................ 26
3.5 Conclusion .................................................................................................................................. 27
4. Project ................................................................................................................... 28
4.1 Project Components ........................................................................................................................ 28
4.2 Site Description .......................................................................................................................... 28
4.3 Site topography .......................................................................................................................... 29
Feasibility Report – Underground Drainage System of Tolankere Catchment area –Hubballi Dharwad Smart City Limited
Prepared for Hubballi Dharwad Smart City Limited Page 5 of 58
4.4 Site Reconnaissance ................................................................................................................... 29
4.5 Alternative studies for the Project .............................................................................................. 29
4.6 Rainfall Analysis ......................................................................................................................... 31
4.6.1 Depth-Duration of Rainfall ................................................................................................... 31
4.6.2 Time of Concentration ........................................................................................................... 32
4.6.3 Co-efficient of Runoff ............................................................................................................ 33
Table 9: Co-Efficient of Runoff for Various Surfaces .................................................. 33
4.6.4 Co-efficient of Runoff adopted for Tolankere Catchment ..................................................... 34
4.7 Population Projection ................................................................................................................. 37
4.8 Proposed sewerage system .........................................................................................................40
4.7.1. Design approach for proposed sewerage zone .................................................................. 41
4.7.2. Sewage treatment plant .................................................................................................... 42
4.7.3. Salient features of collection system ................................................................................. 43
4.7.4. Design Capacities of STP/ SPS ......................................................................................... 43
4.9 Stakeholder Interactions ............................................................................................................ 44
4.10 Best Case Studies for similar projects in India/World .......................................................... 44
4.9.1. Bhoj Wetland Project ........................................................................................................ 44
4.11 Referenced Studies and Surveys ............................................................................................ 45
4.12 SWOT Analysis ...................................................................................................................... 45
5. Project Financials .................................................................................................. 47
5.1 Cost Assumptions ............................................................................................................................ 47
5.2 Project Costing ........................................................................................................................... 47
6. Statutory and Legal Framework ............................................................................. 49
6.1 Legal & Regulatory Framework ...................................................................................................... 49
7. Indicative Environmental & Social Impacts ........................................................... 51
Feasibility Report – Underground Drainage System of Tolankere Catchment area –Hubballi Dharwad Smart City Limited
Prepared for Hubballi Dharwad Smart City Limited Page 6 of 58
7.1 Introduction .................................................................................................................................... 51
7.2 Air quality ................................................................................................................................... 51
7.3 Noise quality ............................................................................................................................... 52
7.4 Water quality ............................................................................................................................. 52
7.5 Land environment ...................................................................................................................... 53
7.6 Socio economic impacts for proposed project ........................................................................... 53
7.7 Potential environmental impact matrix .......................................................................................... 53
8. Operating Framework ............................................................................................ 57
8.1 Indicative Project Structuring .................................................................................................... 57
9. Next Steps .............................................................................................................. 58
9.1 General ............................................................................................................................................ 58
Annexures
Annexure 1 DESIGN BASIS – SEWERAGE NETWORK
Annexure 2 DESIGN OF SEWAGE TREATMENT PLANT
Feasibility Report – Underground Drainage System of Tolankere Catchment area –Hubballi Dharwad Smart City Limited
Prepared for Hubballi Dharwad Smart City Limited Page 7 of 58
List of Tables
Table 1: Details of Industrial estate ..................................................................................................... 18
Table 2: Land Use Plan for 2000 ......................................................................................................... 21
Table 3: Land Use of Hubballi Dharwad (proposed) ........................................................................... 21
Table 4: Ward- wise Population of 2011 census .................................................................................. 24
Table 6: Feasibility Options for Sewerage System for the Tolankere Lake area ................................. 29
Table 7: Intensity of rainfall for different time duration ..................................................................... 31
Table 8: Time of Concentration ........................................................................................................... 33
Table 9: Co-Efficient of Runoff for Various Surfaces .......................................................................... 33
Table 10: Co-efficient of Runoff ........................................................................................................... 34
Table 11: Runoff details of HDMC ....................................................................................................... 35
Table 12: Details of Rainy Days ........................................................................................................... 36
Table 13: Details of Excess Runoff which can be stored ...................................................................... 36
Table 14: Details of Evaporational and Percolation losses .................................................................. 37
Table 15: Census data- HDMC (1971-2011) ......................................................................................... 38
Table 16: Population Projections for HDMC ....................................................................................... 38
Table 17: Summary of population data for Project area and ABD area derived from total projected
HDMC population ............................................................................................................................... 39
Table 18: Summary of Waste water generated in Tolankere command area ......................................40
Table 19: Details of STP- proposed ...................................................................................................... 42
Table 20: Capacities of STP ................................................................................................................. 43
Table 21: Capacities of SPS .................................................................................................................. 43
Table 22: Agencies involved in the project .......................................................................................... 44
Table 23: SWOT analysis ..................................................................................................................... 45
Table 24: Project Costing ..................................................................................................................... 47
Table 25: Operations and Maintenance Expenses .............................................................................. 48
Table 26: Potential Environmental Impact Matrix for the proposed UGD project in Tolankere
Command area ..................................................................................................................................... 55
Table 27: Environmental Impacts and Mitigations ............................................................................. 55
Table 28: Major Milestones and Time Allocated ................................................................................. 57
Table 29: Tentative planning for next deliverables ............................................................................. 58
Feasibility Report – Underground Drainage System of Tolankere Catchment area –Hubballi Dharwad Smart City Limited
Prepared for Hubballi Dharwad Smart City Limited Page 8 of 58
List of Figures
Figure 1: Smart cities selected in different phases .............................................................................. 14
Figure 2: Location of ABD area ........................................................................................................... 19
Figure 3: City connectivity ................................................................................................................... 20
Figure 4: Existing Sewerage Zoning for Hubbali ................................................................................. 23
Figure 5: Existing STP Location .......................................................................................................... 23
Figure 6: Proposed STP under AMPRUT scheme ............................................................................... 25
Figure 7: Out flow from Tolankere lake to Road side Drains .............................................................. 27
Figure 8: Project Location ................................................................................................................... 28
Figure 9: Intensity Duration Frequency Curves For Hubli Darwad city ............................................. 32
Figure 10: Graphical Representation of population projection for HDMC ......................................... 39
Figure 11: Proposed Sewerage network ............................................................................................... 41
Figure 12: Project Structuring ............................................................................................................. 57
Feasibility Report – Underground Drainage System of Tolankere Catchment area –Hubballi Dharwad Smart City Limited
Prepared for Hubballi Dharwad Smart City Limited Page 9 of 58
Abbreviations
ABD - Area Based Development
AH - Aminbhavi & Hegde
CBD - Central Business District
CBT - Central Bus Terminal
CCTV - Closed-circuit television
CPHEEO - Central Public Health and Environmental Engineering Organisation
DPR - Detailed Project Report
EPC - Engineering Procurement Construction
FY - Financial Year
GoI - Government of India
GoK - Government of Karnataka
GPS - Global Positioning System
Ha - Hectare
HDMC - Hubballi Dharwad Municipal Corporation
HDSCL - Hubballi-Dharwad Smart City Limited
HDUDA - Hubballi-Dharwad Urban Development Authority
IT - Information Technology
Km - Kilometres
KSIIDC - Karnataka State Industrial and Infrastructure Development Corporation
KUIDFC - Karnataka Urban Infrastructure Development Financial Corporation
KUWSDB - Karnataka Urban Water Supply and Drainage Board
MD - Managing Director
MLD - Millions of Litre per Day
MoEF - Ministry of Environment and Forests
MoUD - Ministry of Urban Development
MSME - Micro, Small & Medium Enterprises
MSW - Municipal Solid Waste
NBP - Non Biophysical Components
NGO - Non-Governmental Organisation
O&M - Operation and Maintenance
PwC - PricewaterhouseCoopers Pvt. Ltd.
PMC - Project Management Consultant
RCC - Reinforced Cement Concrete

Feasibility Report – Underground Drainage System of Tolankere Catchment area –Hubballi Dharwad Smart City Limited
Prepared for Hubballi Dharwad Smart City Limited Page 10 of 58
RFID - Radio Frequency identification
SCC - Special Contract Clause
SCP - Smart City Proposal
SH - State Highway
SPCB - State Pollution Control Board
SPS - Sewerage Pumping Station
SPV - Special Purpose Vehicle
STP - Sewerage Treatment Plant
SWOT - Strengths, Weaknesses, Opportunities, and Threats
TCE - TATA Consulting Engineers Limited
TPD - Tonnes per Day
ULB - Urban Local Body
UNEP - United Nation Environment Programme
USEPA - United States Environment Protection Agency
Feasibility Report – Underground Drainage System of Tolankere Catchment area –Hubballi Dharwad Smart City Limited
Prepared for Hubballi Dharwad Smart City Limited Page 11 of 58
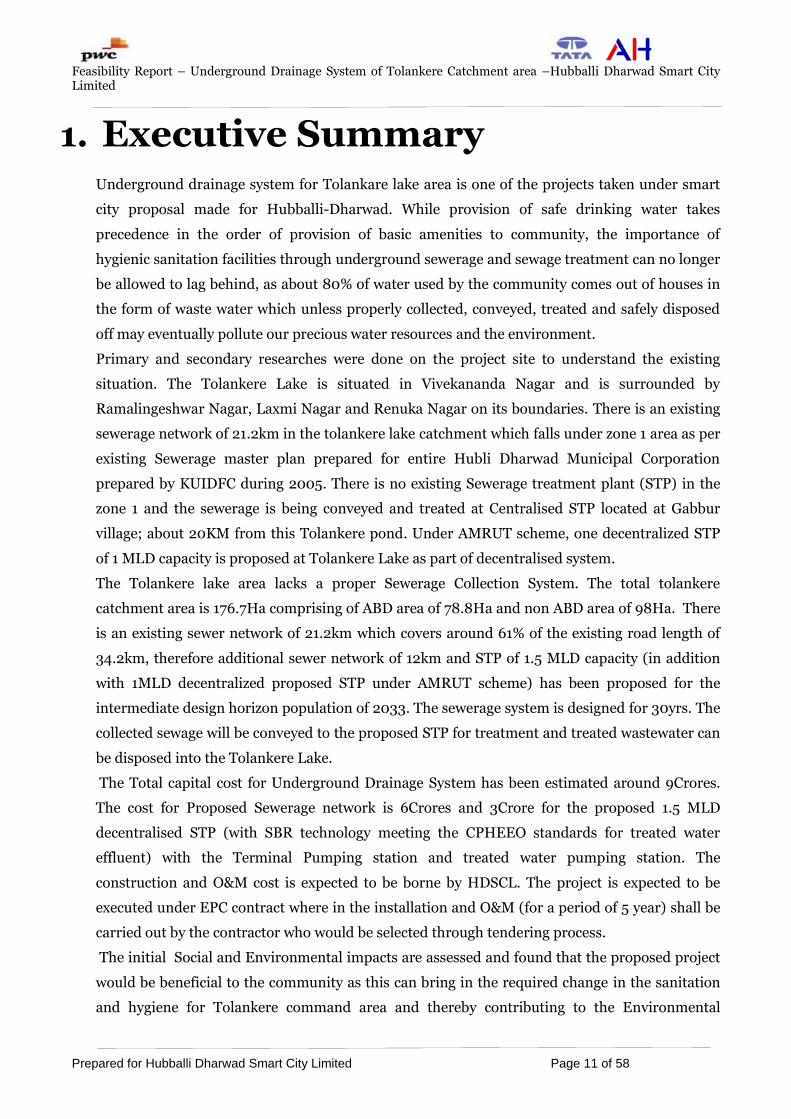
1. Executive Summary Underground drainage system for Tolankare lake area is one of the projects taken under smart
city proposal made for Hubballi-Dharwad. While provision of safe drinking water takes
precedence in the order of provision of basic amenities to community, the importance of
hygienic sanitation facilities through underground sewerage and sewage treatment can no longer
be allowed to lag behind, as about 80% of water used by the community comes out of houses in
the form of waste water which unless properly collected, conveyed, treated and safely disposed
off may eventually pollute our precious water resources and the environment.
Primary and secondary researches were done on the project site to understand the existing
situation. The Tolankere Lake is situated in Vivekananda Nagar and is surrounded by
Ramalingeshwar Nagar, Laxmi Nagar and Renuka Nagar on its boundaries. There is an existing
sewerage network of 21.2km in the tolankere lake catchment which falls under zone 1 area as per
existing Sewerage master plan prepared for entire Hubli Dharwad Municipal Corporation
prepared by KUIDFC during 2005. There is no existing Sewerage treatment plant (STP) in the
zone 1 and the sewerage is being conveyed and treated at Centralised STP located at Gabbur
village; about 20KM from this Tolankere pond. Under AMRUT scheme, one decentralized STP
of 1 MLD capacity is proposed at Tolankere Lake as part of decentralised system.
The Tolankere lake area lacks a proper Sewerage Collection System. The total tolankere
catchment area is 176.7Ha comprising of ABD area of 78.8Ha and non ABD area of 98Ha. There
is an existing sewer network of 21.2km which covers around 61% of the existing road length of
34.2km, therefore additional sewer network of 12km and STP of 1.5 MLD capacity (in addition
with 1MLD decentralized proposed STP under AMRUT scheme) has been proposed for the
intermediate design horizon population of 2033. The sewerage system is designed for 30yrs. The
collected sewage will be conveyed to the proposed STP for treatment and treated wastewater can
be disposed into the Tolankere Lake.
The Total capital cost for Underground Drainage System has been estimated around 9Crores.
The cost for Proposed Sewerage network is 6Crores and 3Crore for the proposed 1.5 MLD
decentralised STP (with SBR technology meeting the CPHEEO standards for treated water
effluent) with the Terminal Pumping station and treated water pumping station. The
construction and O&M cost is expected to be borne by HDSCL. The project is expected to be
executed under EPC contract where in the installation and O&M (for a period of 5 year) shall be
carried out by the contractor who would be selected through tendering process.
The initial Social and Environmental impacts are assessed and found that the proposed project
would be beneficial to the community as this can bring in the required change in the sanitation
and hygiene for Tolankere command area and thereby contributing to the Environmental
Feasibility Report – Underground Drainage System of Tolankere Catchment area –Hubballi Dharwad Smart City Limited
Prepared for Hubballi Dharwad Smart City Limited Page 12 of 58
sustainability. Environmental impacts are considered for both construction phase and Operation
phase and the mitigation measures have been proposed suitably. HDSCL and PMC team shall
ensure that the project is implemented in at most environment friendly way.
Feasibility Report – Underground Drainage System of Tolankere Catchment area –Hubballi Dharwad Smart City Limited
Prepared for Hubballi Dharwad Smart City Limited Page 13 of 58
2. Project Introduction
2.1 Background
Government of India intends to transform 100 Indian Cities to Smart Cities. The twin cities of
Hubballi- Dharwad have been selected to be developed into a smart city under the fast track
mode of first phase of the Smart Cities Mission launched by Ministry of Urban Development
(MoUD). Hubballi-Dharwad was selected amongst the 27 winners of the "2nd Round
Competition of SCM” based on the Smart City Plan (SCP) announced in September 2016. In this
context, Hubballi-Dharwad has incorporated a Special Purpose Vehicle (SPV) – Hubballi-
Dharwad Smart City Limited (HDSCL) (the “Authority”) to plan, design, implement, coordinate
and monitor the smart city projects in Hubballi-Dharwad.
Hubballi-Dharwad‟s Area Based Development (ABD) proposal includes Redevelopment of 992
acres area within the city which impacts about 1.1 lakh city population. The ABD area has mainly
two kind of land use- commercial and administrative with small pocket of Residential and slum
area. HDSCL has received funds from GoI and GoK for the development of smart city in
Hubballi-Dharwad. Pursuant to above, PricewaterhouseCoopers Pvt. Ltd. (PwC) in association
with TATA Consulting Engineers Limited (TCE) and Aminbhavi and Hegde (AH) have been
appointed as Project Management Consultant (PMC) for providing consultancy services for
preparation of Retrofitting plan for ABD area including pan city components; preparation of
detailed project reports for various packages and project management consultancy support for
the same.
2.2 City Overview
Hubballi and Dharwad are twin cities in the state of Karnataka and are referred as Hubballi-
Dharwad. The Hubballi-Dharwad is the oldest city in Karnataka state with strong cultural and
historical importance, and is also the second-largest urban settlement in Karnataka after
Bengaluru. The twin cities of Hubballi and Dharwad are located at a distance of about 20 km
from each other and form part of Hubballi Dharwad Municipal Corporation. Hubballi was
identified as an important commercial and trade centre for the entire northern Karnataka region
by the British. Hubballi and Dharwad were separate municipal entities, but these two cities were
so interdependent that a common municipal borough was constituted in the year 1925 for the
combined population of 69,940. Further, Hubballi-Dharwad municipality was upgraded to
corporation in the year 1962. Hubballi is the commercial centre and business hub of North
Karnataka region. Crops including cotton, chilli pepper and peanuts are grown aplenty in the
surrounding rural agricultural areas, and Hubballi is a major trading centre for these
commodities. It is also an important city for the Indian Railways, as it is the headquarters for
Feasibility Report – Underground Drainage System of Tolankere Catchment area –Hubballi Dharwad Smart City Limited
Prepared for Hubballi Dharwad Smart City Limited Page 14 of 58
South Western Railway zone and the Hubballi Railway Division. Hubballi is a major railway
junction in North Karnataka. It is also the headquarters of North Western Karnataka Road
Transport Corporation. Hubballi also houses the largest number of government offices outside
Bangalore. It has more than 3,000 small and medium industries. Approximately 61% of the
city„s population is involved in the tertiary sector. The demographic indicators namely sex ratio
and literacy rates are favorable and higher than that of Karnataka and India. The existing
population of the Hubballi- Dharwad Municipal Corporation area as per Census 2011 is about
9.43 lakhs.
2.3 Smart City Mission
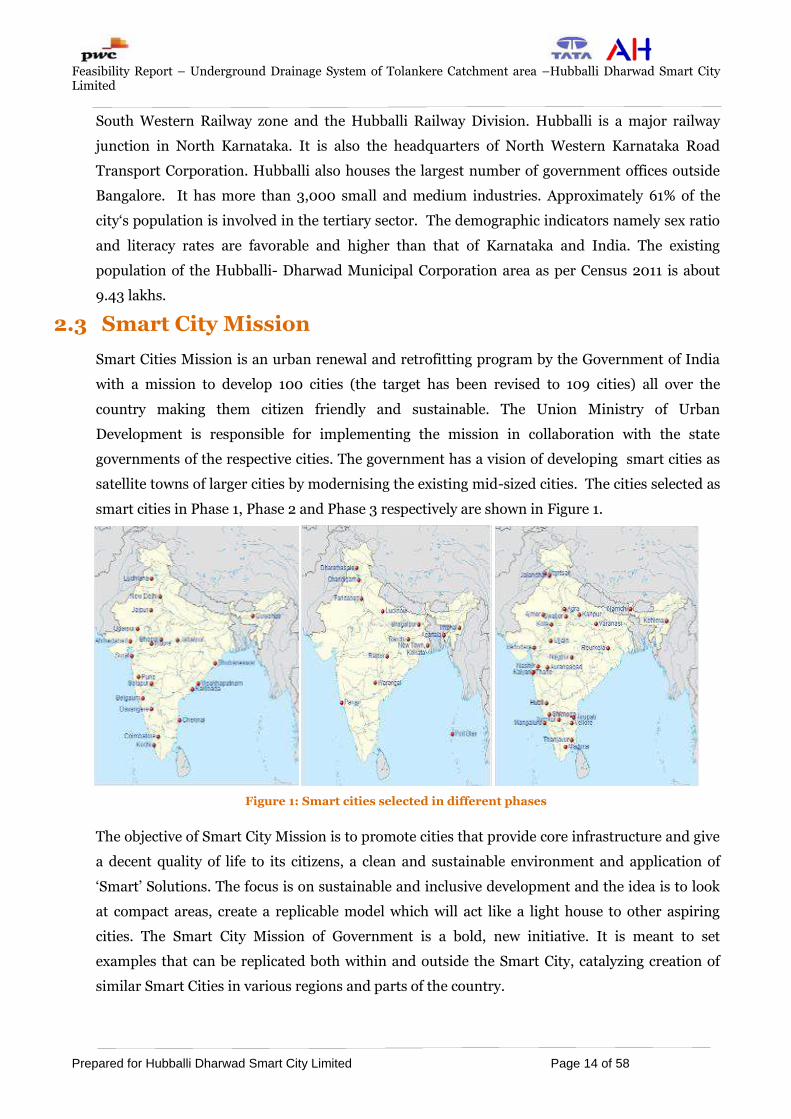
Smart Cities Mission is an urban renewal and retrofitting program by the Government of India
with a mission to develop 100 cities (the target has been revised to 109 cities) all over the
country making them citizen friendly and sustainable. The Union Ministry of Urban
Development is responsible for implementing the mission in collaboration with the state
governments of the respective cities. The government has a vision of developing smart cities as
satellite towns of larger cities by modernising the existing mid-sized cities. The cities selected as
smart cities in Phase 1, Phase 2 and Phase 3 respectively are shown in Figure 1.
Figure 1: Smart cities selected in different phases
The objective of Smart City Mission is to promote cities that provide core infrastructure and give
a decent quality of life to its citizens, a clean and sustainable environment and application of
„Smart‟ Solutions. The focus is on sustainable and inclusive development and the idea is to look
at compact areas, create a replicable model which will act like a light house to other aspiring
cities. The Smart City Mission of Government is a bold, new initiative. It is meant to set
examples that can be replicated both within and outside the Smart City, catalyzing creation of
similar Smart Cities in various regions and parts of the country.

Feasibility Report – Underground Drainage System of Tolankere Catchment area –Hubballi Dharwad Smart City Limited
Prepared for Hubballi Dharwad Smart City Limited Page 15 of 58
Accordingly, the purpose of Smart Cities Mission is to drive economic growth and improve
quality of life of people by enabling local area development and harnessing technology especially
that leads to Smart outcomes. Area-based development (retrofit and redevelop) will transform
existing areas including slums into better planned ones thereby improving livability of the whole
City. Application of Smart Solutions will enable cities to use technology, information and data to
improve infrastructure and services. Comprehensive development in this way will improve
quality of life, create employment and enhance income for all, especially the poor and the
disadvantaged, leading to creation of inclusive Cities.
2.4 Project Idea and Scope
The purpose of Smart Cities Mission is to drive economic growth and improve quality of life of
people by enabling local area development and harnessing technology, especially technology that
leads to Smart outcomes. Area-based development will transform existing areas (retrofit and
redevelop); including slums, into better planned ones, thereby improving livability of the whole
City. Sustainability of the smart city can be ensured through Rejuvenation of water bodies and
other open spaces which will reduce the urban heat effects and promote eco-balance.
Underground Drainage System for Tolenkare catchment is one of the projects taken
under smart city proposal made for Hubbali-Dharwad. This project aims at the importance of
hygienic facilities through improved sanitation facilities; to execute various multidimensional
developmental activities which can enhance the social and economic condition of the community
around it. Diverting untreated sewerage entering to the lake through proper routing
of sewer network lines towards the proposed decentralised STP and disposing the
treated waste water into the lake will provide water in the lake throughout the year
and can lead to the lake rejuvenating activity along with providing hygienic
condition to the community. Primary and secondary researches were done on the project
site to understand the existing situation. Preliminary Development plans feasible for the
locations were hence framed as part of the site visits.
The scope of the Feasibility Report for Underground Drainage system for Tolenkare catchment
area of 176.8Ha (comprising of ABD area of 78.8Ha and non ABD area of 98Ha) of Hubbali-
Dharwad Smart City Limited has been finalised after carrying out the following studies:
• Reconnaissance Survey
• Stakeholder consultation and surveys
• Case studies of best practices
• SWOT analysis
• Indicative Environmental & Social Impacts
• Project Financials
• Statutory and Legal Framework
Feasibility Report – Underground Drainage System of Tolankere Catchment area –Hubballi Dharwad Smart City Limited
Prepared for Hubballi Dharwad Smart City Limited Page 16 of 58
Refined methodology is followed in submitting the Project deliverables in accordance with the
following stages:
Deliverable 1: Feasibility Report
Deliverable 2: Draft DPR
Deliverable 3: Final DPR
2.5 Necessity of the project
The purpose of Smart Cities Mission is to drive economic growth and improve quality of life of
people. The Underground Drainage system of Tolankere lake catchment area is to arrest the lake
from being polluted due to improper underground drainage system in its catchment area; so that
the natural water body is free from pollutant. Presently, there is no existing STP in Tolankere
command area and there is existing sewer network of 21.2km which covers only 61% of the
existing road length of 34.2km. Due to non-availability of complete UGD system in the
command area; the waste water is getting mixed with the storm water drain and ultimately
finding its way into Tolankere lake by gravity. This intrusion of wastewater into the Lake is
polluting the water body; creating foul smell in the area and putting the natural environment at
stake. Hence, in the proposed project, it is intended to carry out the complete UGD
system improvement in the entire Tolankere catchment area by plugging the
missing link of 12km and directing all the waste water towards the Lake area. There
is a proposal for construction of one MLD STP (with tertiary treatment facilities) in the lake area
under AMRUT scheme. Integration of this STP (with SBR technology meeting the CPHEEO
standards for treated water effluent) with the proposed scheme can provide tertiary treated
water available for rejuvenating the water body throughout the year so that, the water body can
serve the dual purpose of triggering the ground water improvement; working as a natural
rainwater harvesting structure along with being used as water body recreational activity in terms
of boating system implementation in the pond area.
2.6 Project Description
The Project aims at up-gradation of complete Underground drainage system of Tolankere Lake
catchment (covering entire area of 176.8 Ha which comprises ABD area of 78.8Ha and non ABD
area of 98 Ha) of Hubballi. The major components identified are.
Carrying out UGD system analysis in the entire Catchment area of Tolankere Lake.
Identification and carrying out the design activity for plugging the missing links.
Assessment of waste water generation for the entire Catchment area
Integrating the proposed STP with the lake rejuvenation works
Rejuvenating Tolankere lake with tertiary treated water
Feasibility Report – Underground Drainage System of Tolankere Catchment area –Hubballi Dharwad Smart City Limited
Prepared for Hubballi Dharwad Smart City Limited Page 17 of 58
2.7 Industry Overview
Hubballi-Dharwad is the most urbanized area in north Karnataka. It is also known as the
commercial hub of North Karnataka region. The major contributors to economy of Hubballi-
Dharwad city are tertiary-based activities, namely, trade and commerce including agro-based
activities, transport and Education sector. Hubballi is the commercial hub and major economic
activities include industrial activities, trade and commerce. It has more than 3,000 small and
medium industries. Approximately 55% of the city„s population is involved in the tertiary
sector.
The railway workshop and Karnataka Central Co-operative Textile Mill were established in the
city during the British regime. A number of ginning and pressing units were established during
the early 20th century in the cotton belt region around it; the activity has gradually declined
due to export of cotton to Mumbai and other areas. There were 6 textile industries in Hubballi
including the Maratha Spinning and Weaving Mill. About 2,000 persons were employed in
these textile units. The railway workshop in Hubballi manufactures passenger coaches and
goods wagons. KSRTC has established its workshop in Hubballi and is engaged in body building
for buses belonging to the corporation.
The other modern industries in the area includes food processing, woodworking, steel
furniture, printing, domestic utensils, service industries, and miscellaneous units. The Hubballi
region is also known for its rich mineral deposits like manganese, iron and copper, but not in
sufficient quantity for economic exploitation. Industries are located along national highway,
station road, Koppikar Road, Neeligin Road, and Dajibanpeth area of Hubballi. There are more
than 3000 industries in Hubballi with 10 major industries.
There are 20 Medium & Large Scale Industries in and around Corporation limits with an
Investment of Rs.744.66 Crores providing employment to 7325 persons, Tata Marcopolo, Tata
Motors & Telcon, Bharath NRE Coke Ltd, ADM Agro Industries Ltd, Micro Finish Valves Ltd,
Mevin Mifrom Pvt Ltd, NGEF, Wier BDK, RSB Transmistion Ltd, VRL Logistics Pvt Ltd, Bellad
Group of Industries, are key industrial giants which are placed in and around the city
Corporation limit. The Large & Medium scale industries are engaged in production of Buses,
Electrical Motors & Centrifugal Pumps, Spinning Yarn Ceramic Tiles, M.S. Ignots and Castings,
Automobile Spares, Excavators, Machine Tools, Liquid Petroleum Gas Bottling Plant, Draw
Shaft Components etc, Industrial Valves and Machinery Components, Food Products like,
Mango Pulp & Juice are the major exportable items from Hubballi-Dharwad . A Software
Technology Park is functional in Hubballi, which has added to the district`s ability to cater to
the requirements of Information Technology and IT-enabled projects.
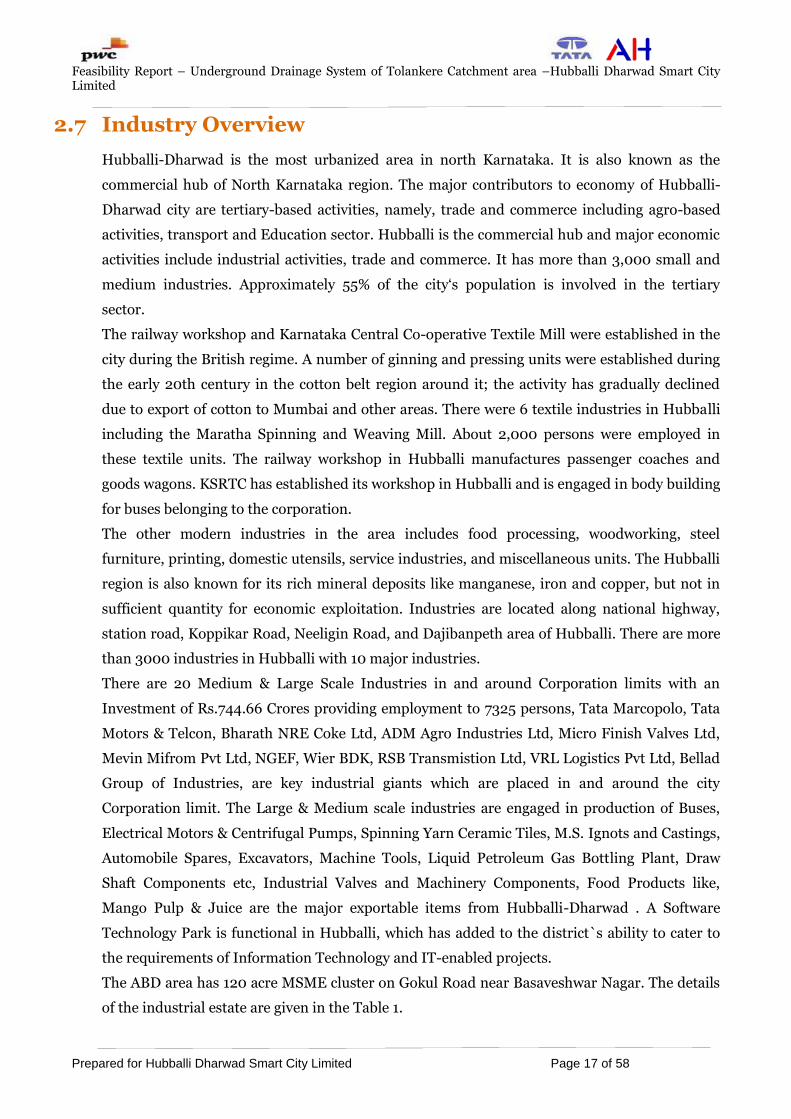
The ABD area has 120 acre MSME cluster on Gokul Road near Basaveshwar Nagar. The details
of the industrial estate are given in the Table 1.
Feasibility Report – Underground Drainage System of Tolankere Catchment area –Hubballi Dharwad Smart City Limited
Prepared for Hubballi Dharwad Smart City Limited Page 18 of 58
Table 1: Details of Industrial estate
N
o.
Industri
al Estate
Ye
ar
Land
acquir
ed (in
Acres
No.
of
she
ds
No. of
sheds
allott
ed
Vaca
nt
shed
s
No. of
sites
develope
d (in
Acres)
No. of
sites
allott
ed
No.
of
vaca
nt
sites
No. of
units
worki
ng
1 Gokul
and
M.T.Saga
r
Hubballi
1958
-
1994
Ist
stage
IInd
Stag
e
123.0
Acres
502 502 0 310 310 31
0
812
2.8 Regional Profile
Hubballi is located between 15° 11' - 15° 31' North Latitude and 75° 01' - 75° 28' East Longitude
at an altitude of 627.97m above sea level. Located at about 480 km north of Bangalore and
separated by a distance of 20 km, both the cities are connected to Pune and Bangalore by rail
network; other rail links connect the city with Hotgi, Sholapur, Marmagoa and Bellary. The twin
cities are also connected to Mumbai and Bangalore by Air. The city attracts floating population
from neighbouring urban centres such as Karwar and other towns from north Karnataka as well
as Dharwad district, for the purpose of trade and commerce, health, and education. It also
attracts population from across the district to avail the administrative services provided at
various district offices both in Hubballi and Dharwad. Hubballi is the educational hub of north
Karnataka and attracts population from the north Karnataka region for educational purpose.
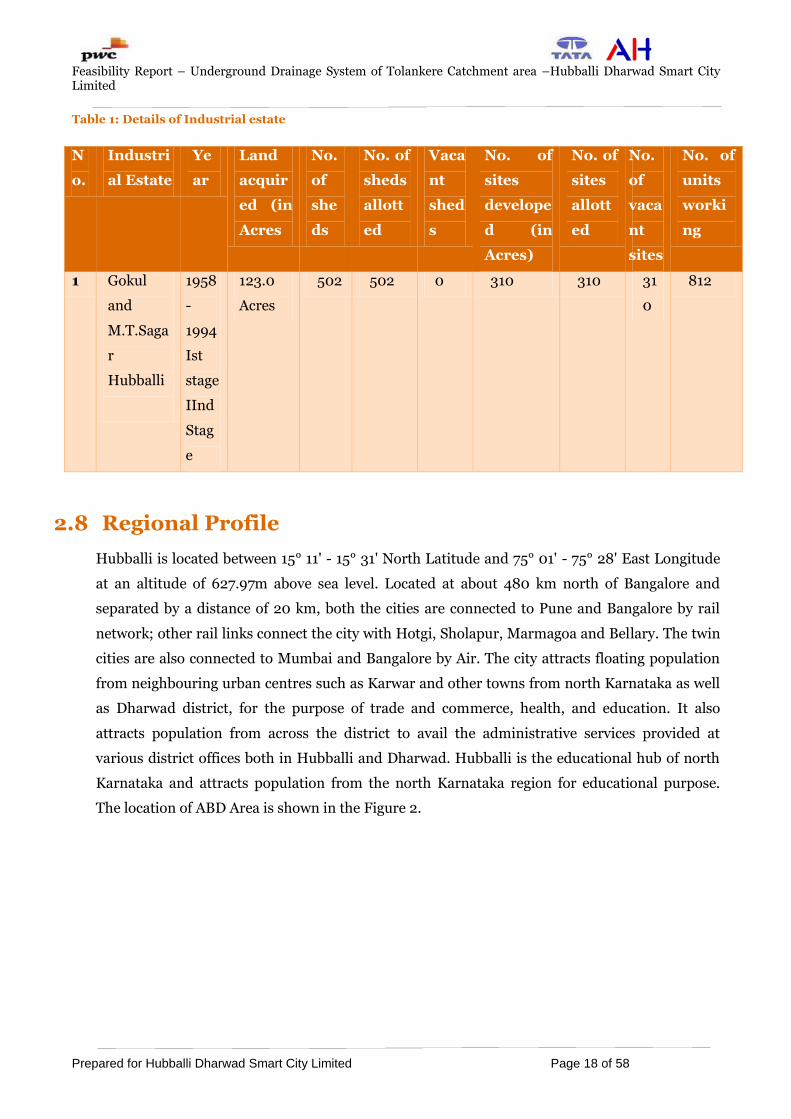
The location of ABD Area is shown in the Figure 2.
Feasibility Report – Underground Drainage System of Tolankere Catchment area –Hubballi Dharwad Smart City Limited
Prepared for Hubballi Dharwad Smart City Limited Page 19 of 58
Figure 2: Location of ABD area
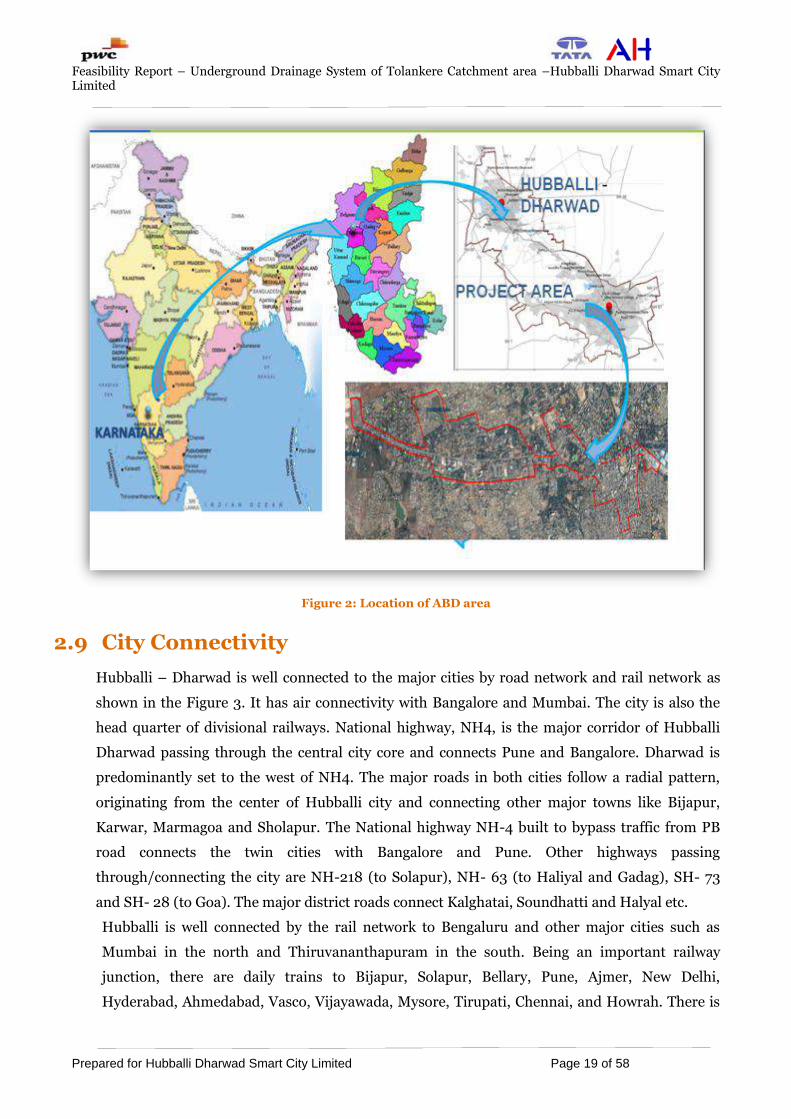
2.9 City Connectivity
Hubballi – Dharwad is well connected to the major cities by road network and rail network as
shown in the Figure 3. It has air connectivity with Bangalore and Mumbai. The city is also the
head quarter of divisional railways. National highway, NH4, is the major corridor of Hubballi
Dharwad passing through the central city core and connects Pune and Bangalore. Dharwad is
predominantly set to the west of NH4. The major roads in both cities follow a radial pattern,
originating from the center of Hubballi city and connecting other major towns like Bijapur,
Karwar, Marmagoa and Sholapur. The National highway NH-4 built to bypass traffic from PB
road connects the twin cities with Bangalore and Pune. Other highways passing
through/connecting the city are NH-218 (to Solapur), NH- 63 (to Haliyal and Gadag), SH- 73
and SH- 28 (to Goa). The major district roads connect Kalghatai, Soundhatti and Halyal etc.
Hubballi is well connected by the rail network to Bengaluru and other major cities such as
Mumbai in the north and Thiruvananthapuram in the south. Being an important railway
junction, there are daily trains to Bijapur, Solapur, Bellary, Pune, Ajmer, New Delhi,
Hyderabad, Ahmedabad, Vasco, Vijayawada, Mysore, Tirupati, Chennai, and Howrah. There is

Feasibility Report – Underground Drainage System of Tolankere Catchment area –Hubballi Dharwad Smart City Limited
Prepared for Hubballi Dharwad Smart City Limited Page 20 of 58
an operational airport in Hubbali. The airport is spread over an area of 369 acres and has one
runway of 1,670 m in length. The airport has all basic air navigation and night landing facilities
Figure 3: City connectivity
2.10 Climatic Conditions
The climate is divided into three distinct seasons: summer (from February to May), monsoon
(from June to September), and winter (from October to January). However, Dharwad enjoys a
better climate than Hubbali in view of its higher altitude. Hubballi-Dharwad experiences a
tropical climate with distinct wet and dry seasons. Owing to the location, Dharwad enjoys a
pleasant weather with moderate climate throughout the year. The coolest month is December
with an average low temperature of 15.4 °C and the hottest month is April with an average high
temperature of 32.8 °C. The region receives rainfall from both northeast and southwest
monsoons, and the wettest months are September and October. The average annual rainfall is
around 838 mm for Hubballi and 812 mm for Dharwad.
2.11 Land Use Pattern of the city
As per the comprehensive development plan, the percentage of land under residential use has
gone up from 25% to 31% between 1986 and 2000. However, this is still low compared to the
suggested norm of 35% to 40% of land under residential use, indicating the availability of
potential land for residential development. Growth in commercial land use is also not
happening as envisaged in the comprehensive development plan due to overcrowding in the
Feasibility Report – Underground Drainage System of Tolankere Catchment area –Hubballi Dharwad Smart City Limited
Prepared for Hubballi Dharwad Smart City Limited Page 21 of 58
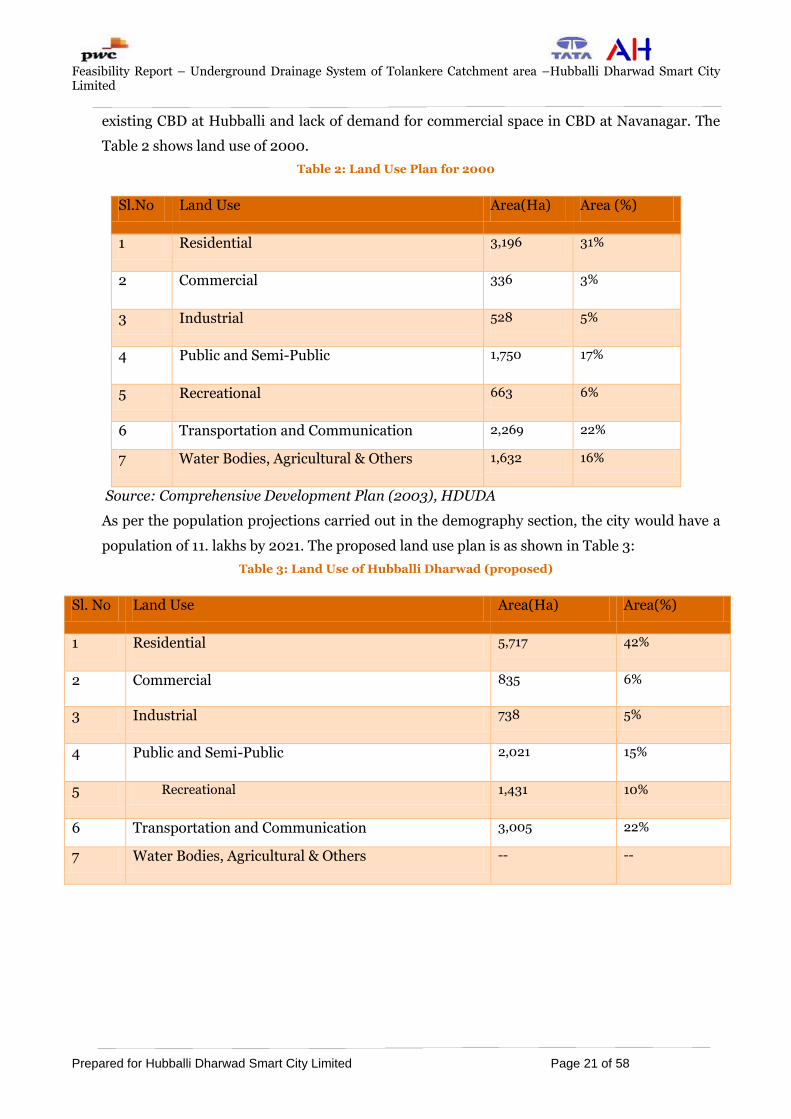
existing CBD at Hubballi and lack of demand for commercial space in CBD at Navanagar. The
Table 2 shows land use of 2000.
Table 2: Land Use Plan for 2000
Sl.No Land Use Area(Ha) Area (%)
1 Residential 3,196 31%
2 Commercial 336 3%
3 Industrial 528 5%
4 Public and Semi-Public 1,750 17%
5 Recreational 663 6%
6 Transportation and Communication 2,269 22%
7 Water Bodies, Agricultural & Others 1,632 16%
Source: Comprehensive Development Plan (2003), HDUDA
As per the population projections carried out in the demography section, the city would have a
population of 11. lakhs by 2021. The proposed land use plan is as shown in Table 3:
Table 3: Land Use of Hubballi Dharwad (proposed)
Sl. No Land Use Area(Ha) Area(%)
1 Residential 5,717 42%
2 Commercial 835 6%
3 Industrial 738 5%
4 Public and Semi-Public 2,021 15%
5 Recreational 1,431 10%
6 Transportation and Communication 3,005 22%
7 Water Bodies, Agricultural & Others -- --
Feasibility Report – Underground Drainage System of Tolankere Catchment area –Hubballi Dharwad Smart City Limited
Prepared for Hubballi Dharwad Smart City Limited Page 22 of 58
3. Existing System and its Analysis
3.1 Introduction
The Tolankere Lake is situated in Vivekananda Nagar and spreads over an area of 23 acres. It is
known as the second biggest lake of Hubbali after Unkal lake. It is surrounded by
Ramalingeshwar Nagar, Laxmi Nagar and Renuka Nagar on its boundaries. It is located at a
distance of 3.5 km from Hubbali- Dharwad Airport and at a distance of only 1 km from Gokul
Road.
The Hubballi Dharwad Municipal Corporation has partial underground drainage (UGD)
system. The existing underground drainage coverage is about 50% in Hubballi Dharwad. The
sewerage system covers 60% of Hubballi and 40% in Dharwad. The disposal of sewage is
partially getting discharged into natural streams in the absence of proper collection and
treatment facilities. The peripheral villages and revenue pockets included within the municipal
limits recently do not have access to sewerage system.
The length of existing sewerage network in Hubballi is 556 km covering an area of 54 sq. km.
The population covered by underground drainage network is 4.2 lakhs. The existing network
covers part of South Hubballi (Ward no. 40, 41, 52, 53, 54, 56, 57, 58, 64 and 61), west and
central Hubballi (Ward no. 34, 35, 36, 43, 44, 45, 57, 58 and 59). Most of the areas beyond the
railway line are not served by the sewerage network. As per the records available with
Municipal Corporation, 70% of the households are connected to the sewer network. Most of the
newly developed areas/extension areas along Gokul road, Navanagar, etc., are not served by the
sewer network and depend on septic tanks.
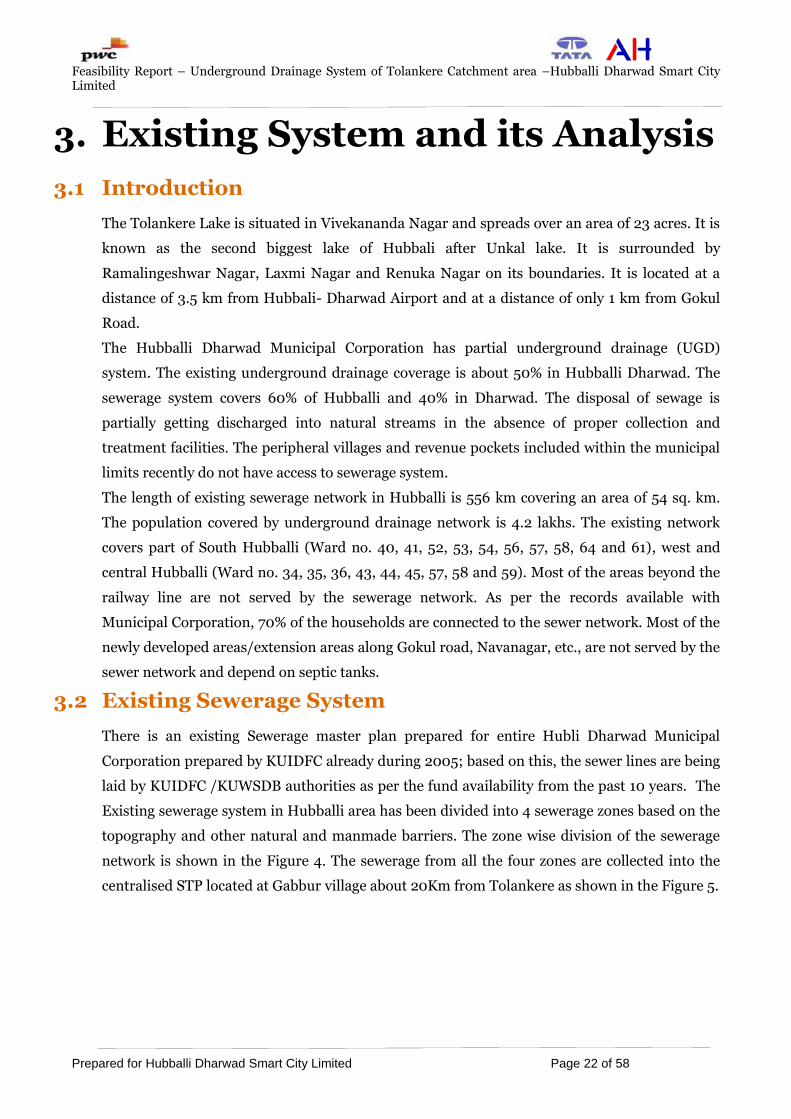
3.2 Existing Sewerage System
There is an existing Sewerage master plan prepared for entire Hubli Dharwad Municipal
Corporation prepared by KUIDFC already during 2005; based on this, the sewer lines are being
laid by KUIDFC /KUWSDB authorities as per the fund availability from the past 10 years. The
Existing sewerage system in Hubballi area has been divided into 4 sewerage zones based on the
topography and other natural and manmade barriers. The zone wise division of the sewerage
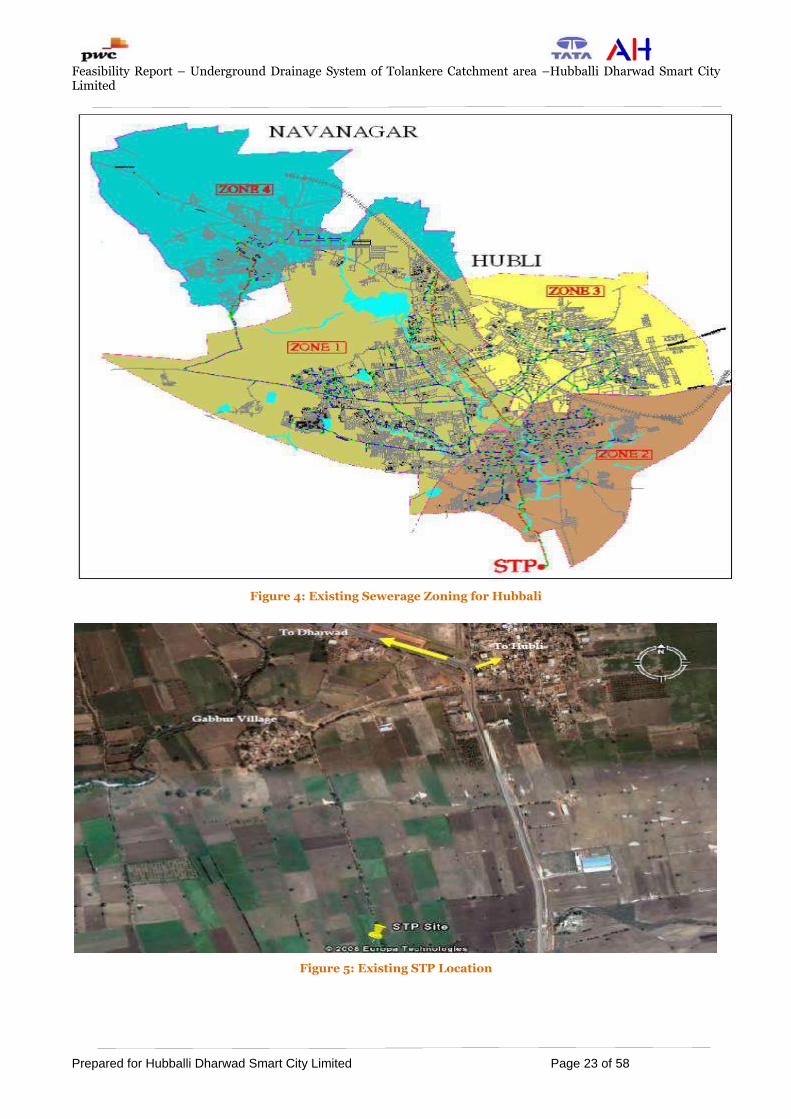
network is shown in the Figure 4. The sewerage from all the four zones are collected into the
centralised STP located at Gabbur village about 20Km from Tolankere as shown in the Figure 5.
Feasibility Report – Underground Drainage System of Tolankere Catchment area –Hubballi Dharwad Smart City Limited
Prepared for Hubballi Dharwad Smart City Limited Page 23 of 58
Figure 4: Existing Sewerage Zoning for Hubbali
Figure 5: Existing STP Location

Feasibility Report – Underground Drainage System of Tolankere Catchment area –Hubballi Dharwad Smart City Limited
Prepared for Hubballi Dharwad Smart City Limited Page 24 of 58
The Tolankere command area falls completely under Ward no 35 which is Zone 1 as per existing
Sewerage master plan. As per the 2011 census data, the population for Tolankere lake
catchment (ward no 35) is 17117 as shown in the table below. The ward wise population data of
HDMC as per 2011 census is provided in Table 4.
Table 4: Ward- wise Population of 2011 census
Ward
Nos.
Population 2011 Ward Nos. Population 2011
1 19478 35 17117
2 13835 36 17152
3 15414 37 21455
4 14523 38 19399
5 13499 39 15166
6 13855 40 14204
7 14650 41 12979
8 11962 42 14371
9 10735 43 13490
10 12996 44 13935
11 12892 45 8691
12 11254 46 11575
13 12901 47 16352
14 15742 48 9712
15 12571 49 15471
16 17950 50 11270
17 17074 51 11585
18 15712 52 10167
19 17604 53 11572
20 17329 54 10636
21 19715 55 12137
22 15125 56 9465
23 19152 57 10729
24 16800 58 11833
25 13904 59 8886
26 14391 60 16869
27 15479 61 11098
28 12721 62 13521
Feasibility Report – Underground Drainage System of Tolankere Catchment area –Hubballi Dharwad Smart City Limited
Prepared for Hubballi Dharwad Smart City Limited Page 25 of 58
29 19329 63 17698
30 18194 64 14260
31 12534 65 21588
32 12482 66 14972
33 11171 67 18803
34 19843 Total 970973
As per Existing Sewerage master plan the sewerage network is partially covering the project
area catchment. The sewerage network covers 21km which is 61% of the total road length of
34.2km present inside this Tolankere catchment area.
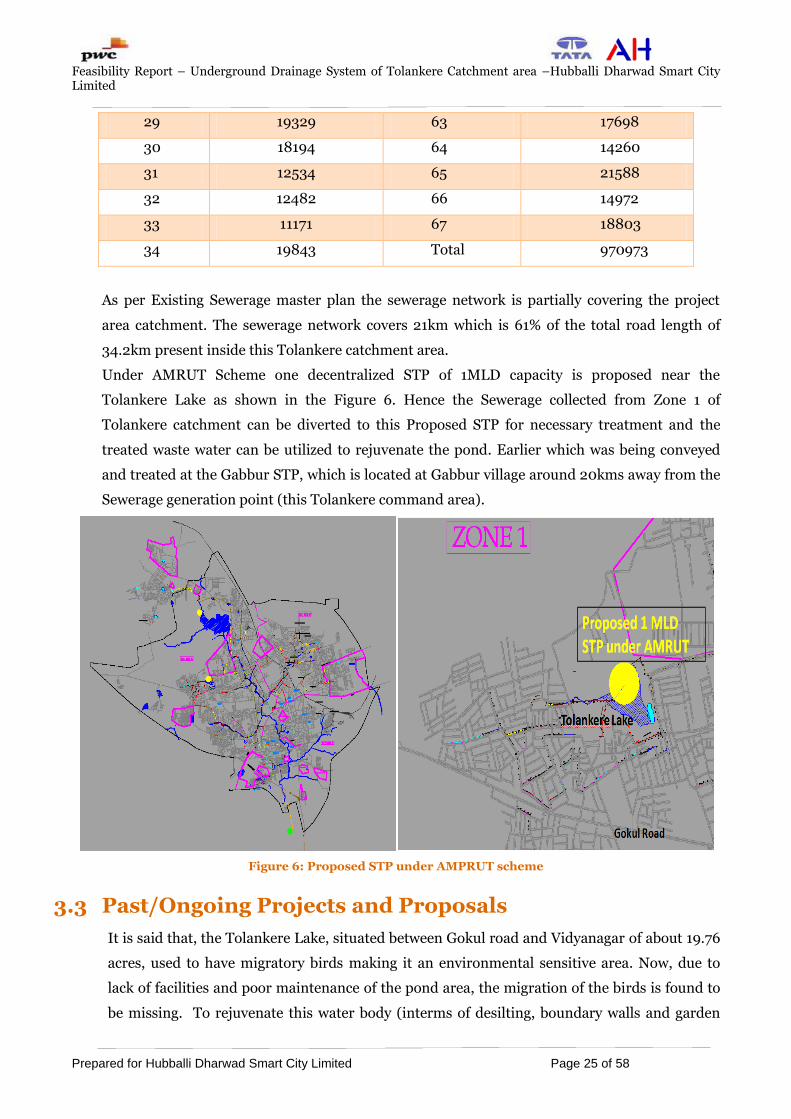
Under AMRUT Scheme one decentralized STP of 1MLD capacity is proposed near the
Tolankere Lake as shown in the Figure 6. Hence the Sewerage collected from Zone 1 of
Tolankere catchment can be diverted to this Proposed STP for necessary treatment and the
treated waste water can be utilized to rejuvenate the pond. Earlier which was being conveyed
and treated at the Gabbur STP, which is located at Gabbur village around 20kms away from the
Sewerage generation point (this Tolankere command area).
Figure 6: Proposed STP under AMPRUT scheme
3.3 Past/Ongoing Projects and Proposals
It is said that, the Tolankere Lake, situated between Gokul road and Vidyanagar of about 19.76
acres, used to have migratory birds making it an environmental sensitive area. Now, due to
lack of facilities and poor maintenance of the pond area, the migration of the birds is found to
be missing. To rejuvenate this water body (interms of desilting, boundary walls and garden
Feasibility Report – Underground Drainage System of Tolankere Catchment area –Hubballi Dharwad Smart City Limited
Prepared for Hubballi Dharwad Smart City Limited Page 26 of 58
development) and to bring back its original glory, Redevelopment of this lake is under progress
with separate funds by HDMC; 3.45 crore from MLA funds and Rs.100 crore grant from the
government.
Tourism department has plans to work on the bird sanctuary project here. To attract birds, an
island is intended to be created. Hubballi Dharwad Urban Development Authority is
association with HDMC intend to develop the lake. An amusement park for children with
boating is part of the plan.
One 1MLD STP with tertiary treatment facilities is intended to be constructed to arrest the
waste water flow into the pond under AMRUT scheme.
3.4 Existing Sewerage System Analysis
The condition of the existing sewerage system of the Tolankere lake are as follows -
As per Sewerage master plan for entire Hubli Dharwad Municipal Corporation, the
existing sewerage network was prepared by KUIDFC during 2005. The construction was
completed 5 years back.
The existing sewer network system doesn‟t cover the entire Tolankere lake catchment
area of road length of 34.2km. It only covers 21km which is just 61% of the total road
length.
The Sewer manholes nearby to the lake are not in good condition hence may allow waste
water to flow into the lake.
Presently, as there are no existing STP in Tolankere command area and due to non-
availability of complete UGD system in the command area; waste water is getting mixed
with the Storm water drain and ultimately finding its way into Tolankere lake by gravity.
The Tolankere lake was polluted due to the intrusion of sewerage but from last 2-3 years
irs completely dried up.
There is no Existing STP near the Tolankere command area and the sewerage from this
area is presently treated at Gabbur STP.
There is a proposal for construction of one MLD STP in the lake area under AMRUT
scheme.
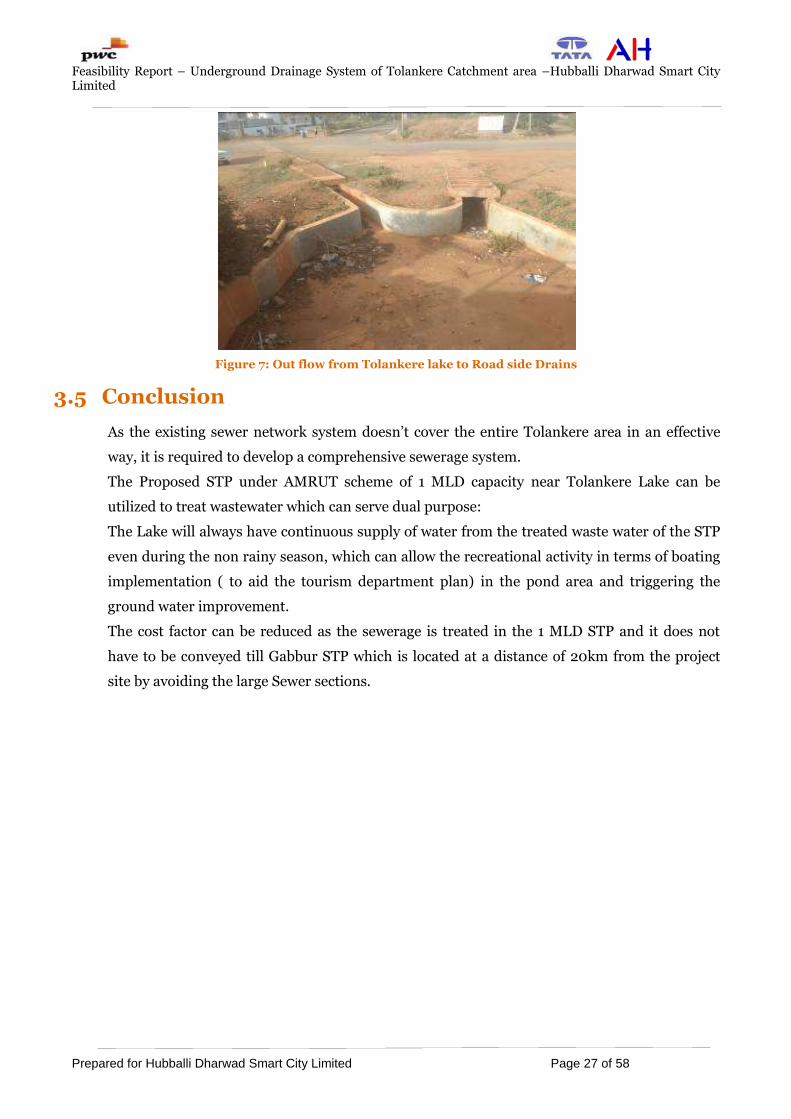
During rainy seasons, the lake overflows through the waste weir provided in the pond
which ultimately leads to the road side drains shown in the Figure 7.
Feasibility Report – Underground Drainage System of Tolankere Catchment area –Hubballi Dharwad Smart City Limited
Prepared for Hubballi Dharwad Smart City Limited Page 27 of 58
Figure 7: Out flow from Tolankere lake to Road side Drains
3.5 Conclusion
As the existing sewer network system doesn‟t cover the entire Tolankere area in an effective
way, it is required to develop a comprehensive sewerage system.
The Proposed STP under AMRUT scheme of 1 MLD capacity near Tolankere Lake can be
utilized to treat wastewater which can serve dual purpose:
The Lake will always have continuous supply of water from the treated waste water of the STP
even during the non rainy season, which can allow the recreational activity in terms of boating
implementation ( to aid the tourism department plan) in the pond area and triggering the
ground water improvement.
The cost factor can be reduced as the sewerage is treated in the 1 MLD STP and it does not
have to be conveyed till Gabbur STP which is located at a distance of 20km from the project
site by avoiding the large Sewer sections.
Feasibility Report – Underground Drainage System of Tolankere Catchment area –Hubballi Dharwad Smart City Limited
Prepared for Hubballi Dharwad Smart City Limited Page 28 of 58
4. Project
4.1 Project Components
The Tolankere Lake is one of second largest lake after Unkal lake in Hubballi Dharwad. The
Project components for the Underground Drainage System for Tolankere lake is the
development of UGD system in terms of the Sewerage network and Decentralized STP meeting
the requirements.
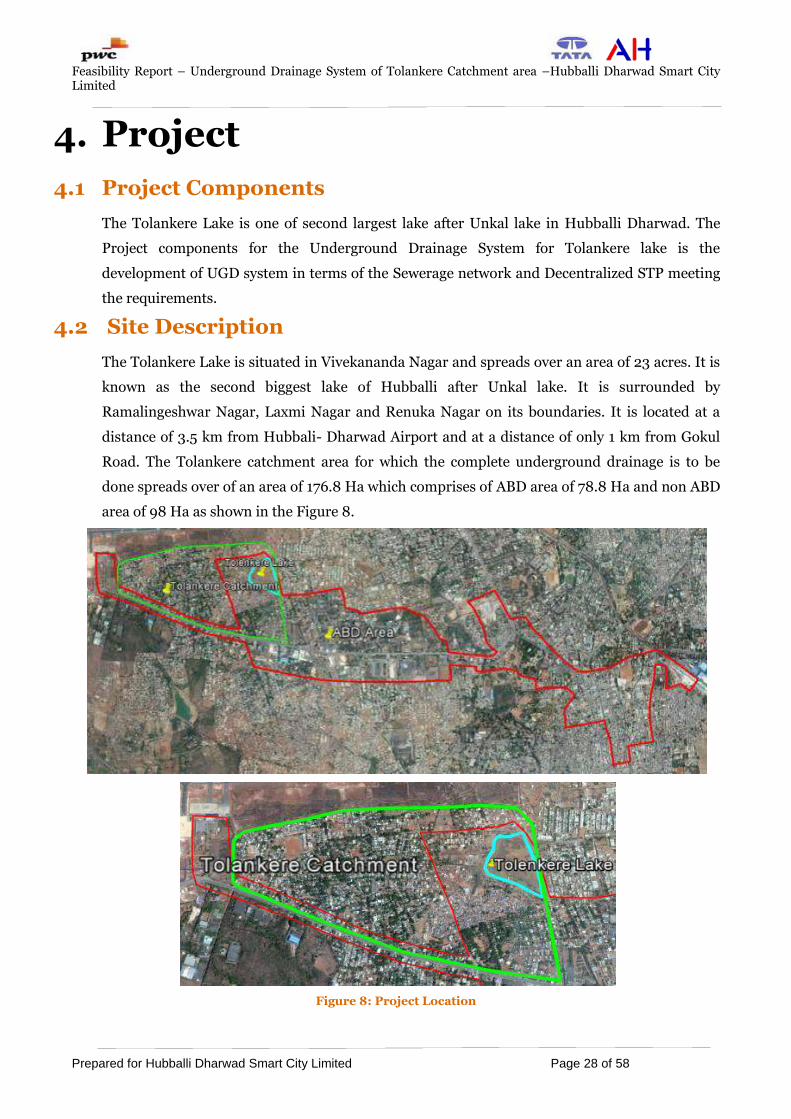
4.2 Site Description
The Tolankere Lake is situated in Vivekananda Nagar and spreads over an area of 23 acres. It is
known as the second biggest lake of Hubballi after Unkal lake. It is surrounded by
Ramalingeshwar Nagar, Laxmi Nagar and Renuka Nagar on its boundaries. It is located at a
distance of 3.5 km from Hubbali- Dharwad Airport and at a distance of only 1 km from Gokul
Road. The Tolankere catchment area for which the complete underground drainage is to be
done spreads over of an area of 176.8 Ha which comprises of ABD area of 78.8 Ha and non ABD
area of 98 Ha as shown in the Figure 8.
Figure 8: Project Location
Feasibility Report – Underground Drainage System of Tolankere Catchment area –Hubballi Dharwad Smart City Limited
Prepared for Hubballi Dharwad Smart City Limited Page 29 of 58
4.3 Site topography
The site topography is in such a way that Gokul road forms a ridge line and the site slopes on
both directions of the Gokul Road. From the area of Akshay Park Bus stop, the whole area slopes
towards Tolankere lake including Basaweshar Nagar and Ramalingeshwar Nagar. The whole
area of the South-east of Airport along with Renuka Nagar, Saraswati Pura and Central Excise
Colony slopes towards Tolenkere Lake. The overall drainage pattern of this area is from west to
east. The elevation varies from 647 to 620 m.
4.4 Site Reconnaissance
The consultant team has carried out reconnaissance survey in the Tolankere lake area of ABD
area. Drain mixed with waste water flows into the lake. The manholes nearby to the lake are in
worn-out condition, hence allowing waste water to flow into the lake.
The complete information on the existing system has been provided in the existing system
chapter. The efficiency in the existing system has been suitably analysed and necessary planning
has been made accordingly to make this project more viable in terms of the people‟s acceptance.
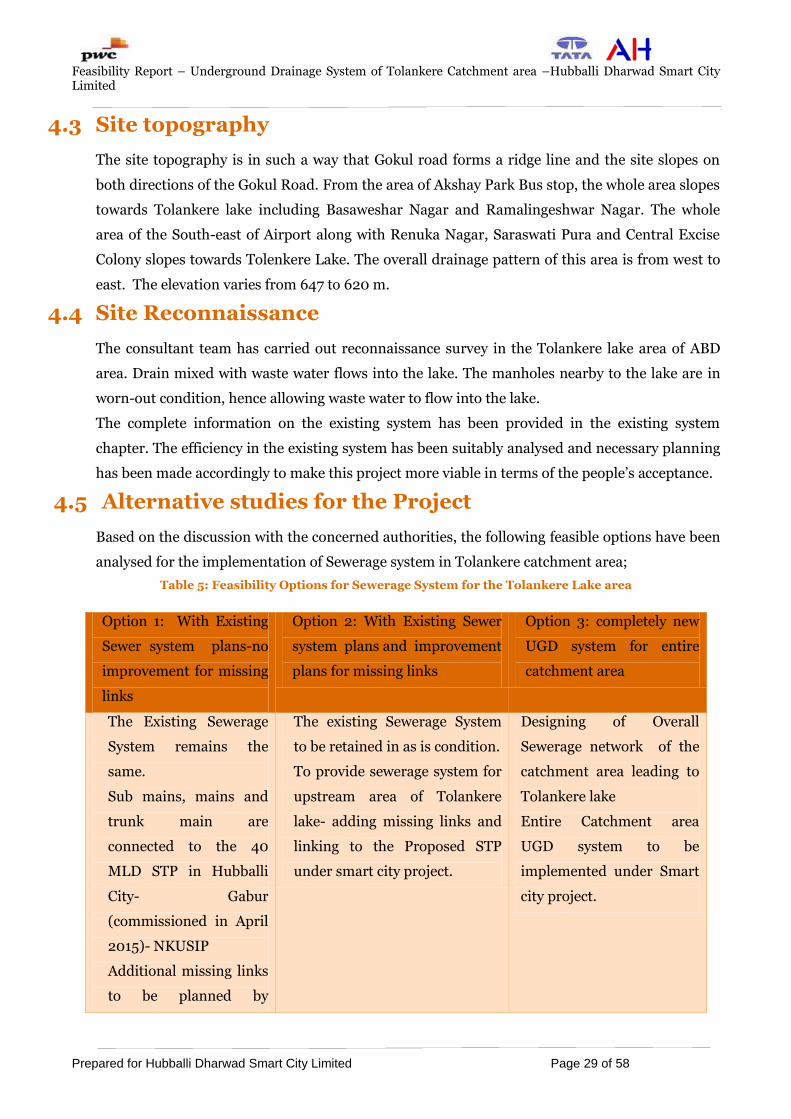
4.5 Alternative studies for the Project
Based on the discussion with the concerned authorities, the following feasible options have been
analysed for the implementation of Sewerage system in Tolankere catchment area;
Table 5: Feasibility Options for Sewerage System for the Tolankere Lake area
Option 1: With Existing
Sewer system plans-no
improvement for missing
links
Option 2: With Existing Sewer
system plans and improvement
plans for missing links
Option 3: completely new
UGD system for entire
catchment area
The Existing Sewerage
System remains the
same.
Sub mains, mains and
trunk main are
connected to the 40
MLD STP in Hubballi
City- Gabur
(commissioned in April
2015)- NKUSIP
Additional missing links
to be planned by
The existing Sewerage System
to be retained in as is condition.
To provide sewerage system for
upstream area of Tolankere
lake- adding missing links and
linking to the Proposed STP
under smart city project.
Designing of Overall
Sewerage network of the
catchment area leading to
Tolankere lake
Entire Catchment area
UGD system to be
implemented under Smart
city project.
Feasibility Report – Underground Drainage System of Tolankere Catchment area –Hubballi Dharwad Smart City Limited
Prepared for Hubballi Dharwad Smart City Limited Page 30 of 58
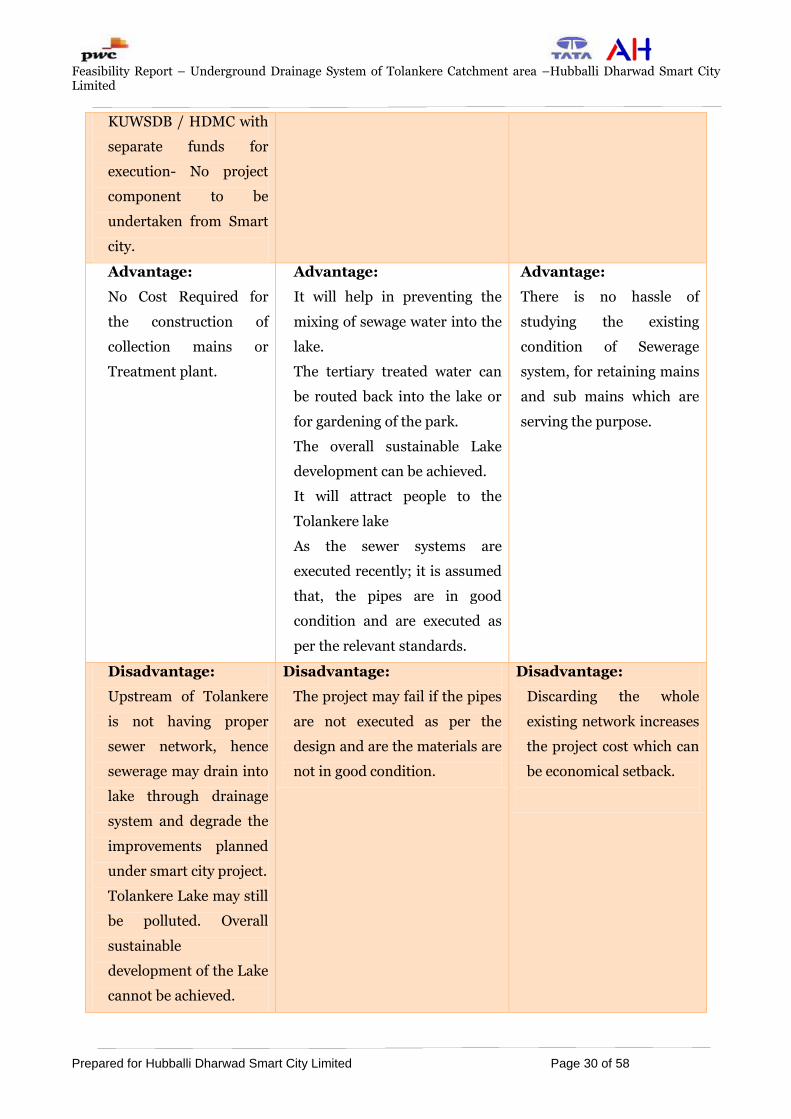
KUWSDB / HDMC with
separate funds for
execution- No project
component to be
undertaken from Smart
city.
Advantage:
No Cost Required for
the construction of
collection mains or
Treatment plant.
Advantage:
It will help in preventing the
mixing of sewage water into the
lake.
The tertiary treated water can
be routed back into the lake or
for gardening of the park.
The overall sustainable Lake
development can be achieved.
It will attract people to the
Tolankere lake
As the sewer systems are
executed recently; it is assumed
that, the pipes are in good
condition and are executed as
per the relevant standards.
Advantage:
There is no hassle of
studying the existing
condition of Sewerage
system, for retaining mains
and sub mains which are
serving the purpose.
Disadvantage:
Upstream of Tolankere
is not having proper
sewer network, hence
sewerage may drain into
lake through drainage
system and degrade the
improvements planned
under smart city project.
Tolankere Lake may still
be polluted. Overall
sustainable
development of the Lake
cannot be achieved.
Disadvantage:
The project may fail if the pipes
are not executed as per the
design and are the materials are
not in good condition.
Disadvantage:
Discarding the whole
existing network increases
the project cost which can
be economical setback.
Feasibility Report – Underground Drainage System of Tolankere Catchment area –Hubballi Dharwad Smart City Limited
Prepared for Hubballi Dharwad Smart City Limited Page 31 of 58
From the Table 5, it is clear that Option 2 is most feasible (technically and economically) among
all the other alternatives. As the UGD systems have been executed recently; based on the
discussions with the concerned authorities, it is assumed that; the execution has been carried
out as per the relevant designs and materials used are of the required standards as per the
relevant codes with quality execution. Hence, the existing system which was completed around
5 years before is proposed to be integrated in the further planning process.
4.6 Rainfall Analysis
4.6.1 Depth-Duration of Rainfall
Rainfall analysis is necessary to determine the magnitude of peak flow in the drains. The
intensity of rainfall decreases with duration. The critical duration of rainfall is that which
produces maximum runoff. This duration is equal to the time of concentration; since shorter
periods do not allow the whole area to contribute water and longer duration will give smaller
rainfall intensity.
Historic records of rainfall as required by the hydrologist are seldom available. With the
available data, one must estimate intensity, duration and frequency of storms. For Hubbali-
Dharwad City, the hourly rainfall data is not available. Recorded daily rainfall data since 1999
to 2016 from District Statistical Officer, Dharwad has been collected and has been presented in
Annexure-3. This data has been used for developing intensity-duration values for the desired
return period.
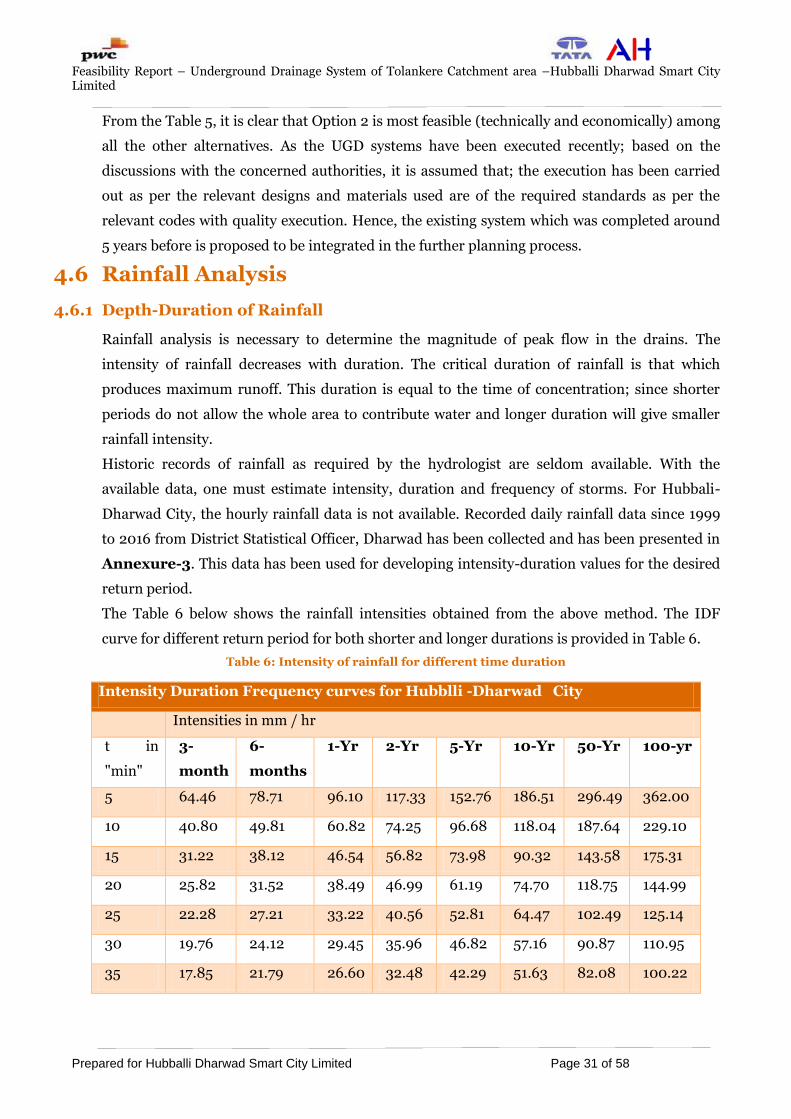
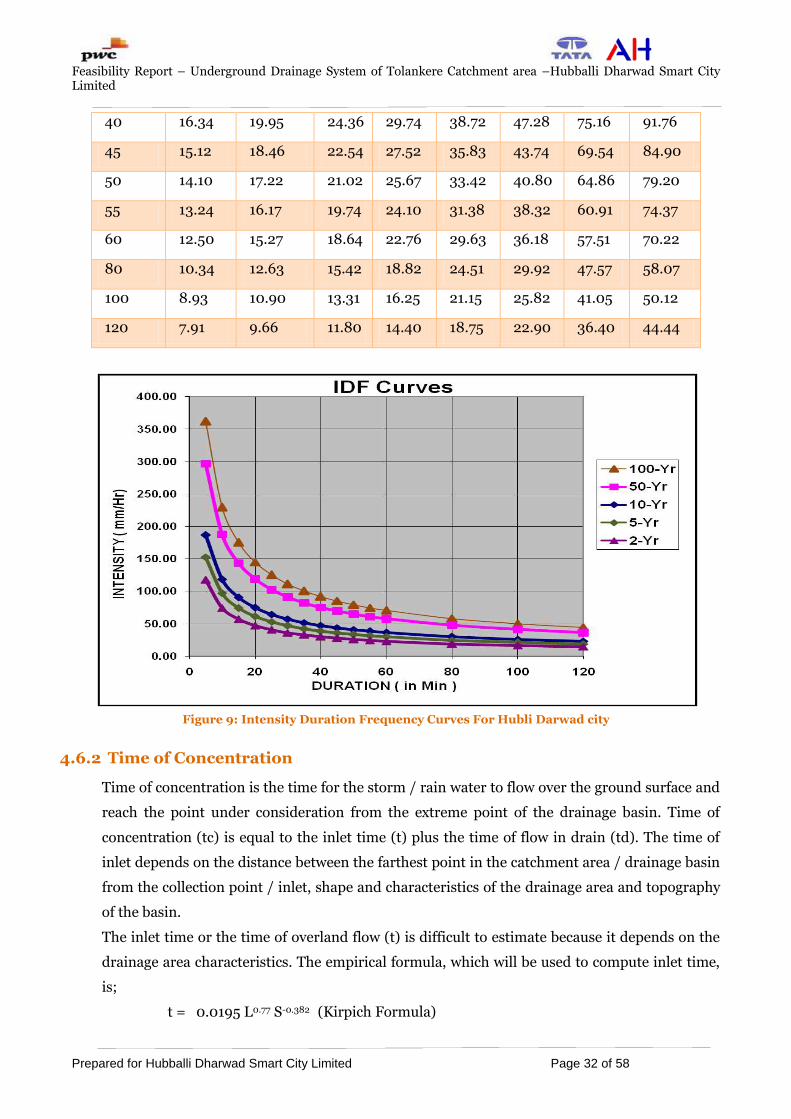
The Table 6 below shows the rainfall intensities obtained from the above method. The IDF
curve for different return period for both shorter and longer durations is provided in Table 6.
Table 6: Intensity of rainfall for different time duration
Intensity Duration Frequency curves for Hubblli -Dharwad City
Intensities in mm / hr
t in
"min"
3-
month
6-
months
1-Yr 2-Yr 5-Yr 10-Yr 50-Yr 100-yr
5 64.46 78.71 96.10 117.33 152.76 186.51 296.49 362.00
10 40.80 49.81 60.82 74.25 96.68 118.04 187.64 229.10
15 31.22 38.12 46.54 56.82 73.98 90.32 143.58 175.31
20 25.82 31.52 38.49 46.99 61.19 74.70 118.75 144.99
25 22.28 27.21 33.22 40.56 52.81 64.47 102.49 125.14
30 19.76 24.12 29.45 35.96 46.82 57.16 90.87 110.95
35 17.85 21.79 26.60 32.48 42.29 51.63 82.08 100.22
Feasibility Report – Underground Drainage System of Tolankere Catchment area –Hubballi Dharwad Smart City Limited
Prepared for Hubballi Dharwad Smart City Limited Page 32 of 58
40 16.34 19.95 24.36 29.74 38.72 47.28 75.16 91.76
45 15.12 18.46 22.54 27.52 35.83 43.74 69.54 84.90
50 14.10 17.22 21.02 25.67 33.42 40.80 64.86 79.20
55 13.24 16.17 19.74 24.10 31.38 38.32 60.91 74.37
60 12.50 15.27 18.64 22.76 29.63 36.18 57.51 70.22
80 10.34 12.63 15.42 18.82 24.51 29.92 47.57 58.07
100 8.93 10.90 13.31 16.25 21.15 25.82 41.05 50.12
120 7.91 9.66 11.80 14.40 18.75 22.90 36.40 44.44
Figure 9: Intensity Duration Frequency Curves For Hubli Darwad city
4.6.2 Time of Concentration
Time of concentration is the time for the storm / rain water to flow over the ground surface and
reach the point under consideration from the extreme point of the drainage basin. Time of
concentration (tc) is equal to the inlet time (t) plus the time of flow in drain (td). The time of
inlet depends on the distance between the farthest point in the catchment area / drainage basin
from the collection point / inlet, shape and characteristics of the drainage area and topography
of the basin.
The inlet time or the time of overland flow (t) is difficult to estimate because it depends on the
drainage area characteristics. The empirical formula, which will be used to compute inlet time,
is;
t = 0.0195 L0.77 S-0.382 (Kirpich Formula)

Feasibility Report – Underground Drainage System of Tolankere Catchment area –Hubballi Dharwad Smart City Limited
Prepared for Hubballi Dharwad Smart City Limited Page 33 of 58
Where,
t - Overland flow time in minutes
S - Slope
L - The maximum distance of travel of water along the watercourse in meter.
Table 7: Time of Concentration
Length of Farthest Point “L” (m) for the HDMC area
catchment
1540
Slope for the HDMC catchment “S” 0.02142
Time of Concentration “t”(min) 25
As per IDF Curve (Figure 20)
Rainfall Intensity mm/Hr 52.8
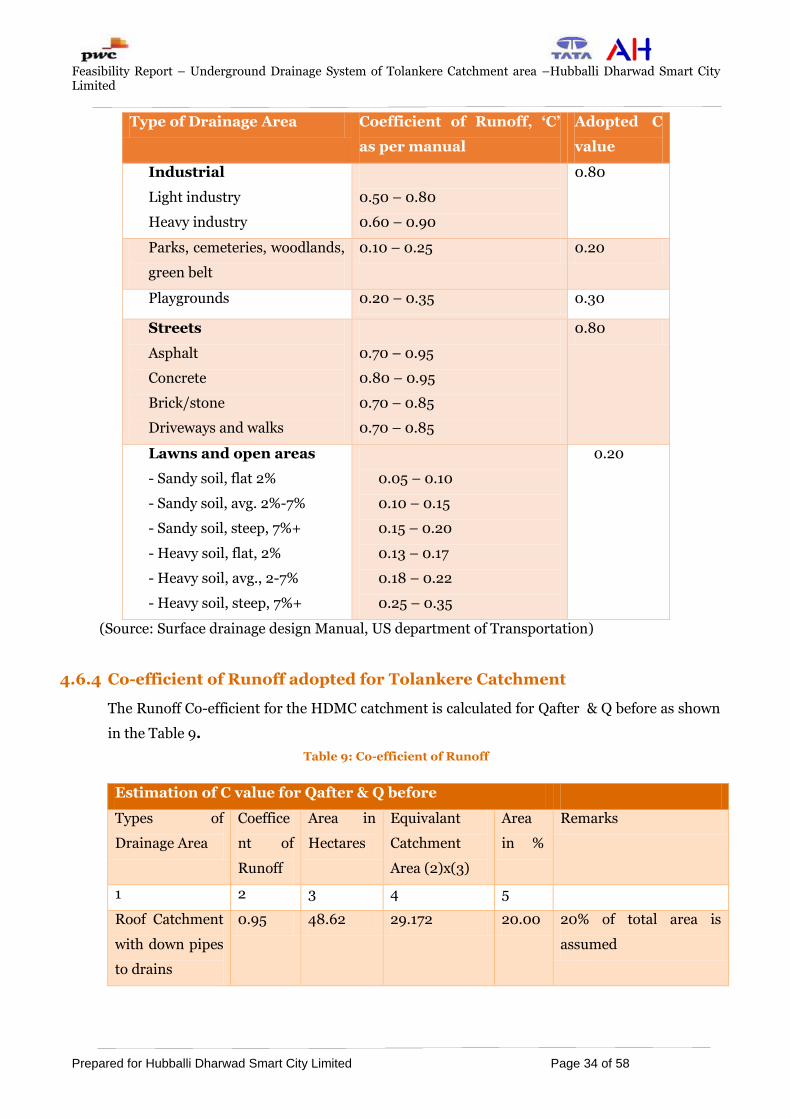
4.6.3 Co-efficient of Runoff
Co-efficient of runoff depends on the type of the basin and the quantum of rain/storm water,
which flows on the land and reaches the drain; this depends on the shape, size, slope and
imperviousness of the drainage area and also the duration of storm. Imperviousness of the
drainage area depends on the land use of that area; the land use could be classified as
residential/commercial/ or industrial, open spaces & grounds, gardens & parks etc.
Once the total contributory area for each section of the drain gets identified, percentage of the
above mentioned areas contributing the flows would be worked out and a weighted average /
composite coefficient of runoff would be arrived at.
For calculating the runoff coefficient, Land use map of the HDMC area will be used. The runoff
co-efficient, which will be used in the computation of weighted average runoff coefficient for
different sub catchments having different land-use, is provided in the Table 8.
Table 8: Co-Efficient of Runoff for Various Surfaces
Type of Drainage Area Coefficient of Runoff, ‘C’
as per manual
Adopted C
value
Residential
Single family areas
Multi units, detached
Multi units attached
Suburban / semi-rural
Apartment dwelling areas
0.30 – 0.50
0.40 – 0.60
0.60 – 0.75
0.25 – 0.40
0.50 – 0.70
0.55
Feasibility Report – Underground Drainage System of Tolankere Catchment area –Hubballi Dharwad Smart City Limited
Prepared for Hubballi Dharwad Smart City Limited Page 34 of 58
Type of Drainage Area Coefficient of Runoff, ‘C’
as per manual
Adopted C
value
Industrial
Light industry
Heavy industry
0.50 – 0.80
0.60 – 0.90
0.80
Parks, cemeteries, woodlands,
green belt
0.10 – 0.25 0.20
Playgrounds 0.20 – 0.35 0.30
Streets
Asphalt
Concrete
Brick/stone
Driveways and walks
0.70 – 0.95
0.80 – 0.95
0.70 – 0.85
0.70 – 0.85
0.80
Lawns and open areas
- Sandy soil, flat 2%
- Sandy soil, avg. 2%-7%
- Sandy soil, steep, 7%+
- Heavy soil, flat, 2%
- Heavy soil, avg., 2-7%
- Heavy soil, steep, 7%+
0.05 – 0.10
0.10 – 0.15
0.15 – 0.20
0.13 – 0.17
0.18 – 0.22
0.25 – 0.35
0.20
(Source: Surface drainage design Manual, US department of Transportation)
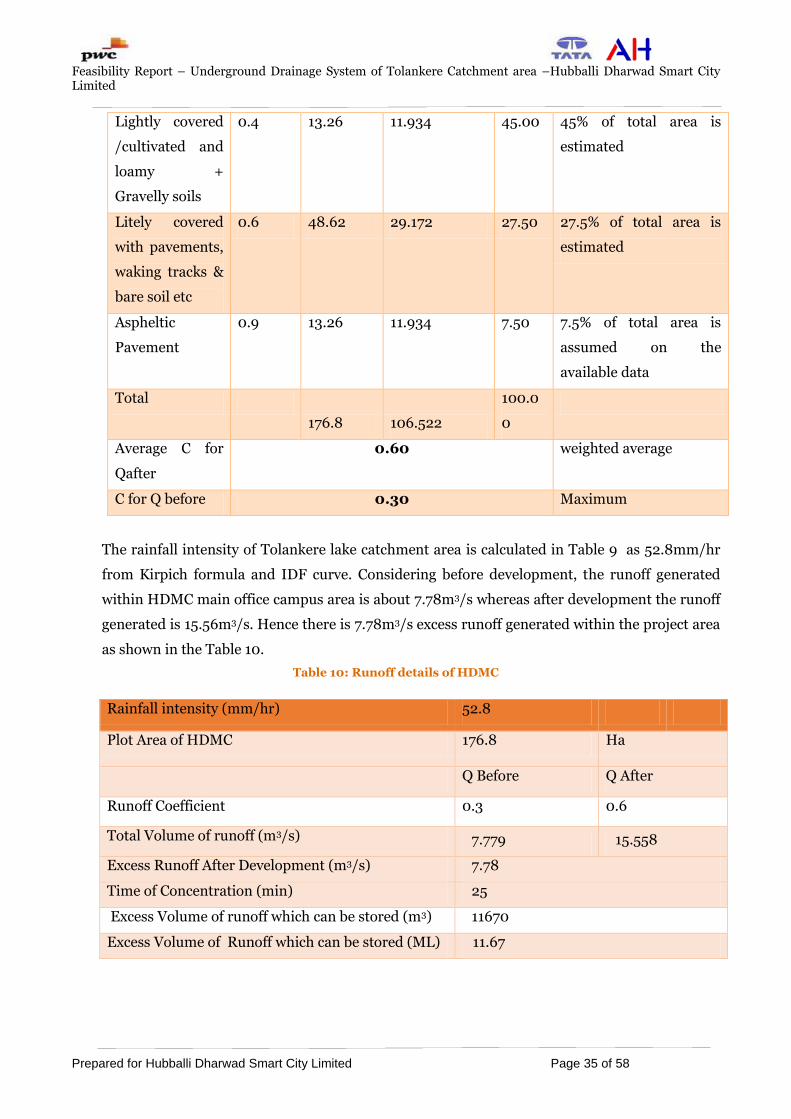
4.6.4 Co-efficient of Runoff adopted for Tolankere Catchment
The Runoff Co-efficient for the HDMC catchment is calculated for Qafter & Q before as shown
in the Table 9.
Table 9: Co-efficient of Runoff
Estimation of C value for Qafter & Q before
Types of
Drainage Area
Coeffice
nt of
Runoff
Area in
Hectares
Equivalant
Catchment
Area (2)x(3)
Area
in %
Remarks
1 2 3 4 5
Roof Catchment
with down pipes
to drains
0.95 48.62 29.172 20.00 20% of total area is
assumed
Feasibility Report – Underground Drainage System of Tolankere Catchment area –Hubballi Dharwad Smart City Limited
Prepared for Hubballi Dharwad Smart City Limited Page 35 of 58
Lightly covered
/cultivated and
loamy +
Gravelly soils
0.4 13.26 11.934 45.00 45% of total area is
estimated
Litely covered
with pavements,
waking tracks &
bare soil etc
0.6 48.62 29.172 27.50 27.5% of total area is
estimated
Aspheltic
Pavement
0.9 13.26 11.934 7.50 7.5% of total area is
assumed on the
available data
Total
176.8 106.522
100.0
0
Average C for
Qafter
0.60 weighted average
C for Q before 0.30 Maximum
The rainfall intensity of Tolankere lake catchment area is calculated in Table 9 as 52.8mm/hr
from Kirpich formula and IDF curve. Considering before development, the runoff generated
within HDMC main office campus area is about 7.78m3/s whereas after development the runoff
generated is 15.56m3/s. Hence there is 7.78m3/s excess runoff generated within the project area
as shown in the Table 10.
Table 10: Runoff details of HDMC
Rainfall intensity (mm/hr) 52.8
Plot Area of HDMC 176.8 Ha
Q Before Q After
Runoff Coefficient 0.3 0.6
Total Volume of runoff (m3/s) 7.779 15.558
Excess Runoff After Development (m3/s) 7.78
Time of Concentration (min) 25
Excess Volume of runoff which can be stored (m3) 11670
Excess Volume of Runoff which can be stored (ML) 11.67
Feasibility Report – Underground Drainage System of Tolankere Catchment area –Hubballi Dharwad Smart City Limited
Prepared for Hubballi Dharwad Smart City Limited Page 36 of 58
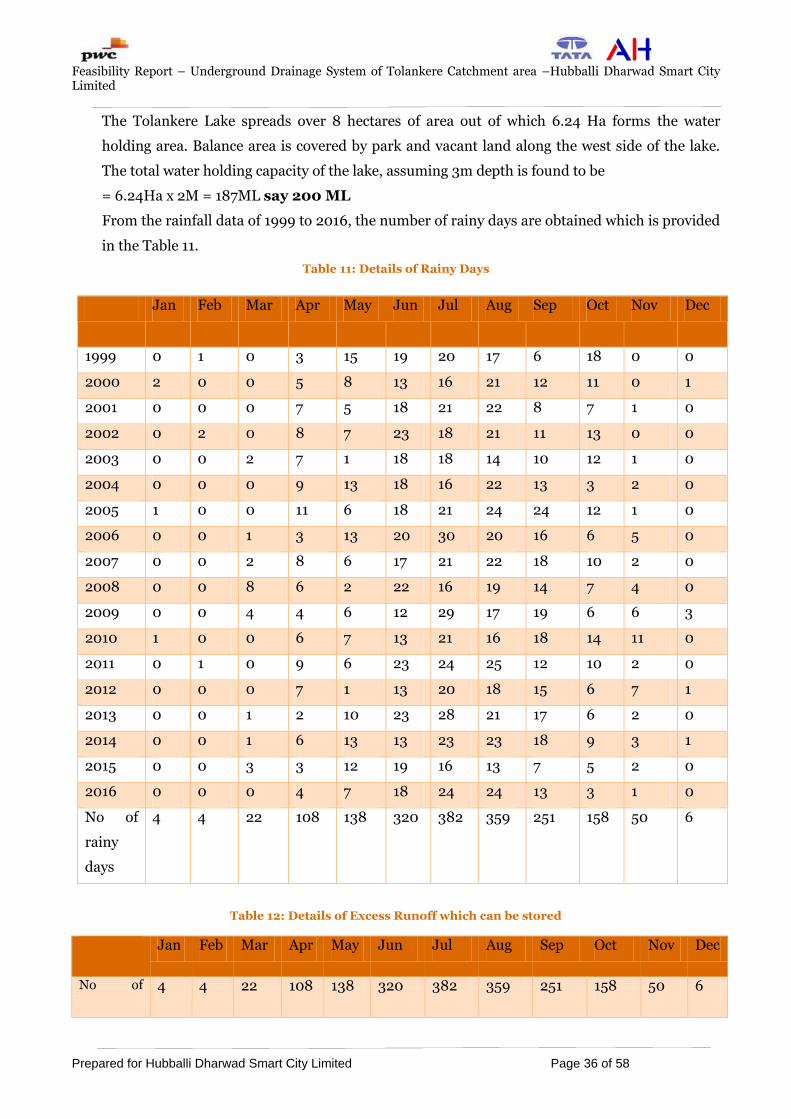
The Tolankere Lake spreads over 8 hectares of area out of which 6.24 Ha forms the water
holding area. Balance area is covered by park and vacant land along the west side of the lake.
The total water holding capacity of the lake, assuming 3m depth is found to be
= 6.24Ha x 2M = 187ML say 200 ML
From the rainfall data of 1999 to 2016, the number of rainy days are obtained which is provided
in the Table 11.
Table 11: Details of Rainy Days
Table 12: Details of Excess Runoff which can be stored
Jan Feb Mar Apr May Jun Jul Aug Sep Oct Nov Dec
No of 4 4 22 108 138 320 382 359 251 158 50 6
Jan Feb Mar Apr May Jun Jul Aug Sep Oct Nov Dec
1999 0 1 0 3 15 19 20 17 6 18 0 0
2000 2 0 0 5 8 13 16 21 12 11 0 1
2001 0 0 0 7 5 18 21 22 8 7 1 0
2002 0 2 0 8 7 23 18 21 11 13 0 0
2003 0 0 2 7 1 18 18 14 10 12 1 0
2004 0 0 0 9 13 18 16 22 13 3 2 0
2005 1 0 0 11 6 18 21 24 24 12 1 0
2006 0 0 1 3 13 20 30 20 16 6 5 0
2007 0 0 2 8 6 17 21 22 18 10 2 0
2008 0 0 8 6 2 22 16 19 14 7 4 0
2009 0 0 4 4 6 12 29 17 19 6 6 3
2010 1 0 0 6 7 13 21 16 18 14 11 0
2011 0 1 0 9 6 23 24 25 12 10 2 0
2012 0 0 0 7 1 13 20 18 15 6 7 1
2013 0 0 1 2 10 23 28 21 17 6 2 0
2014 0 0 1 6 13 13 23 23 18 9 3 1
2015 0 0 3 3 12 19 16 13 7 5 2 0
2016 0 0 0 4 7 18 24 24 13 3 1 0
No of
rainy
days
4 4 22 108 138 320 382 359 251 158 50 6

Feasibility Report – Underground Drainage System of Tolankere Catchment area –Hubballi Dharwad Smart City Limited
Prepared for Hubballi Dharwad Smart City Limited Page 37 of 58
rainy days
Average of
rainy days
(consideri
ng past 18
years
data)
0.2
2
0.2
2
1.22 6.0
0
7.67 17.78 21.22 19.94 13.94 8.78 2.78 0.3
3
Excess
Volume of
Runoff
which can
be stored
(ML)
2.5
9
2.5
9
14.2
6
70.
02
89.4
7
207.4
7
247.6
6
232.7
5
162.7
3
102.4
4
32.4
2
3.8
9
Table 13: Details of Evaporational and Percolation losses
Evaporational losses 6.26 mm/day
NICRA report, Pg 26,
Table 3 (for bellary) 0.1878 m/month
Percolation losses 30 L/m2/day IS : 2470 (part 2)- 1985
,Page 8, Fig 1 0.9099 m/month
From the Table 12, it is clear that the excess runoff from the Tolankere lake catchment which
can be collected and stored in the Tolankere lake is not sufficient throughout the year. Also
Considering the Evaporation and Filtration losses provided in Table 13, the lake will be dried up
from the month of November to March.
Hence by providing tertiary treated wastewater from the proposed STP under AMRUT scheme
(near the Tolankere lake) to the Tolankere lake will be sufficient to meet the losses occurring in
the Tolankere Lake. It can be ensured that the Tolankere Lake can be filled with water
throughout the year ; and hence can be used for any Water recreational activity.
The remaining treated waste water from the proposed STP can be conveyed to the Industrial
area nearby the Tolankere catchment area. Hence, this can be treated as a separate project.
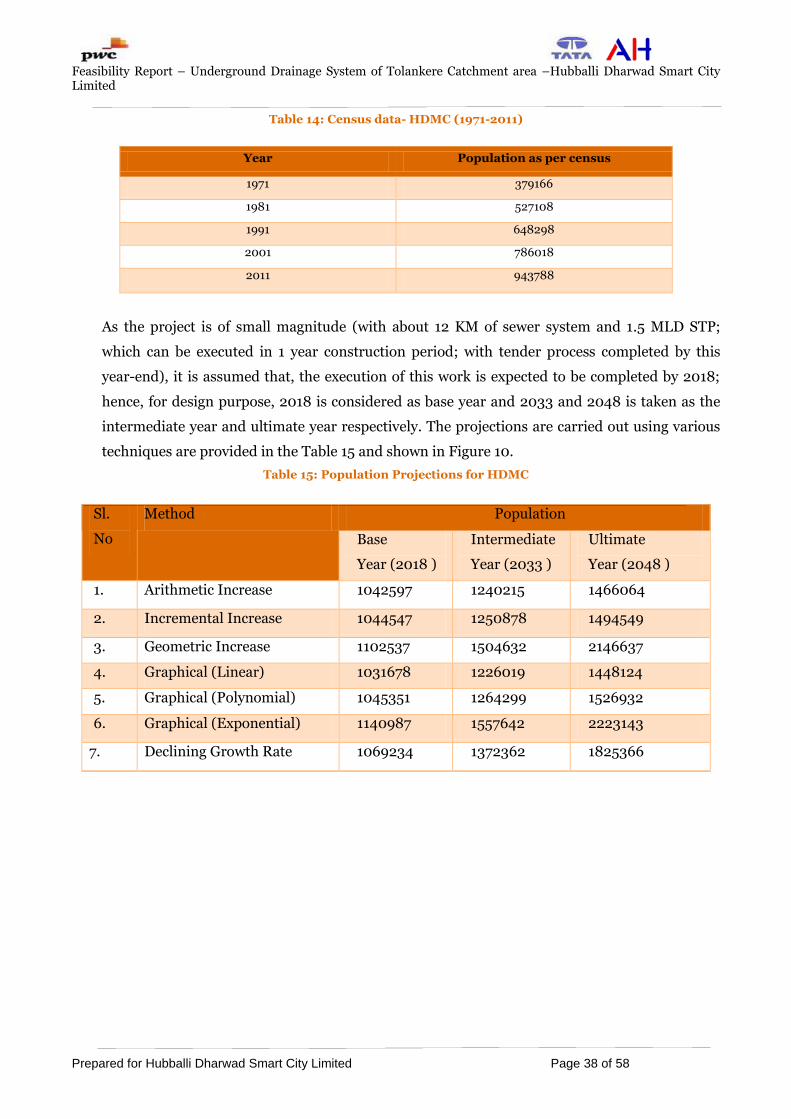
4.7 Population Projection
The past census data for HDMC Corporation in last 5 decades has been collected from the
relevant authorities and have been provided in Table 14:
Feasibility Report – Underground Drainage System of Tolankere Catchment area –Hubballi Dharwad Smart City Limited
Prepared for Hubballi Dharwad Smart City Limited Page 38 of 58
Table 14: Census data- HDMC (1971-2011)
Year Population as per census
1971 379166
1981 527108
1991 648298
2001 786018
2011 943788
As the project is of small magnitude (with about 12 KM of sewer system and 1.5 MLD STP;
which can be executed in 1 year construction period; with tender process completed by this
year-end), it is assumed that, the execution of this work is expected to be completed by 2018;
hence, for design purpose, 2018 is considered as base year and 2033 and 2048 is taken as the
intermediate year and ultimate year respectively. The projections are carried out using various
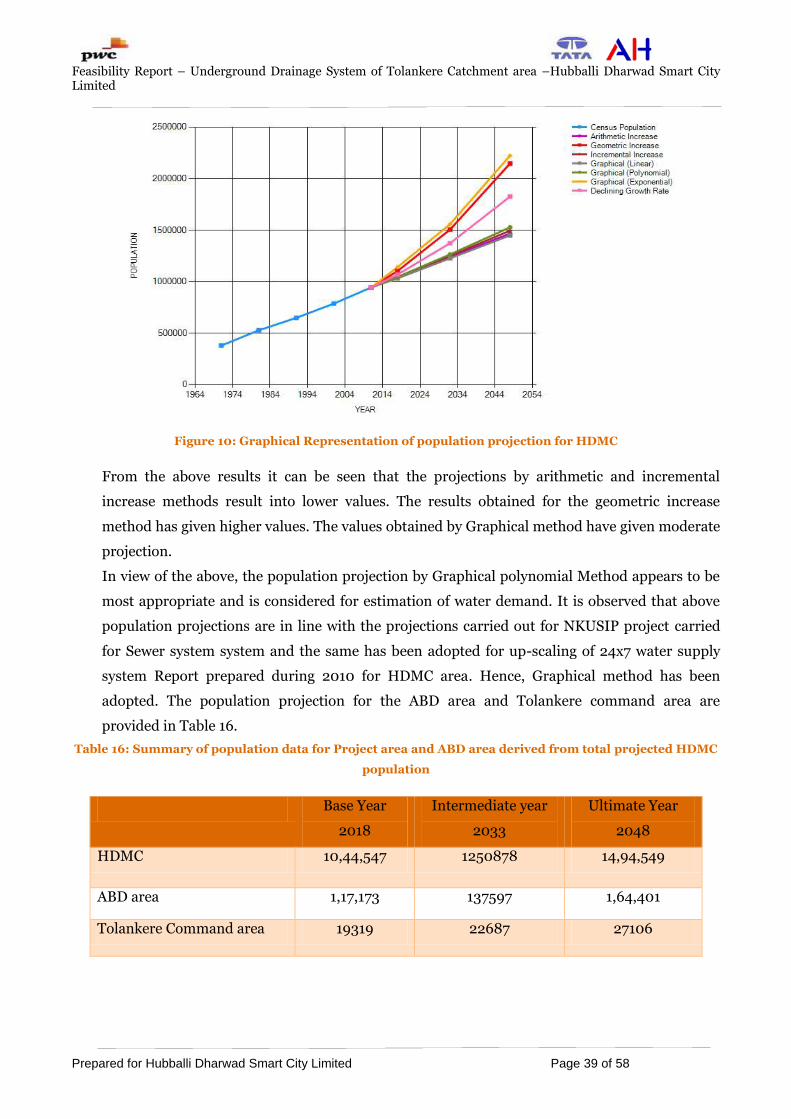
techniques are provided in the Table 15 and shown in Figure 10.
Table 15: Population Projections for HDMC
Sl.
No
Method Population
Base
Year (2018 )
Intermediate
Year (2033 )
Ultimate
Year (2048 )
1. Arithmetic Increase 1042597 1240215 1466064
2. Incremental Increase 1044547 1250878 1494549
3. Geometric Increase 1102537 1504632 2146637
4. Graphical (Linear) 1031678 1226019 1448124
5. Graphical (Polynomial) 1045351 1264299 1526932
6. Graphical (Exponential) 1140987 1557642 2223143
7. Declining Growth Rate 1069234 1372362 1825366
Feasibility Report – Underground Drainage System of Tolankere Catchment area –Hubballi Dharwad Smart City Limited
Prepared for Hubballi Dharwad Smart City Limited Page 39 of 58
Figure 10: Graphical Representation of population projection for HDMC
From the above results it can be seen that the projections by arithmetic and incremental
increase methods result into lower values. The results obtained for the geometric increase
method has given higher values. The values obtained by Graphical method have given moderate
projection.
In view of the above, the population projection by Graphical polynomial Method appears to be
most appropriate and is considered for estimation of water demand. It is observed that above
population projections are in line with the projections carried out for NKUSIP project carried
for Sewer system system and the same has been adopted for up-scaling of 24x7 water supply
system Report prepared during 2010 for HDMC area. Hence, Graphical method has been
adopted. The population projection for the ABD area and Tolankere command area are
provided in Table 16.
Table 16: Summary of population data for Project area and ABD area derived from total projected HDMC
population
Base Year
2018
Intermediate year
2033
Ultimate Year
2048
HDMC 10,44,547 1250878 14,94,549
ABD area 1,17,173 137597 1,64,401
Tolankere Command area 19319 22687 27106

Feasibility Report – Underground Drainage System of Tolankere Catchment area –Hubballi Dharwad Smart City Limited
Prepared for Hubballi Dharwad Smart City Limited Page 40 of 58
4.8 Proposed sewerage system
Balance Sewerage network of 12.0 Km is proposed to cover the entire Tolankere command area
along with existing network of 21km (Zone 1 of Sewage Master Plan) of ward no 35 so that
sewerage can be collected in an integrated manner and conveyed to proposed STP for the
treatment before discharging into Tolankere Lake. The Proposed network covers the entire
tolankere lake catchment which is outside the ABD area too.
Table 17: Summary of Waste water generated in Tolankere command area
Year Base year
2018
Intermediate
year 2033
Ultimate year
2048
Population 19319 22687 27106
Per Capita Supply of Water
(lpcd)
135 135 135
Sewerage Generated (MLD)-
80% of water supply
2.086 2.45 2.93
Infiltration (10%) 0.2086 0.25 0.29
Total Sewerage Generated
(MLD)
2.30 2.70 3.22
The Sewerage generated for base year, Intermediate year and ultimate year are 2.30MLD,
2.7MLD and 3.2 MLD respectively as shown in the Table 17. Since there is already a proposal for
construction of decentralized STP of 1 MLD under AMRUT scheme near the Tolankere as
discussed in the Existing System chapter, it is suggest to increase the STP capacity to additional
1.5MLD (to the proposed 1 MLD STP under AMRUT scheme) to serve the demand for the
Intermediate year (with 10% of overloading on the existing STP).
The existing sewer networks and that of the proposed sewer networks in Tolankere catchment
area is shown in Figure 11.

Feasibility Report – Underground Drainage System of Tolankere Catchment area –Hubballi Dharwad Smart City Limited
Prepared for Hubballi Dharwad Smart City Limited Page 41 of 58
Figure 11: Proposed Sewerage network
The wastewater generated from the proposed STP can be treated completely and the treated
waste water can be disposed off safely into the lake.
4.8.1. Design approach for proposed sewerage zone
The sewerage system is designed using Bentley Sewer GEMS V8i version software. The sewage
from the individual Houses will be collected and conveyed to STP site by gravity. The capacities
of proposed STP are finalized based on the flows expected.
In the proposed system, laterals are proposed along the roads to collect sewage from Individual
houses and it is connected to branch sewers. Branch sewers are joined to trunk sewers and
finally to trunk main.
The circular manholes are proposed at all the junctions, change of diameters, and change in pipe
gradients and on straight run of sewer at 30m interval for proposed sewer network pipes of
lesser diameter of 200mm. Drop manholes are proposed where the difference between invert
level of lateral / branch sewer and maximum water level (at design peak flows) of main sewer is
more than 600mm.
The system has been checked and tried to maintain minimum self cleansing velocity. Where ever
the velocity is less than the self-cleansing velocity, flushing will be considered as per the
CPHEEO manual.
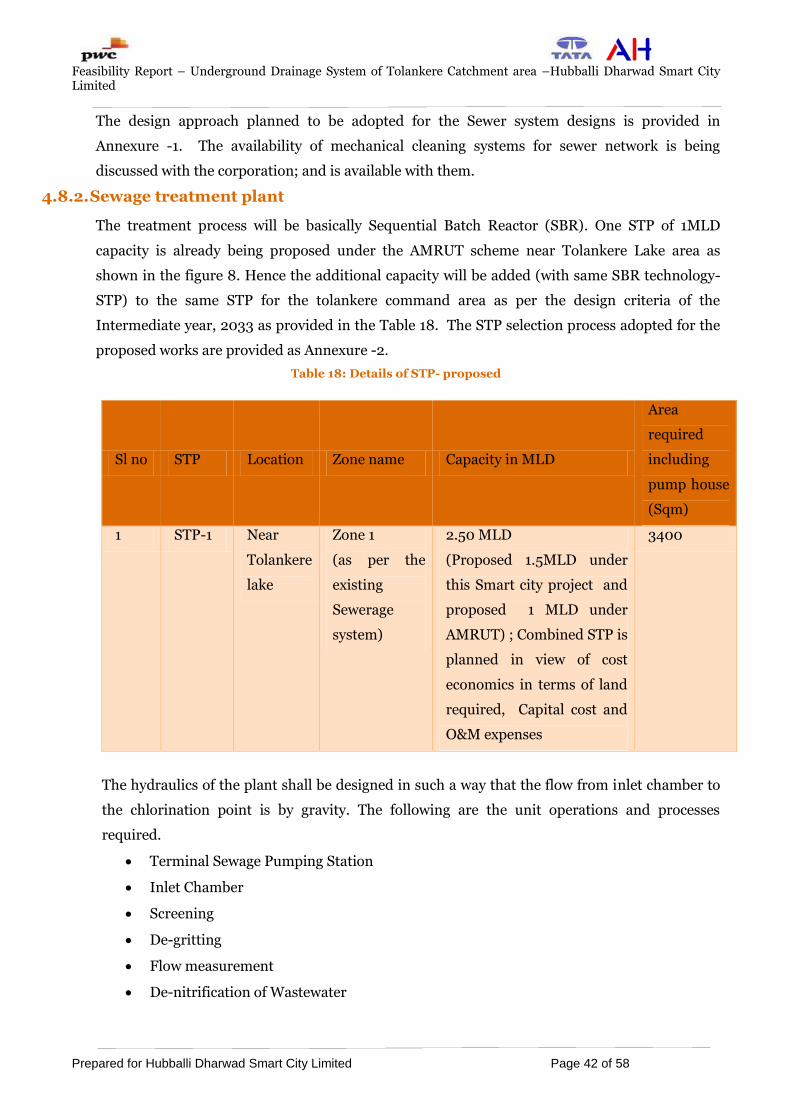
Feasibility Report – Underground Drainage System of Tolankere Catchment area –Hubballi Dharwad Smart City Limited
Prepared for Hubballi Dharwad Smart City Limited Page 42 of 58
The design approach planned to be adopted for the Sewer system designs is provided in
Annexure -1. The availability of mechanical cleaning systems for sewer network is being
discussed with the corporation; and is available with them.
4.8.2. Sewage treatment plant
The treatment process will be basically Sequential Batch Reactor (SBR). One STP of 1MLD
capacity is already being proposed under the AMRUT scheme near Tolankere Lake area as
shown in the figure 8. Hence the additional capacity will be added (with same SBR technology-
STP) to the same STP for the tolankere command area as per the design criteria of the
Intermediate year, 2033 as provided in the Table 18. The STP selection process adopted for the
proposed works are provided as Annexure -2.
Table 18: Details of STP- proposed
Sl no STP Location Zone name Capacity in MLD
Area
required
including
pump house
(Sqm)
1 STP-1 Near
Tolankere
lake
Zone 1
(as per the
existing
Sewerage
system)
2.50 MLD
(Proposed 1.5MLD under
this Smart city project and
proposed 1 MLD under
AMRUT) ; Combined STP is
planned in view of cost
economics in terms of land
required, Capital cost and
O&M expenses
3400
The hydraulics of the plant shall be designed in such a way that the flow from inlet chamber to
the chlorination point is by gravity. The following are the unit operations and processes
required.
Terminal Sewage Pumping Station
Inlet Chamber
Screening
De-gritting
Flow measurement
De-nitrification of Wastewater
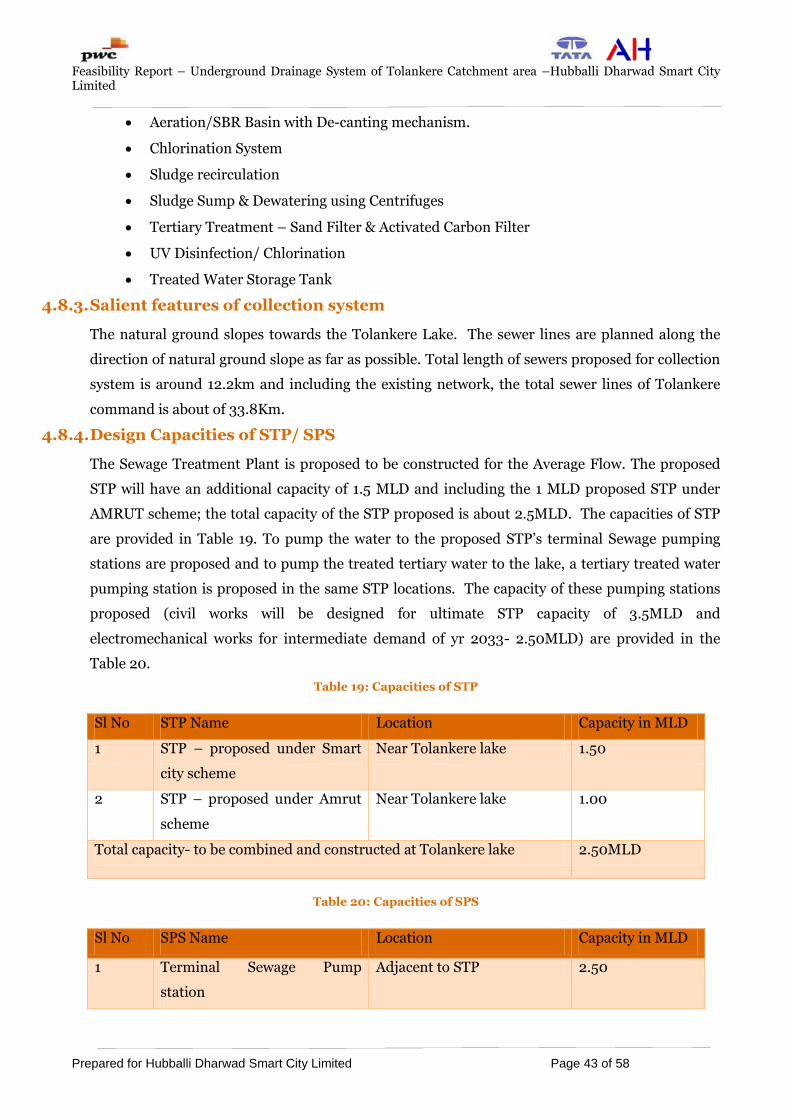
Feasibility Report – Underground Drainage System of Tolankere Catchment area –Hubballi Dharwad Smart City Limited
Prepared for Hubballi Dharwad Smart City Limited Page 43 of 58
Aeration/SBR Basin with De-canting mechanism.
Chlorination System
Sludge recirculation
Sludge Sump & Dewatering using Centrifuges
Tertiary Treatment – Sand Filter & Activated Carbon Filter
UV Disinfection/ Chlorination
Treated Water Storage Tank
4.8.3. Salient features of collection system
The natural ground slopes towards the Tolankere Lake. The sewer lines are planned along the
direction of natural ground slope as far as possible. Total length of sewers proposed for collection
system is around 12.2km and including the existing network, the total sewer lines of Tolankere
command is about of 33.8Km.
4.8.4. Design Capacities of STP/ SPS
The Sewage Treatment Plant is proposed to be constructed for the Average Flow. The proposed
STP will have an additional capacity of 1.5 MLD and including the 1 MLD proposed STP under
AMRUT scheme; the total capacity of the STP proposed is about 2.5MLD. The capacities of STP
are provided in Table 19. To pump the water to the proposed STP‟s terminal Sewage pumping
stations are proposed and to pump the treated tertiary water to the lake, a tertiary treated water
pumping station is proposed in the same STP locations. The capacity of these pumping stations
proposed (civil works will be designed for ultimate STP capacity of 3.5MLD and
electromechanical works for intermediate demand of yr 2033- 2.50MLD) are provided in the
Table 20.
Table 19: Capacities of STP
Sl No STP Name Location Capacity in MLD
1 STP – proposed under Smart
city scheme
Near Tolankere lake 1.50
2 STP – proposed under Amrut
scheme
Near Tolankere lake 1.00
Total capacity- to be combined and constructed at Tolankere lake 2.50MLD
Table 20: Capacities of SPS
Sl No SPS Name Location Capacity in MLD
1 Terminal Sewage Pump
station
Adjacent to STP 2.50
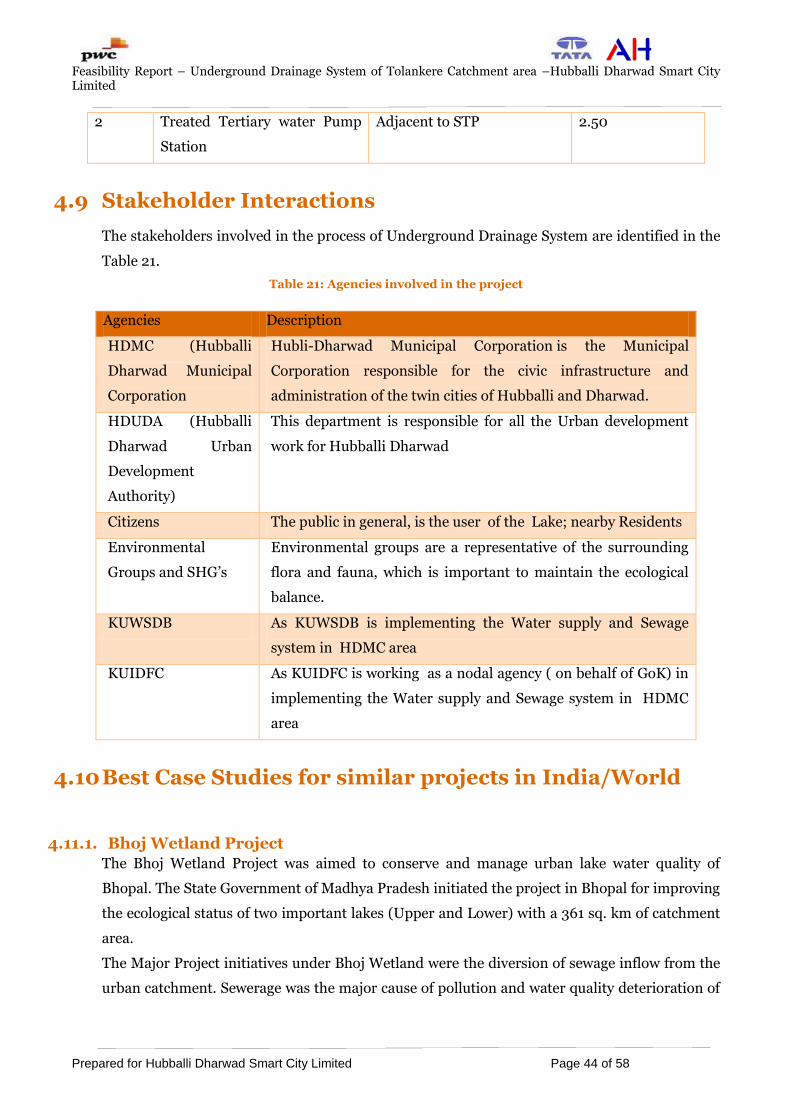
Feasibility Report – Underground Drainage System of Tolankere Catchment area –Hubballi Dharwad Smart City Limited
Prepared for Hubballi Dharwad Smart City Limited Page 44 of 58
2 Treated Tertiary water Pump
Station
Adjacent to STP 2.50
4.9 Stakeholder Interactions
The stakeholders involved in the process of Underground Drainage System are identified in the
Table 21.
Table 21: Agencies involved in the project
Agencies Description
HDMC (Hubballi
Dharwad Municipal
Corporation
Hubli-Dharwad Municipal Corporation is the Municipal
Corporation responsible for the civic infrastructure and
administration of the twin cities of Hubballi and Dharwad.
HDUDA (Hubballi
Dharwad Urban
Development
Authority)
This department is responsible for all the Urban development
work for Hubballi Dharwad
Citizens The public in general, is the user of the Lake; nearby Residents
Environmental
Groups and SHG‟s
Environmental groups are a representative of the surrounding
flora and fauna, which is important to maintain the ecological
balance.
KUWSDB As KUWSDB is implementing the Water supply and Sewage
system in HDMC area
KUIDFC As KUIDFC is working as a nodal agency ( on behalf of GoK) in
implementing the Water supply and Sewage system in HDMC
area
4.10 Best Case Studies for similar projects in India/World
4.11.1. Bhoj Wetland Project
The Bhoj Wetland Project was aimed to conserve and manage urban lake water quality of
Bhopal. The State Government of Madhya Pradesh initiated the project in Bhopal for improving
the ecological status of two important lakes (Upper and Lower) with a 361 sq. km of catchment
area.
The Major Project initiatives under Bhoj Wetland were the diversion of sewage inflow from the
urban catchment. Sewerage was the major cause of pollution and water quality deterioration of
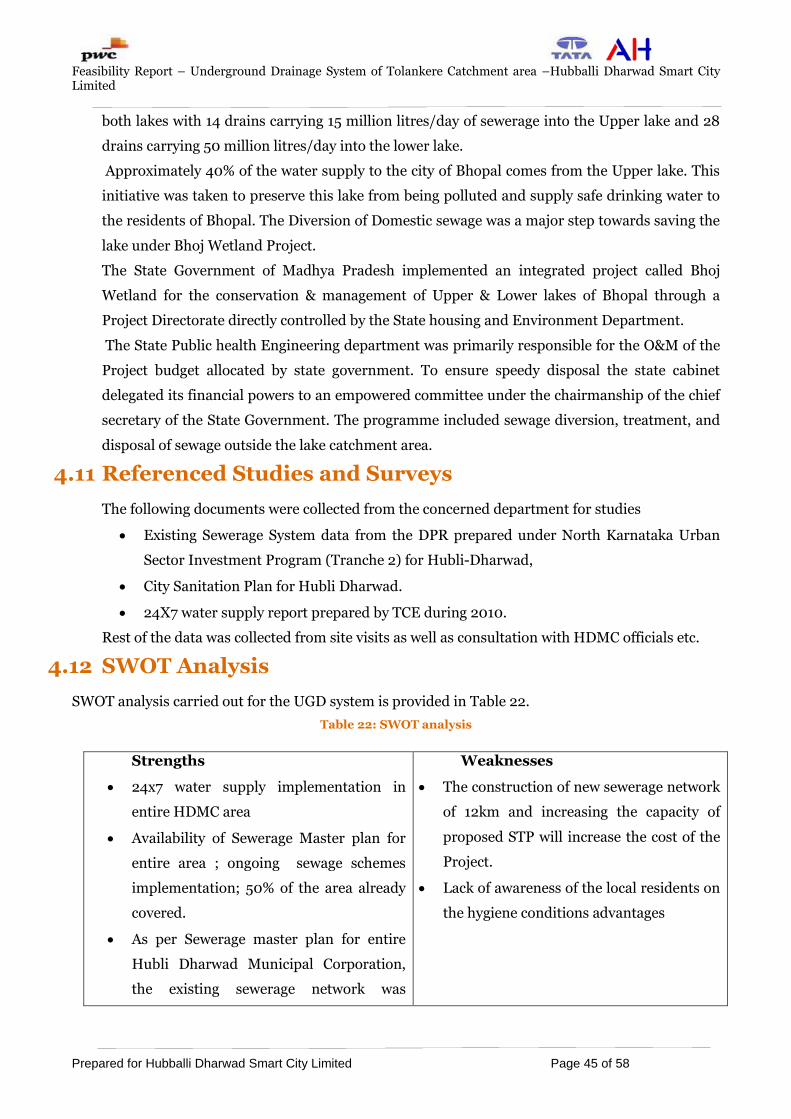
Feasibility Report – Underground Drainage System of Tolankere Catchment area –Hubballi Dharwad Smart City Limited
Prepared for Hubballi Dharwad Smart City Limited Page 45 of 58
both lakes with 14 drains carrying 15 million litres/day of sewerage into the Upper lake and 28
drains carrying 50 million litres/day into the lower lake.
Approximately 40% of the water supply to the city of Bhopal comes from the Upper lake. This
initiative was taken to preserve this lake from being polluted and supply safe drinking water to
the residents of Bhopal. The Diversion of Domestic sewage was a major step towards saving the
lake under Bhoj Wetland Project.
The State Government of Madhya Pradesh implemented an integrated project called Bhoj
Wetland for the conservation & management of Upper & Lower lakes of Bhopal through a
Project Directorate directly controlled by the State housing and Environment Department.
The State Public health Engineering department was primarily responsible for the O&M of the
Project budget allocated by state government. To ensure speedy disposal the state cabinet
delegated its financial powers to an empowered committee under the chairmanship of the chief
secretary of the State Government. The programme included sewage diversion, treatment, and
disposal of sewage outside the lake catchment area.
4.11 Referenced Studies and Surveys
The following documents were collected from the concerned department for studies
Existing Sewerage System data from the DPR prepared under North Karnataka Urban
Sector Investment Program (Tranche 2) for Hubli-Dharwad,
City Sanitation Plan for Hubli Dharwad.
24X7 water supply report prepared by TCE during 2010.
Rest of the data was collected from site visits as well as consultation with HDMC officials etc.
4.12 SWOT Analysis
SWOT analysis carried out for the UGD system is provided in Table 22.
Table 22: SWOT analysis
Strengths
24x7 water supply implementation in
entire HDMC area
Availability of Sewerage Master plan for
entire area ; ongoing sewage schemes
implementation; 50% of the area already
covered.
As per Sewerage master plan for entire
Hubli Dharwad Municipal Corporation,
the existing sewerage network was
Weaknesses
The construction of new sewerage network
of 12km and increasing the capacity of
proposed STP will increase the cost of the
Project.
Lack of awareness of the local residents on
the hygiene conditions advantages

Feasibility Report – Underground Drainage System of Tolankere Catchment area –Hubballi Dharwad Smart City Limited
Prepared for Hubballi Dharwad Smart City Limited Page 46 of 58
prepared by KUIDFC during 2005. The
construction was completed 5 years back.
High level of Literacy rate
Opportunities
It will help in preventing the mixing of
sewage water into the lake and pollute the
Tolankere Lake.
The quality of life is better by providing
proper sanitation facilities.
The tertiary treated water can be routed
back into the lake which can help in the
recreational activities in the pond area for
boating and groundwater recharge.
The Location for proposed STP (under
AMRUT scheme) is already being
finalized near the lake
It will attract people to the Tolankere lake
when there is a pleasant scenario without
the foul smell and polluted lake water.
Annual lake festival, sound and light show
and other public gatherings can be
conducted.
A developed lake is an ideal location for
holding environmental conferences and
probably even other environment or
nature related symposiums.
Threats
Construction of STP near the lake area,
may affect the tourist visiting the
Tolankere lake if not maintained properly
Co-ordination issues if not synchronized
with AMRUT projects
Interdependences of many Govt
organization
If the houses are not connected to the
Sewer system service connections to be
made
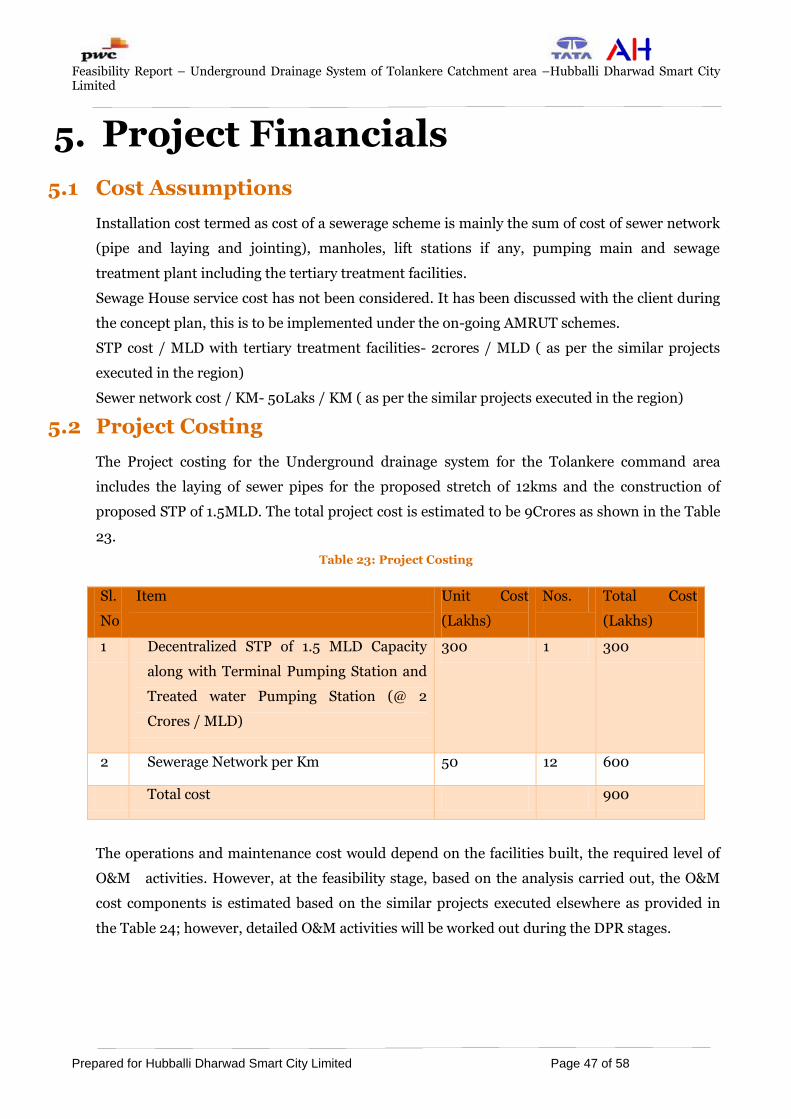
Feasibility Report – Underground Drainage System of Tolankere Catchment area –Hubballi Dharwad Smart City Limited
Prepared for Hubballi Dharwad Smart City Limited Page 47 of 58
5. Project Financials
5.1 Cost Assumptions
Installation cost termed as cost of a sewerage scheme is mainly the sum of cost of sewer network
(pipe and laying and jointing), manholes, lift stations if any, pumping main and sewage
treatment plant including the tertiary treatment facilities.
Sewage House service cost has not been considered. It has been discussed with the client during
the concept plan, this is to be implemented under the on-going AMRUT schemes.
STP cost / MLD with tertiary treatment facilities- 2crores / MLD ( as per the similar projects
executed in the region)
Sewer network cost / KM- 50Laks / KM ( as per the similar projects executed in the region)
5.2 Project Costing
The Project costing for the Underground drainage system for the Tolankere command area
includes the laying of sewer pipes for the proposed stretch of 12kms and the construction of
proposed STP of 1.5MLD. The total project cost is estimated to be 9Crores as shown in the Table
23.
Table 23: Project Costing
Sl.
No
Item Unit Cost
(Lakhs)
Nos. Total Cost
(Lakhs)
1 Decentralized STP of 1.5 MLD Capacity
along with Terminal Pumping Station and
Treated water Pumping Station (@ 2
Crores / MLD)
300 1 300
2 Sewerage Network per Km 50 12 600
Total cost 900
The operations and maintenance cost would depend on the facilities built, the required level of
O&M activities. However, at the feasibility stage, based on the analysis carried out, the O&M
cost components is estimated based on the similar projects executed elsewhere as provided in
the Table 24; however, detailed O&M activities will be worked out during the DPR stages.

Feasibility Report – Underground Drainage System of Tolankere Catchment area –Hubballi Dharwad Smart City Limited
Prepared for Hubballi Dharwad Smart City Limited Page 48 of 58
Table 24: Operations and Maintenance Expenses
Sl. No Components Cost ( Lakhs)
1 STP ( @6 % of the capital cost) 18
2 Sewerage Network ( @1 % of the capital cost) 6
Total O & M expenses 24
Feasibility Report – Underground Drainage System of Tolankere Catchment area –Hubballi Dharwad Smart City Limited
Prepared for Hubballi Dharwad Smart City Limited Page 49 of 58
6. Statutory and Legal Framework
6.1 Legal & Regulatory Framework
As per the Constitution of India (Item No. 5 & 6 of the 12th Schedule of Article 243 W), Water
supply and Sanitation is a State subject. Presently there are no separate regulations/ guidelines
for safe handling, transport and disposal of wastewater in the country.
74th Constitution Amendment Act 1992, provides a framework and devolves upon the Urban
local bodies for providing Water supply and Sanitation facilities in urban areas.
The existing policies for regulating wastewater management are based on certain environmental
laws and certain policies and legal provisions like
Water Prevention and Control of Pollution Rules, 1975
National Environment Policy, 2006
National Sanitation Policy, 2008
Hazardous waste (Management and Handling) Rules, 1989
Municipalities Act; District Municipalities Act etc
Water (prevention and control of pollution) act, 1974, and its amendments: The
purpose of this Act is “to provide for the prevention and control of water pollution and the
maintenance or restoring wholesomeness of water for the establishment. The Act specifically
prohibits „any poisonous, noxious or polluting matter‟ into any stream or well. Consent from the
State Board is required for issues of any type of discharge into any new stream or well
In general, this means that a State consent or permit is required for all types of intake and/or
discharge of any type of liquid or water either from a running stream or from a well. Under these
rules, “effluent standards to be complied with by persons while causing discharge of sewage or
sullage or both” have been specified.
Functions of the Central Board: Subject to the provisions of this Act, the main functions of the
Central Board shall be (a) to promote cleanliness of streams and wells in different areas of the
States. (b) In particular and without prejudice to the generality of the foregoing function, the
Central Board may perform all or any of the following functions, namely, advise the Central
Government on any matter concerning the prevention and control of water pollution;
Functions of the State Board: Subject to the provisions of this Act, the functions of a State Board
shall be (a) to plan a comprehensive programme for the prevention, control or abatement of
pollution of streams and wells in the State and to secure the execution thereof, (b) to advise the
State Government on any matter concerning the prevention, control or abatement of water
pollution, (c) to collect and disseminate information relating to water pollution and the

Feasibility Report – Underground Drainage System of Tolankere Catchment area –Hubballi Dharwad Smart City Limited
Prepared for Hubballi Dharwad Smart City Limited Page 50 of 58
prevention, control or abatement thereof, (d) to encourage, conduct and participate in
investigations and research relating to problems of water pollution and prevention control.
Environment (protection) act, 1986 The provisions of this Act, passed in 1986, have
strengthened the enforcement of the Water Act, 1974. The Act was enacted to “provide for the
protection and improvement of environment and for matters connected therewith.” This act
defined the environment, which includes “water, air, and land and the inter-relationship which
exists among and between “water, air, land, human beings, other living creatures, plants, micro-
organisms and property”.
Important points of the Act that are more relevant to sewerage and sanitation are as follows:
The Act empowers the Centre to take all such measures, as it deems necessary or expedient for
the purpose of protecting and improving the quality of the environment and preventing,
controlling and abating environmental pollution.
The Central Government has the power of entry for examination, testing of equipment and other
purpose and power to take samples of air, water, soil or any other substance from any place for
analysis to ensure compliance with the Act.
The Act explicitly prohibits discharge of pollutants in excess of prescribed standards and
prohibits handling of hazardous substances except in compliance with regulatory procedures
and discharges.
Persons responsible for discharge of pollutants in excess of prescribed standards must prevent
or mitigate the pollution on a continual basis and must report the discharge to government
authorities at pre-determined time intervals.
The Act empowers the central government to establish standards for the quality of the
environment in its various aspects, including maximum allowable concentration of various
environmental pollutants (including noise) for different areas. These standards could be based
on ambient levels of pollutants‟ sufficiently low to protect the public health and welfare.
Penalties for contravention are specified.

Feasibility Report – Underground Drainage System of Tolankere Catchment area –Hubballi Dharwad Smart City Limited
Prepared for Hubballi Dharwad Smart City Limited Page 51 of 58
7. Indicative Environmental &
Social Impacts 7.1 Introduction
In this Chapter potential impacts on the environment from the proposed activity in the project
location are identified based on the nature and extent of various activities associated during
construction and after completion of the project. The proposed expansion activities will have
impact of varying magnitude on environmental components both beneficial (positive) and
adverse (negative) impacts. Both these beneficial (positive) and adverse (negative) impacts are
considered for the impact prediction studies. The details of impact prediction and assessment
are given in this chapter.
7.2 Air quality
Impacts during Construction for proposed project
The potential ambient air quality impacts arising from the proposed project would occur mainly
during construction phase. During construction, the project would have two major impacts on
ambient air quality due to an increase in gaseous emissions by construction equipments and
vehicles, and an increase in dust by construction activities. Earth excavation work, foundation
work, superstructure work, material storage, transportation and handling of construction
materials, are the major factors that would produce a temporary, localized increase in SPM and
RPM levels. The increased movement of heavy vehicles carrying construction materials,
operation of DG sets as standby power back up system would generate gaseous emissions.
However as DG sets are used as standby, the impacts are insignificant.
Impacts during Operation
The Structures at the project site would be expected to have no negative impact on air quality
during their normal operation. If the operation is interrupted in the STP or in underground
drainage that can lead to choking and foul smell from STP will spread in the surrounding
environment.
Mitigation Measures
The impact on the air quality due to the operation of construction machineries in the site is
found to be significant. However, the negative impacts created as a result of movement of
vehicles used during construction of proposed system needs critical attention. For mitigation of
these impacts following measures are suggested:
Feasibility Report – Underground Drainage System of Tolankere Catchment area –Hubballi Dharwad Smart City Limited
Prepared for Hubballi Dharwad Smart City Limited Page 52 of 58
Idling of delivery trucks or other equipment should not be permitted during loading and
unloading
All construction vehicles should comply with air emission standards and be maintained
properly.
A DG set back facilities shall be provided to address the power failure issues if any.
7.3 Noise quality
The potential source of noise associated in the proposed sewerage network and proposed STP
includes the excavation, laying of pipe lines, movement of vehicles involved in transportation
and excavation transporting construction material, etc. Therefore, properly maintained
machines and equipments should be used to minimize the impact of noise on the surrounding
environment.
Impacts during Construction
Construction activities normally result in temporary and short duration increases in noise
levels. The main sources of noise during construction period include movement of vehicles for
loading and unloading of construction materials, fabrication, handling of equipment and
materials, operation of concrete mixing plants, generators etc. The areas affected are those close
to the site.
Under the worst case scenario, considered for prediction of noise levels during construction
phase, it has been assumed that all these equipments generate noise from a common point at an
average noise level of 85 dB.
Impacts during Operation
The proposed structure at the project site is not expected to have an impact on Noise during
their normal operation.
Mitigation Measures
Restriction on the usage of noise generating activities and traffic movement in the Residential
areas to day light hours to avoid high noise and sleep disturbance to residents during
construction phase.
Generator sets should be provided with noise shields around them.
Vehicles used for transportation of construction material should be well maintained.
7.4 Water quality
The proposed project will cause minimal effect on the water quality. The treated wastewater
from the STP will be disposed off into the Tolankere lake safely.
Feasibility Report – Underground Drainage System of Tolankere Catchment area –Hubballi Dharwad Smart City Limited
Prepared for Hubballi Dharwad Smart City Limited Page 53 of 58
During operational phase, wastewater generated by the structure will be routed to the nearby
underground sewer. Since the wastes are not let on to the land, the pollution of ground water by
percolation of waste water is eliminated. The sewage water is treated upto the tertiary level and
hence there is a positive long term improvement of ground water.
Mitigation Measures
Discharge of wastes during operation will be treated in the proposed STP as per requirement
hence, the water quality issues can be mitigated.
7.5 Land environment
The environmental impacts on land environment have been classified primarily into two
aspects namely i.e., direct impact on soil and land in the area. Land environment in the area has
potential for contamination if there are wastewater discharges directly on to the land and from
impacts arising out of solid waste discharge on to the land. The proposed project is of medium
scale and the discharges on land from construction or operation are significant.
During operation, the prevention of disposal of wastes in the open will eliminate the breeding of
flies and other parasites. Hence, the land quality is improved.
7.6 Socio economic impacts for proposed project
The project will foster a cleaner, more hygienic environment for the citizens. The underground
drainage will encourage the hygienic sanitation facilities. The recreational activities can be
carried out in the Lake throughout the year with the supply of treated wastewater from the STP.
Hence the number of visitors in the Lake will be increased.
7.7 Potential environmental impact matrix
This methodology incorporates a list of project activities with a checklist of environmental
components that might be affected. Matrix methods incorporate environmental conditions on
one axis and proposed actions on the other.
The impact of each action on various environmental components are filled in tabular format to
estimate the impacts may be either qualitative, insignificant, high, adverse, beneficial or
quantitative by assessing a numerical score, but in the end there should be a grand total to
signify the magnitude of the impact. The activities discussed above are likely to affect the
environment in varying degrees. Relevant components of environment, which are likely to
experience some impacts due to the proposed project activities, have been identified.
Environmental parameters are broadly classified under three following groups considering the
cause - effect relationship:
Physical Environment
Biological Environment

Feasibility Report – Underground Drainage System of Tolankere Catchment area –Hubballi Dharwad Smart City Limited
Prepared for Hubballi Dharwad Smart City Limited Page 54 of 58
Non Biophysical Components (NBP)
The parameters selected for impact identification are site activities and project specific.
Different parameters considered under the said groups are as follows:
Ambient Air Quality
Noise
Soil stability / erosion
Vegetation
Resource use
Health
Socio economic
The interaction between project activities and environmental parameters described above are shown in the impact matrix in the Table 25, the matrix points out each activity and its impact on specific environmental
parameters. This is a qualitative work and does not indicate quantitative impact. Some of the
impacts are temporary and localized and some impacts are short term and long term in the
matrix.
The environmental management measures to reduce the adverse impacts are detailed in this
Section in the Table 25.
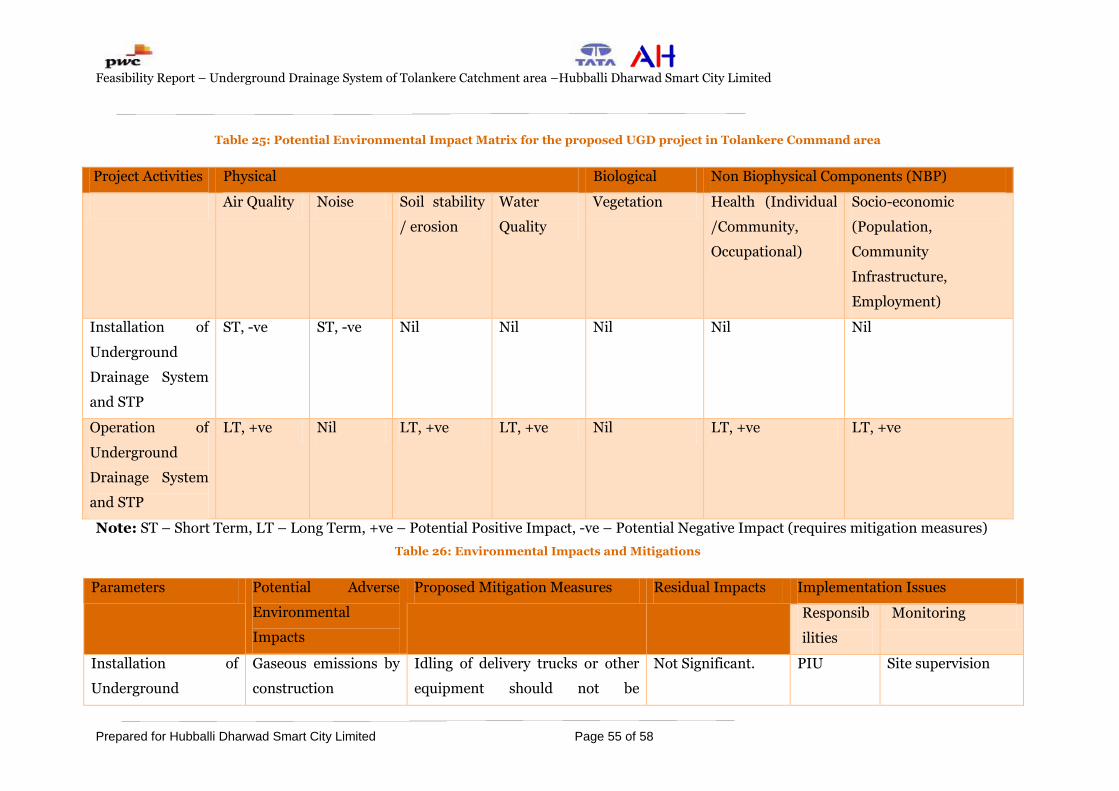
Feasibility Report – Underground Drainage System of Tolankere Catchment area –Hubballi Dharwad Smart City Limited
Prepared for Hubballi Dharwad Smart City Limited Page 55 of 58
Table 25: Potential Environmental Impact Matrix for the proposed UGD project in Tolankere Command area
Project Activities Physical Biological Non Biophysical Components (NBP)
Air Quality Noise Soil stability
/ erosion
Water
Quality
Vegetation Health (Individual
/Community,
Occupational)
Socio-economic
(Population,
Community
Infrastructure,
Employment)
Installation of
Underground
Drainage System
and STP
ST, -ve ST, -ve Nil Nil Nil Nil Nil
Operation of
Underground
Drainage System
and STP
LT, +ve Nil LT, +ve LT, +ve Nil LT, +ve LT, +ve
Note: ST – Short Term, LT – Long Term, +ve – Potential Positive Impact, -ve – Potential Negative Impact (requires mitigation measures)
Table 26: Environmental Impacts and Mitigations
Parameters Potential Adverse
Environmental
Impacts
Proposed Mitigation Measures Residual Impacts Implementation Issues
Responsib
ilities
Monitoring
Installation of
Underground
Gaseous emissions by
construction
Idling of delivery trucks or other
equipment should not be
Not Significant. PIU Site supervision
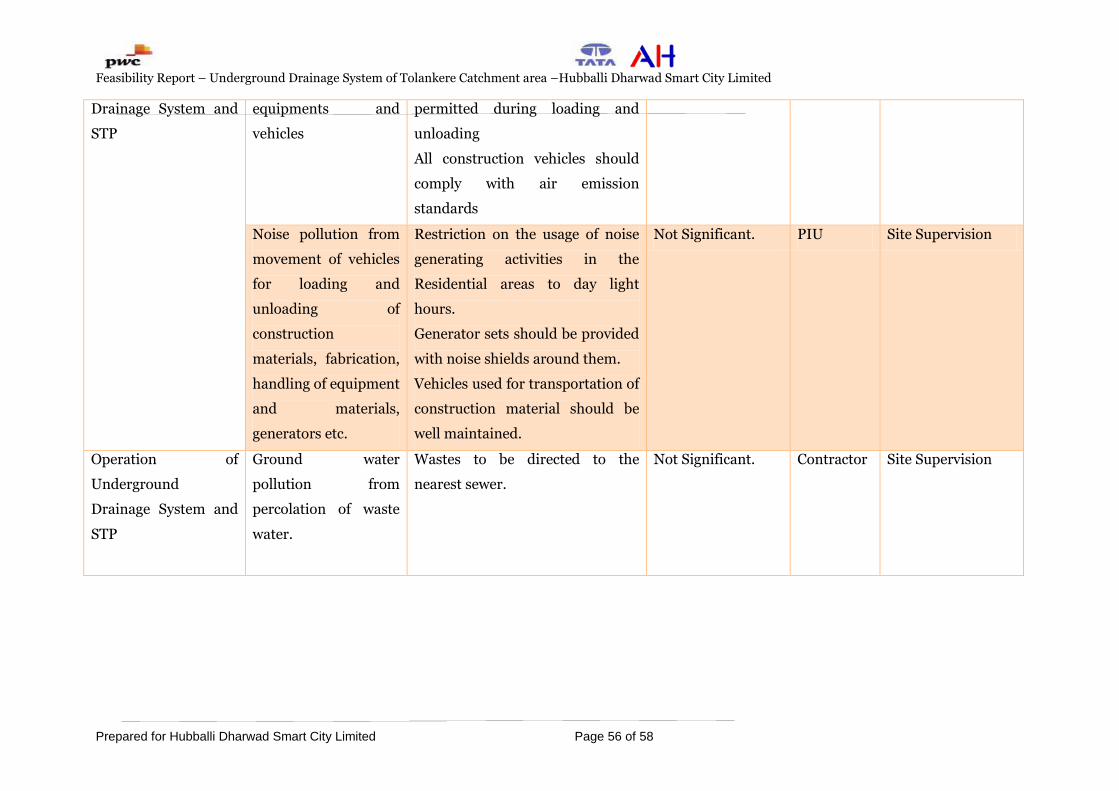
Feasibility Report – Underground Drainage System of Tolankere Catchment area –Hubballi Dharwad Smart City Limited
Prepared for Hubballi Dharwad Smart City Limited Page 56 of 58
Drainage System and
STP
equipments and
vehicles
permitted during loading and
unloading
All construction vehicles should
comply with air emission
standards
Noise pollution from
movement of vehicles
for loading and
unloading of
construction
materials, fabrication,
handling of equipment
and materials,
generators etc.
Restriction on the usage of noise
generating activities in the
Residential areas to day light
hours.
Generator sets should be provided
with noise shields around them.
Vehicles used for transportation of
construction material should be
well maintained.
Not Significant. PIU Site Supervision
Operation of
Underground
Drainage System and
STP
Ground water
pollution from
percolation of waste
water.
Wastes to be directed to the
nearest sewer.
Not Significant. Contractor Site Supervision
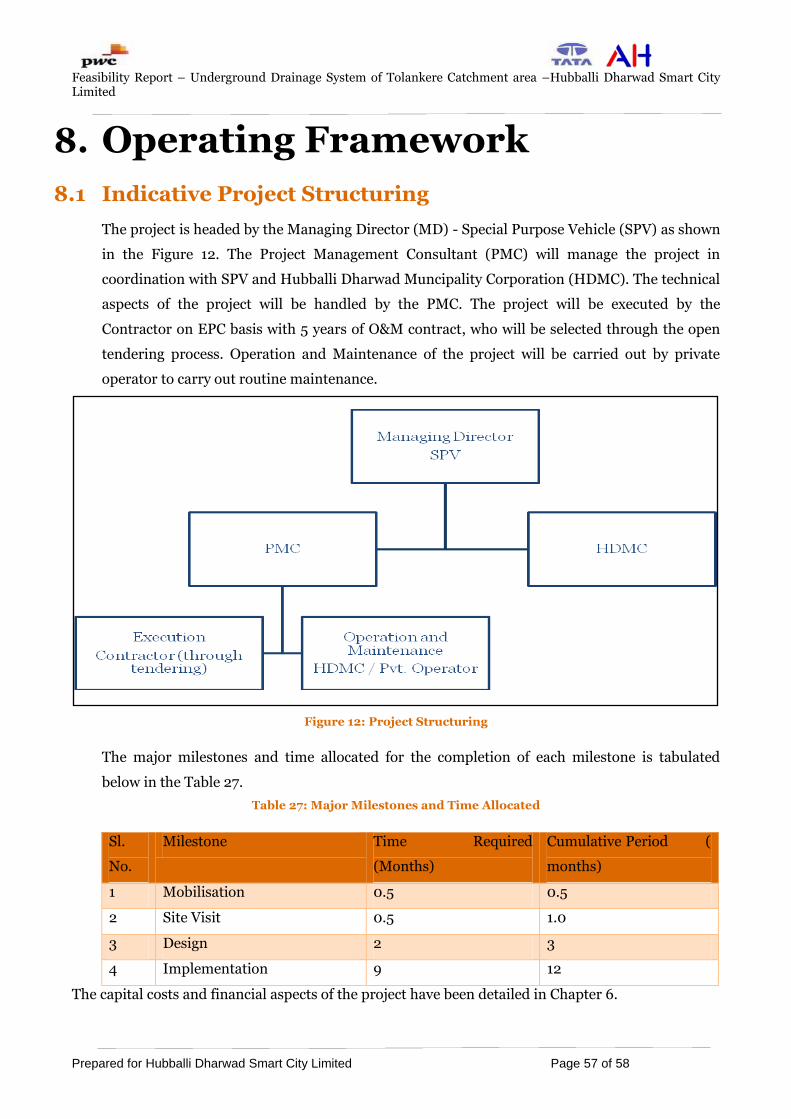
Feasibility Report – Underground Drainage System of Tolankere Catchment area –Hubballi Dharwad Smart City Limited
Prepared for Hubballi Dharwad Smart City Limited Page 57 of 58
8. Operating Framework
8.1 Indicative Project Structuring
The project is headed by the Managing Director (MD) - Special Purpose Vehicle (SPV) as shown
in the Figure 12. The Project Management Consultant (PMC) will manage the project in
coordination with SPV and Hubballi Dharwad Muncipality Corporation (HDMC). The technical
aspects of the project will be handled by the PMC. The project will be executed by the
Contractor on EPC basis with 5 years of O&M contract, who will be selected through the open
tendering process. Operation and Maintenance of the project will be carried out by private
operator to carry out routine maintenance.
Figure 12: Project Structuring
The major milestones and time allocated for the completion of each milestone is tabulated
below in the Table 27.
Table 27: Major Milestones and Time Allocated
Sl.
No.
Milestone Time Required
(Months)
Cumulative Period (
months)
1 Mobilisation 0.5 0.5
2 Site Visit 0.5 1.0
3 Design 2 3
4 Implementation 9 12
The capital costs and financial aspects of the project have been detailed in Chapter 6.

Feasibility Report – Underground Drainage System of Tolankere Catchment area –Hubballi Dharwad Smart City Limited
Prepared for Hubballi Dharwad Smart City Limited Page 58 of 58
9. Next Steps
9.1 General
Based on the above feasibility report, it is expected that, HDMC accords their approval for the
Proposed Sewerage network and construction of Sewerage treatment Plant at the proposed
locations.
This will also help the project to be implemented without any land issues and the project can be
expected to be completed as per the schedule provided in the Table 28.
Table 28: Tentative planning for next deliverables
Description Owner Tentative Timing
Approval of feasibility report HDSCL 04-09-2017
Submission of DPR PMC 22-09-2017
Approval of DPR HDSCL 29-09-2017
Submission of tender documents PMC 16-10-2017
Issue of Tender documents HDSCL 25-10-2017
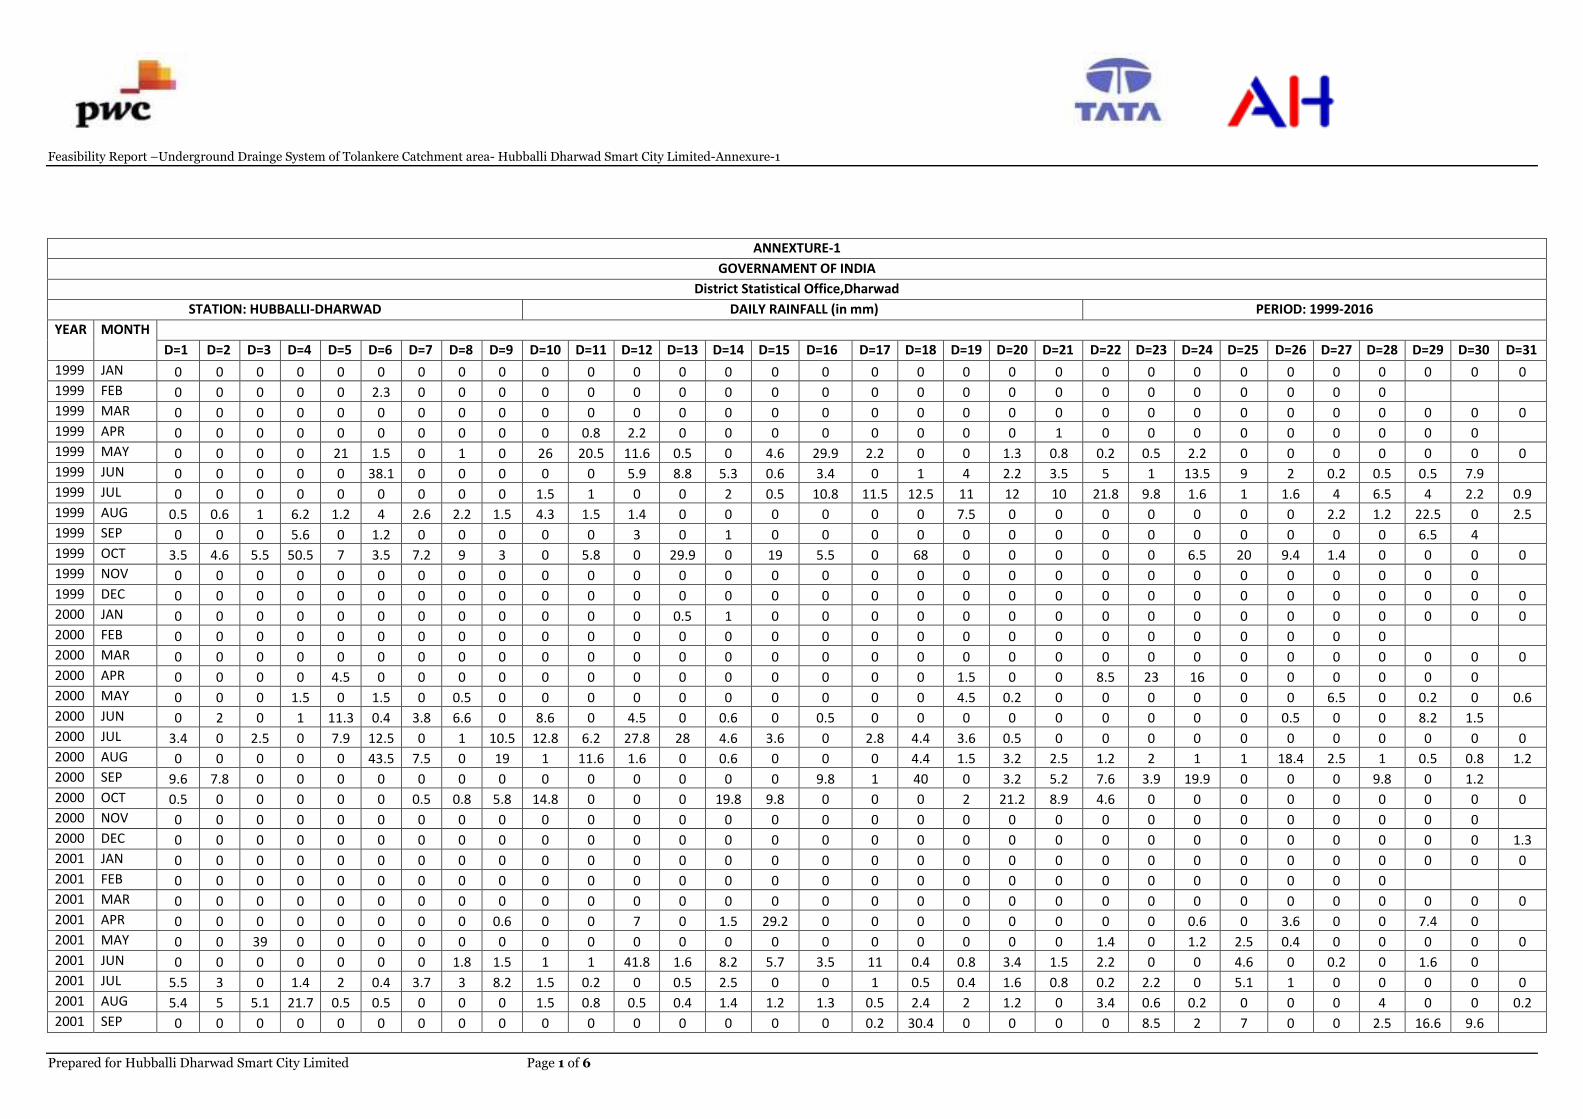
Feasibility Report –Underground Drainge System of Tolankere Catchment area- Hubballi Dharwad Smart City Limited-Annexure-1
Prepared for Hubballi Dharwad Smart City Limited Page 1 of 6
ANNEXTURE-1
GOVERNAMENT OF INDIA
District Statistical Office,Dharwad
STATION: HUBBALLI-DHARWAD DAILY RAINFALL (in mm) PERIOD: 1999-2016
YEAR MONTH
D=1 D=2 D=3 D=4 D=5 D=6 D=7 D=8 D=9 D=10 D=11 D=12 D=13 D=14 D=15 D=16 D=17 D=18 D=19 D=20 D=21 D=22 D=23 D=24 D=25 D=26 D=27 D=28 D=29 D=30 D=31
1999 JAN 0 0 0 0 0 0 0 0 0 0 0 0 0 0 0 0 0 0 0 0 0 0 0 0 0 0 0 0 0 0 0
1999 FEB 0 0 0 0 0 2.3 0 0 0 0 0 0 0 0 0 0 0 0 0 0 0 0 0 0 0 0 0 0
1999 MAR 0 0 0 0 0 0 0 0 0 0 0 0 0 0 0 0 0 0 0 0 0 0 0 0 0 0 0 0 0 0 0
1999 APR 0 0 0 0 0 0 0 0 0 0 0.8 2.2 0 0 0 0 0 0 0 0 1 0 0 0 0 0 0 0 0 0
1999 MAY 0 0 0 0 21 1.5 0 1 0 26 20.5 11.6 0.5 0 4.6 29.9 2.2 0 0 1.3 0.8 0.2 0.5 2.2 0 0 0 0 0 0 0
1999 JUN 0 0 0 0 0 38.1 0 0 0 0 0 5.9 8.8 5.3 0.6 3.4 0 1 4 2.2 3.5 5 1 13.5 9 2 0.2 0.5 0.5 7.9
1999 JUL 0 0 0 0 0 0 0 0 0 1.5 1 0 0 2 0.5 10.8 11.5 12.5 11 12 10 21.8 9.8 1.6 1 1.6 4 6.5 4 2.2 0.9
1999 AUG 0.5 0.6 1 6.2 1.2 4 2.6 2.2 1.5 4.3 1.5 1.4 0 0 0 0 0 0 7.5 0 0 0 0 0 0 0 2.2 1.2 22.5 0 2.5
1999 SEP 0 0 0 5.6 0 1.2 0 0 0 0 0 3 0 1 0 0 0 0 0 0 0 0 0 0 0 0 0 0 6.5 4
1999 OCT 3.5 4.6 5.5 50.5 7 3.5 7.2 9 3 0 5.8 0 29.9 0 19 5.5 0 68 0 0 0 0 0 6.5 20 9.4 1.4 0 0 0 0
1999 NOV 0 0 0 0 0 0 0 0 0 0 0 0 0 0 0 0 0 0 0 0 0 0 0 0 0 0 0 0 0 0
1999 DEC 0 0 0 0 0 0 0 0 0 0 0 0 0 0 0 0 0 0 0 0 0 0 0 0 0 0 0 0 0 0 0
2000 JAN 0 0 0 0 0 0 0 0 0 0 0 0 0.5 1 0 0 0 0 0 0 0 0 0 0 0 0 0 0 0 0 0
2000 FEB 0 0 0 0 0 0 0 0 0 0 0 0 0 0 0 0 0 0 0 0 0 0 0 0 0 0 0 0
2000 MAR 0 0 0 0 0 0 0 0 0 0 0 0 0 0 0 0 0 0 0 0 0 0 0 0 0 0 0 0 0 0 0
2000 APR 0 0 0 0 4.5 0 0 0 0 0 0 0 0 0 0 0 0 0 1.5 0 0 8.5 23 16 0 0 0 0 0 0
2000 MAY 0 0 0 1.5 0 1.5 0 0.5 0 0 0 0 0 0 0 0 0 0 4.5 0.2 0 0 0 0 0 0 6.5 0 0.2 0 0.6
2000 JUN 0 2 0 1 11.3 0.4 3.8 6.6 0 8.6 0 4.5 0 0.6 0 0.5 0 0 0 0 0 0 0 0 0 0.5 0 0 8.2 1.5
2000 JUL 3.4 0 2.5 0 7.9 12.5 0 1 10.5 12.8 6.2 27.8 28 4.6 3.6 0 2.8 4.4 3.6 0.5 0 0 0 0 0 0 0 0 0 0 0
2000 AUG 0 0 0 0 0 43.5 7.5 0 19 1 11.6 1.6 0 0.6 0 0 0 4.4 1.5 3.2 2.5 1.2 2 1 1 18.4 2.5 1 0.5 0.8 1.2
2000 SEP 9.6 7.8 0 0 0 0 0 0 0 0 0 0 0 0 0 9.8 1 40 0 3.2 5.2 7.6 3.9 19.9 0 0 0 9.8 0 1.2
2000 OCT 0.5 0 0 0 0 0 0.5 0.8 5.8 14.8 0 0 0 19.8 9.8 0 0 0 2 21.2 8.9 4.6 0 0 0 0 0 0 0 0 0
2000 NOV 0 0 0 0 0 0 0 0 0 0 0 0 0 0 0 0 0 0 0 0 0 0 0 0 0 0 0 0 0 0
2000 DEC 0 0 0 0 0 0 0 0 0 0 0 0 0 0 0 0 0 0 0 0 0 0 0 0 0 0 0 0 0 0 1.3
2001 JAN 0 0 0 0 0 0 0 0 0 0 0 0 0 0 0 0 0 0 0 0 0 0 0 0 0 0 0 0 0 0 0
2001 FEB 0 0 0 0 0 0 0 0 0 0 0 0 0 0 0 0 0 0 0 0 0 0 0 0 0 0 0 0
2001 MAR 0 0 0 0 0 0 0 0 0 0 0 0 0 0 0 0 0 0 0 0 0 0 0 0 0 0 0 0 0 0 0
2001 APR 0 0 0 0 0 0 0 0 0.6 0 0 7 0 1.5 29.2 0 0 0 0 0 0 0 0 0.6 0 3.6 0 0 7.4 0
2001 MAY 0 0 39 0 0 0 0 0 0 0 0 0 0 0 0 0 0 0 0 0 0 1.4 0 1.2 2.5 0.4 0 0 0 0 0
2001 JUN 0 0 0 0 0 0 0 1.8 1.5 1 1 41.8 1.6 8.2 5.7 3.5 11 0.4 0.8 3.4 1.5 2.2 0 0 4.6 0 0.2 0 1.6 0
2001 JUL 5.5 3 0 1.4 2 0.4 3.7 3 8.2 1.5 0.2 0 0.5 2.5 0 0 1 0.5 0.4 1.6 0.8 0.2 2.2 0 5.1 1 0 0 0 0 0
2001 AUG 5.4 5 5.1 21.7 0.5 0.5 0 0 0 1.5 0.8 0.5 0.4 1.4 1.2 1.3 0.5 2.4 2 1.2 0 3.4 0.6 0.2 0 0 0 4 0 0 0.2
2001 SEP 0 0 0 0 0 0 0 0 0 0 0 0 0 0 0 0 0.2 30.4 0 0 0 0 8.5 2 7 0 0 2.5 16.6 9.6
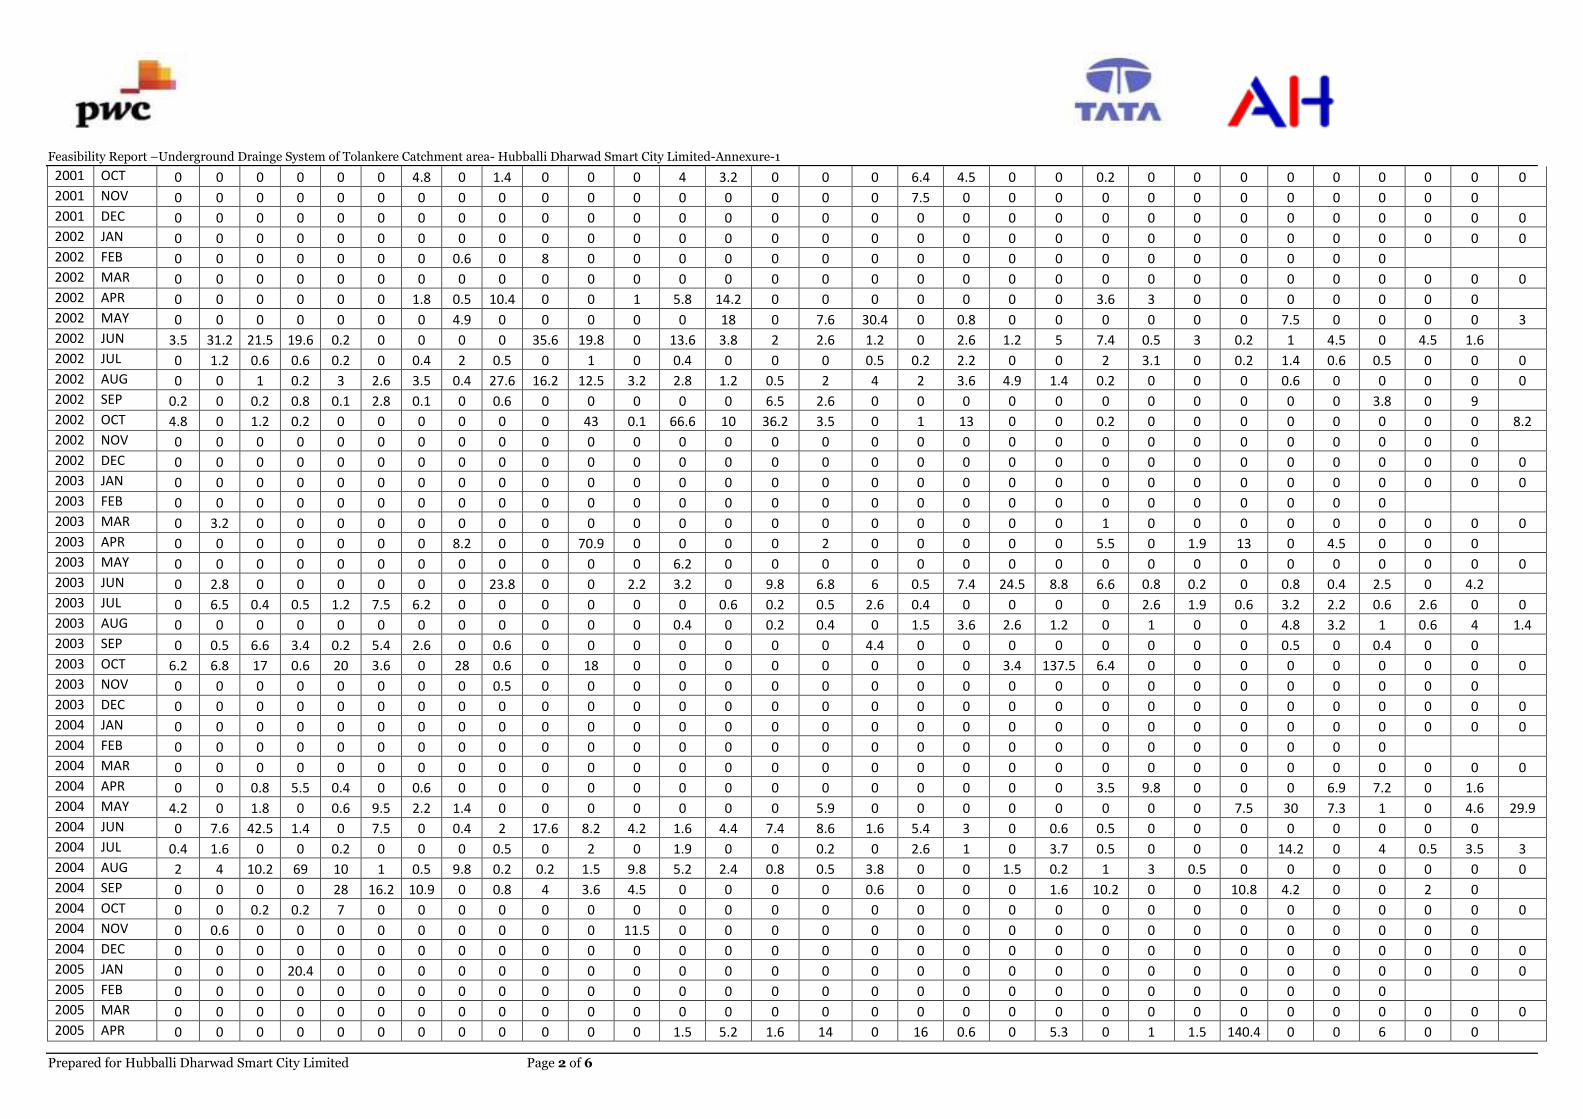
Feasibility Report –Underground Drainge System of Tolankere Catchment area- Hubballi Dharwad Smart City Limited-Annexure-1
Prepared for Hubballi Dharwad Smart City Limited Page 2 of 6
2001 OCT 0 0 0 0 0 0 4.8 0 1.4 0 0 0 4 3.2 0 0 0 6.4 4.5 0 0 0.2 0 0 0 0 0 0 0 0 0
2001 NOV 0 0 0 0 0 0 0 0 0 0 0 0 0 0 0 0 0 7.5 0 0 0 0 0 0 0 0 0 0 0 0
2001 DEC 0 0 0 0 0 0 0 0 0 0 0 0 0 0 0 0 0 0 0 0 0 0 0 0 0 0 0 0 0 0 0
2002 JAN 0 0 0 0 0 0 0 0 0 0 0 0 0 0 0 0 0 0 0 0 0 0 0 0 0 0 0 0 0 0 0
2002 FEB 0 0 0 0 0 0 0 0.6 0 8 0 0 0 0 0 0 0 0 0 0 0 0 0 0 0 0 0 0
2002 MAR 0 0 0 0 0 0 0 0 0 0 0 0 0 0 0 0 0 0 0 0 0 0 0 0 0 0 0 0 0 0 0
2002 APR 0 0 0 0 0 0 1.8 0.5 10.4 0 0 1 5.8 14.2 0 0 0 0 0 0 0 3.6 3 0 0 0 0 0 0 0
2002 MAY 0 0 0 0 0 0 0 4.9 0 0 0 0 0 18 0 7.6 30.4 0 0.8 0 0 0 0 0 0 7.5 0 0 0 0 3
2002 JUN 3.5 31.2 21.5 19.6 0.2 0 0 0 0 35.6 19.8 0 13.6 3.8 2 2.6 1.2 0 2.6 1.2 5 7.4 0.5 3 0.2 1 4.5 0 4.5 1.6
2002 JUL 0 1.2 0.6 0.6 0.2 0 0.4 2 0.5 0 1 0 0.4 0 0 0 0.5 0.2 2.2 0 0 2 3.1 0 0.2 1.4 0.6 0.5 0 0 0
2002 AUG 0 0 1 0.2 3 2.6 3.5 0.4 27.6 16.2 12.5 3.2 2.8 1.2 0.5 2 4 2 3.6 4.9 1.4 0.2 0 0 0 0.6 0 0 0 0 0
2002 SEP 0.2 0 0.2 0.8 0.1 2.8 0.1 0 0.6 0 0 0 0 0 6.5 2.6 0 0 0 0 0 0 0 0 0 0 0 3.8 0 9
2002 OCT 4.8 0 1.2 0.2 0 0 0 0 0 0 43 0.1 66.6 10 36.2 3.5 0 1 13 0 0 0.2 0 0 0 0 0 0 0 0 8.2
2002 NOV 0 0 0 0 0 0 0 0 0 0 0 0 0 0 0 0 0 0 0 0 0 0 0 0 0 0 0 0 0 0
2002 DEC 0 0 0 0 0 0 0 0 0 0 0 0 0 0 0 0 0 0 0 0 0 0 0 0 0 0 0 0 0 0 0
2003 JAN 0 0 0 0 0 0 0 0 0 0 0 0 0 0 0 0 0 0 0 0 0 0 0 0 0 0 0 0 0 0 0
2003 FEB 0 0 0 0 0 0 0 0 0 0 0 0 0 0 0 0 0 0 0 0 0 0 0 0 0 0 0 0
2003 MAR 0 3.2 0 0 0 0 0 0 0 0 0 0 0 0 0 0 0 0 0 0 0 1 0 0 0 0 0 0 0 0 0
2003 APR 0 0 0 0 0 0 0 8.2 0 0 70.9 0 0 0 0 2 0 0 0 0 0 5.5 0 1.9 13 0 4.5 0 0 0
2003 MAY 0 0 0 0 0 0 0 0 0 0 0 0 6.2 0 0 0 0 0 0 0 0 0 0 0 0 0 0 0 0 0 0
2003 JUN 0 2.8 0 0 0 0 0 0 23.8 0 0 2.2 3.2 0 9.8 6.8 6 0.5 7.4 24.5 8.8 6.6 0.8 0.2 0 0.8 0.4 2.5 0 4.2
2003 JUL 0 6.5 0.4 0.5 1.2 7.5 6.2 0 0 0 0 0 0 0.6 0.2 0.5 2.6 0.4 0 0 0 0 2.6 1.9 0.6 3.2 2.2 0.6 2.6 0 0
2003 AUG 0 0 0 0 0 0 0 0 0 0 0 0 0.4 0 0.2 0.4 0 1.5 3.6 2.6 1.2 0 1 0 0 4.8 3.2 1 0.6 4 1.4
2003 SEP 0 0.5 6.6 3.4 0.2 5.4 2.6 0 0.6 0 0 0 0 0 0 0 4.4 0 0 0 0 0 0 0 0 0.5 0 0.4 0 0
2003 OCT 6.2 6.8 17 0.6 20 3.6 0 28 0.6 0 18 0 0 0 0 0 0 0 0 3.4 137.5 6.4 0 0 0 0 0 0 0 0 0
2003 NOV 0 0 0 0 0 0 0 0 0.5 0 0 0 0 0 0 0 0 0 0 0 0 0 0 0 0 0 0 0 0 0
2003 DEC 0 0 0 0 0 0 0 0 0 0 0 0 0 0 0 0 0 0 0 0 0 0 0 0 0 0 0 0 0 0 0
2004 JAN 0 0 0 0 0 0 0 0 0 0 0 0 0 0 0 0 0 0 0 0 0 0 0 0 0 0 0 0 0 0 0
2004 FEB 0 0 0 0 0 0 0 0 0 0 0 0 0 0 0 0 0 0 0 0 0 0 0 0 0 0 0 0
2004 MAR 0 0 0 0 0 0 0 0 0 0 0 0 0 0 0 0 0 0 0 0 0 0 0 0 0 0 0 0 0 0 0
2004 APR 0 0 0.8 5.5 0.4 0 0.6 0 0 0 0 0 0 0 0 0 0 0 0 0 0 3.5 9.8 0 0 0 6.9 7.2 0 1.6
2004 MAY 4.2 0 1.8 0 0.6 9.5 2.2 1.4 0 0 0 0 0 0 0 5.9 0 0 0 0 0 0 0 0 7.5 30 7.3 1 0 4.6 29.9
2004 JUN 0 7.6 42.5 1.4 0 7.5 0 0.4 2 17.6 8.2 4.2 1.6 4.4 7.4 8.6 1.6 5.4 3 0 0.6 0.5 0 0 0 0 0 0 0 0
2004 JUL 0.4 1.6 0 0 0.2 0 0 0 0.5 0 2 0 1.9 0 0 0.2 0 2.6 1 0 3.7 0.5 0 0 0 14.2 0 4 0.5 3.5 3
2004 AUG 2 4 10.2 69 10 1 0.5 9.8 0.2 0.2 1.5 9.8 5.2 2.4 0.8 0.5 3.8 0 0 1.5 0.2 1 3 0.5 0 0 0 0 0 0 0
2004 SEP 0 0 0 0 28 16.2 10.9 0 0.8 4 3.6 4.5 0 0 0 0 0.6 0 0 0 1.6 10.2 0 0 10.8 4.2 0 0 2 0
2004 OCT 0 0 0.2 0.2 7 0 0 0 0 0 0 0 0 0 0 0 0 0 0 0 0 0 0 0 0 0 0 0 0 0 0
2004 NOV 0 0.6 0 0 0 0 0 0 0 0 0 11.5 0 0 0 0 0 0 0 0 0 0 0 0 0 0 0 0 0 0
2004 DEC 0 0 0 0 0 0 0 0 0 0 0 0 0 0 0 0 0 0 0 0 0 0 0 0 0 0 0 0 0 0 0
2005 JAN 0 0 0 20.4 0 0 0 0 0 0 0 0 0 0 0 0 0 0 0 0 0 0 0 0 0 0 0 0 0 0 0
2005 FEB 0 0 0 0 0 0 0 0 0 0 0 0 0 0 0 0 0 0 0 0 0 0 0 0 0 0 0 0
2005 MAR 0 0 0 0 0 0 0 0 0 0 0 0 0 0 0 0 0 0 0 0 0 0 0 0 0 0 0 0 0 0 0
2005 APR 0 0 0 0 0 0 0 0 0 0 0 0 1.5 5.2 1.6 14 0 16 0.6 0 5.3 0 1 1.5 140.4 0 0 6 0 0
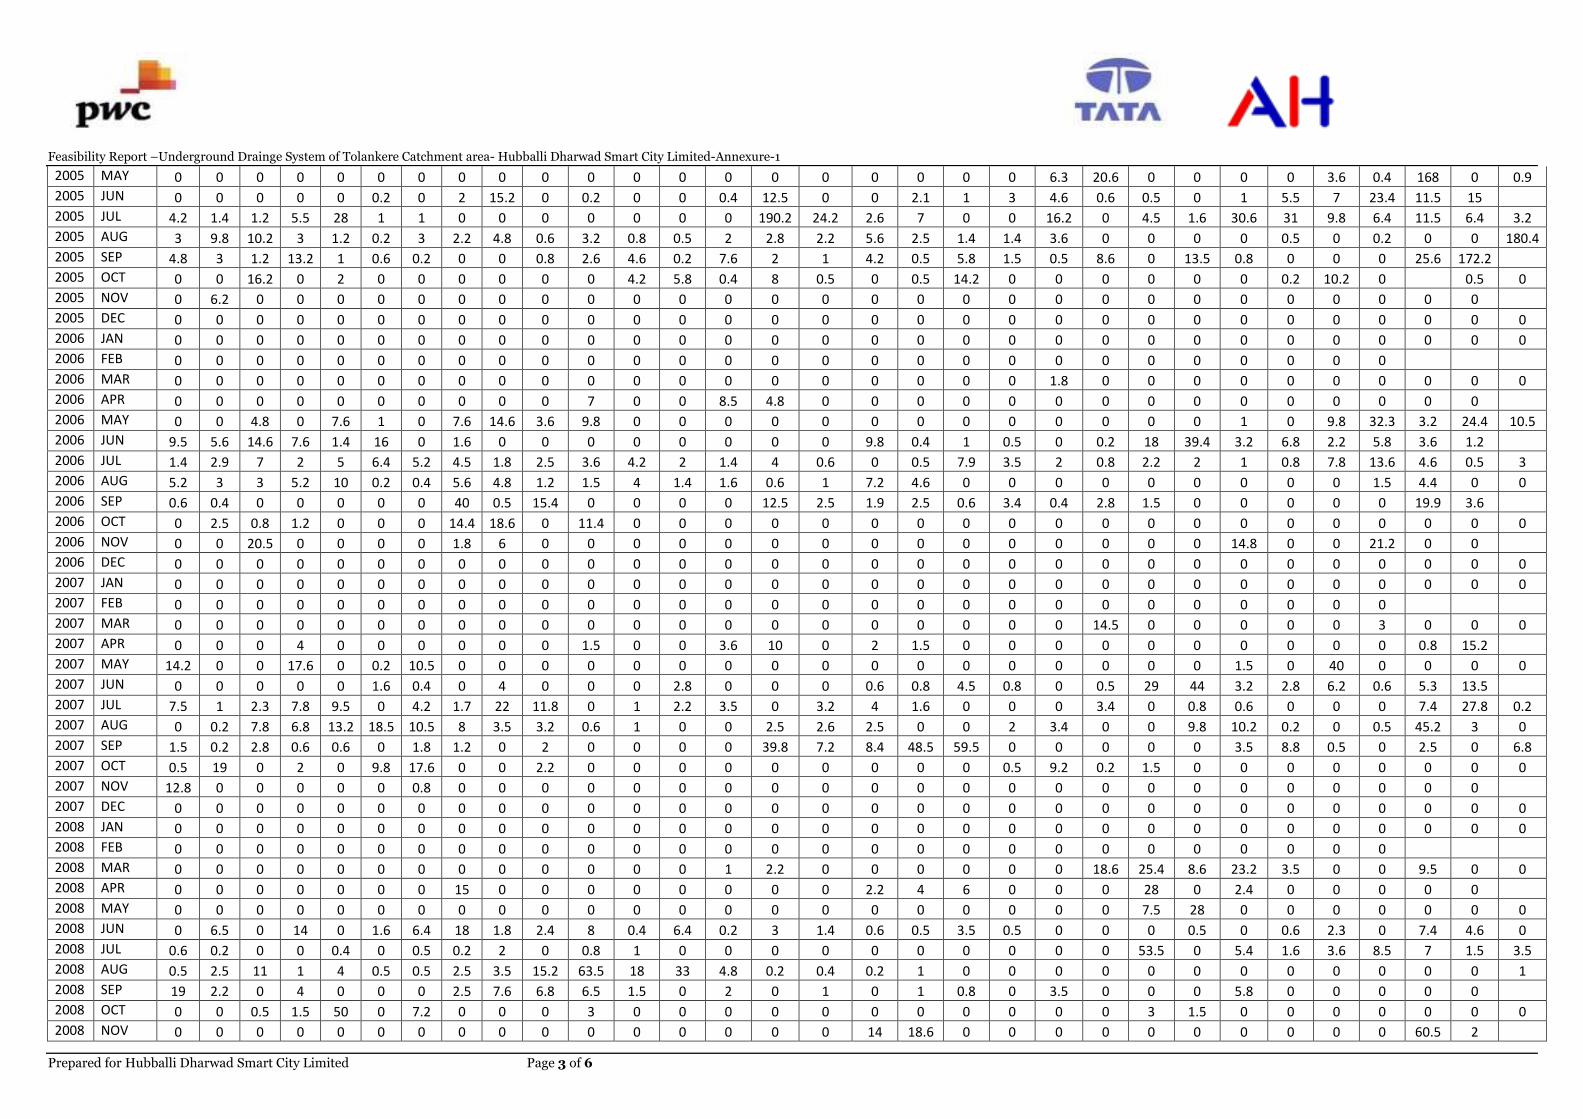
Feasibility Report –Underground Drainge System of Tolankere Catchment area- Hubballi Dharwad Smart City Limited-Annexure-1
Prepared for Hubballi Dharwad Smart City Limited Page 3 of 6
2005 MAY 0 0 0 0 0 0 0 0 0 0 0 0 0 0 0 0 0 0 0 0 6.3 20.6 0 0 0 0 3.6 0.4 168 0 0.9
2005 JUN 0 0 0 0 0 0.2 0 2 15.2 0 0.2 0 0 0.4 12.5 0 0 2.1 1 3 4.6 0.6 0.5 0 1 5.5 7 23.4 11.5 15
2005 JUL 4.2 1.4 1.2 5.5 28 1 1 0 0 0 0 0 0 0 190.2 24.2 2.6 7 0 0 16.2 0 4.5 1.6 30.6 31 9.8 6.4 11.5 6.4 3.2
2005 AUG 3 9.8 10.2 3 1.2 0.2 3 2.2 4.8 0.6 3.2 0.8 0.5 2 2.8 2.2 5.6 2.5 1.4 1.4 3.6 0 0 0 0 0.5 0 0.2 0 0 180.4
2005 SEP 4.8 3 1.2 13.2 1 0.6 0.2 0 0 0.8 2.6 4.6 0.2 7.6 2 1 4.2 0.5 5.8 1.5 0.5 8.6 0 13.5 0.8 0 0 0 25.6 172.2
2005 OCT 0 0 16.2 0 2 0 0 0 0 0 0 4.2 5.8 0.4 8 0.5 0 0.5 14.2 0 0 0 0 0 0 0.2 10.2 0 0.5 0
2005 NOV 0 6.2 0 0 0 0 0 0 0 0 0 0 0 0 0 0 0 0 0 0 0 0 0 0 0 0 0 0 0 0
2005 DEC 0 0 0 0 0 0 0 0 0 0 0 0 0 0 0 0 0 0 0 0 0 0 0 0 0 0 0 0 0 0 0
2006 JAN 0 0 0 0 0 0 0 0 0 0 0 0 0 0 0 0 0 0 0 0 0 0 0 0 0 0 0 0 0 0 0
2006 FEB 0 0 0 0 0 0 0 0 0 0 0 0 0 0 0 0 0 0 0 0 0 0 0 0 0 0 0 0
2006 MAR 0 0 0 0 0 0 0 0 0 0 0 0 0 0 0 0 0 0 0 0 1.8 0 0 0 0 0 0 0 0 0 0
2006 APR 0 0 0 0 0 0 0 0 0 0 7 0 0 8.5 4.8 0 0 0 0 0 0 0 0 0 0 0 0 0 0 0
2006 MAY 0 0 4.8 0 7.6 1 0 7.6 14.6 3.6 9.8 0 0 0 0 0 0 0 0 0 0 0 0 0 1 0 9.8 32.3 3.2 24.4 10.5
2006 JUN 9.5 5.6 14.6 7.6 1.4 16 0 1.6 0 0 0 0 0 0 0 0 9.8 0.4 1 0.5 0 0.2 18 39.4 3.2 6.8 2.2 5.8 3.6 1.2
2006 JUL 1.4 2.9 7 2 5 6.4 5.2 4.5 1.8 2.5 3.6 4.2 2 1.4 4 0.6 0 0.5 7.9 3.5 2 0.8 2.2 2 1 0.8 7.8 13.6 4.6 0.5 3
2006 AUG 5.2 3 3 5.2 10 0.2 0.4 5.6 4.8 1.2 1.5 4 1.4 1.6 0.6 1 7.2 4.6 0 0 0 0 0 0 0 0 0 1.5 4.4 0 0
2006 SEP 0.6 0.4 0 0 0 0 0 40 0.5 15.4 0 0 0 0 12.5 2.5 1.9 2.5 0.6 3.4 0.4 2.8 1.5 0 0 0 0 0 19.9 3.6
2006 OCT 0 2.5 0.8 1.2 0 0 0 14.4 18.6 0 11.4 0 0 0 0 0 0 0 0 0 0 0 0 0 0 0 0 0 0 0 0
2006 NOV 0 0 20.5 0 0 0 0 1.8 6 0 0 0 0 0 0 0 0 0 0 0 0 0 0 0 14.8 0 0 21.2 0 0
2006 DEC 0 0 0 0 0 0 0 0 0 0 0 0 0 0 0 0 0 0 0 0 0 0 0 0 0 0 0 0 0 0 0
2007 JAN 0 0 0 0 0 0 0 0 0 0 0 0 0 0 0 0 0 0 0 0 0 0 0 0 0 0 0 0 0 0 0
2007 FEB 0 0 0 0 0 0 0 0 0 0 0 0 0 0 0 0 0 0 0 0 0 0 0 0 0 0 0 0
2007 MAR 0 0 0 0 0 0 0 0 0 0 0 0 0 0 0 0 0 0 0 0 0 14.5 0 0 0 0 0 3 0 0 0
2007 APR 0 0 0 4 0 0 0 0 0 0 1.5 0 0 3.6 10 0 2 1.5 0 0 0 0 0 0 0 0 0 0 0.8 15.2
2007 MAY 14.2 0 0 17.6 0 0.2 10.5 0 0 0 0 0 0 0 0 0 0 0 0 0 0 0 0 0 1.5 0 40 0 0 0 0
2007 JUN 0 0 0 0 0 1.6 0.4 0 4 0 0 0 2.8 0 0 0 0.6 0.8 4.5 0.8 0 0.5 29 44 3.2 2.8 6.2 0.6 5.3 13.5
2007 JUL 7.5 1 2.3 7.8 9.5 0 4.2 1.7 22 11.8 0 1 2.2 3.5 0 3.2 4 1.6 0 0 0 3.4 0 0.8 0.6 0 0 0 7.4 27.8 0.2
2007 AUG 0 0.2 7.8 6.8 13.2 18.5 10.5 8 3.5 3.2 0.6 1 0 0 2.5 2.6 2.5 0 0 2 3.4 0 0 9.8 10.2 0.2 0 0.5 45.2 3 0
2007 SEP 1.5 0.2 2.8 0.6 0.6 0 1.8 1.2 0 2 0 0 0 0 39.8 7.2 8.4 48.5 59.5 0 0 0 0 0 3.5 8.8 0.5 0 2.5 0 6.8
2007 OCT 0.5 19 0 2 0 9.8 17.6 0 0 2.2 0 0 0 0 0 0 0 0 0 0.5 9.2 0.2 1.5 0 0 0 0 0 0 0 0
2007 NOV 12.8 0 0 0 0 0 0.8 0 0 0 0 0 0 0 0 0 0 0 0 0 0 0 0 0 0 0 0 0 0 0
2007 DEC 0 0 0 0 0 0 0 0 0 0 0 0 0 0 0 0 0 0 0 0 0 0 0 0 0 0 0 0 0 0 0
2008 JAN 0 0 0 0 0 0 0 0 0 0 0 0 0 0 0 0 0 0 0 0 0 0 0 0 0 0 0 0 0 0 0
2008 FEB 0 0 0 0 0 0 0 0 0 0 0 0 0 0 0 0 0 0 0 0 0 0 0 0 0 0 0 0
2008 MAR 0 0 0 0 0 0 0 0 0 0 0 0 0 1 2.2 0 0 0 0 0 0 18.6 25.4 8.6 23.2 3.5 0 0 9.5 0 0
2008 APR 0 0 0 0 0 0 0 15 0 0 0 0 0 0 0 0 2.2 4 6 0 0 0 28 0 2.4 0 0 0 0 0
2008 MAY 0 0 0 0 0 0 0 0 0 0 0 0 0 0 0 0 0 0 0 0 0 0 7.5 28 0 0 0 0 0 0 0
2008 JUN 0 6.5 0 14 0 1.6 6.4 18 1.8 2.4 8 0.4 6.4 0.2 3 1.4 0.6 0.5 3.5 0.5 0 0 0 0.5 0 0.6 2.3 0 7.4 4.6 0
2008 JUL 0.6 0.2 0 0 0.4 0 0.5 0.2 2 0 0.8 1 0 0 0 0 0 0 0 0 0 0 53.5 0 5.4 1.6 3.6 8.5 7 1.5 3.5
2008 AUG 0.5 2.5 11 1 4 0.5 0.5 2.5 3.5 15.2 63.5 18 33 4.8 0.2 0.4 0.2 1 0 0 0 0 0 0 0 0 0 0 0 0 1
2008 SEP 19 2.2 0 4 0 0 0 2.5 7.6 6.8 6.5 1.5 0 2 0 1 0 1 0.8 0 3.5 0 0 0 5.8 0 0 0 0 0
2008 OCT 0 0 0.5 1.5 50 0 7.2 0 0 0 3 0 0 0 0 0 0 0 0 0 0 0 3 1.5 0 0 0 0 0 0 0
2008 NOV 0 0 0 0 0 0 0 0 0 0 0 0 0 0 0 0 14 18.6 0 0 0 0 0 0 0 0 0 0 60.5 2
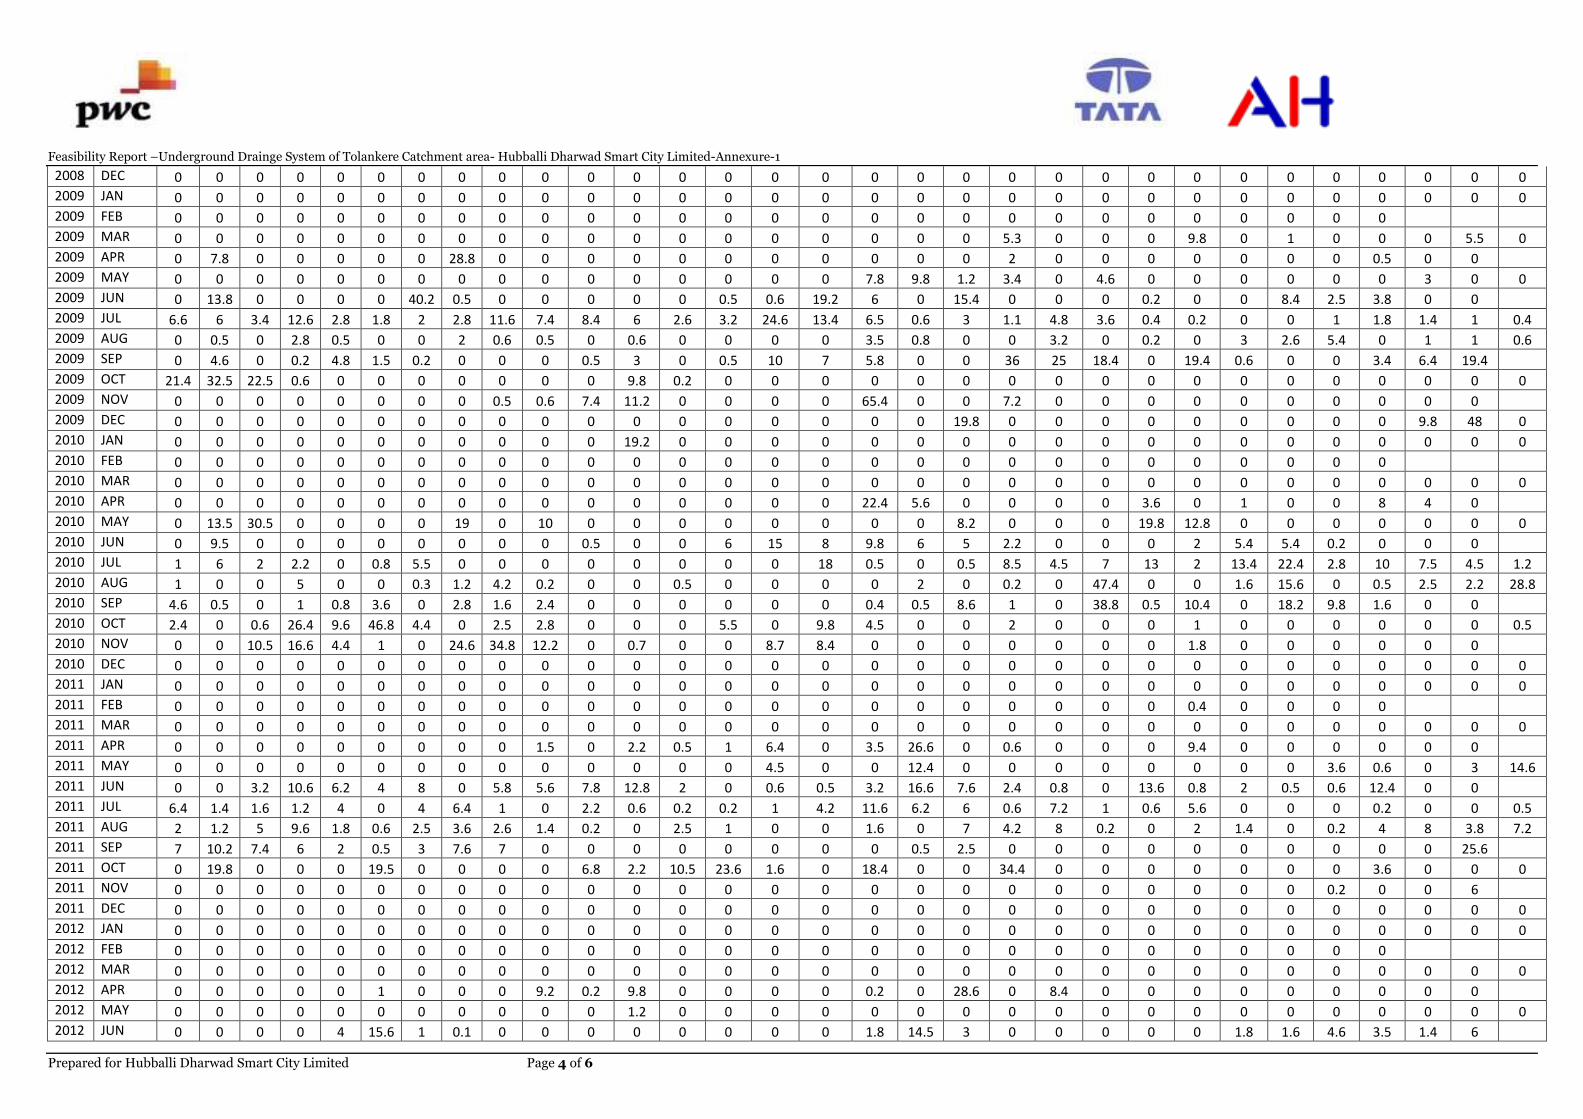
Feasibility Report –Underground Drainge System of Tolankere Catchment area- Hubballi Dharwad Smart City Limited-Annexure-1
Prepared for Hubballi Dharwad Smart City Limited Page 4 of 6
2008 DEC 0 0 0 0 0 0 0 0 0 0 0 0 0 0 0 0 0 0 0 0 0 0 0 0 0 0 0 0 0 0 0
2009 JAN 0 0 0 0 0 0 0 0 0 0 0 0 0 0 0 0 0 0 0 0 0 0 0 0 0 0 0 0 0 0 0
2009 FEB 0 0 0 0 0 0 0 0 0 0 0 0 0 0 0 0 0 0 0 0 0 0 0 0 0 0 0 0
2009 MAR 0 0 0 0 0 0 0 0 0 0 0 0 0 0 0 0 0 0 0 5.3 0 0 0 9.8 0 1 0 0 0 5.5 0
2009 APR 0 7.8 0 0 0 0 0 28.8 0 0 0 0 0 0 0 0 0 0 0 2 0 0 0 0 0 0 0 0.5 0 0
2009 MAY 0 0 0 0 0 0 0 0 0 0 0 0 0 0 0 0 7.8 9.8 1.2 3.4 0 4.6 0 0 0 0 0 0 3 0 0
2009 JUN 0 13.8 0 0 0 0 40.2 0.5 0 0 0 0 0 0.5 0.6 19.2 6 0 15.4 0 0 0 0.2 0 0 8.4 2.5 3.8 0 0
2009 JUL 6.6 6 3.4 12.6 2.8 1.8 2 2.8 11.6 7.4 8.4 6 2.6 3.2 24.6 13.4 6.5 0.6 3 1.1 4.8 3.6 0.4 0.2 0 0 1 1.8 1.4 1 0.4
2009 AUG 0 0.5 0 2.8 0.5 0 0 2 0.6 0.5 0 0.6 0 0 0 0 3.5 0.8 0 0 3.2 0 0.2 0 3 2.6 5.4 0 1 1 0.6
2009 SEP 0 4.6 0 0.2 4.8 1.5 0.2 0 0 0 0.5 3 0 0.5 10 7 5.8 0 0 36 25 18.4 0 19.4 0.6 0 0 3.4 6.4 19.4
2009 OCT 21.4 32.5 22.5 0.6 0 0 0 0 0 0 0 9.8 0.2 0 0 0 0 0 0 0 0 0 0 0 0 0 0 0 0 0 0
2009 NOV 0 0 0 0 0 0 0 0 0.5 0.6 7.4 11.2 0 0 0 0 65.4 0 0 7.2 0 0 0 0 0 0 0 0 0 0
2009 DEC 0 0 0 0 0 0 0 0 0 0 0 0 0 0 0 0 0 0 19.8 0 0 0 0 0 0 0 0 0 9.8 48 0
2010 JAN 0 0 0 0 0 0 0 0 0 0 0 19.2 0 0 0 0 0 0 0 0 0 0 0 0 0 0 0 0 0 0 0
2010 FEB 0 0 0 0 0 0 0 0 0 0 0 0 0 0 0 0 0 0 0 0 0 0 0 0 0 0 0 0
2010 MAR 0 0 0 0 0 0 0 0 0 0 0 0 0 0 0 0 0 0 0 0 0 0 0 0 0 0 0 0 0 0 0
2010 APR 0 0 0 0 0 0 0 0 0 0 0 0 0 0 0 0 22.4 5.6 0 0 0 0 3.6 0 1 0 0 8 4 0
2010 MAY 0 13.5 30.5 0 0 0 0 19 0 10 0 0 0 0 0 0 0 0 8.2 0 0 0 19.8 12.8 0 0 0 0 0 0 0
2010 JUN 0 9.5 0 0 0 0 0 0 0 0 0.5 0 0 6 15 8 9.8 6 5 2.2 0 0 0 2 5.4 5.4 0.2 0 0 0
2010 JUL 1 6 2 2.2 0 0.8 5.5 0 0 0 0 0 0 0 0 18 0.5 0 0.5 8.5 4.5 7 13 2 13.4 22.4 2.8 10 7.5 4.5 1.2
2010 AUG 1 0 0 5 0 0 0.3 1.2 4.2 0.2 0 0 0.5 0 0 0 0 2 0 0.2 0 47.4 0 0 1.6 15.6 0 0.5 2.5 2.2 28.8
2010 SEP 4.6 0.5 0 1 0.8 3.6 0 2.8 1.6 2.4 0 0 0 0 0 0 0.4 0.5 8.6 1 0 38.8 0.5 10.4 0 18.2 9.8 1.6 0 0
2010 OCT 2.4 0 0.6 26.4 9.6 46.8 4.4 0 2.5 2.8 0 0 0 5.5 0 9.8 4.5 0 0 2 0 0 0 1 0 0 0 0 0 0 0.5
2010 NOV 0 0 10.5 16.6 4.4 1 0 24.6 34.8 12.2 0 0.7 0 0 8.7 8.4 0 0 0 0 0 0 0 1.8 0 0 0 0 0 0
2010 DEC 0 0 0 0 0 0 0 0 0 0 0 0 0 0 0 0 0 0 0 0 0 0 0 0 0 0 0 0 0 0 0
2011 JAN 0 0 0 0 0 0 0 0 0 0 0 0 0 0 0 0 0 0 0 0 0 0 0 0 0 0 0 0 0 0 0
2011 FEB 0 0 0 0 0 0 0 0 0 0 0 0 0 0 0 0 0 0 0 0 0 0 0 0.4 0 0 0 0
2011 MAR 0 0 0 0 0 0 0 0 0 0 0 0 0 0 0 0 0 0 0 0 0 0 0 0 0 0 0 0 0 0 0
2011 APR 0 0 0 0 0 0 0 0 0 1.5 0 2.2 0.5 1 6.4 0 3.5 26.6 0 0.6 0 0 0 9.4 0 0 0 0 0 0
2011 MAY 0 0 0 0 0 0 0 0 0 0 0 0 0 0 4.5 0 0 12.4 0 0 0 0 0 0 0 0 3.6 0.6 0 3 14.6
2011 JUN 0 0 3.2 10.6 6.2 4 8 0 5.8 5.6 7.8 12.8 2 0 0.6 0.5 3.2 16.6 7.6 2.4 0.8 0 13.6 0.8 2 0.5 0.6 12.4 0 0
2011 JUL 6.4 1.4 1.6 1.2 4 0 4 6.4 1 0 2.2 0.6 0.2 0.2 1 4.2 11.6 6.2 6 0.6 7.2 1 0.6 5.6 0 0 0 0.2 0 0 0.5
2011 AUG 2 1.2 5 9.6 1.8 0.6 2.5 3.6 2.6 1.4 0.2 0 2.5 1 0 0 1.6 0 7 4.2 8 0.2 0 2 1.4 0 0.2 4 8 3.8 7.2
2011 SEP 7 10.2 7.4 6 2 0.5 3 7.6 7 0 0 0 0 0 0 0 0 0.5 2.5 0 0 0 0 0 0 0 0 0 0 25.6
2011 OCT 0 19.8 0 0 0 19.5 0 0 0 0 6.8 2.2 10.5 23.6 1.6 0 18.4 0 0 34.4 0 0 0 0 0 0 0 3.6 0 0 0
2011 NOV 0 0 0 0 0 0 0 0 0 0 0 0 0 0 0 0 0 0 0 0 0 0 0 0 0 0 0.2 0 0 6
2011 DEC 0 0 0 0 0 0 0 0 0 0 0 0 0 0 0 0 0 0 0 0 0 0 0 0 0 0 0 0 0 0 0
2012 JAN 0 0 0 0 0 0 0 0 0 0 0 0 0 0 0 0 0 0 0 0 0 0 0 0 0 0 0 0 0 0 0
2012 FEB 0 0 0 0 0 0 0 0 0 0 0 0 0 0 0 0 0 0 0 0 0 0 0 0 0 0 0 0
2012 MAR 0 0 0 0 0 0 0 0 0 0 0 0 0 0 0 0 0 0 0 0 0 0 0 0 0 0 0 0 0 0 0
2012 APR 0 0 0 0 0 1 0 0 0 9.2 0.2 9.8 0 0 0 0 0.2 0 28.6 0 8.4 0 0 0 0 0 0 0 0 0
2012 MAY 0 0 0 0 0 0 0 0 0 0 0 1.2 0 0 0 0 0 0 0 0 0 0 0 0 0 0 0 0 0 0 0
2012 JUN 0 0 0 0 4 15.6 1 0.1 0 0 0 0 0 0 0 0 1.8 14.5 3 0 0 0 0 0 1.8 1.6 4.6 3.5 1.4 6
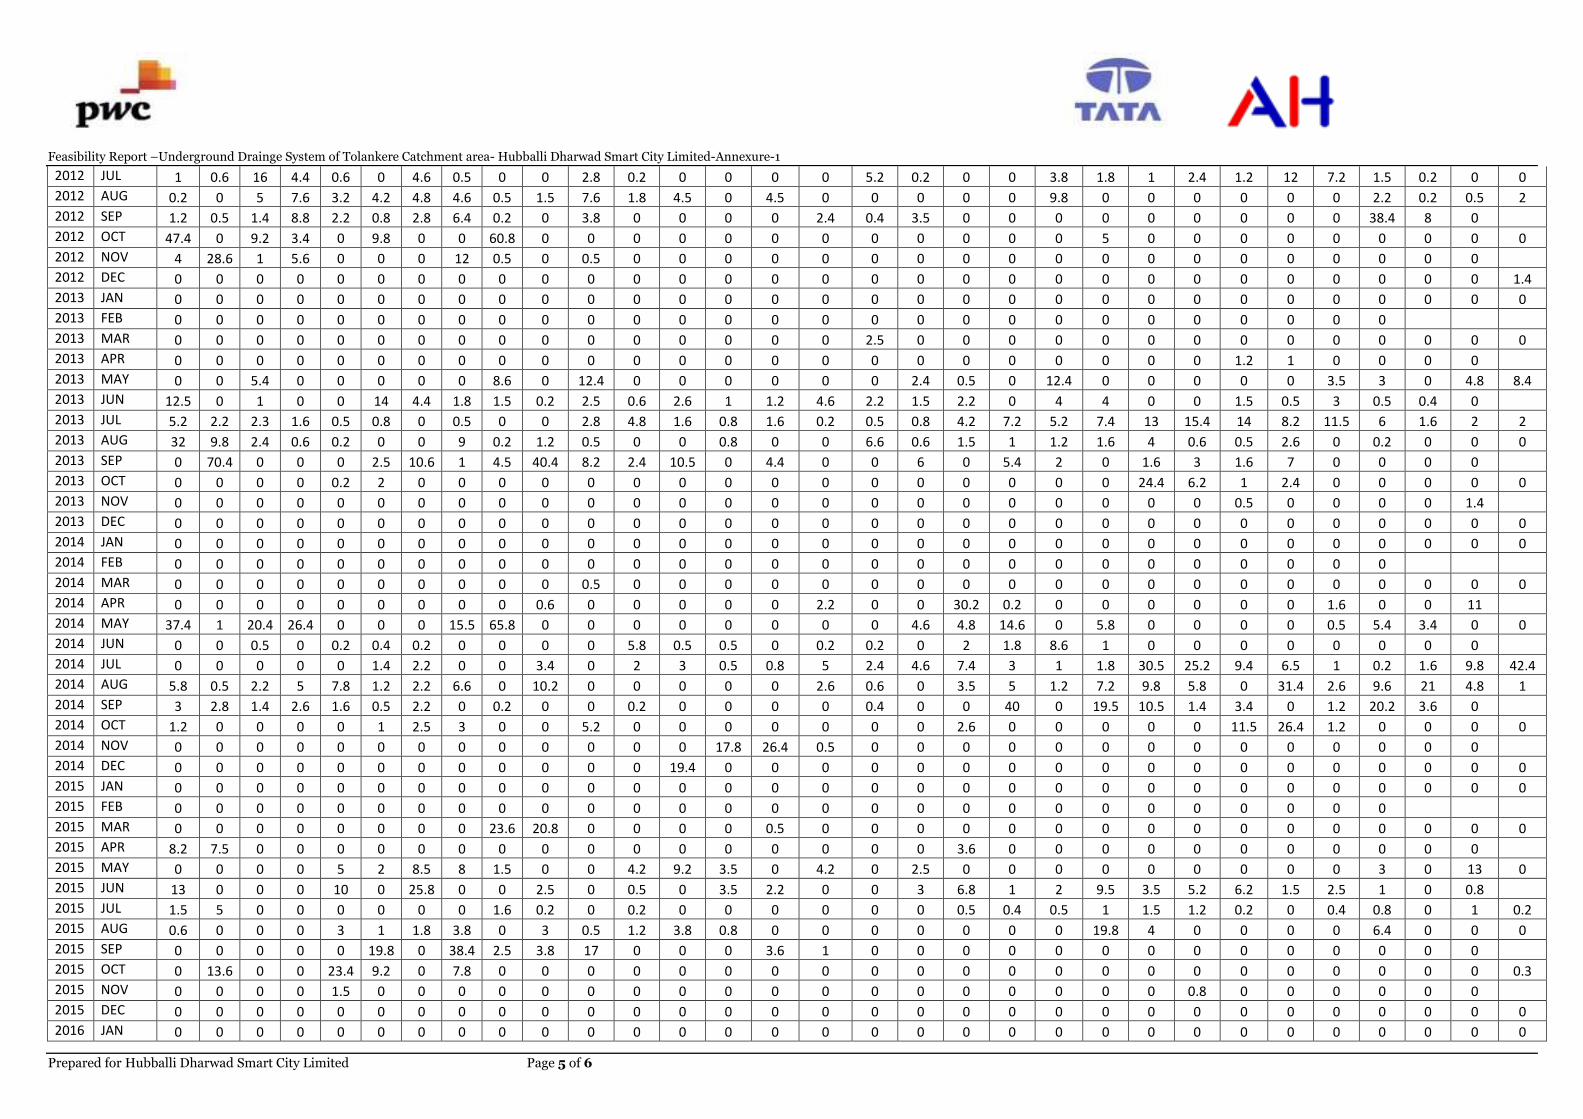
Feasibility Report –Underground Drainge System of Tolankere Catchment area- Hubballi Dharwad Smart City Limited-Annexure-1
Prepared for Hubballi Dharwad Smart City Limited Page 5 of 6
2012 JUL 1 0.6 16 4.4 0.6 0 4.6 0.5 0 0 2.8 0.2 0 0 0 0 5.2 0.2 0 0 3.8 1.8 1 2.4 1.2 12 7.2 1.5 0.2 0 0
2012 AUG 0.2 0 5 7.6 3.2 4.2 4.8 4.6 0.5 1.5 7.6 1.8 4.5 0 4.5 0 0 0 0 0 9.8 0 0 0 0 0 0 2.2 0.2 0.5 2
2012 SEP 1.2 0.5 1.4 8.8 2.2 0.8 2.8 6.4 0.2 0 3.8 0 0 0 0 2.4 0.4 3.5 0 0 0 0 0 0 0 0 0 38.4 8 0
2012 OCT 47.4 0 9.2 3.4 0 9.8 0 0 60.8 0 0 0 0 0 0 0 0 0 0 0 0 5 0 0 0 0 0 0 0 0 0
2012 NOV 4 28.6 1 5.6 0 0 0 12 0.5 0 0.5 0 0 0 0 0 0 0 0 0 0 0 0 0 0 0 0 0 0 0
2012 DEC 0 0 0 0 0 0 0 0 0 0 0 0 0 0 0 0 0 0 0 0 0 0 0 0 0 0 0 0 0 0 1.4
2013 JAN 0 0 0 0 0 0 0 0 0 0 0 0 0 0 0 0 0 0 0 0 0 0 0 0 0 0 0 0 0 0 0
2013 FEB 0 0 0 0 0 0 0 0 0 0 0 0 0 0 0 0 0 0 0 0 0 0 0 0 0 0 0 0
2013 MAR 0 0 0 0 0 0 0 0 0 0 0 0 0 0 0 0 2.5 0 0 0 0 0 0 0 0 0 0 0 0 0 0
2013 APR 0 0 0 0 0 0 0 0 0 0 0 0 0 0 0 0 0 0 0 0 0 0 0 0 1.2 1 0 0 0 0
2013 MAY 0 0 5.4 0 0 0 0 0 8.6 0 12.4 0 0 0 0 0 0 2.4 0.5 0 12.4 0 0 0 0 0 3.5 3 0 4.8 8.4
2013 JUN 12.5 0 1 0 0 14 4.4 1.8 1.5 0.2 2.5 0.6 2.6 1 1.2 4.6 2.2 1.5 2.2 0 4 4 0 0 1.5 0.5 3 0.5 0.4 0
2013 JUL 5.2 2.2 2.3 1.6 0.5 0.8 0 0.5 0 0 2.8 4.8 1.6 0.8 1.6 0.2 0.5 0.8 4.2 7.2 5.2 7.4 13 15.4 14 8.2 11.5 6 1.6 2 2
2013 AUG 32 9.8 2.4 0.6 0.2 0 0 9 0.2 1.2 0.5 0 0 0.8 0 0 6.6 0.6 1.5 1 1.2 1.6 4 0.6 0.5 2.6 0 0.2 0 0 0
2013 SEP 0 70.4 0 0 0 2.5 10.6 1 4.5 40.4 8.2 2.4 10.5 0 4.4 0 0 6 0 5.4 2 0 1.6 3 1.6 7 0 0 0 0
2013 OCT 0 0 0 0 0.2 2 0 0 0 0 0 0 0 0 0 0 0 0 0 0 0 0 24.4 6.2 1 2.4 0 0 0 0 0
2013 NOV 0 0 0 0 0 0 0 0 0 0 0 0 0 0 0 0 0 0 0 0 0 0 0 0 0.5 0 0 0 0 1.4
2013 DEC 0 0 0 0 0 0 0 0 0 0 0 0 0 0 0 0 0 0 0 0 0 0 0 0 0 0 0 0 0 0 0
2014 JAN 0 0 0 0 0 0 0 0 0 0 0 0 0 0 0 0 0 0 0 0 0 0 0 0 0 0 0 0 0 0 0
2014 FEB 0 0 0 0 0 0 0 0 0 0 0 0 0 0 0 0 0 0 0 0 0 0 0 0 0 0 0 0
2014 MAR 0 0 0 0 0 0 0 0 0 0 0.5 0 0 0 0 0 0 0 0 0 0 0 0 0 0 0 0 0 0 0 0
2014 APR 0 0 0 0 0 0 0 0 0 0.6 0 0 0 0 0 2.2 0 0 30.2 0.2 0 0 0 0 0 0 1.6 0 0 11
2014 MAY 37.4 1 20.4 26.4 0 0 0 15.5 65.8 0 0 0 0 0 0 0 0 4.6 4.8 14.6 0 5.8 0 0 0 0 0.5 5.4 3.4 0 0
2014 JUN 0 0 0.5 0 0.2 0.4 0.2 0 0 0 0 5.8 0.5 0.5 0 0.2 0.2 0 2 1.8 8.6 1 0 0 0 0 0 0 0 0
2014 JUL 0 0 0 0 0 1.4 2.2 0 0 3.4 0 2 3 0.5 0.8 5 2.4 4.6 7.4 3 1 1.8 30.5 25.2 9.4 6.5 1 0.2 1.6 9.8 42.4
2014 AUG 5.8 0.5 2.2 5 7.8 1.2 2.2 6.6 0 10.2 0 0 0 0 0 2.6 0.6 0 3.5 5 1.2 7.2 9.8 5.8 0 31.4 2.6 9.6 21 4.8 1
2014 SEP 3 2.8 1.4 2.6 1.6 0.5 2.2 0 0.2 0 0 0.2 0 0 0 0 0.4 0 0 40 0 19.5 10.5 1.4 3.4 0 1.2 20.2 3.6 0
2014 OCT 1.2 0 0 0 0 1 2.5 3 0 0 5.2 0 0 0 0 0 0 0 2.6 0 0 0 0 0 11.5 26.4 1.2 0 0 0 0
2014 NOV 0 0 0 0 0 0 0 0 0 0 0 0 0 17.8 26.4 0.5 0 0 0 0 0 0 0 0 0 0 0 0 0 0
2014 DEC 0 0 0 0 0 0 0 0 0 0 0 0 19.4 0 0 0 0 0 0 0 0 0 0 0 0 0 0 0 0 0 0
2015 JAN 0 0 0 0 0 0 0 0 0 0 0 0 0 0 0 0 0 0 0 0 0 0 0 0 0 0 0 0 0 0 0
2015 FEB 0 0 0 0 0 0 0 0 0 0 0 0 0 0 0 0 0 0 0 0 0 0 0 0 0 0 0 0
2015 MAR 0 0 0 0 0 0 0 0 23.6 20.8 0 0 0 0 0.5 0 0 0 0 0 0 0 0 0 0 0 0 0 0 0 0
2015 APR 8.2 7.5 0 0 0 0 0 0 0 0 0 0 0 0 0 0 0 0 3.6 0 0 0 0 0 0 0 0 0 0 0
2015 MAY 0 0 0 0 5 2 8.5 8 1.5 0 0 4.2 9.2 3.5 0 4.2 0 2.5 0 0 0 0 0 0 0 0 0 3 0 13 0
2015 JUN 13 0 0 0 10 0 25.8 0 0 2.5 0 0.5 0 3.5 2.2 0 0 3 6.8 1 2 9.5 3.5 5.2 6.2 1.5 2.5 1 0 0.8
2015 JUL 1.5 5 0 0 0 0 0 0 1.6 0.2 0 0.2 0 0 0 0 0 0 0.5 0.4 0.5 1 1.5 1.2 0.2 0 0.4 0.8 0 1 0.2
2015 AUG 0.6 0 0 0 3 1 1.8 3.8 0 3 0.5 1.2 3.8 0.8 0 0 0 0 0 0 0 19.8 4 0 0 0 0 6.4 0 0 0
2015 SEP 0 0 0 0 0 19.8 0 38.4 2.5 3.8 17 0 0 0 3.6 1 0 0 0 0 0 0 0 0 0 0 0 0 0 0
2015 OCT 0 13.6 0 0 23.4 9.2 0 7.8 0 0 0 0 0 0 0 0 0 0 0 0 0 0 0 0 0 0 0 0 0 0 0.3
2015 NOV 0 0 0 0 1.5 0 0 0 0 0 0 0 0 0 0 0 0 0 0 0 0 0 0 0.8 0 0 0 0 0 0
2015 DEC 0 0 0 0 0 0 0 0 0 0 0 0 0 0 0 0 0 0 0 0 0 0 0 0 0 0 0 0 0 0 0
2016 JAN 0 0 0 0 0 0 0 0 0 0 0 0 0 0 0 0 0 0 0 0 0 0 0 0 0 0 0 0 0 0 0
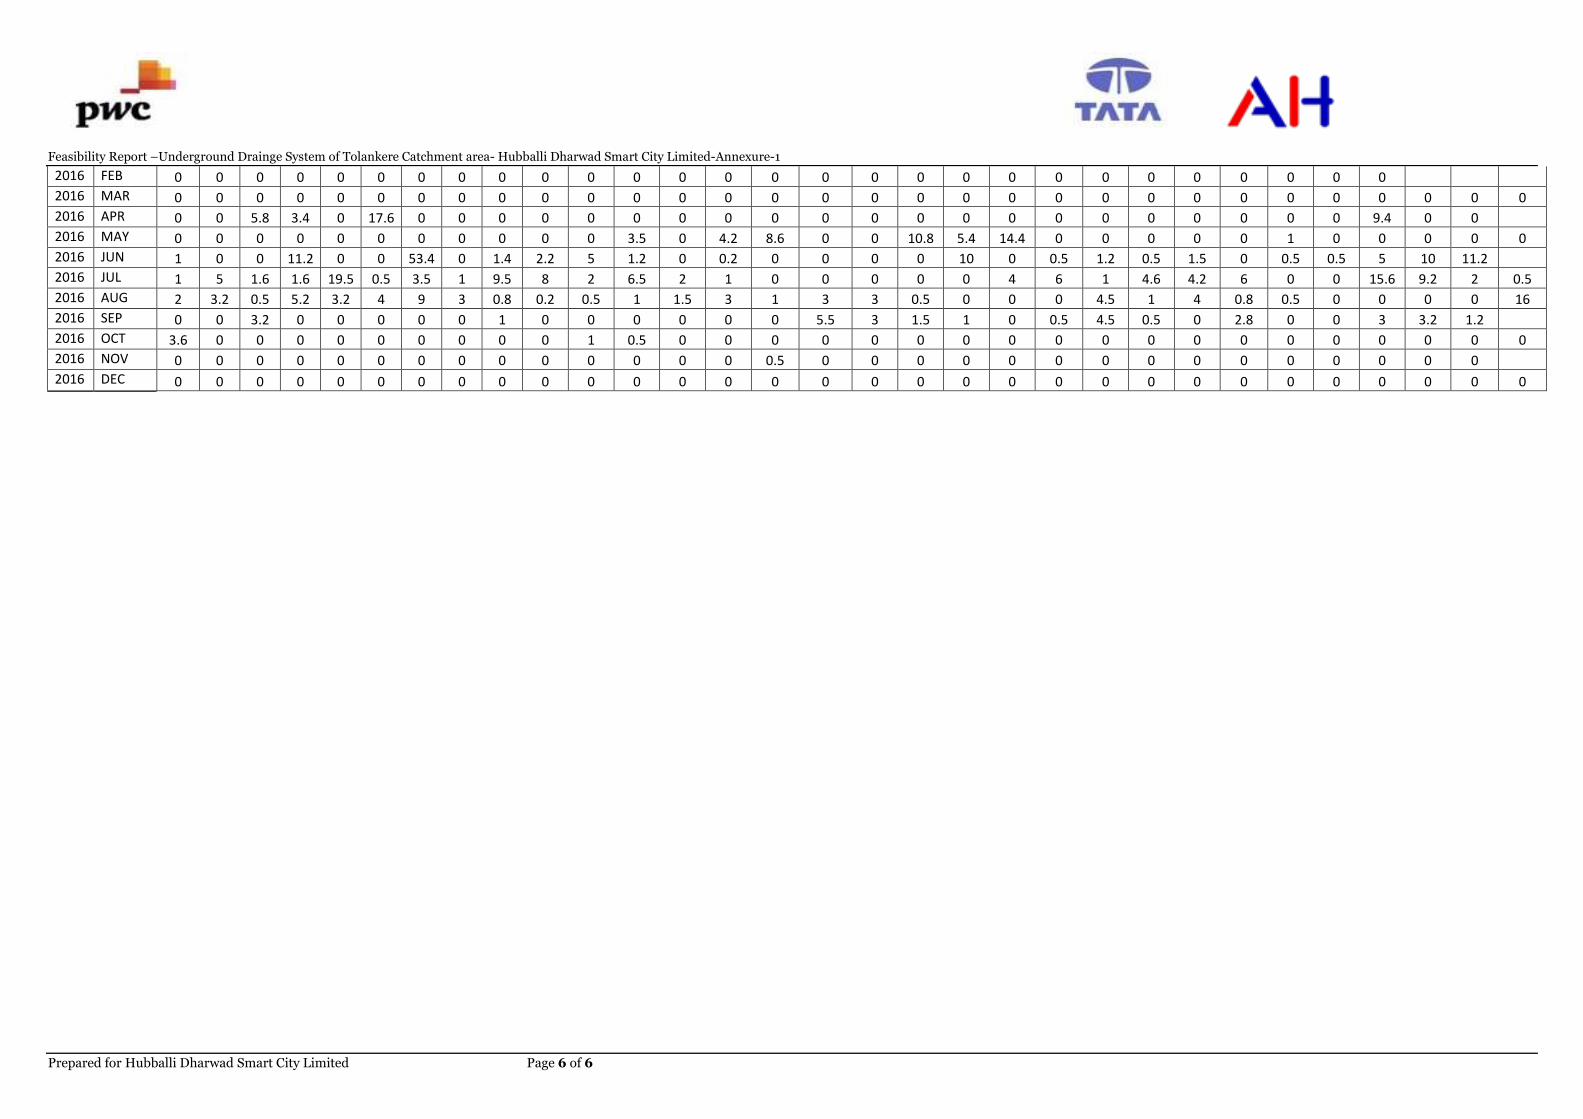
Feasibility Report –Underground Drainge System of Tolankere Catchment area- Hubballi Dharwad Smart City Limited-Annexure-1
Prepared for Hubballi Dharwad Smart City Limited Page 6 of 6
2016 FEB 0 0 0 0 0 0 0 0 0 0 0 0 0 0 0 0 0 0 0 0 0 0 0 0 0 0 0 0
2016 MAR 0 0 0 0 0 0 0 0 0 0 0 0 0 0 0 0 0 0 0 0 0 0 0 0 0 0 0 0 0 0 0
2016 APR 0 0 5.8 3.4 0 17.6 0 0 0 0 0 0 0 0 0 0 0 0 0 0 0 0 0 0 0 0 0 9.4 0 0
2016 MAY 0 0 0 0 0 0 0 0 0 0 0 3.5 0 4.2 8.6 0 0 10.8 5.4 14.4 0 0 0 0 0 1 0 0 0 0 0
2016 JUN 1 0 0 11.2 0 0 53.4 0 1.4 2.2 5 1.2 0 0.2 0 0 0 0 10 0 0.5 1.2 0.5 1.5 0 0.5 0.5 5 10 11.2
2016 JUL 1 5 1.6 1.6 19.5 0.5 3.5 1 9.5 8 2 6.5 2 1 0 0 0 0 0 4 6 1 4.6 4.2 6 0 0 15.6 9.2 2 0.5
2016 AUG 2 3.2 0.5 5.2 3.2 4 9 3 0.8 0.2 0.5 1 1.5 3 1 3 3 0.5 0 0 0 4.5 1 4 0.8 0.5 0 0 0 0 16
2016 SEP 0 0 3.2 0 0 0 0 0 1 0 0 0 0 0 0 5.5 3 1.5 1 0 0.5 4.5 0.5 0 2.8 0 0 3 3.2 1.2
2016 OCT 3.6 0 0 0 0 0 0 0 0 0 1 0.5 0 0 0 0 0 0 0 0 0 0 0 0 0 0 0 0 0 0 0
2016 NOV 0 0 0 0 0 0 0 0 0 0 0 0 0 0 0.5 0 0 0 0 0 0 0 0 0 0 0 0 0 0 0
2016 DEC 0 0 0 0 0 0 0 0 0 0 0 0 0 0 0 0 0 0 0 0 0 0 0 0 0 0 0 0 0 0 0
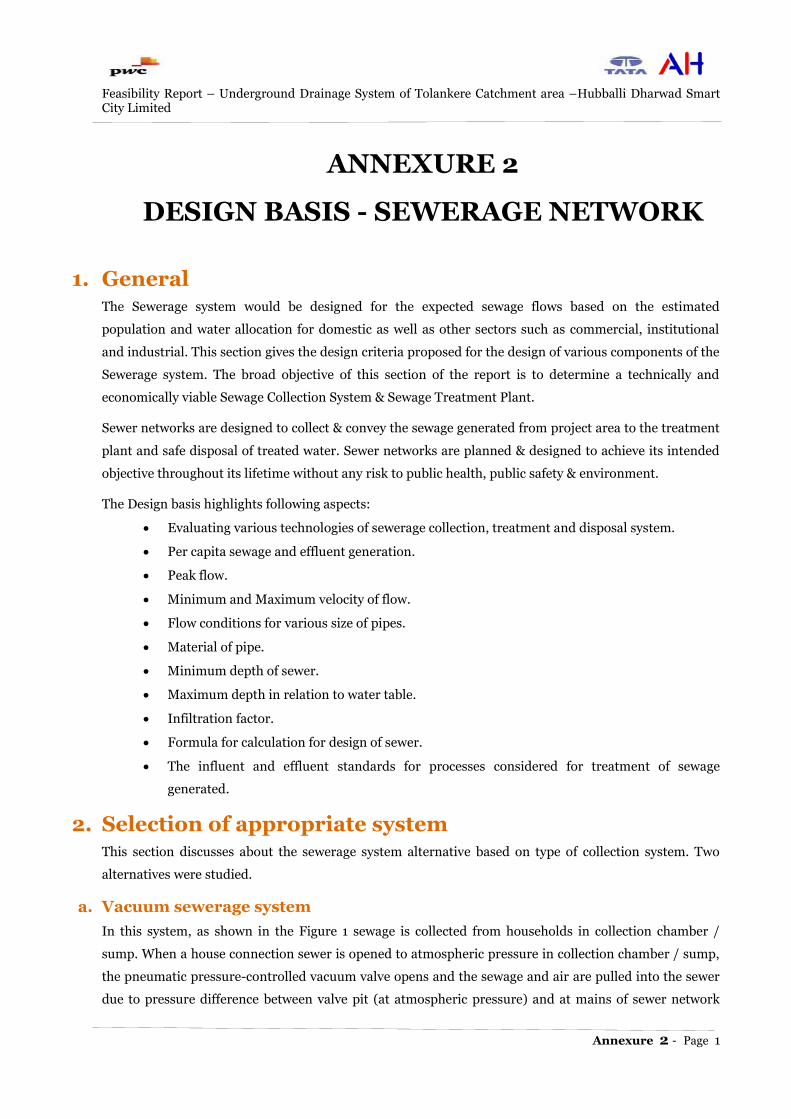
Feasibility Report – Underground Drainage System of Tolankere Catchment area –Hubballi Dharwad Smart City Limited
Annexure 2 - Page 1
ANNEXURE 2
DESIGN BASIS - SEWERAGE NETWORK
1. General The Sewerage system would be designed for the expected sewage flows based on the estimated
population and water allocation for domestic as well as other sectors such as commercial, institutional
and industrial. This section gives the design criteria proposed for the design of various components of the
Sewerage system. The broad objective of this section of the report is to determine a technically and
economically viable Sewage Collection System & Sewage Treatment Plant.
Sewer networks are designed to collect & convey the sewage generated from project area to the treatment
plant and safe disposal of treated water. Sewer networks are planned & designed to achieve its intended
objective throughout its lifetime without any risk to public health, public safety & environment.
The Design basis highlights following aspects:
Evaluating various technologies of sewerage collection, treatment and disposal system.
Per capita sewage and effluent generation.
Peak flow.
Minimum and Maximum velocity of flow.
Flow conditions for various size of pipes.
Material of pipe.
Minimum depth of sewer.
Maximum depth in relation to water table.
Infiltration factor.
Formula for calculation for design of sewer.
The influent and effluent standards for processes considered for treatment of sewage
generated.
2. Selection of appropriate system This section discusses about the sewerage system alternative based on type of collection system. Two
alternatives were studied.
a. Vacuum sewerage system
In this system, as shown in the Figure 1 sewage is collected from households in collection chamber /
sump. When a house connection sewer is opened to atmospheric pressure in collection chamber / sump,
the pneumatic pressure-controlled vacuum valve opens and the sewage and air are pulled into the sewer
due to pressure difference between valve pit (at atmospheric pressure) and at mains of sewer network
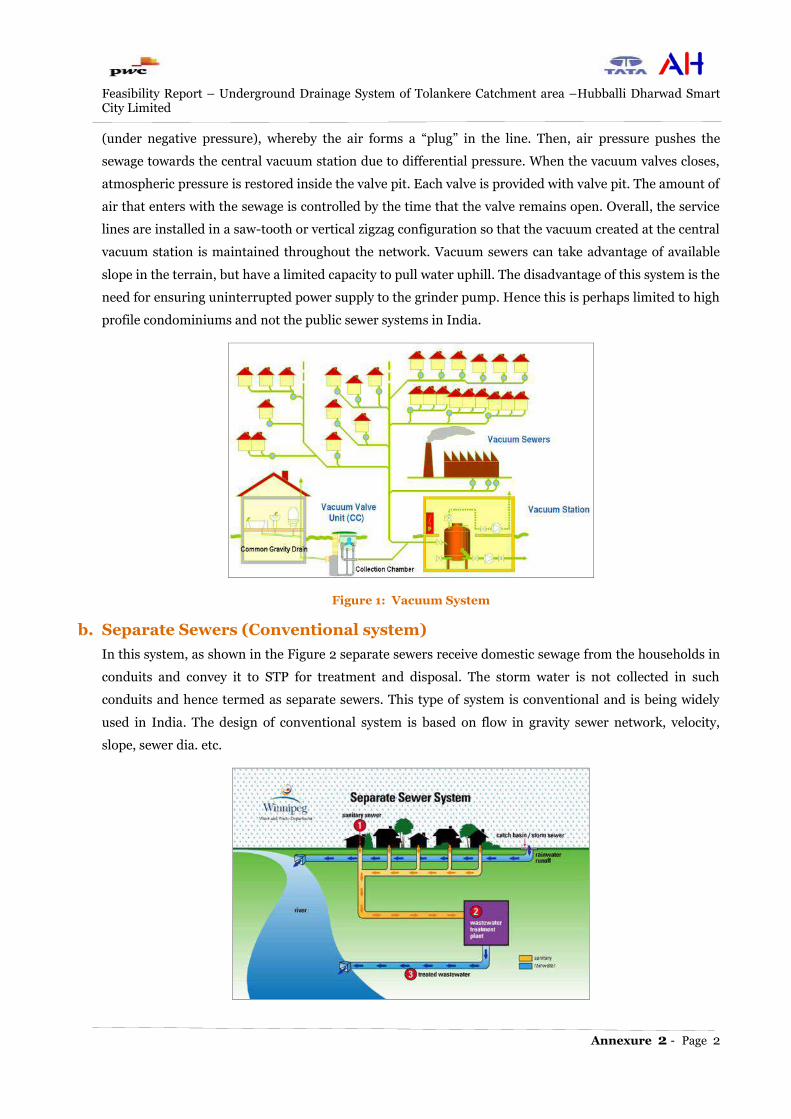
Feasibility Report – Underground Drainage System of Tolankere Catchment area –Hubballi Dharwad Smart City Limited
Annexure 2 - Page 2
(under negative pressure), whereby the air forms a “plug” in the line. Then, air pressure pushes the
sewage towards the central vacuum station due to differential pressure. When the vacuum valves closes,
atmospheric pressure is restored inside the valve pit. Each valve is provided with valve pit. The amount of
air that enters with the sewage is controlled by the time that the valve remains open. Overall, the service
lines are installed in a saw-tooth or vertical zigzag configuration so that the vacuum created at the central
vacuum station is maintained throughout the network. Vacuum sewers can take advantage of available
slope in the terrain, but have a limited capacity to pull water uphill. The disadvantage of this system is the
need for ensuring uninterrupted power supply to the grinder pump. Hence this is perhaps limited to high
profile condominiums and not the public sewer systems in India.
Figure 1: Vacuum System
b. Separate Sewers (Conventional system)
In this system, as shown in the Figure 2 separate sewers receive domestic sewage from the households in
conduits and convey it to STP for treatment and disposal. The storm water is not collected in such
conduits and hence termed as separate sewers. This type of system is conventional and is being widely
used in India. The design of conventional system is based on flow in gravity sewer network, velocity,
slope, sewer dia. etc.
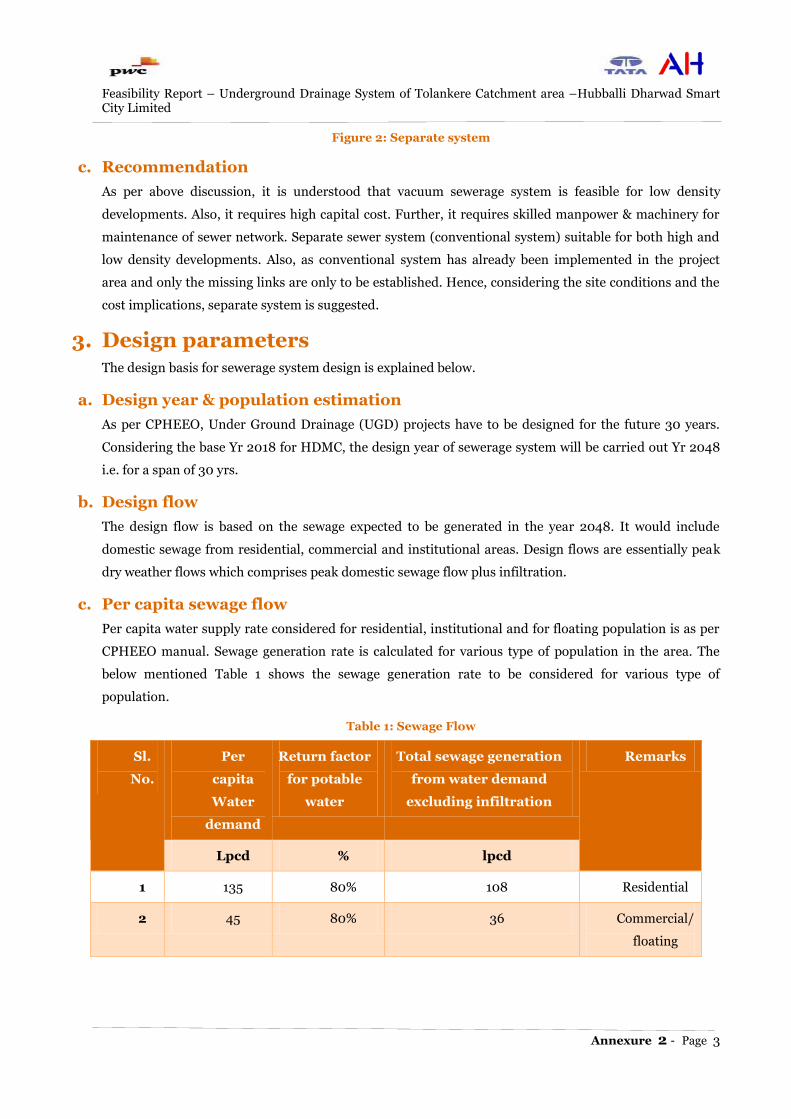
Feasibility Report – Underground Drainage System of Tolankere Catchment area –Hubballi Dharwad Smart City Limited
Annexure 2 - Page 3
Figure 2: Separate system
c. Recommendation
As per above discussion, it is understood that vacuum sewerage system is feasible for low density
developments. Also, it requires high capital cost. Further, it requires skilled manpower & machinery for
maintenance of sewer network. Separate sewer system (conventional system) suitable for both high and
low density developments. Also, as conventional system has already been implemented in the project
area and only the missing links are only to be established. Hence, considering the site conditions and the
cost implications, separate system is suggested.
3. Design parameters The design basis for sewerage system design is explained below.
a. Design year & population estimation
As per CPHEEO, Under Ground Drainage (UGD) projects have to be designed for the future 30 years.
Considering the base Yr 2018 for HDMC, the design year of sewerage system will be carried out Yr 2048
i.e. for a span of 30 yrs.
b. Design flow
The design flow is based on the sewage expected to be generated in the year 2048. It would include
domestic sewage from residential, commercial and institutional areas. Design flows are essentially peak
dry weather flows which comprises peak domestic sewage flow plus infiltration.
c. Per capita sewage flow
Per capita water supply rate considered for residential, institutional and for floating population is as per
CPHEEO manual. Sewage generation rate is calculated for various type of population in the area. The
below mentioned Table 1 shows the sewage generation rate to be considered for various type of
population.
Table 1: Sewage Flow
Sl.
No.
Per
capita
Water
demand
Return factor
for potable
water
Total sewage generation
from water demand
excluding infiltration
Remarks
Lpcd % lpcd
1 135 80% 108 Residential
2 45 80% 36 Commercial/
floating
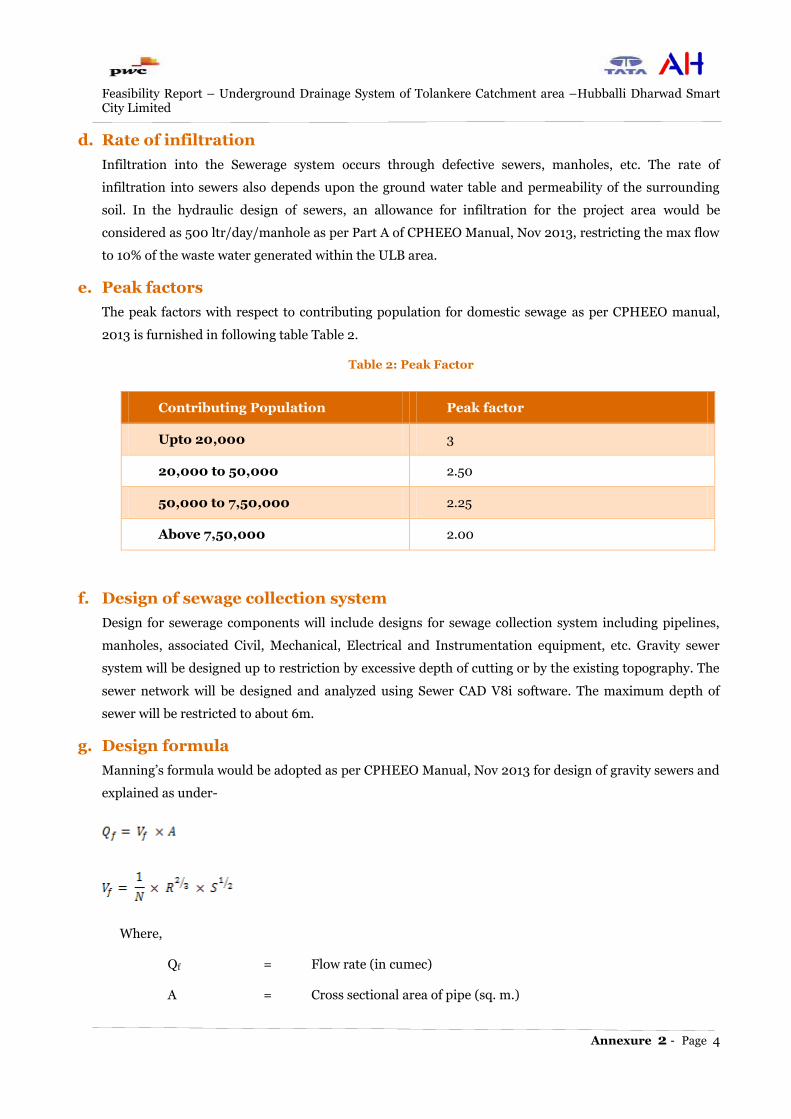
Feasibility Report – Underground Drainage System of Tolankere Catchment area –Hubballi Dharwad Smart City Limited
Annexure 2 - Page 4
d. Rate of infiltration
Infiltration into the Sewerage system occurs through defective sewers, manholes, etc. The rate of
infiltration into sewers also depends upon the ground water table and permeability of the surrounding
soil. In the hydraulic design of sewers, an allowance for infiltration for the project area would be
considered as 500 ltr/day/manhole as per Part A of CPHEEO Manual, Nov 2013, restricting the max flow
to 10% of the waste water generated within the ULB area.
e. Peak factors
The peak factors with respect to contributing population for domestic sewage as per CPHEEO manual,
2013 is furnished in following table Table 2.
Table 2: Peak Factor
Contributing Population Peak factor
Upto 20,000 3
20,000 to 50,000 2.50
50,000 to 7,50,000 2.25
Above 7,50,000 2.00
f. Design of sewage collection system
Design for sewerage components will include designs for sewage collection system including pipelines,
manholes, associated Civil, Mechanical, Electrical and Instrumentation equipment, etc. Gravity sewer
system will be designed up to restriction by excessive depth of cutting or by the existing topography. The
sewer network will be designed and analyzed using Sewer CAD V8i software. The maximum depth of
sewer will be restricted to about 6m.
g. Design formula
Manning‟s formula would be adopted as per CPHEEO Manual, Nov 2013 for design of gravity sewers and
explained as under-
Where,
Qf = Flow rate (in cumec)
A = Cross sectional area of pipe (sq. m.)
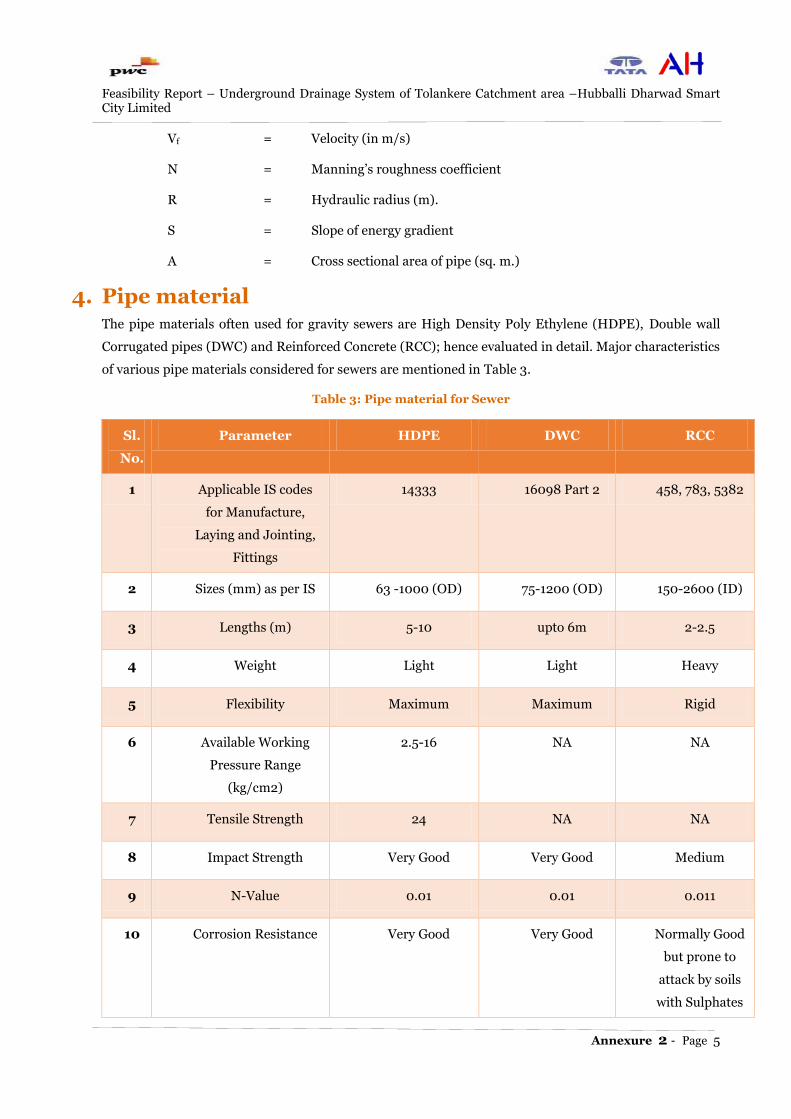
Feasibility Report – Underground Drainage System of Tolankere Catchment area –Hubballi Dharwad Smart City Limited
Annexure 2 - Page 5
Vf = Velocity (in m/s)
N = Manning‟s roughness coefficient
R = Hydraulic radius (m).
S = Slope of energy gradient
A = Cross sectional area of pipe (sq. m.)
4. Pipe material The pipe materials often used for gravity sewers are High Density Poly Ethylene (HDPE), Double wall
Corrugated pipes (DWC) and Reinforced Concrete (RCC); hence evaluated in detail. Major characteristics
of various pipe materials considered for sewers are mentioned in Table 3.
Table 3: Pipe material for Sewer
Sl.
No.
Parameter HDPE DWC RCC
1 Applicable IS codes
for Manufacture,
Laying and Jointing,
Fittings
14333 16098 Part 2 458, 783, 5382
2 Sizes (mm) as per IS 63 -1000 (OD) 75-1200 (OD) 150-2600 (ID)
3 Lengths (m) 5-10 upto 6m 2-2.5
4 Weight Light Light Heavy
5 Flexibility Maximum Maximum Rigid
6 Available Working
Pressure Range
(kg/cm2)
2.5-16 NA NA
7 Tensile Strength 24 NA NA
8 Impact Strength Very Good Very Good Medium
9 N-Value 0.01 0.01 0.011
10 Corrosion Resistance Very Good Very Good Normally Good
but prone to
attack by soils
with Sulphates
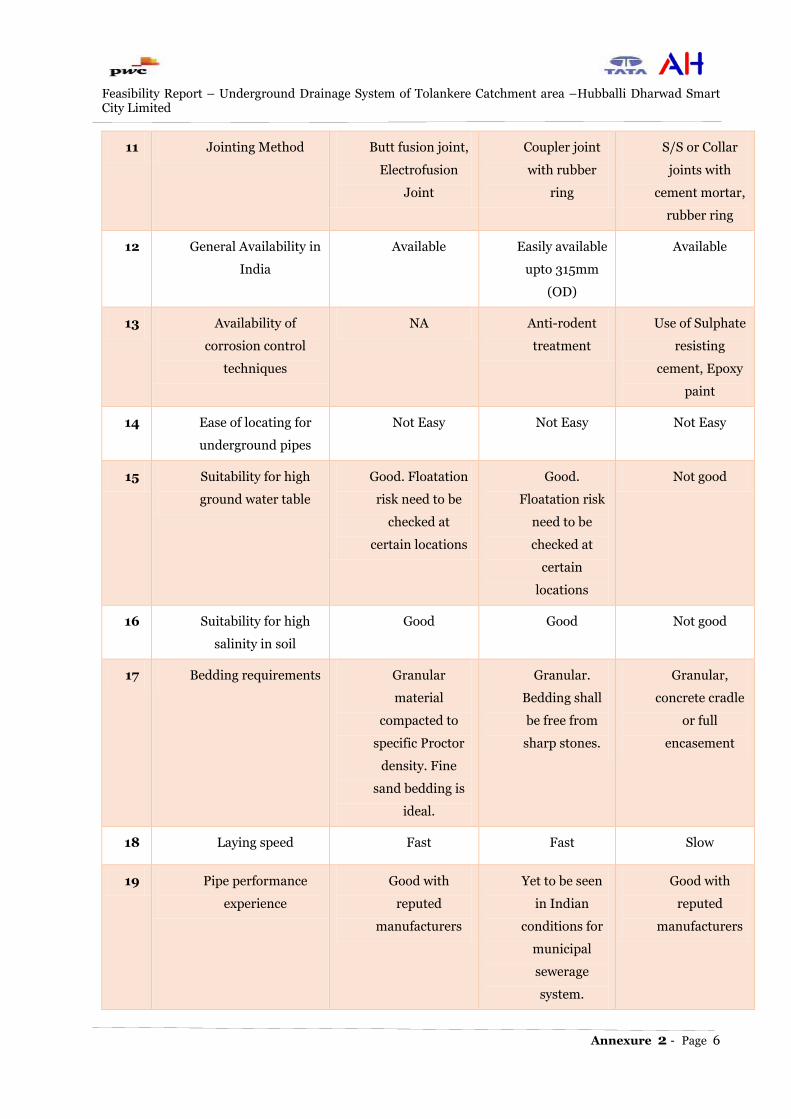
Feasibility Report – Underground Drainage System of Tolankere Catchment area –Hubballi Dharwad Smart City Limited
Annexure 2 - Page 6
11 Jointing Method Butt fusion joint,
Electrofusion
Joint
Coupler joint
with rubber
ring
S/S or Collar
joints with
cement mortar,
rubber ring
12 General Availability in
India
Available Easily available
upto 315mm
(OD)
Available
13 Availability of
corrosion control
techniques
NA Anti-rodent
treatment
Use of Sulphate
resisting
cement, Epoxy
paint
14 Ease of locating for
underground pipes
Not Easy Not Easy Not Easy
15 Suitability for high
ground water table
Good. Floatation
risk need to be
checked at
certain locations
Good.
Floatation risk
need to be
checked at
certain
locations
Not good
16 Suitability for high
salinity in soil
Good Good Not good
17 Bedding requirements Granular
material
compacted to
specific Proctor
density. Fine
sand bedding is
ideal.
Granular.
Bedding shall
be free from
sharp stones.
Granular,
concrete cradle
or full
encasement
18 Laying speed Fast Fast Slow
19 Pipe performance
experience
Good with
reputed
manufacturers
Yet to be seen
in Indian
conditions for
municipal
sewerage
system.
Good with
reputed
manufacturers

Feasibility Report – Underground Drainage System of Tolankere Catchment area –Hubballi Dharwad Smart City Limited
Annexure 2 - Page 7
20 Basic cost economics Costlier than RCC
and DWC
Costlier than
RCC, cheaper
than HDPE
Cheaper than
DWC and
HDPE,
Factors affecting selection of sewer pipe material
For Gravity Sewers, selection of pipe materials for sewage conveyance will be based on following factors-
Availability of pipe in required sizes, lengths
Ease of handling and installation
Physical strength
Any special bedding requirements.
Flow characteristics or friction coefficient.
Joint water-tightness and ease of installation.
Ease in Repairs and maintenance.
Cost economics.
Soil & Ground Water characteristics
The cost comparison of pipes is mentioned in Table 4.
Table 4: Cost comparison of pipes
Sewer dia
(mm)
HDPE, PN 6,
PE-100
DWC, SN8 RCC, NP3
Rate (Rs.) / m Rate (Rs.) / m Rate (Rs.) / m
150/160/170 767 751 -
200 1134 1178 -
250 1735 1603 -
300/315 2750 2138 997
350/355 3430 - 1183
400 4361 3300 1329
450 5453 - 1517
500 7160 5274 1642
600/630 11109 7249 2429
700/710 14235 - 3008
800 17728 11938 3915
900 22123 - 4888
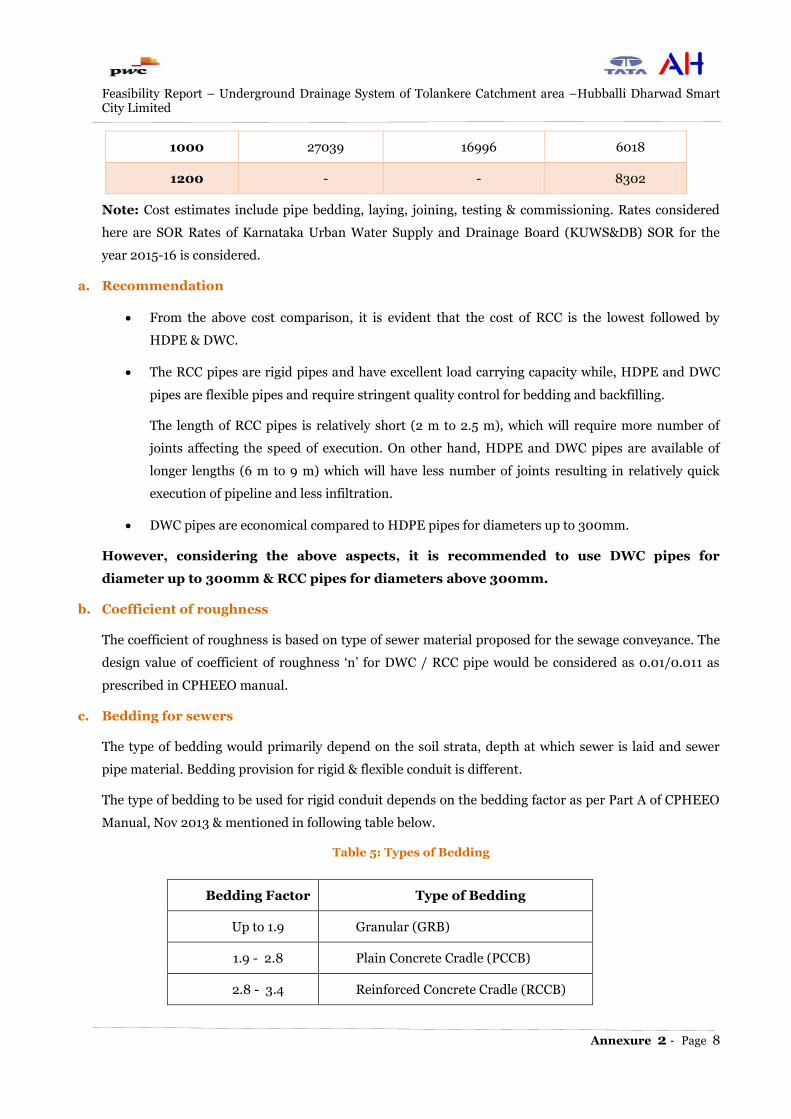
Feasibility Report – Underground Drainage System of Tolankere Catchment area –Hubballi Dharwad Smart City Limited
Annexure 2 - Page 8
1000 27039 16996 6018
1200 - - 8302
Note: Cost estimates include pipe bedding, laying, joining, testing & commissioning. Rates considered
here are SOR Rates of Karnataka Urban Water Supply and Drainage Board (KUWS&DB) SOR for the
year 2015-16 is considered.
a. Recommendation
From the above cost comparison, it is evident that the cost of RCC is the lowest followed by
HDPE & DWC.
The RCC pipes are rigid pipes and have excellent load carrying capacity while, HDPE and DWC
pipes are flexible pipes and require stringent quality control for bedding and backfilling.
The length of RCC pipes is relatively short (2 m to 2.5 m), which will require more number of
joints affecting the speed of execution. On other hand, HDPE and DWC pipes are available of
longer lengths (6 m to 9 m) which will have less number of joints resulting in relatively quick
execution of pipeline and less infiltration.
DWC pipes are economical compared to HDPE pipes for diameters up to 300mm.
However, considering the above aspects, it is recommended to use DWC pipes for
diameter up to 300mm & RCC pipes for diameters above 300mm.
b. Coefficient of roughness
The coefficient of roughness is based on type of sewer material proposed for the sewage conveyance. The
design value of coefficient of roughness „n‟ for DWC / RCC pipe would be considered as 0.01/0.011 as
prescribed in CPHEEO manual.
c. Bedding for sewers
The type of bedding would primarily depend on the soil strata, depth at which sewer is laid and sewer
pipe material. Bedding provision for rigid & flexible conduit is different.
The type of bedding to be used for rigid conduit depends on the bedding factor as per Part A of CPHEEO
Manual, Nov 2013 & mentioned in following table below.
Table 5: Types of Bedding
Bedding Factor Type of Bedding
Up to 1.9 Granular (GRB)
1.9 - 2.8 Plain Concrete Cradle (PCCB)
2.8 - 3.4 Reinforced Concrete Cradle (RCCB)
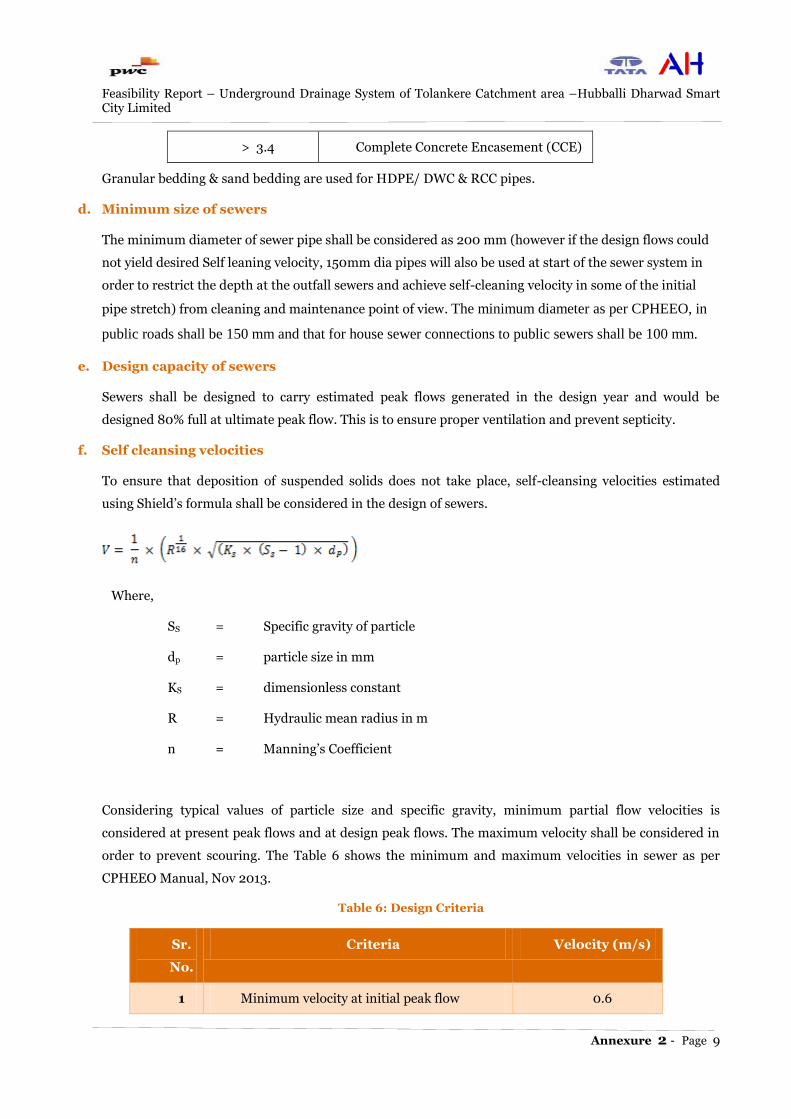
Feasibility Report – Underground Drainage System of Tolankere Catchment area –Hubballi Dharwad Smart City Limited
Annexure 2 - Page 9
> 3.4 Complete Concrete Encasement (CCE)
Granular bedding & sand bedding are used for HDPE/ DWC & RCC pipes.
d. Minimum size of sewers
The minimum diameter of sewer pipe shall be considered as 200 mm (however if the design flows could
not yield desired Self leaning velocity, 150mm dia pipes will also be used at start of the sewer system in
order to restrict the depth at the outfall sewers and achieve self-cleaning velocity in some of the initial
pipe stretch) from cleaning and maintenance point of view. The minimum diameter as per CPHEEO, in
public roads shall be 150 mm and that for house sewer connections to public sewers shall be 100 mm.
e. Design capacity of sewers
Sewers shall be designed to carry estimated peak flows generated in the design year and would be
designed 80% full at ultimate peak flow. This is to ensure proper ventilation and prevent septicity.
f. Self cleansing velocities
To ensure that deposition of suspended solids does not take place, self-cleansing velocities estimated
using Shield‟s formula shall be considered in the design of sewers.
Where,
SS = Specific gravity of particle
dp = particle size in mm
KS = dimensionless constant
R = Hydraulic mean radius in m
n = Manning‟s Coefficient
Considering typical values of particle size and specific gravity, minimum partial flow velocities is
considered at present peak flows and at design peak flows. The maximum velocity shall be considered in
order to prevent scouring. The Table 6 shows the minimum and maximum velocities in sewer as per
CPHEEO Manual, Nov 2013.
Table 6: Design Criteria
Sr.
No.
Criteria Velocity (m/s)
1 Minimum velocity at initial peak flow 0.6
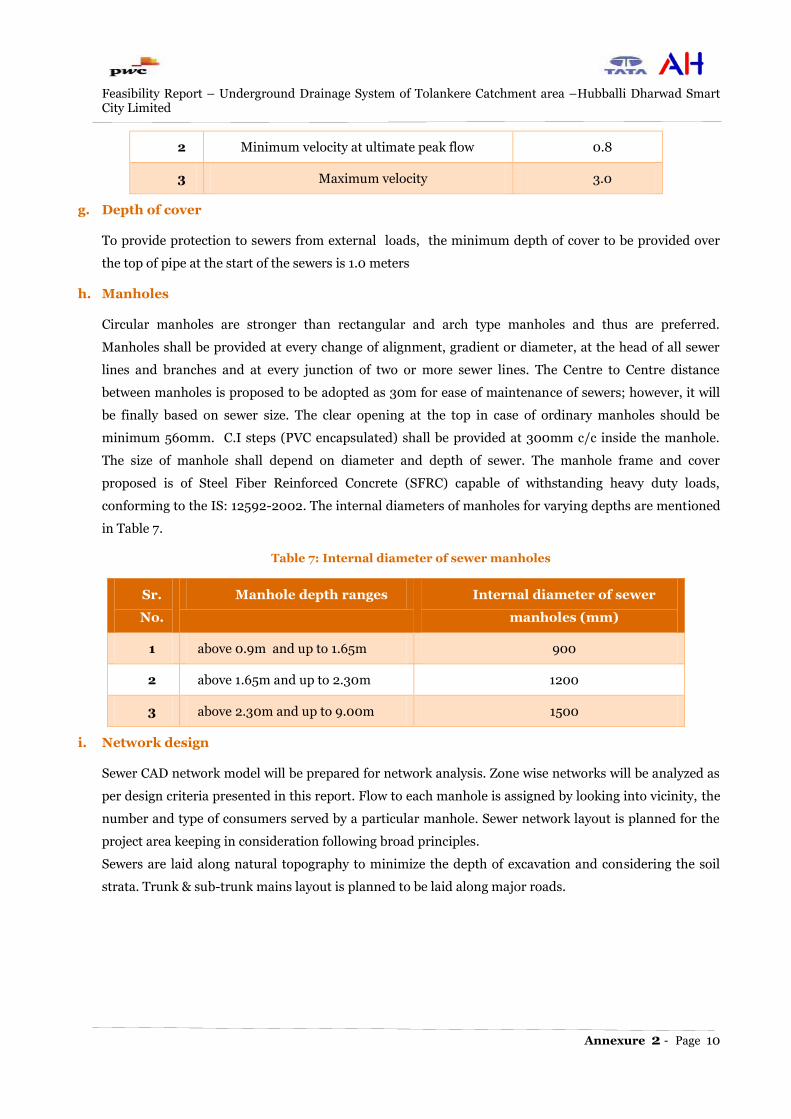
Feasibility Report – Underground Drainage System of Tolankere Catchment area –Hubballi Dharwad Smart City Limited
Annexure 2 - Page 10
2 Minimum velocity at ultimate peak flow 0.8
3 Maximum velocity 3.0
g. Depth of cover
To provide protection to sewers from external loads, the minimum depth of cover to be provided over
the top of pipe at the start of the sewers is 1.0 meters
h. Manholes
Circular manholes are stronger than rectangular and arch type manholes and thus are preferred.
Manholes shall be provided at every change of alignment, gradient or diameter, at the head of all sewer
lines and branches and at every junction of two or more sewer lines. The Centre to Centre distance
between manholes is proposed to be adopted as 30m for ease of maintenance of sewers; however, it will
be finally based on sewer size. The clear opening at the top in case of ordinary manholes should be
minimum 560mm. C.I steps (PVC encapsulated) shall be provided at 300mm c/c inside the manhole.
The size of manhole shall depend on diameter and depth of sewer. The manhole frame and cover
proposed is of Steel Fiber Reinforced Concrete (SFRC) capable of withstanding heavy duty loads,
conforming to the IS: 12592-2002. The internal diameters of manholes for varying depths are mentioned
in Table 7.
Table 7: Internal diameter of sewer manholes
Sr.
No.
Manhole depth ranges Internal diameter of sewer
manholes (mm)
1 above 0.9m and up to 1.65m 900
2 above 1.65m and up to 2.30m 1200
3 above 2.30m and up to 9.00m 1500
i. Network design
Sewer CAD network model will be prepared for network analysis. Zone wise networks will be analyzed as
per design criteria presented in this report. Flow to each manhole is assigned by looking into vicinity, the
number and type of consumers served by a particular manhole. Sewer network layout is planned for the
project area keeping in consideration following broad principles.
Sewers are laid along natural topography to minimize the depth of excavation and considering the soil
strata. Trunk & sub-trunk mains layout is planned to be laid along major roads.
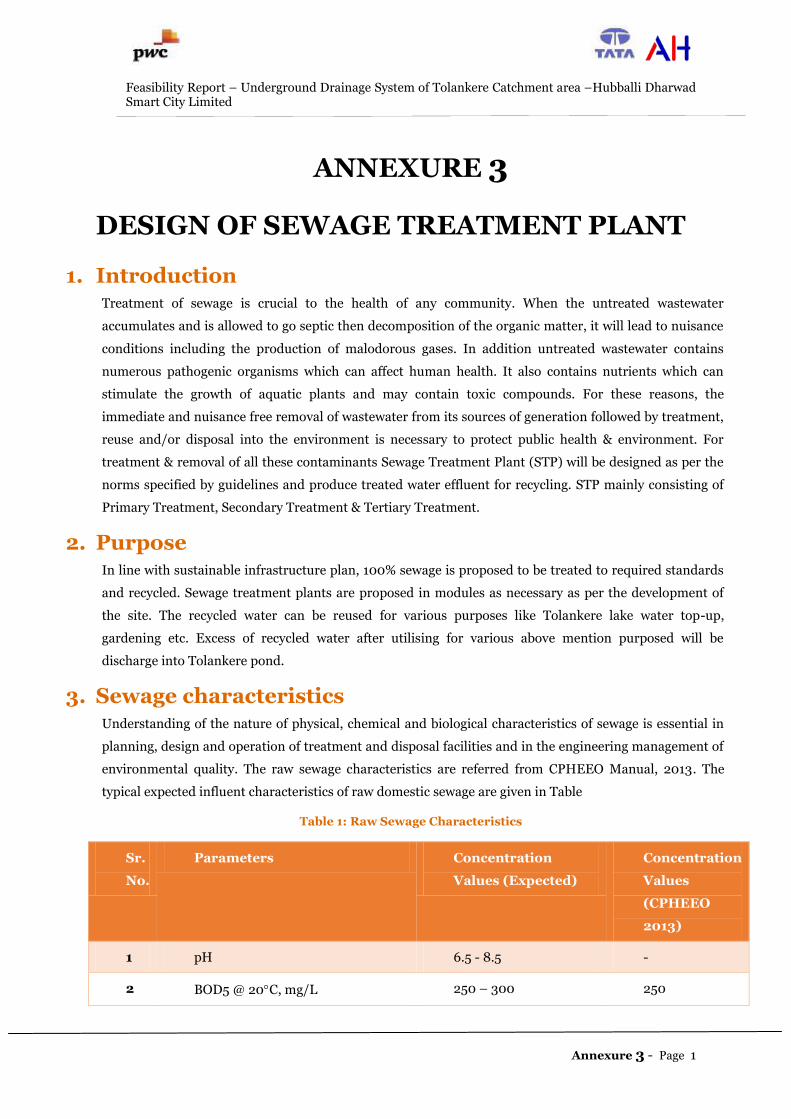
Feasibility Report – Underground Drainage System of Tolankere Catchment area –Hubballi Dharwad Smart City Limited
Annexure 3 - Page 1
ANNEXURE 3
DESIGN OF SEWAGE TREATMENT PLANT
1. Introduction Treatment of sewage is crucial to the health of any community. When the untreated wastewater
accumulates and is allowed to go septic then decomposition of the organic matter, it will lead to nuisance
conditions including the production of malodorous gases. In addition untreated wastewater contains
numerous pathogenic organisms which can affect human health. It also contains nutrients which can
stimulate the growth of aquatic plants and may contain toxic compounds. For these reasons, the
immediate and nuisance free removal of wastewater from its sources of generation followed by treatment,
reuse and/or disposal into the environment is necessary to protect public health & environment. For
treatment & removal of all these contaminants Sewage Treatment Plant (STP) will be designed as per the
norms specified by guidelines and produce treated water effluent for recycling. STP mainly consisting of
Primary Treatment, Secondary Treatment & Tertiary Treatment.
2. Purpose In line with sustainable infrastructure plan, 100% sewage is proposed to be treated to required standards
and recycled. Sewage treatment plants are proposed in modules as necessary as per the development of
the site. The recycled water can be reused for various purposes like Tolankere lake water top-up,
gardening etc. Excess of recycled water after utilising for various above mention purposed will be
discharge into Tolankere pond.
3. Sewage characteristics Understanding of the nature of physical, chemical and biological characteristics of sewage is essential in
planning, design and operation of treatment and disposal facilities and in the engineering management of
environmental quality. The raw sewage characteristics are referred from CPHEEO Manual, 2013. The
typical expected influent characteristics of raw domestic sewage are given in Table
Table 1: Raw Sewage Characteristics
Sr.
No.
Parameters Concentration
Values (Expected)
Concentration
Values
(CPHEEO
2013)
1 pH 6.5 - 8.5 -
2 BOD5 @ 20C, mg/L 250 – 300 250
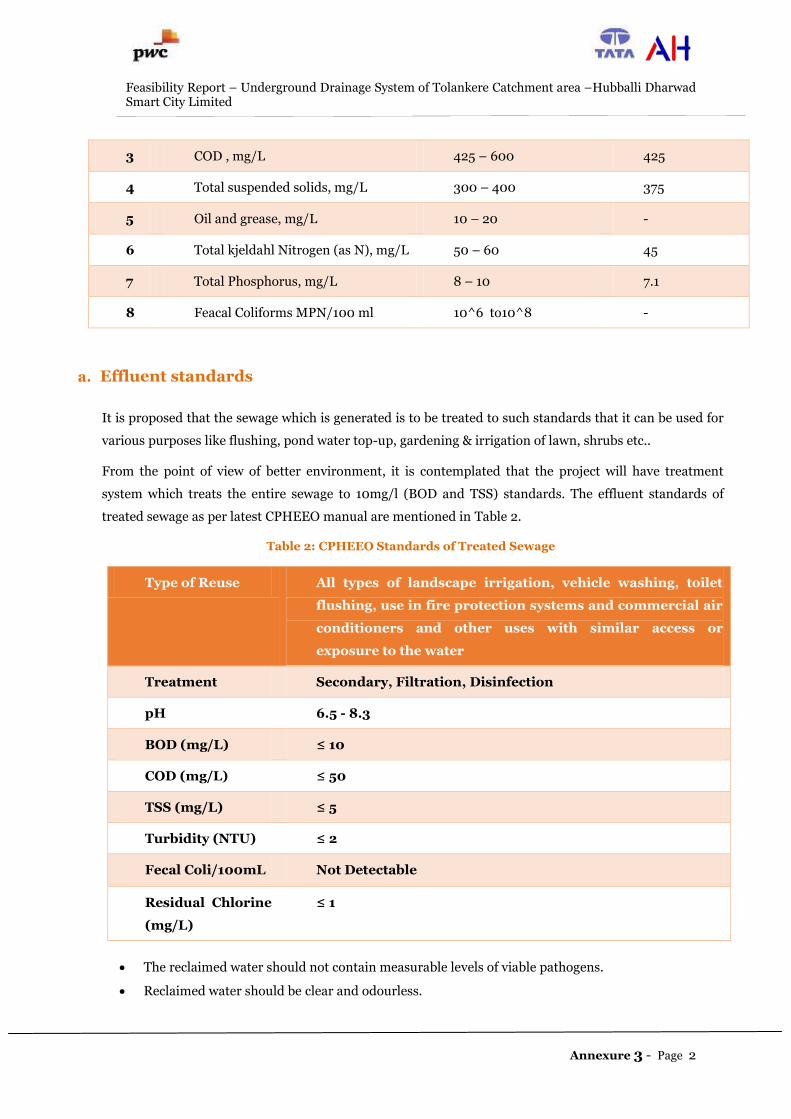
Feasibility Report – Underground Drainage System of Tolankere Catchment area –Hubballi Dharwad Smart City Limited
Annexure 3 - Page 2
3 COD , mg/L 425 – 600 425
4 Total suspended solids, mg/L 300 – 400 375
5 Oil and grease, mg/L 10 – 20 -
6 Total kjeldahl Nitrogen (as N), mg/L 50 – 60 45
7 Total Phosphorus, mg/L 8 – 10 7.1
8 Feacal Coliforms MPN/100 ml 10^6 to10^8 -
a. Effluent standards
It is proposed that the sewage which is generated is to be treated to such standards that it can be used for
various purposes like flushing, pond water top-up, gardening & irrigation of lawn, shrubs etc..
From the point of view of better environment, it is contemplated that the project will have treatment
system which treats the entire sewage to 10mg/l (BOD and TSS) standards. The effluent standards of
treated sewage as per latest CPHEEO manual are mentioned in Table 2.
Table 2: CPHEEO Standards of Treated Sewage
Type of Reuse All types of landscape irrigation, vehicle washing, toilet
flushing, use in fire protection systems and commercial air
conditioners and other uses with similar access or
exposure to the water
Treatment Secondary, Filtration, Disinfection
pH 6.5 - 8.3
BOD (mg/L) ≤ 10
COD (mg/L) ≤ 50
TSS (mg/L) ≤ 5
Turbidity (NTU) ≤ 2
Fecal Coli/100mL Not Detectable
Residual Chlorine
(mg/L)
≤ 1
The reclaimed water should not contain measurable levels of viable pathogens.
Reclaimed water should be clear and odourless.

Feasibility Report – Underground Drainage System of Tolankere Catchment area –Hubballi Dharwad Smart City Limited
Annexure 3 - Page 3
Higher chlorine residual and / or a longer contact time may be necessary to assure that
viruses and parasites are inactivated or destroyed.
Reference : CPHEEO guidelines for treated water reuse.
Reclaimed water from tertiary treatment of STP is proposed to be stored in treated water tank near STP.
This treated/ recycled water is proposed to be supplied for Tolankere lake top up, gardening & irrigation
of lawns around the Tolankere lake, shrubs etc. Hence, expected standard is given in Table 3.
Table 3: Treated Sewage Standards
Parameters After secondary
treatment (CPCB Dec
2016)
After tertiary
treatment
(CPHEEO 2013)
BOD5 (mg/L) <10 <10
COD (mg/L) <50 <50
TSS (mg/L) <10 ≤ 5
Total Nitrogen
(mg/L)
<10 <10
Total Phosphorous
(mg/L)
<2 <1
pH 6.5 – 8.5 6.5 – 8.5
Turbidity (NTU) - <2
Ammonical Nitrogen
(NH4-N)
<5 -
Residual chlorine - 0.3 – 0.5
Fecal Coliform,
(MPN/100ml)
< 230 Nil
4. Sewage treatment plant process
a. Technology consideration for treatment
The objective of wastewater treatment is to stabilize decomposable organic matter present in sewage
so as to produce an effluent and sludge, which can be disposed of in the environment without causing
pollution, health hazard and nuisance.
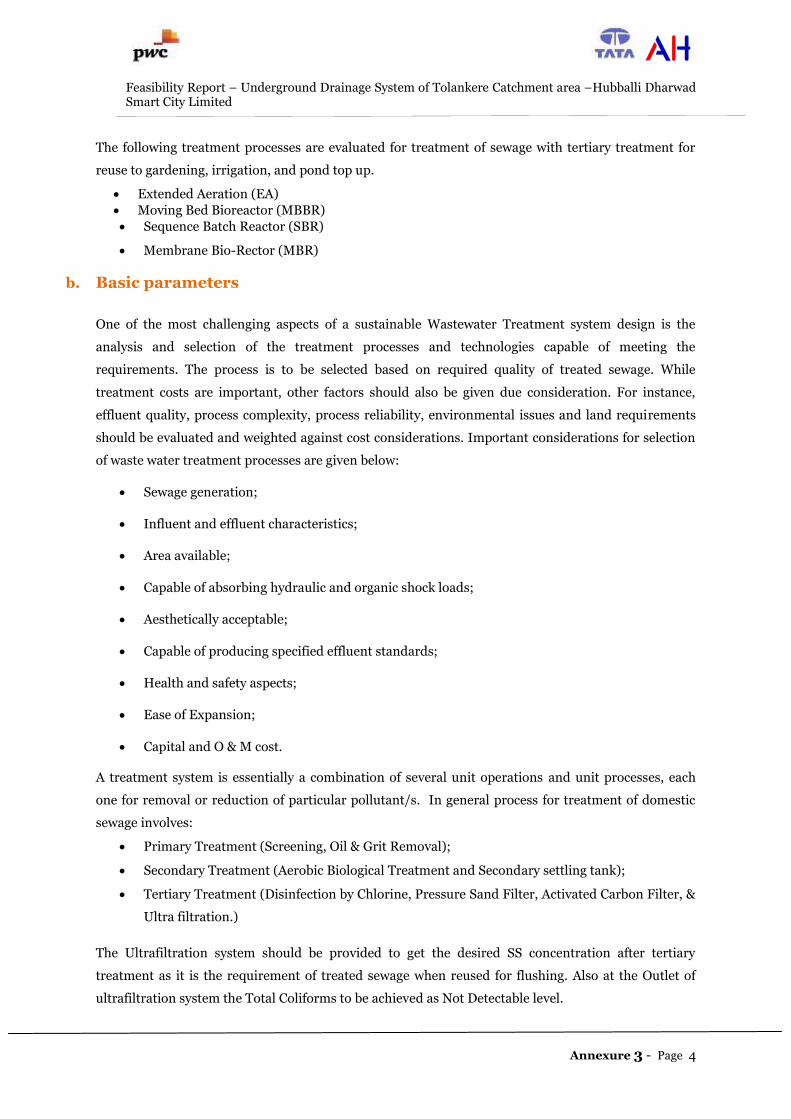
Feasibility Report – Underground Drainage System of Tolankere Catchment area –Hubballi Dharwad Smart City Limited
Annexure 3 - Page 4
The following treatment processes are evaluated for treatment of sewage with tertiary treatment for
reuse to gardening, irrigation, and pond top up.
Extended Aeration (EA)
Moving Bed Bioreactor (MBBR)
Sequence Batch Reactor (SBR)
Membrane Bio-Rector (MBR)
b. Basic parameters
One of the most challenging aspects of a sustainable Wastewater Treatment system design is the
analysis and selection of the treatment processes and technologies capable of meeting the
requirements. The process is to be selected based on required quality of treated sewage. While
treatment costs are important, other factors should also be given due consideration. For instance,
effluent quality, process complexity, process reliability, environmental issues and land requirements
should be evaluated and weighted against cost considerations. Important considerations for selection
of waste water treatment processes are given below:
Sewage generation;
Influent and effluent characteristics;
Area available;
Capable of absorbing hydraulic and organic shock loads;
Aesthetically acceptable;
Capable of producing specified effluent standards;
Health and safety aspects;
Ease of Expansion;
Capital and O & M cost.
A treatment system is essentially a combination of several unit operations and unit processes, each
one for removal or reduction of particular pollutant/s. In general process for treatment of domestic
sewage involves:
Primary Treatment (Screening, Oil & Grit Removal);
Secondary Treatment (Aerobic Biological Treatment and Secondary settling tank);
Tertiary Treatment (Disinfection by Chlorine, Pressure Sand Filter, Activated Carbon Filter, &
Ultra filtration.)
The Ultrafiltration system should be provided to get the desired SS concentration after tertiary
treatment as it is the requirement of treated sewage when reused for flushing. Also at the Outlet of
ultrafiltration system the Total Coliforms to be achieved as Not Detectable level.
Feasibility Report – Underground Drainage System of Tolankere Catchment area –Hubballi Dharwad Smart City Limited
Annexure 3 - Page 5
5. Sewage treatment plant
a. Introduction
The sewage treatment plant mainly consists of Primary Treatment, Secondary Treatment and Tertiary
Treatment. Treatment units such as receiving chamber, coarse screen, fine screen & equalization tank
will be designed for peak flows. These treatment processes will consist of following Units/Equipment.
Receiving Chamber
Coarse Screen Chamber.
Fine Screen Chamber.
Oil & Grease removal tank.
Equalization Tank along with pumps.
Secondary Biological Treatment
Settling Tank
Filter feed pump
Pressure Sand Filter and Activated carbon filter.
Filter Press Feed Pump and Filter Press for De-watering the sludge.
Chemical Dosing System.
Treated Sewage storage Tank along with pumps (tertiary treated water Pumping station).
a. TREATMENT PROCESSES INVOLVED IN STP:
PRIMARY TREATMENT PROCESS
Primary treatment process consisting of following Equipment’s / Units.
i. Coarse screening
The raw sewage being discharged to the proposed STP will first be received in the coarse screen
chamber. Sufficient numbers of screens with required configuration will be provided. Each screen
chamber will be designed for the peak flow. Opening size of coarse screen will 20 mm. The screens will
remove large floating objects present in the raw sewage, which will be trapped between the flats of the
bar screen. Screened sewage will then be discharged to fine screen chamber. The screening will reduce
the load on the successive units and at the same time, will avert clogging and wear-and-tear of moving
parts of pumps, resulting in improved performance of pumps.
ii. Fine screening
The sewage discharged from coarse screen chamber will then enter to the fine screen chamber.
Sufficient numbers of screens with required configuration will be provided. Each screen chamber will
be designed for the peak flow. Opening size of fine screen will 6 mm/10 mm as per configuration. The

Feasibility Report – Underground Drainage System of Tolankere Catchment area –Hubballi Dharwad Smart City Limited
Annexure 3 - Page 6
screen will remove small floating objects escaping the coarse screen provided prior to the equalization
tank, which will be trapped between the flats/perforations of the bar screen/punched hole screen. The
screened sewage will be taken into the next unit i.e. Equalization Tank. The screening will reduce the
load on the successive units and at the same time, will avert clogging and wear-and-tear of moving
parts of pumps, resulting in improved performance of pumps. Screenings removed from fine screens
will be collected in bags and will then be disposed off suitably to nearby solid waste treatment plant.
The sewage being discharged from the fine screen will then enter the Equalization Tank as mentioned
above.
iii. Equalization tank.
The equalization tank will perform dual function of homogenization of various sewage streams as well
as equalization of sewage. The various sewage streams will be discharged intermittently to the sewage
treatment plant; however, for better efficiency the sewage treatment plant working on biological
treatment principals will have to be operated continuously at uniform flow of the sewage at more or
less uniform concentration. The equalization tank will equalize incoming sewage both qualitatively as
well as quantitatively and will ensure uniform supply of equalized sewage to biological treatment
system at constant rate. The equalization tank will be designed for peak flow. The HRT of equalization
tank shall be 12 hrs at average flow. The equalization tank will be equipped with perforated pipe air
grid. The compressed air will be diffused into the contents of the equalization tank through
perforations provided on the laterals of pipe air grid. Diffused air will create agitation necessary for
homogenization of various sewage streams. Agitation created by diffused air will also keep suspended
solids in suspension. Oxygen introduced by diffused air into the contents of the equalization tank will
avoid septic conditions and will eliminate odour problem.
Sewage after screening will enter in equalization tank by gravity. Equalization tank consists of
sufficient number of submersible pumps with required configuration, which will pump equalized
effluent to the Oil & Grease Trap.
iv. Oil and grease trap
The oil & grease removal tank will be in the form of a long narrow channel where sufficiently long
detention period will be provided. Due to which free floating oil will start floating at the surface under
perfectly maintained quiescent conditions. The free floating oil & grease from the layer floating at the
surface will then be collected manually/mechanically in the waste oil & grease collection bin. In case
of long detention there may be chances of settling of organic solids to avoid loss of organic solids there
should be provision of organic return/vacuum pump in oil & grease trap. This pump will collect &
recirculate the organic solids and thereby avoiding loss of it. The oil & grease removal tank will be
provided with weir wall at the inlet and baffle wall at the outlet. Weir wall provided at the inlet will
ensure uniform distribution of influent whereas baffle wall provided at the outlet will not allow oil in
the floating layer to escape the oil removal tank. De-oiled & degreased sewage will be taken to the next
stage of STP. The primary treatment up to equalization tank should be common irrespective of
secondary biological treatment.
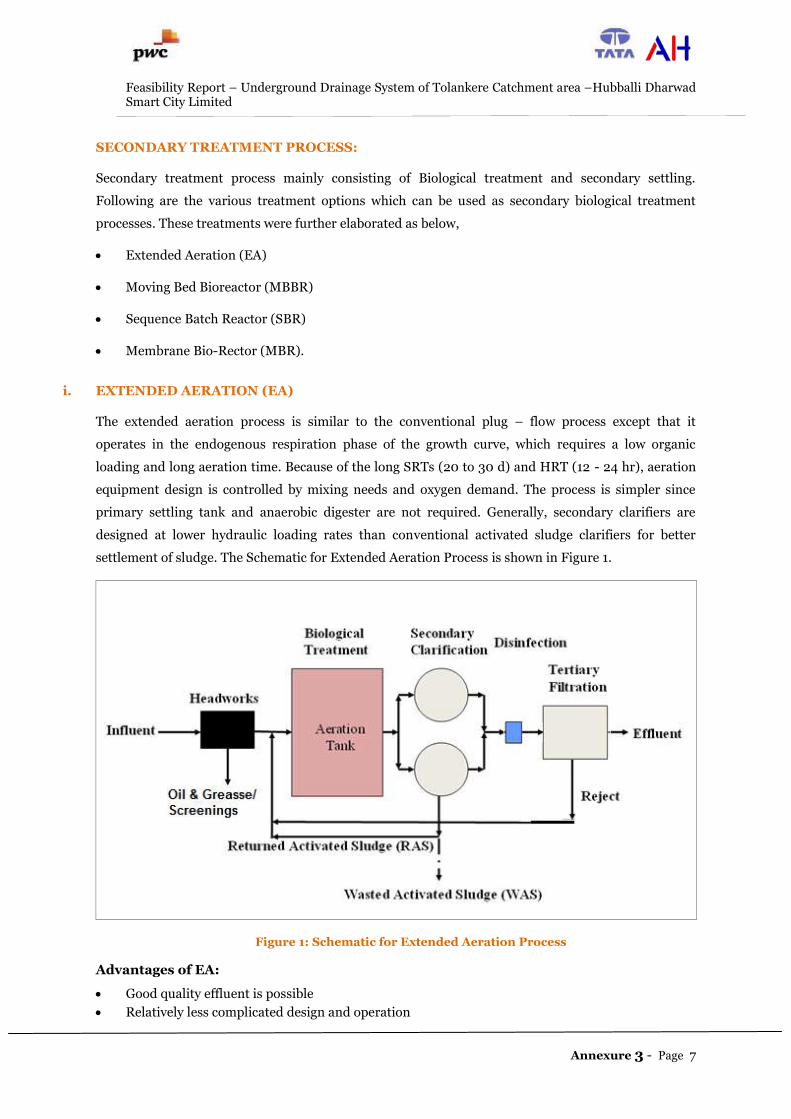
Feasibility Report – Underground Drainage System of Tolankere Catchment area –Hubballi Dharwad Smart City Limited
Annexure 3 - Page 7
SECONDARY TREATMENT PROCESS:
Secondary treatment process mainly consisting of Biological treatment and secondary settling.
Following are the various treatment options which can be used as secondary biological treatment
processes. These treatments were further elaborated as below,
Extended Aeration (EA)
Moving Bed Bioreactor (MBBR)
Sequence Batch Reactor (SBR)
Membrane Bio-Rector (MBR).
i. EXTENDED AERATION (EA)
The extended aeration process is similar to the conventional plug – flow process except that it
operates in the endogenous respiration phase of the growth curve, which requires a low organic
loading and long aeration time. Because of the long SRTs (20 to 30 d) and HRT (12 - 24 hr), aeration
equipment design is controlled by mixing needs and oxygen demand. The process is simpler since
primary settling tank and anaerobic digester are not required. Generally, secondary clarifiers are
designed at lower hydraulic loading rates than conventional activated sludge clarifiers for better
settlement of sludge. The Schematic for Extended Aeration Process is shown in Figure 1.
Figure 1: Schematic for Extended Aeration Process
Advantages of EA:
Good quality effluent is possible
Relatively less complicated design and operation
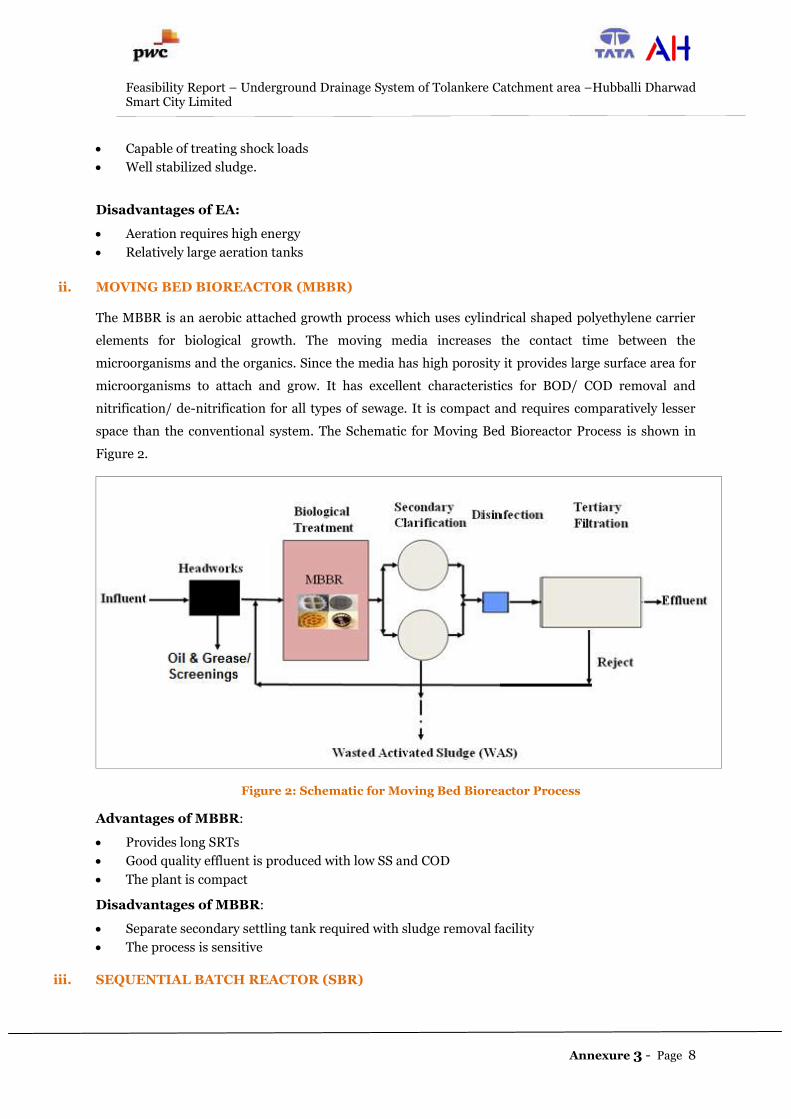
Feasibility Report – Underground Drainage System of Tolankere Catchment area –Hubballi Dharwad Smart City Limited
Annexure 3 - Page 8
Capable of treating shock loads
Well stabilized sludge.
Disadvantages of EA:
Aeration requires high energy
Relatively large aeration tanks
ii. MOVING BED BIOREACTOR (MBBR)
The MBBR is an aerobic attached growth process which uses cylindrical shaped polyethylene carrier
elements for biological growth. The moving media increases the contact time between the
microorganisms and the organics. Since the media has high porosity it provides large surface area for
microorganisms to attach and grow. It has excellent characteristics for BOD/ COD removal and
nitrification/ de-nitrification for all types of sewage. It is compact and requires comparatively lesser
space than the conventional system. The Schematic for Moving Bed Bioreactor Process is shown in
Figure 2.
Figure 2: Schematic for Moving Bed Bioreactor Process
Advantages of MBBR:
Provides long SRTs
Good quality effluent is produced with low SS and COD
The plant is compact
Disadvantages of MBBR:
Separate secondary settling tank required with sludge removal facility
The process is sensitive
iii. SEQUENTIAL BATCH REACTOR (SBR)
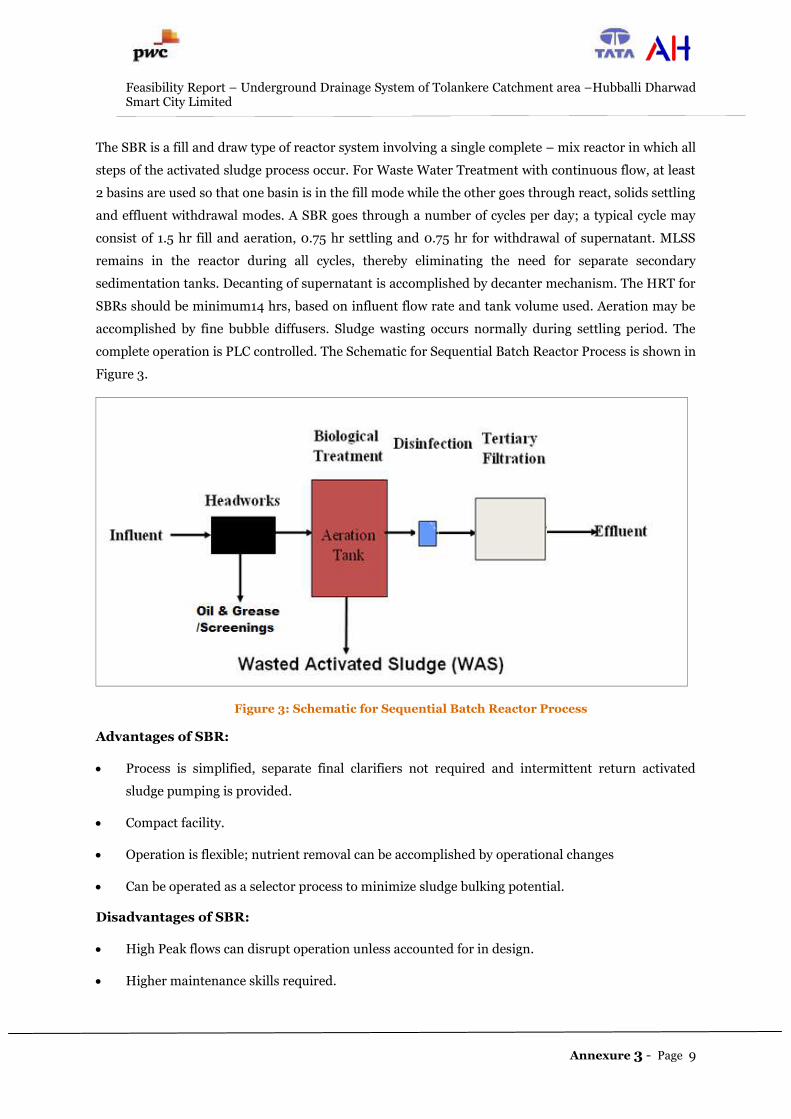
Feasibility Report – Underground Drainage System of Tolankere Catchment area –Hubballi Dharwad Smart City Limited
Annexure 3 - Page 9
The SBR is a fill and draw type of reactor system involving a single complete – mix reactor in which all
steps of the activated sludge process occur. For Waste Water Treatment with continuous flow, at least
2 basins are used so that one basin is in the fill mode while the other goes through react, solids settling
and effluent withdrawal modes. A SBR goes through a number of cycles per day; a typical cycle may
consist of 1.5 hr fill and aeration, 0.75 hr settling and 0.75 hr for withdrawal of supernatant. MLSS
remains in the reactor during all cycles, thereby eliminating the need for separate secondary
sedimentation tanks. Decanting of supernatant is accomplished by decanter mechanism. The HRT for
SBRs should be minimum14 hrs, based on influent flow rate and tank volume used. Aeration may be
accomplished by fine bubble diffusers. Sludge wasting occurs normally during settling period. The
complete operation is PLC controlled. The Schematic for Sequential Batch Reactor Process is shown in
Figure 3.
Figure 3: Schematic for Sequential Batch Reactor Process
Advantages of SBR:
Process is simplified, separate final clarifiers not required and intermittent return activated
sludge pumping is provided.
Compact facility.
Operation is flexible; nutrient removal can be accomplished by operational changes
Can be operated as a selector process to minimize sludge bulking potential.
Disadvantages of SBR:
High Peak flows can disrupt operation unless accounted for in design.
Higher maintenance skills required.

Feasibility Report – Underground Drainage System of Tolankere Catchment area –Hubballi Dharwad Smart City Limited
Annexure 3 - Page 10
iv. MEMBRANE BIO REACTOR (MBR)
MBR technology is the combination of a high rate, activated sludge biological process with Ultra
filtration (UF) membranes for solids separation. The MBR technology has 2 alternatives:
Submerged MBR in Aeration basin.
MBR in separate tanks.
MBR is a two-step process that includes:
The bioreactor is where aerobic bacteria acts on the organic matter with the presence of dissolved
oxygen. The membrane filtration module based on Ultrafiltration (UF), separates the biomass and
bacteria from water.
In MBR system through the use of a permeate pump, vacuum is applied to a header connected to the
membranes. The vacuum draws the treated water through the membranes. Airflow is introduced to
the bottom of the membrane module, producing turbulence that scours the external surface of the
membranes. The scouring action transfers the rejected solids away from the membrane surface.
Wasted Sludge shall be collected in sludge sump and shall be pumped to filter press for dewatering
and the dewatered sludge has solid concentration of 18 to 20 percent dry solids.
In addition to membrane modules equipment’s such as permeate pumps, Back pulse pumps, air
blowers, PLC system and Chemical cleaning system and storage etc., are usually provided. There is no
need of secondary clarifiers or polishing filters. The Schematic for Membrane Bio-Reactor Process is
shown in Figure 4.
Figure 4: Schematic for Membrane Bio-Reactor Process
Advantages of MBR:
Higher mixed liquor suspended solids concentrations in MBRs (8000 – 15,000 mg/L) as
compared to the conventional process which allows only 1500 – 3000 mg/L MLSS.
Feasibility Report – Underground Drainage System of Tolankere Catchment area –Hubballi Dharwad Smart City Limited
Annexure 3 - Page 11
Optimum control of the microbial population and flexibility in operation with excellent effluent
quality (COD removal: ≥ 95 %, BOD removal: ≥98 % and TSS removal: ≥ 99 %).
MBR operates at low F/M ratio and long SRT. This means less sludge production and better
sludge quality. Better sludge quality ultimately reduces sludge bulking.
Smaller foot print per unit of BOD loading or per unit feed flow rate. Ideal for expansion of
existing facilities without an increase in the footprint. The foot print of MBR based plant is 25 to
40% lesser than that of conventional treatment plants.
Capable of absorbing organic shock loads.
MBR serves as barrier to certain chlorine resistant pathogens such as Cryptosporidium and
Giardia.
Minimum odour.
Sludge yield is 20 – 40 % less as compared to conventional WWTP.
Disinfection requirements are reduced.
The effluent quality is suitable for recycle and reuse for flushing and gardening.
Process control is easier with automation.
Modular design for easy expansion.
Disadvantages of MBR:
High capital cost due to expensive membrane units.
O&M cost is high due to higher energy consumption, Chemical consumption and limited life of
membranes.
Extensive piping and valves are required.
Need to control membrane fouling.
Higher maintenance skill required for monitoring device and automation.
v. EVALUATION OF SECONDARY BIOLOGICAL TREATMENT PROCESSES
The evaluation of various treatment processes for Sewage Treatment is discussed in the following
sections. Various alternative processes are analyzed. The evaluation will be based on following
criteria’s:
Area requirement;
Power requirement;
6. O & M Cost. The comparison is based on Area requirement, Power requirement and O & M cost and it is up to
secondary treatment. The comparison of various treatment technologies options proposed for the STP
is as follows:
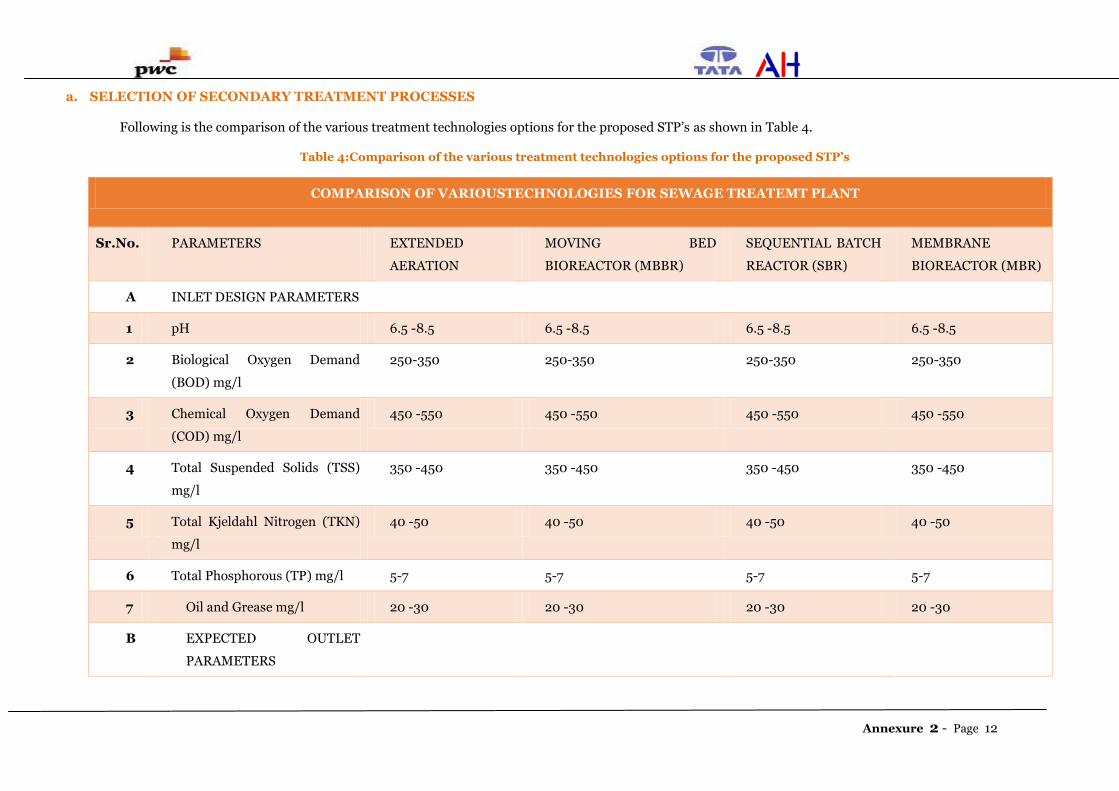
Annexure 2 - Page 12
a. SELECTION OF SECONDARY TREATMENT PROCESSES
Following is the comparison of the various treatment technologies options for the proposed STP’s as shown in Table 4.
Table 4:Comparison of the various treatment technologies options for the proposed STP’s
COMPARISON OF VARIOUSTECHNOLOGIES FOR SEWAGE TREATEMT PLANT
Sr.No. PARAMETERS EXTENDED
AERATION
MOVING BED
BIOREACTOR (MBBR)
SEQUENTIAL BATCH
REACTOR (SBR)
MEMBRANE
BIOREACTOR (MBR)
A INLET DESIGN PARAMETERS
1 pH 6.5 -8.5 6.5 -8.5 6.5 -8.5 6.5 -8.5
2 Biological Oxygen Demand
(BOD) mg/l
250-350 250-350 250-350 250-350
3 Chemical Oxygen Demand
(COD) mg/l
450 -550 450 -550 450 -550 450 -550
4 Total Suspended Solids (TSS)
mg/l
350 -450 350 -450 350 -450 350 -450
5 Total Kjeldahl Nitrogen (TKN)
mg/l
40 -50 40 -50 40 -50 40 -50
6 Total Phosphorous (TP) mg/l 5-7 5-7 5-7 5-7
7 Oil and Grease mg/l 20 -30 20 -30 20 -30 20 -30
B EXPECTED OUTLET
PARAMETERS
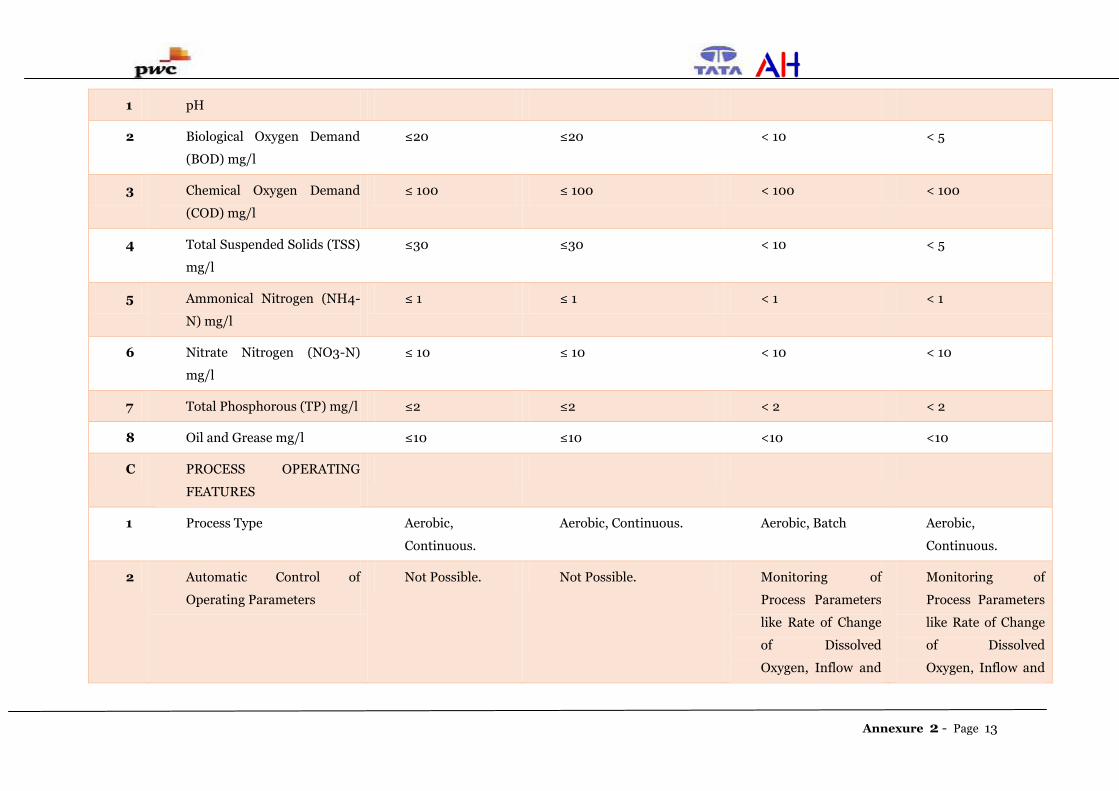
Annexure 2 - Page 13
1 pH
2 Biological Oxygen Demand
(BOD) mg/l
≤20 ≤20 < 10 < 5
3 Chemical Oxygen Demand
(COD) mg/l
≤ 100 ≤ 100 < 100 < 100
4 Total Suspended Solids (TSS)
mg/l
≤30 ≤30 < 10 < 5
5 Ammonical Nitrogen (NH4-
N) mg/l
≤ 1 ≤ 1 < 1 < 1
6 Nitrate Nitrogen (NO3-N)
mg/l
≤ 10 ≤ 10 < 10 < 10
7 Total Phosphorous (TP) mg/l ≤2 ≤2 < 2 < 2
8 Oil and Grease mg/l ≤10 ≤10 <10 <10
C PROCESS OPERATING
FEATURES
1 Process Type Aerobic,
Continuous.
Aerobic, Continuous. Aerobic, Batch Aerobic,
Continuous.
2 Automatic Control of
Operating Parameters
Not Possible. Not Possible. Monitoring of
Process Parameters
like Rate of Change
of Dissolved
Oxygen, Inflow and
Monitoring of
Process Parameters
like Rate of Change
of Dissolved
Oxygen, Inflow and

Annexure 2 - Page 14
Outflow is
automatically done
by PLC
Outflow is
automatically done
by PLC
3 Treatment Efficiency 85 - 90%.
Requires Tertiary
Treatment to
achieve < 10 mg/l
BOD.
95%. Requires Tertiary
Treatment to achieve < 10
mg/l BOD.
98% of BOD
removal can be
achieved in single
stage.
98% of BOD
removal can be
achieved in single
stage.
4 Outlet Quality Meets Pollution
Control Board
(PCB) Norms.
Requires tertiary
treatment for
Reuse.
Meets Pollution Control
Board (PCB) Norms.
Requires tertiary
treatment for Reuse.
Quality good for
Reuse.
Quality good for
Reuse.
5 Replacement of System
components
No intermittent
replacement of
components is
required. M&E
equipment’s need
to be replaced
every 15-20 years.
MBBR media replacement
may be required
intermittent every 4 to 5
years. M&E equipment’s
need to be replaced every
15-20 years.
No intermittent
replacement of
components is
required. M&E
equipment’s need to
be replaced every
15-20 years.
Membranes need to
be replaced every @
5 years. M&E
equipment’s need to
be replaced every
15-20 years.
6 Level of Automation No Automation.
Fully Manual
Operation in
No Automation. Fully
Manual Operation in
almost all existing Plants.
Automatic
operation of SBR,
controlled by PLC
Automatic
operation of MBR,
controlled by PLC
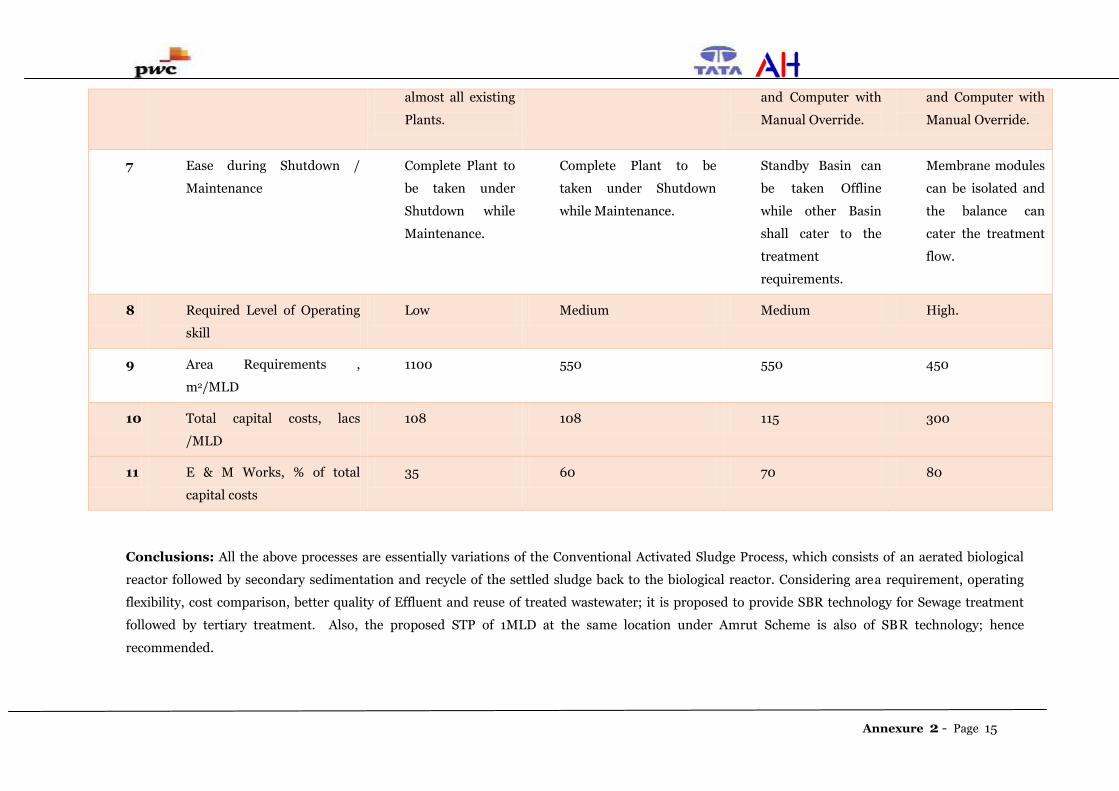
Annexure 2 - Page 15
almost all existing
Plants.
and Computer with
Manual Override.
and Computer with
Manual Override.
7 Ease during Shutdown /
Maintenance
Complete Plant to
be taken under
Shutdown while
Maintenance.
Complete Plant to be
taken under Shutdown
while Maintenance.
Standby Basin can
be taken Offline
while other Basin
shall cater to the
treatment
requirements.
Membrane modules
can be isolated and
the balance can
cater the treatment
flow.
8 Required Level of Operating
skill
Low Medium Medium High.
9 Area Requirements ,
m2/MLD
1100 550 550 450
10 Total capital costs, lacs
/MLD
108 108 115 300
11 E & M Works, % of total
capital costs
35 60 70 80
Conclusions: All the above processes are essentially variations of the Conventional Activated Sludge Process, which consists of an aerated biological
reactor followed by secondary sedimentation and recycle of the settled sludge back to the biological reactor. Considering area requirement, operating
flexibility, cost comparison, better quality of Effluent and reuse of treated wastewater; it is proposed to provide SBR technology for Sewage treatment
followed by tertiary treatment. Also, the proposed STP of 1MLD at the same location under Amrut Scheme is also of SBR technology; hence
recommended.