fellow elevation in ieee and comsoc with focus on...
TRANSCRIPT
1
Fellow Elevation in IEEE and ComSocwith Focus on Women
Stefano Galli – [email protected] IEEE Fellow Committee Chair16 April 2019 – WICE panel @ WCNC
2
1999 2001 2003 2005 2007 2009 2011 2013 2015 2017 2019
Fellow Class
200
300
400
500
600
700
800
900
1000
Num
ber o
f Nom
inat
ions
/Ele
vatio
ns
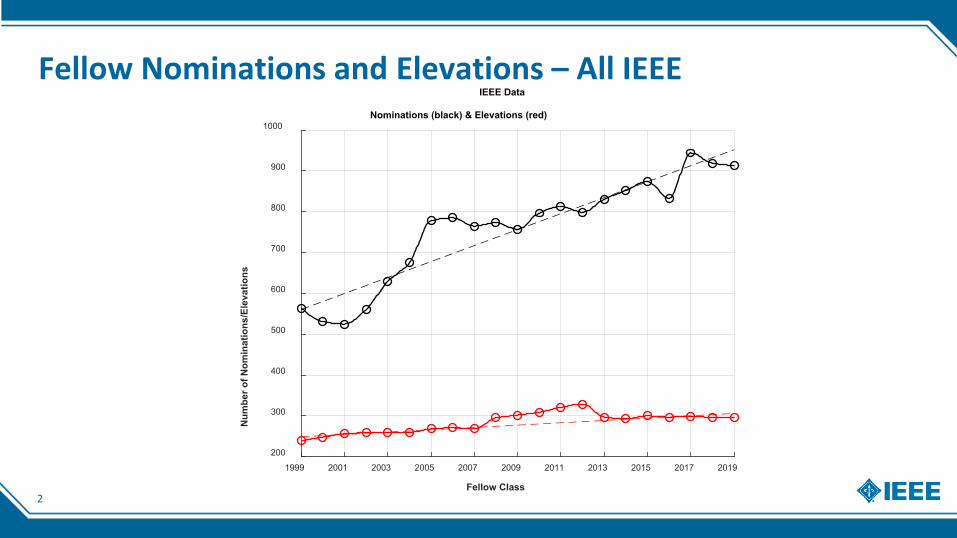
IEEE Data
Nominations (black) & Elevations (red)
Fellow Nominations and Elevations – All IEEE
3
Fellow Elevation Probability – IEEE (blk) and ComSoc (red)
1999 2001 2003 2005 2007 2009 2011 2013 2015 2017 2019
Fellow Class
20%
25%
30%
35%
40%
45%
50%
Elev
atio
n Pr
obab
ility
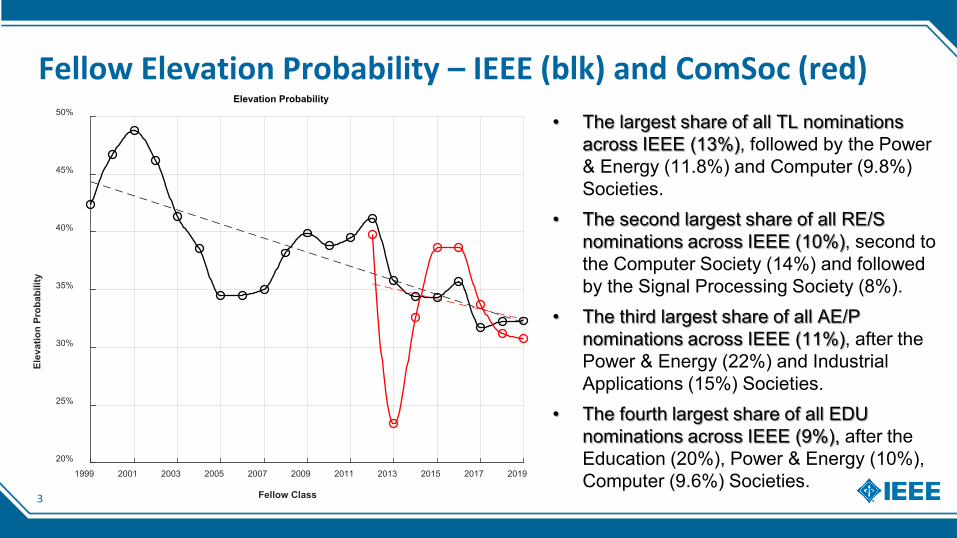
Elevation Probability
• The largest share of all TL nominations across IEEE (13%), followed by the Power & Energy (11.8%) and Computer (9.8%) Societies.
• The second largest share of all RE/S nominations across IEEE (10%), second to the Computer Society (14%) and followed by the Signal Processing Society (8%).
• The third largest share of all AE/P nominations across IEEE (11%), after the Power & Energy (22%) and Industrial Applications (15%) Societies.
• The fourth largest share of all EDU nominations across IEEE (9%), after the Education (20%), Power & Energy (10%), Computer (9.6%) Societies.
4
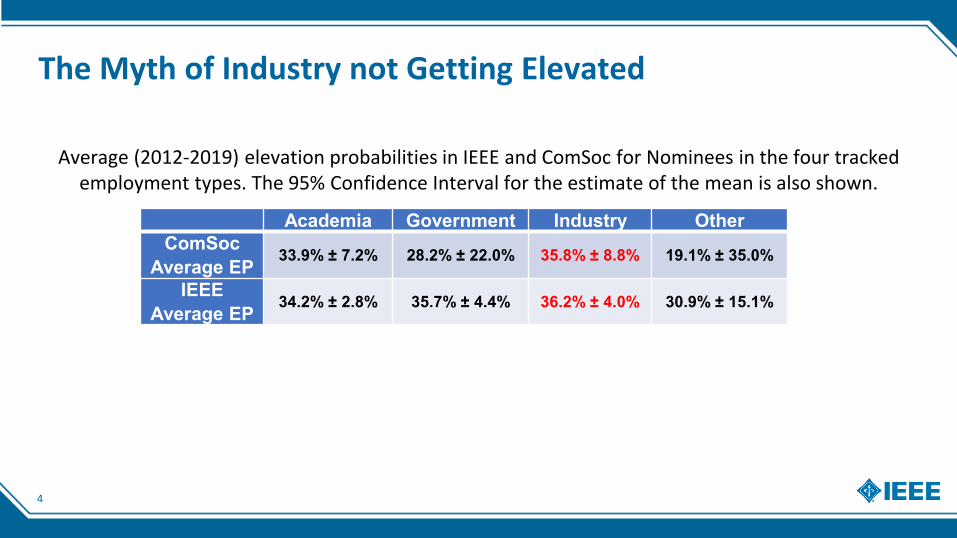
The Myth of Industry not Getting Elevated
Academia Government Industry OtherComSoc
Average EP 33.9% ± 7.2% 28.2% ± 22.0% 35.8% ± 8.8% 19.1% ± 35.0%
IEEEAverage EP 34.2% ± 2.8% 35.7% ± 4.4% 36.2% ± 4.0% 30.9% ± 15.1%
Average (2012-2019) elevation probabilities in IEEE and ComSoc for Nominees in the four tracked employment types. The 95% Confidence Interval for the estimate of the mean is also shown.
5
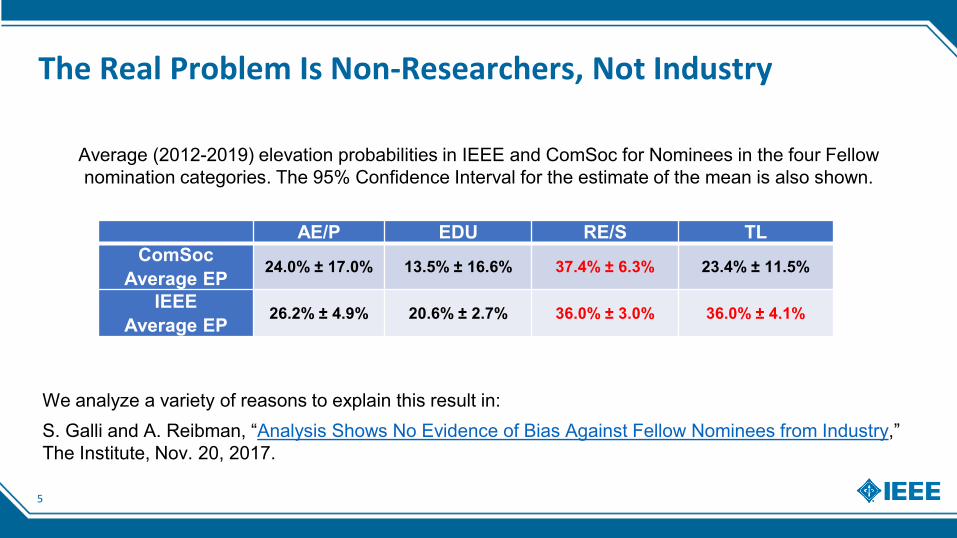
The Real Problem Is Non-Researchers, Not Industry
AE/P EDU RE/S TLComSoc
Average EP 24.0% ± 17.0% 13.5% ± 16.6% 37.4% ± 6.3% 23.4% ± 11.5%
IEEEAverage EP 26.2% ± 4.9% 20.6% ± 2.7% 36.0% ± 3.0% 36.0% ± 4.1%
Average (2012-2019) elevation probabilities in IEEE and ComSoc for Nominees in the four Fellow nomination categories. The 95% Confidence Interval for the estimate of the mean is also shown.
We analyze a variety of reasons to explain this result in: S. Galli and A. Reibman, “Analysis Shows No Evidence of Bias Against Fellow Nominees from Industry,” The Institute, Nov. 20, 2017.
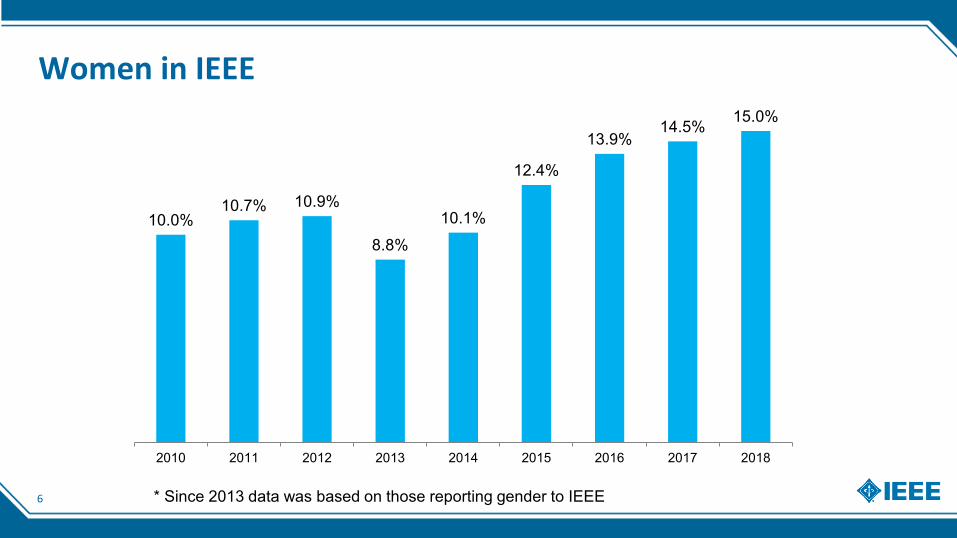
6 * Since 2013 data was based on those reporting gender to IEEE
*10.0%
10.7% 10.9%
8.8%10.1%
12.4%
13.9%14.5% 15.0%
2010 2011 2012 2013 2014 2015 2016 2017 2018
Women in IEEE
7
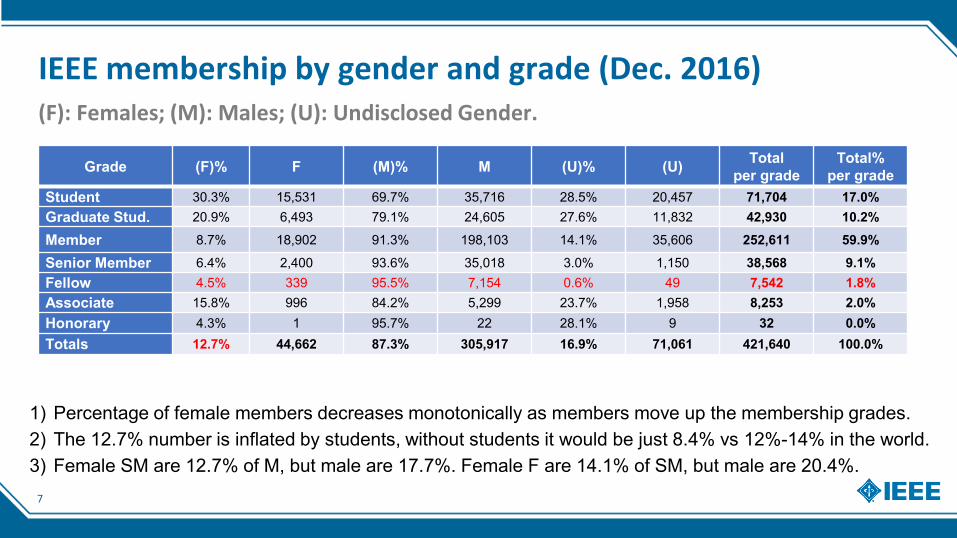
IEEE membership by gender and grade (Dec. 2016)(F): Females; (M): Males; (U): Undisclosed Gender.
Grade (F)% F (M)% M (U)% (U) Totalper grade
Total%per grade
Student 30.3% 15,531 69.7% 35,716 28.5% 20,457 71,704 17.0%Graduate Stud. 20.9% 6,493 79.1% 24,605 27.6% 11,832 42,930 10.2%Member 8.7% 18,902 91.3% 198,103 14.1% 35,606 252,611 59.9%Senior Member 6.4% 2,400 93.6% 35,018 3.0% 1,150 38,568 9.1%Fellow 4.5% 339 95.5% 7,154 0.6% 49 7,542 1.8%Associate 15.8% 996 84.2% 5,299 23.7% 1,958 8,253 2.0%Honorary 4.3% 1 95.7% 22 28.1% 9 32 0.0%Totals 12.7% 44,662 87.3% 305,917 16.9% 71,061 421,640 100.0%
1) Percentage of female members decreases monotonically as members move up the membership grades.2) The 12.7% number is inflated by students, without students it would be just 8.4% vs 12%-14% in the world.3) Female SM are 12.7% of M, but male are 17.7%. Female F are 14.1% of SM, but male are 20.4%.
8
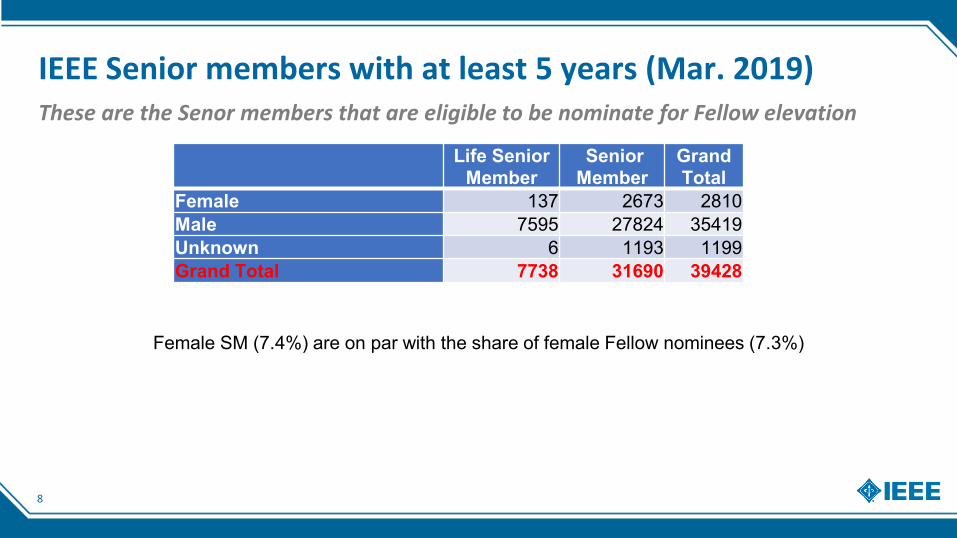
IEEE Senior members with at least 5 years (Mar. 2019)These are the Senor members that are eligible to be nominate for Fellow elevation
Female SM (7.4%) are on par with the share of female Fellow nominees (7.3%)
Life Senior Member
Senior Member
Grand Total
Female 137 2673 2810Male 7595 27824 35419Unknown 6 1193 1199Grand Total 7738 31690 39428
9
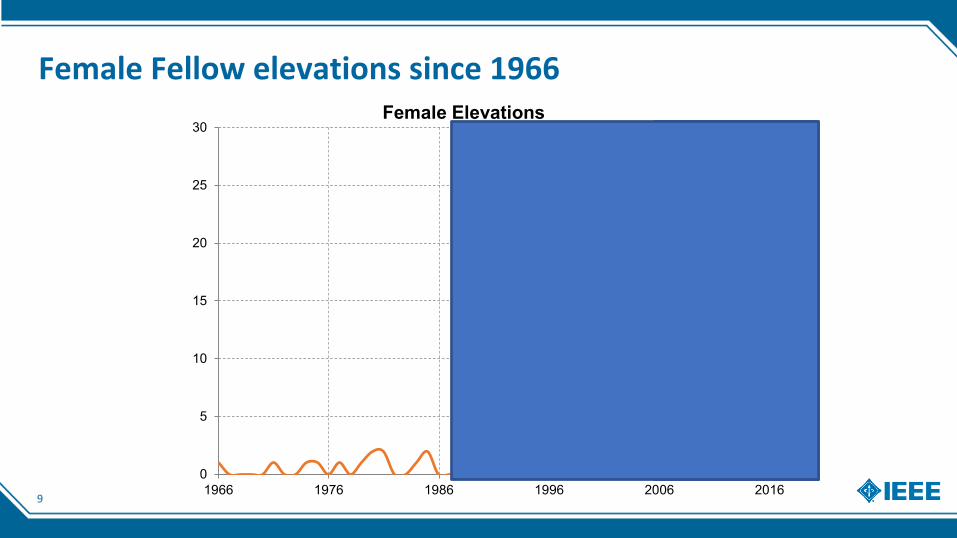
Female Fellow elevations since 1966
0
5
10
15
20
25
30
1966 1976 1986 1996 2006 2016
Female Elevations
10
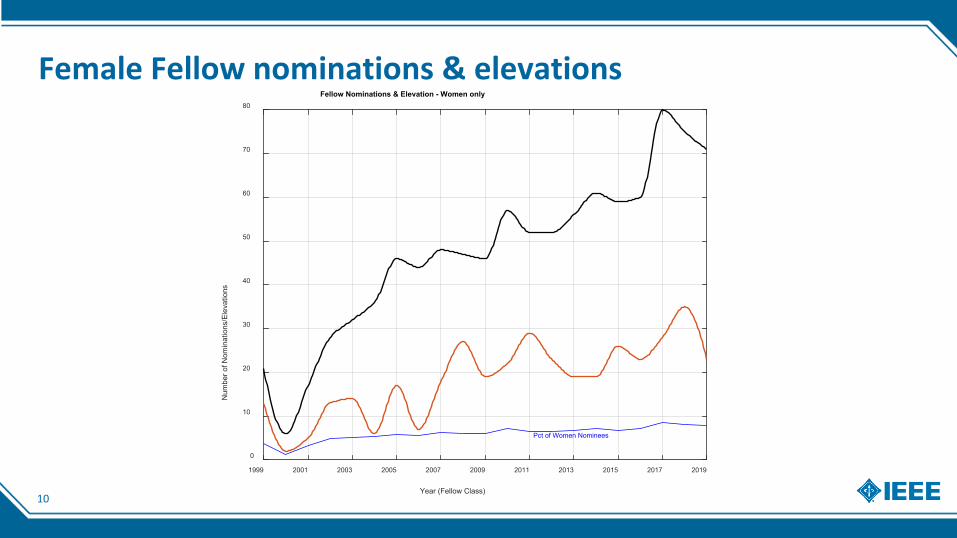
Female Fellow nominations & elevations
1999 2001 2003 2005 2007 2009 2011 2013 2015 2017 2019
Year (Fellow Class)
0
10
20
30
40
50
60
70
80
Num
ber o
f Nom
inat
ions
/Ele
vatio
ns
Fellow Nominations & Elevation - Women only
Pct of Women Nominees
11
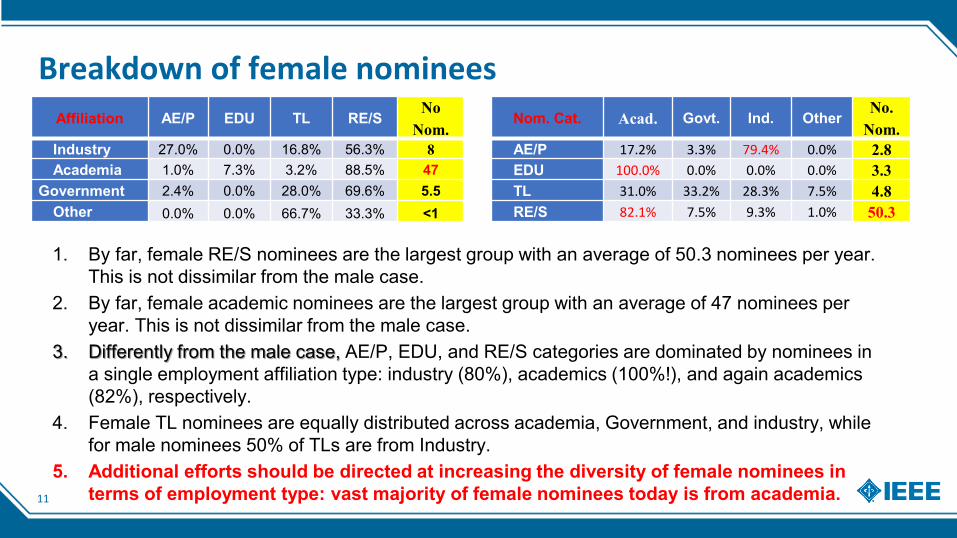
Breakdown of female nomineesAffiliation AE/P EDU TL RE/S No
Nom.Industry 27.0% 0.0% 16.8% 56.3% 8Academia 1.0% 7.3% 3.2% 88.5% 47
Government 2.4% 0.0% 28.0% 69.6% 5.5Other 0.0% 0.0% 66.7% 33.3% <1
Nom. Cat. Acad. Govt. Ind. Other No.Nom.
AE/P 17.2% 3.3% 79.4% 0.0% 2.8EDU 100.0% 0.0% 0.0% 0.0% 3.3TL 31.0% 33.2% 28.3% 7.5% 4.8RE/S 82.1% 7.5% 9.3% 1.0% 50.3
1. By far, female RE/S nominees are the largest group with an average of 50.3 nominees per year. This is not dissimilar from the male case.
2. By far, female academic nominees are the largest group with an average of 47 nominees per year. This is not dissimilar from the male case.
3. Differently from the male case, AE/P, EDU, and RE/S categories are dominated by nominees in a single employment affiliation type: industry (80%), academics (100%!), and again academics (82%), respectively.
4. Female TL nominees are equally distributed across academia, Government, and industry, while for male nominees 50% of TLs are from Industry.
5. Additional efforts should be directed at increasing the diversity of female nominees in terms of employment type: vast majority of female nominees today is from academia.
12
An interesting findingOn the statistical independence of elevation and gender
▶ Data suggests that the “gender” and “elevation” events can be considered independent events over the last 20 years (Fellow Class 2000-2019).▪ The direct (Pr{Pass|Gender}) conditional elevation probability of male (38.2%) and female (39.4%)
nominees is very close to the unconditional probability of elevation (38.3%). ▪ The reverse Pr{Gender|Pass} conditional elevation probabilities (93.6% for males and 6.4% for females) are
very close to the a priori unconditional distribution of male (94%) and female nominees (6%).
▶ For the 5-year average 2015-2019, the independence noted above for the 20-year average does not hold anymore. The conditional elevation for females has kept steady to 39% while the unconditional one has decreased to 33.5% like the male conditional one which is 33%.
▶ The elevation for female nominees exhibits high variability over the past 20 years. However, in the past 10 years, the outcomes have been more consistently advantageous for a female when compared to a male nominee.
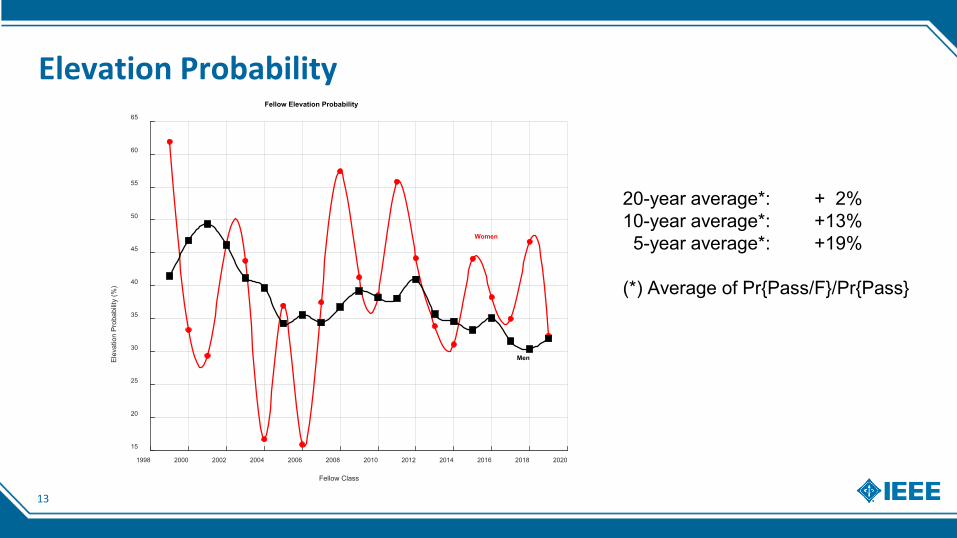
13
Elevation Probability
20-year average*: + 2%10-year average*: +13%5-year average*: +19%
(*) Average of Pr{Pass/F}/Pr{Pass}
1998 2000 2002 2004 2006 2008 2010 2012 2014 2016 2018 2020
Fellow Class
15
20
25
30
35
40
45
50
55
60
65El
evat
ion
Prob
abilit
y (%
)Fellow Elevation Probability
Men
Women
14
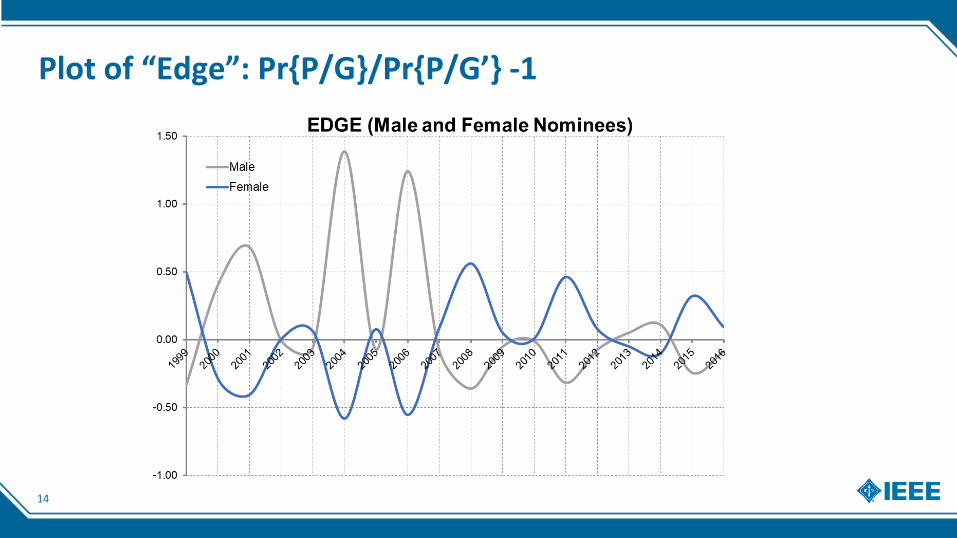
Plot of “Edge”: Pr{P/G}/Pr{P/G’} -1
15
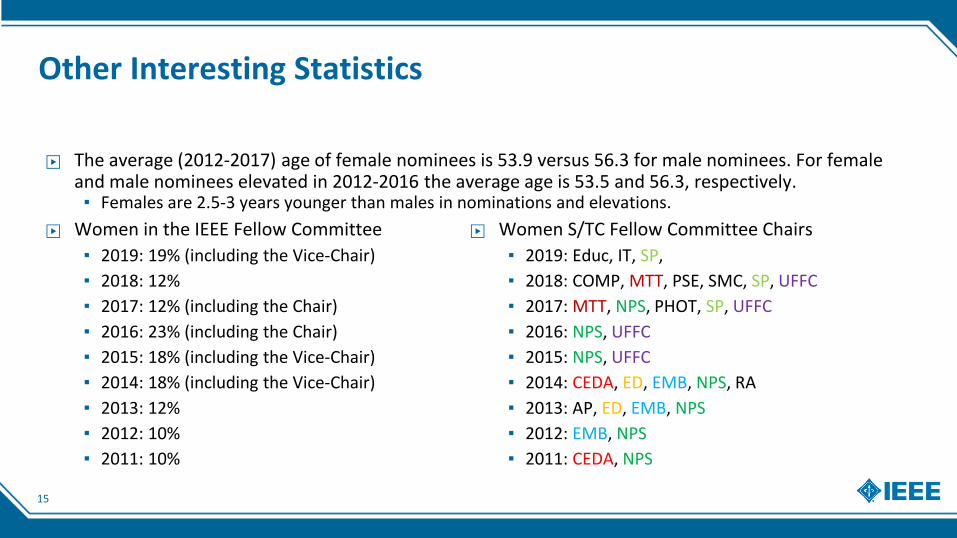
Other Interesting Statistics
▶ The average (2012-2017) age of female nominees is 53.9 versus 56.3 for male nominees. For female and male nominees elevated in 2012-2016 the average age is 53.5 and 56.3, respectively.▪ Females are 2.5-3 years younger than males in nominations and elevations.
▶ Women in the IEEE Fellow Committee▪ 2019: 19% (including the Vice-Chair)▪ 2018: 12%▪ 2017: 12% (including the Chair)▪ 2016: 23% (including the Chair)▪ 2015: 18% (including the Vice-Chair)▪ 2014: 18% (including the Vice-Chair)▪ 2013: 12%▪ 2012: 10%▪ 2011: 10%
▶ Women S/TC Fellow Committee Chairs▪ 2019: Educ, IT, SP, ▪ 2018: COMP, MTT, PSE, SMC, SP, UFFC▪ 2017: MTT, NPS, PHOT, SP, UFFC▪ 2016: NPS, UFFC▪ 2015: NPS, UFFC▪ 2014: CEDA, ED, EMB, NPS, RA▪ 2013: AP, ED, EMB, NPS▪ 2012: EMB, NPS▪ 2011: CEDA, NPS
16
Thank You!
17
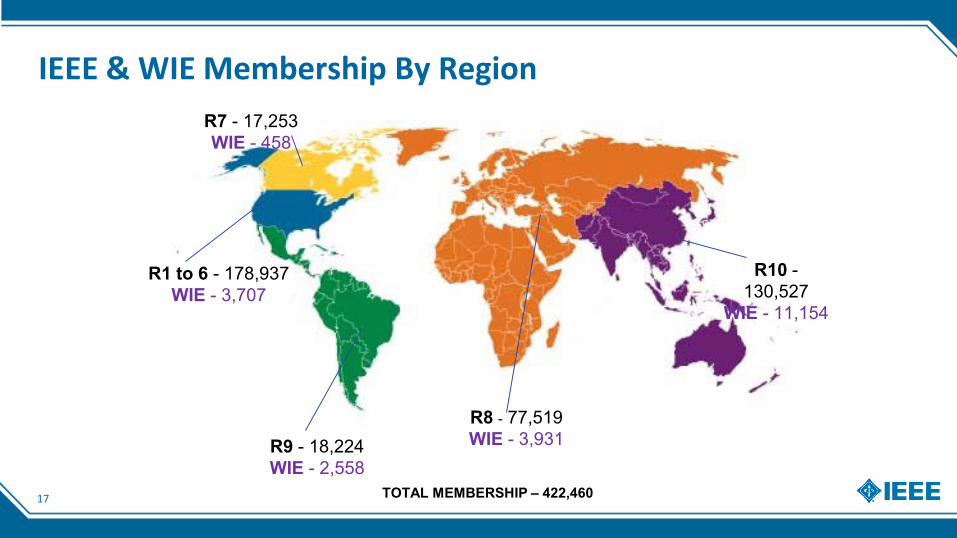
R9 - 18,224WIE - 2,558
R8 - 77,519WIE - 3,931
R10 -130,527
WIE - 11,154
R1 to 6 - 178,937WIE - 3,707
R7 - 17,253WIE - 458
IEEE & WIE Membership By Region
TOTAL MEMBERSHIP – 422,460
18
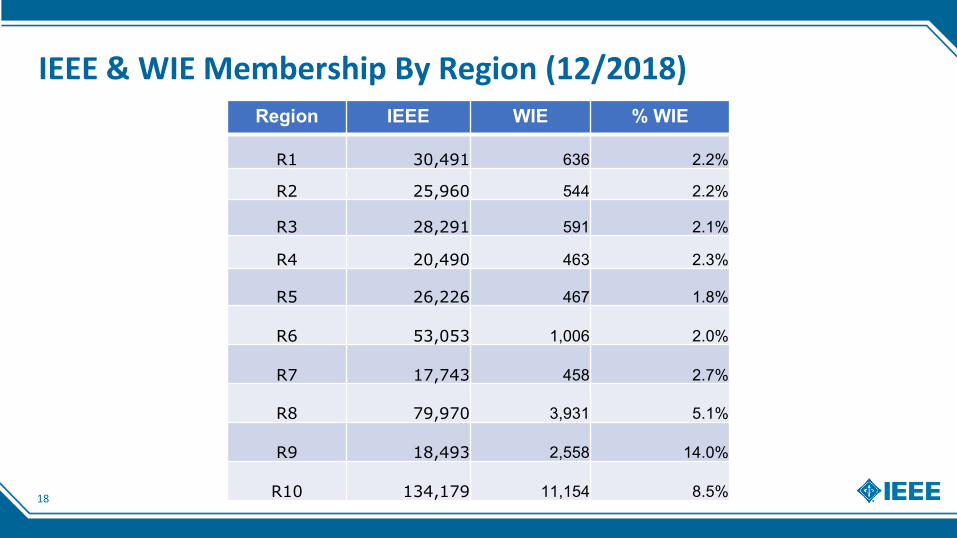
IEEE & WIE Membership By Region (12/2018)Region IEEE WIE % WIE
R1 30,491 636 2.2%
R2 25,960 544 2.2%
R3 28,291 591 2.1%
R4 20,490 463 2.3%
R5 26,226 467 1.8%
R6 53,053 1,006 2.0%
R7 17,743 458 2.7%
R8 79,970 3,931 5.1%
R9 18,493 2,558 14.0%
R10 134,179 11,154 8.5%
19
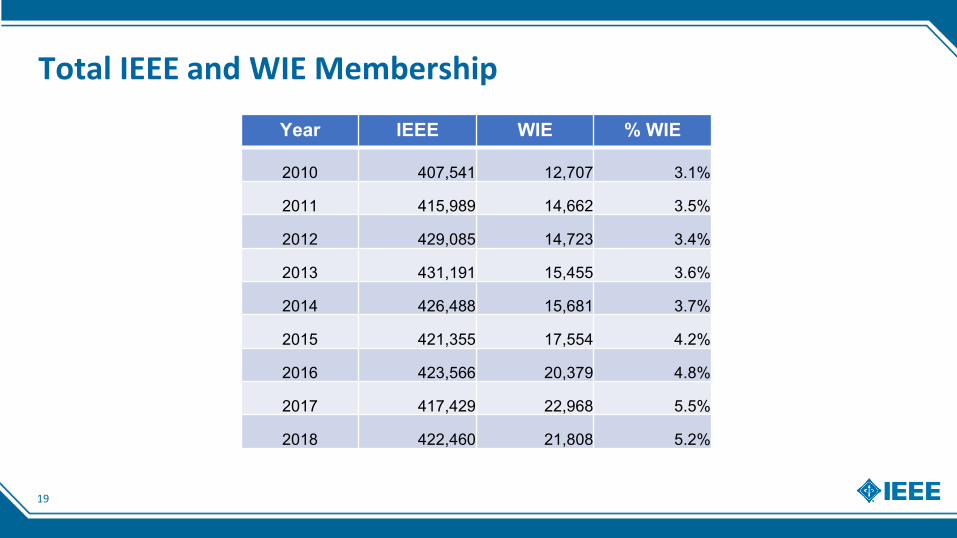
Total IEEE and WIE Membership
Year IEEE WIE % WIE
2010 407,541 12,707 3.1%
2011 415,989 14,662 3.5%
2012 429,085 14,723 3.4%
2013 431,191 15,455 3.6%
2014 426,488 15,681 3.7%
2015 421,355 17,554 4.2%
2016 423,566 20,379 4.8%
2017 417,429 22,968 5.5%
2018 422,460 21,808 5.2%
20
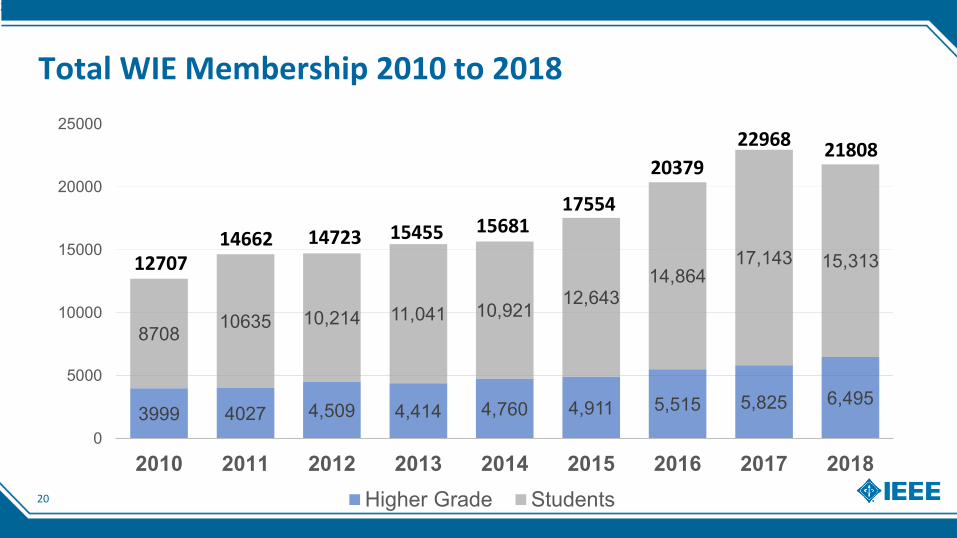
Total WIE Membership 2010 to 2018
20
Data: as of 12-31- 2018
3999 4027 4,509 4,414 4,760 4,911 5,515 5,825 6,495
8708 10635 10,214 11,041 10,921 12,64314,864
17,143 15,313
0
5000
10000
15000
20000
25000
2010 2011 2012 2013 2014 2015 2016 2017 2018Higher Grade Students
14723 15455 1568117554
2037922968 21808
1466212707
21
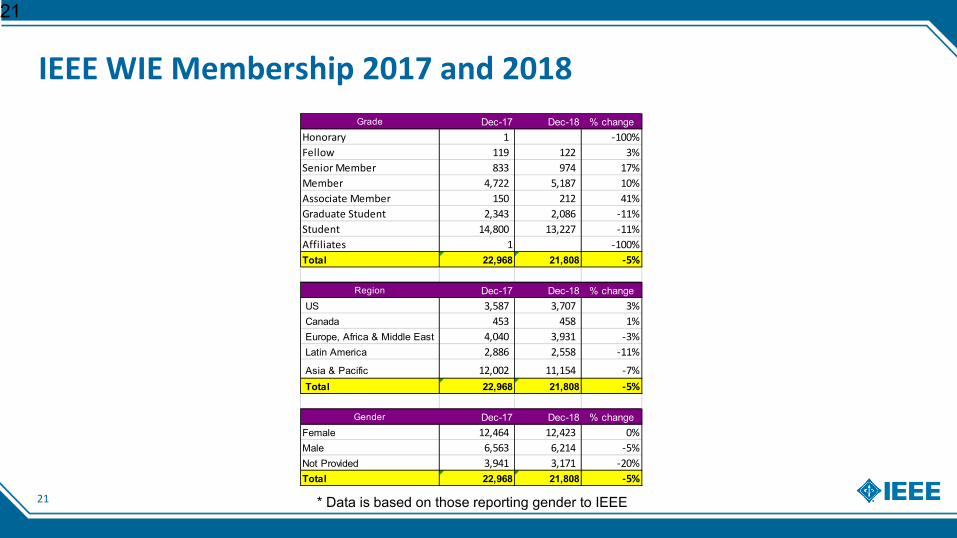
IEEE WIE Membership 2017 and 2018
21
* Data is based on those reporting gender to IEEE
Grade Dec-17 Dec-18 % changeHonorary 1 -100%Fellow 119 122 3%Senior Member 833 974 17%Member 4,722 5,187 10%Associate Member 150 212 41%Graduate Student 2,343 2,086 -11%Student 14,800 13,227 -11%Affiliates 1 -100%Total 22,968 21,808 -5%
Region Dec-17 Dec-18 % changeUS 3,587 3,707 3%Canada 453 458 1%Europe, Africa & Middle East 4,040 3,931 -3%Latin America 2,886 2,558 -11%
Asia & Pacific 12,002 11,154 -7%Total 22,968 21,808 -5%
Gender Dec-17 Dec-18 % changeFemale 12,464 12,423 0%Male 6,563 6,214 -5%Not Provided 3,941 3,171 -20%Total 22,968 21,808 -5%