financial report 2013–14 - virginia apaour new internal financial model, our organizational...
TRANSCRIPT

Financial Report 2013–14


1 | FINANCIAL REPORT 2013–14
Contents3 From the President
4 From the Excecutive Vice President and Chief Operating Officer
7 Management’s Discusssion and Analysis (Unaudited)
15 Management Responsibility Letter
16 Independent Auditor’s Report
18 Statement of Net Position
19 Component Units, Combined Statements of Financial Position
20 Statement of Revenues, Expenses, and Changes in Net Position
21 Component Units, Combined Statements of Activities
22 Statement of Cash Flows
23 Notes to Financial Statements and Required Supplementary Information
24 Note 1: Organization and Summary of Significant Accounting Policies
28 Note 2: Cash, Cash Equivalents, and Investments
31 Note 3: Statement of Net Position Details
34 Note 4: Short-Term Debt
35 Note 5: Long-Term Obligations
36 Note 6: Derivatives
38 Note 7: Affiliated Companies
40 Note 8: Component Units
45 Note 9: Expense Classification Matrix
45 Note 10: Appropriations
46 Note 11: Retirement Plans
46 Note 12: Postemployment Benefits Other Than Pension Benefits
48 Note 13: Self-Insurance
48 Note 14: Funds Held in Trust by Others
48 Note 15: Commitments and Contingencies
48 Note 16: Subsequent Events
49 Required Supplementary Information (Unaudited)

2 | FINANCIAL REPORT 2013–14

From the President In these challenging times for American higher education, financial stability and effective management of our colleges and universities have become more important than ever. In the pages of this report, you will see evidence that the University of Virginia has set a high standard as one of the most financially stable and most effectively managed universities in the nation.
With our new strategic plan, the Corner-stone Plan, we have created a road-map to lead us into the University’s third century. Bringing the plan to fruition will require both commitment and creativity. Through our new internal financial model, our organizational excellence program, our initiative to attract first-rate corporate partners, and other commitments, we are creating a solid financial foundation for the pursuit of our strategic priorities.
This financial report is a testament to Pat Hogan’s continued strong leadership as executive vice president and chief operating
officer. Pat and his staff bring vision, energy, and a spirit of continuous improvement to their daily work. The results, spelled out in the pages of this report, demonstrate their record of success.
As the University’s president, I am grateful to Pat and his team and to everyone in our community who contributes to the vitality and resilience of the University of Virginia.
Teresa A. SullivanPresident

4 | FINANCIAL REPORT 2013–14
FROM THE EXECUTIVE VICE PRESIDENT AND CHIEF OPERATING OFFICER
The University experienced another strong year of performance in fiscal year 2013-14. Thanks to the skill and dedication of all of our people, we are better positioned than most universities to address the challenges facing public higher education. We have made significant strides in mobilizing the necessary resources to address the generational turnover of faculty and to pursue the strategic directions estab-lished in the Cornerstone Plan. We are focused on advancing the University’s distinctive qualities—an emphasis on close faculty-student interaction in an unparalleled setting, cutting-edge research, and affordable excellence—that continue to distinguish us in a highly competitive landscape and that enable us to deliver value to the citizens of the Commonwealth, the nation, and, increasingly, the world.
A Solid Financial BaseThe primary measure of the University’s financial health and of our capacity to anticipate and adjust to change is our net position. In fiscal year 2013-14, the University’s total net position increased by $850.2 million to $7.9 billion. This 12.0 percent increase in net position was driven in large part by the performance of our endowment and other long-term invest-ments, which experienced a 19.0 percent return. In addition, the U.Va. Medical Center achieved a 5.5 percent operating margin with net income in excess of $137 million.
The diverse revenue base contributing to the University’s net position adds to our long-term resiliency in the face of shifting economic, competitive, and political circumstances. This year, we drew our operational funding from patient services (46.6 percent), tuition and fees (17.3 percent), grants and contracts (10.1 percent), philanthropy and endowment distribution (12.0 percent), auxiliary and other (7.9 percent), and state appropria-tions (6.1 percent).
Recognized for Outstanding ValueThe University’s ability to grow its net posi-tion reflects the quality of our financial and operational management, which earned us once again a “AAA” or equivalent bond rating from all three major credit-rating institutions—Standard & Poor’s, Fitch Ratings, and Moody’s Investors Service. The University remains one of just three public universities in the nation to receive the highest rating from all three agencies and has done so for more than a decade. In turn, these ratings add to our competitive advantage by enabling us to access the capital markets at very attractive rates.
This year, U.S. News and World Report singled out U.Va. as the second-best public institution in the country, while at the same time placing us 59th in financial resources expended per student. The combination of these ranking placements signals both the quality and efficiency of our academic operations. Kiplinger magazine also ranked the University No. 2 among “Best Values in Public Colleges,” while Princeton Review ranked U.Va. third-best value among public universities.
The Atlantic published a long-term survey by PayScale.com that concluded “for the best dollar-for-dollar investment, nothing beats the University of Virginia.”
Meeting the Challenges Facing Higher EducationHigher education has entered a period of dramatic change. The funding model that has sustained public research universities for decades—based on substantial state and federal support—is challenged at the same time the unprecedented generational turnover of faculty is testing financial resources. There is much at stake. The individuals chosen to replace retiring faculty members will lead their institutions to mid-century. Accordingly, universities are under intense pressure, competing fiercely to attract the most talented scholars and researchers.
This year, the University conducted a detailed analysis of the incremental costs of the generational turnover, which includes hiring faculty at more competitive salaries and with start-up packages for science and engineering faculty members. We expect more than 600 tenure-track

5 | FINANCIAL REPORT 2013–14
FROM THE EXECUTIVE VICE PRESIDENT AND CHIEF OPERATING OFFICER
faculty members to retire or leave the University over the next five to seven years, and we are planning accordingly. Our goal is to leverage the generational turnover to further increase the quality of an already distinguished faculty with a focus on build-ing strength in the science, technology, engineering, and math (STEM) disciplines.
We have also targeted raising faculty salaries to top 20 in the Association of American Universities rankings by 2016-17. Thanks to an average 4.75 percent increase in faculty compensation last year, our position rose from 34th in 2012-13 to 27th in 2013-14. We have awarded another average 4.75 percent increase for faculty in October 2014.
For the University to thrive in the 21st-century, it must go beyond funding the status quo. Our purpose in creating the Cornerstone Plan was to determine how we can best allocate our resources to build on the University’s strengths in ways that advance our mission as a public university. Having conducted a cost analysis of the entire Cornerstone Plan and generational faculty turnover this year, we are aggres-sively developing strategies and identifying resources to meet its funding requirements over the next several years.
Funding Our Own AspirationsAmid an environment of uncertain state funding and mounting federal budget concerns, addressing the investment in the Cornerstone Plan and the generational turnover are the University’s highest
priorities. We are evaluating several ways to further diversify and expand our fund-ing sources. We are working to optimize the performance of our balance sheet, to leverage our excellent recent investment performance, and to review our current debt portfolio with a goal of creating addi-tional resources to invest in our strategic priorities. In addition, we have launched our Strategic Corporate Partners program. Focusing on a series of high-profile sectors, the Strategic Corporate Partners pro-gram streamlines the process of building productive relationships, expands educa-tional opportunities for our students, and facilitates partners’ efforts to recruit our graduates. At a time when corporations are focusing their resources on select universi-ties, this program has successfully secured mutually beneficial partnerships for the University with leading businesses.
The University also took steps to maintain the pace of private giving after the close of the $3 billion capital campaign in 2013. In 2013-14, we realized $153.6 million, an increase of 3.8 percent over the previous year, of which a substantial portion was allocated to faculty and student support. We anticipate further emphasis on philan-thropy as we execute a robust campaign to support the Cornerstone Plan and faculty excellence.
One of the objectives of the Cornerstone Plan is to maintain and enhance afford-ability through AccessUVa, our signature need-based financial aid program, on a sustainable basis. This year, we created the Blue Ridge Scholars program to provide support to first-generation, low-income
students. We will continue to evaluate the best approach to funding academic excel-lence while increasing affordability for low and middle income Virginians. Strategic fundraising to grow the AccessUVa endow-ment to generate sufficient revenue to fund the current level of institutional invest-ment in need-based financial aid is a key fundraising priority now and for our next major campaign that will coincide with the University’s bicentennial.
A Foundation of Organizational ExcellenceOur ability to respond to disruptive changes in higher education and health care, fulfill the promise of the Cornerstone Plan, and achieve these aims in a respon-sible, cost-effective manner rests on a foundation of organizational excellence. In our view, organizational excellence entails seeking opportunities to enhance the University’s stewardship of its resources—financial resources as well as facilities—and align its processes, technology, and people to support its institutional priorities. The enterprise risk management framework we are developing will support the success of the Cornerstone Plan and put appropriate risk mitigation strategies in place.
This year, the Organizational Excellence program completed a benchmarking study of administrative services in key support areas: human resources, information technology, finance, procurement, research administration, and student services. We have begun to leverage its findings in a number of ways. The University is making better use of its scale to achieve economies

6 | FINANCIAL REPORT 2013–14
in procurement. For example, we are achieving strategic savings in areas includ-ing sourcing office supplies, renegotiating the dining contract, and redesigning travel and expense management. Additionally, we are pursuing improvements in human resources, service delivery, research automation, and information technology infrastructure.
Our transition to a new financial model complements the Organizational Excellence initiative. The new model promotes transparent decision-making, incentive-based allocations, and prudent stewardship of the University’s resources. It will empower individual academic units to be innovative and cost-efficient, and built-in incentives will encourage entrepreneurship and collaboration among deans, administrative leaders, and faculty and staff members. We anticipate that continued Organizational Excellence efforts will provide additional resources to advance University priorities through a combination of reallocation and efficien-cies achieved.
Investing in Our PeopleThe University continues to invest in the development of our people to ensure that they are ready to face current and future challenges. We are introducing enhanced decision-support and data analysis tools in many of our administrative areas which require us to elevate the skills of our workforce, a goal of our new Center for Leadership Excellence. We are focused on preparing the next generation of University leaders and have developed a Leadership Strategies program to increase mid-level managers’ leadership capacity by creating a personal development plan for them based on feedback gained via a comprehensive and confidential 360-degree evaluation process; exploring timely, U.Va.-specific leadership issues related to the University mission with resident subject matter experts; and completing a relevant and tangible, experiential group learning activity. We will also continue our efforts to increase staff salaries in order to appropri-ately compensate our valuable University staff.
Sustaining the Medical Center at an Inflection Point in Health CareBold steps are required for U.Va. Medical Center to successfully navigate changes resulting from the Affordable Care Act and shifts in patient demographics and acuity. The University is addressing these challenges by expanding its clinical presence in Central Virginia, by building a culture focused on rigorous and continuous quality improvement, shared learning and patient and team member safety, and by investing in its Heart and Vascular, Neurosciences, and Cancer Centers of Excellence. This year, we completed acquisition of the outstanding interest in Culpeper Regional Hospital and opened the Battle Building at UVA Children’s Hospital. Planning is underway for expansion of the Emergency Department, an important project that will improve care for our patients who require immediate attention for a broad array of medical needs.
Vice President and CEO of the Medical Center Ed Howell retired in June after more than a decade of strong stewardship. Tangible elements of his legacy include the Emily Couric Clinical Cancer Center, the Transitional Care Hospital, a major hospital bed expansion project, and the Battle Building. In FY2013-14, we recruited Richard P. (Rick) Shannon, M.D. to serve as executive vice president for health affairs and Pamela Sutton-Wallace to serve as Medical Center CEO. Both bring the depth of experience and expertise needed to keep the Medical Center financially strong while providing outstanding quality and safety to our patients.
Challenges and OpportunityThe decisions that we make today will affect the University well into its third century. All of us in the University community feel an intense responsibility to make the best pos-sible decisions—to approach the challenges we face with determination, analytic rigor, vision, and passion—and, in doing so, secure the best possible future for the University. It is a time to be bold and innovative as we support the initiatives outlined in the Cornerstone Plan. Everyone who works here–the faculty who teach, conduct research and provide health care services, and the staff at all levels who support the many facets of the University’s opera-tions–plays an important role in fulfilling the University’s mission and in meeting the obligations we have to our students, our patients, and the Commonwealth. This is indeed a demanding time, but in addressing these challenges, we have an opportunity both to safeguard and strengthen a remark-able institution.
Patrick D. HoganExecutive Vice President and Chief Operating Officer
FROM THE EXECUTIVE VICE PRESIDENT AND CHIEF OPERATING OFFICER

7 | FINANCIAL REPORT 2013–14
Introduction This discussion and analysis provides an overview of the financial position and results of activities of the University of Virginia (the University) for the year ended June 30, 2014. Comparative information for the year ended June 30, 2013, has been provided where applicable. Management has prepared this discussion, which should be read in conjunction with the financial statements and the notes that follow this section.
The University is an agency of the Commonwealth of Virginia (the Common-wealth) and is governed by the University’s Board of Visitors. The Commonwealth prepares a separate financial report that incorporates all agencies, boards, com-missions, and authorities over which the Commonwealth exercises or has the ability to exercise oversight authority. The Univer-sity, consisting of three major divisions, is a component unit of the Commonwealth and is included in the basic financial statements of the Commonwealth. The University of Virginia’s three divisions are its Academic Division, the University of Virginia Medi-cal Center (the Medical Center), and the University of Virginia’s College at Wise (College at Wise or Wise).
Academic Division A public institution of higher learning with approximately 21,800 on-Grounds students and 2,200 full-time instructional and research faculty members in eleven schools in 2013–14, the University offers
a diverse range of degree programs, from baccalaureate to postdoctoral levels, including doctorates in fifty-five disciplines. The University is recognized internationally for the quality of its faculty and for its commitment to the primary academic missions of instruction, research, public service, and medical care. The University consistently ranks among the nation’s top public colleges and universi-ties, both for its general academic programs and for its strengths in specific academic disciplines. Its emphasis on the student experience is extraordinary among major public institutions, and its dedication to new advances in research permeates all of its schools and colleges.
Medical CenterThe Medical Center is an integrated network of primary and specialty care services ranging from wellness programs and routine checkups to the most technologically advanced care. The hub of the Medical Center is a licensed hospital
with 657 beds in a state-designated Level 1 trauma center located in Charlottesville. The Medical Center also has a transitional care hospital with 40 beds that is located west of the Charlottesville campus. In addition, primary and specialty care are provided at convenient clinic locations throughout central Virginia communities. The University’s Medical Center has a tradition of excellence in teaching, advancement of medical science, and patient care, consistently ranking among the best health care systems in the nation.
College at WiseLocated in southwestern Virginia, the College at Wise is a public liberal arts college with nearly 2,200 students and 100 full-time instructional and research faculty. It offers baccalaureate degrees in thirty majors and eight preprofessional programs, including dentistry, pharmacy, engineering, forestry, law, medicine, physical therapy, and veterinary medicine.
Financial Highlights for the fiscal year ended June 30, 2014
A summary of the University’s change in net position is presented in the table below:
SUMMARY OF THE CHANGE IN NET POSITION (in thousands)
2014 2013
INCREASE (DECREASE)
AMOUNT PERCENT
Total revenues before investment income $ 2,566,453 $ 2,504,377 $ 62,076 2.5%
Total expenses 2,586,148 2,502,297 83,851 3.4%
Increase (decrease) in net position before investment income
(19,695) 2,080 (21,775) (1046.9%)
Investment income 869,910 564,511 305,399 54.1%
Net effect of change in accounting principle - (5,595) 5,595 (100.0%)
TOTAL CHANGE IN NET POSITION $ 850,215 $ 560,996 $ 289,219 51.6%
Overall, the net position increase was entirely related to the performance of the endowment and long-term investments, which returned $870 million this year. Details and discussion by revenue source and expense category are presented on subsequent pages.
Using the Financial Statements The University’s financial report includes five financial statements and related notes:
1. The Statement of Net Position for the University of Virginia
2. The Combined Statements of Financial Position for the Component Units of the University of Virginia
3. The Statement of Revenues, Expenses, and Changes in Net Position for the University of Virginia
4. The Combined Statements of Activities for the Component Units of the University of Virginia
5. The Statement of Cash Flows for the University of Virginia
MANAGEMENT’S DISCUSSION AND ANALYSIS (UNAUDITED)

8 | FINANCIAL REPORT 2013–14
These financial statements are prepared in accordance with Governmental Accounting Standards Board (GASB) principles, which establish standards for external financial reporting for public colleges and universi-
ties. These principles require that financial statements be presented on a consolidated basis to focus on the University as a whole, with resources classified for accounting and reporting purposes into four net asset
categories. Although some of the University’s foundations are reported in the component unit financial statements, this Management’s Discussion and Analysis excludes them except where specifically noted.
Statement of Net PositionThe Statement of Net Position presents the financial position of the University at the end of the fiscal year and includes all assets, deferred outflows of resources, and liabilities of the University. The net position is one indicator of the current financial condition of the University, while the change in net position is an indicator of whether the overall financial condition has improved or worsened during the year. Assets and liabilities are generally mea-sured using current values. One notable
exception is capital assets, which are stated at historical cost less an allowance for depreciation. Depreciation is a method of allocating the cost of a tangible asset over its useful life to indicate how much of an asset’s value has been consumed.
The University’s Statement of Net Position at June 30, 2014, and June 30, 2013, is summarized as follows:
SUMMARY OF THE STATEMENT OF NET POSITION (in thousands)
2014 2013
INCREASE (DECREASE)
AMOUNT PERCENT
Current assets $ 1,119,865 $ 1,000,926 $ 118,939 11.9%
Noncurrent assets
Endowment investments 4,216,644 3,690,260 526,384 14.3%
Other long-term investments 1,316,835 1,086,474 230,361 21.2%
Capital assets, net 3,189,972 3,097,929 92,043 3.0%
Other 74,945 84,635 (9,690) (11.4%)
Total assets 9,918,261 8,960,224 958,037 10.7%
Deferred outflows of resources 35,108 33,827 1,281 3.8%
Total assets and deferred outflows of resources
9,953,369 8,994,051 959,318 10.7%
Current liabilities 715,801 603,057 112,744 18.7%
Noncurrent liabilities 1,311,028 1,314,669 (3,641) (0.3%)
Total liabilities 2,026,829 1,917,726 109,103 5.7%
NET POSITION $ 7,926,540 $ 7,076,325 $ 850,215 12.0%
Current Assets and LiabilitiesThe Statement of Net Position shows that working capital, which is current assets less current liabilities, was $404 million at June 30, 2014. Current assets consist of cash and cash equivalents, short-term investments, and accounts receivable. Current liabilities consist of accounts payable, unearned revenue, and the current portion of long-term liabilities. Increases to accounts payable, unearned revenue, and outstanding commercial paper account for most of the increase in current liabilities.
Current assets cover current liabilities 1.6 times, an indicator of good liquidity and the ability to weather short-term demands on working capital. This rate of coverage decreased just slightly from 1.7 last year. Current assets cover 5.8 months of total operating expenses, exclud-ing depreciation. For 2013–14, one month of operating expenses equaled approxi-mately $194 million.
Endowment and Other Investments Performance. The major portion of the University’s endowment continues to be maintained in a long-term investment pool managed by the University of Virginia Invest-ment Management Company (UVIMCO). The return for the long-term investment pool year was 19 percent in fiscal year 2013–14. This performance figure includes realized and unrealized gains and losses, along with cash income. Total investment income for all funds was positive $870 million.
Distribution. The University distributes endowment earnings with the objective of balancing the annual funding needed to support the endowed programs against the preservation of the future purchasing power. The endowment spending-rate policy is approved by the Board of Visitors and is based on total return, not just cash earnings. The total distribution for the University’s endowment was $164 million, which was 4.6 percent of the July 1, 2013, market value of the endowment.
Endowment investments. The total of endowment investments is $4.2 billion, a $526 million increase over the prior year. In addition to new gifts, the increase results from investment returns earned during the year, reduced by the spending distribution.
From a net position perspective, earnings from the endowment are expendable; however, about two-thirds of the earnings are restricted as to use by the donors. A significant portion of the unrestricted earnings, the remaining one-third of the endowment, is internally designated by the University for scholarships, fellowships, professorships, and research activities.
Including endowment investments held by the eight related foundations reported as component units, the combined Univer-sity system endowment was approximately $6 billion as of June 30, 2014.
MANAGEMENT’S DISCUSSION AND ANALYSIS (UNAUDITED)

9 | FINANCIAL REPORT 2013–14
Capital and Debt Activities A critical factor in sustaining the quality of the University’s academic and research programs and residential life is the development and maintenance of its capital assets. The University continues to implement its long-range plan to modernize its older teaching and research facilities, construct new facilities, and fund major maintenance obligations.
Capital projects consist of replacement, renovation, and new construction of academic, research, and health care facilities, as well as significant investments in equipment and information systems.
Some of the largest new or ongoing projects expensed for construction during the year are listed below:
MAJOR CAPITAL PROJECT EXPENSES DURING 2013–14 (in thousands)
Battle Building $ 46,363
New Cabell Hall 19,968
Ruffner Hall Renovation 13,116
North Grounds Mechanical Plant 8,915
Alderman Road Residences - Building 6 8,110
College at Wise Library 6,461
TOTAL $ 102,933
As infrastructure and building projects were completed or otherwise acquired during the year, the University’s capital asset balances grew significantly. More than $239 million ($117 million for the Academic Division, $111 million for the Medical Center, and $11 million for Wise) of completed projects were added to deprecia-ble capital assets during the fiscal year. The largest building projects completed and placed into service are listed to the right:
MAJOR PROJECTS COMPLETED OR ACQUIRED DURING 2013–14 (in thousands)
CAPITALIZED COST
Alderman Road Residences, Phase III, Buildings 3 & 4
$ 34,360
Lee Street Garage Entry and Connective Elements
34,264
East Chiller Plant 30,287
Alderman Road Residences, Phase IV, Building 5
24,772
North Grounds Recreation Center 18,349
Spring Creek 14,635
TOTAL $ 156,667
Financial stewardship requires the effec-tive management of resources, including the prudent use of debt to finance capital projects. As evidence of the University’s effective stewardship, the University has received the highest long-term and short-term debt ratings from all three major rating agencies, including Moody’s Investors Service (Aaa/P-1), Standard & Poor’s (AAA/A-1+), and Fitch Ratings, Inc. (AAA/F1+). The University of Virginia is one of only two public institutions with the highest long-term debt ratings from all three agencies. Besides being an official acknowledgment of the University’s financial strength, these ratings enable the University to obtain future debt financing at optimum pricing. In addition to issuing its own bonds, the University utilizes its commercial paper program for short-term bridge financing.
The University’s debt portfolio contains a strategic mix of maturity structures and both variable- and fixed-rate obligations. The University achieves this mix through issuing a combination of fixed- and vari-able-rate debt, including commercial paper. It also adjusts its debt mix through the use of interest rate swaps executed according to its Board-approved interest rate risk management policy. The University had just over $1.4 billion of debt outstanding at June 30, 2014, which included $206 million of short-term commercial paper.
Net Position The four net position categories represent the net interest in the University’s assets and deferred inflows of resources after liabilities are deducted. The University’s net position at June 30, 2014, and June 30, 2013, is summarized below:
NET POSITION (in thousands) INCREASE
2014 2013 AMOUNT PERCENT
Net investment in capital assets $ 1,782,053 $ 1,741,026 $ 41,027 2.4%
Restricted
Nonexpendable 588,627 574,465 14,162 2.5%
Expendable 3,062,089 2,670,142 391,947 14.7%
Unrestricted 2,493,771 2,090,692 403,079 19.3%
TOTAL NET POSITION $ 7,926,540 $ 7,076,325 $ 850,215 12.0%
Net investment in capital assets represents the University’s capital assets net of accumulated depreciation and outstanding principal balances of debt attributable to the acquisition, construction, or improve-ment of those assets. Capitalized assets increased by $92 million and were offset by a $51 million increase in debt used to finance those capital assets, for a net change of $41 million.
Restricted nonexpendable net position consists of the University’s permanent endowments, which cannot be expended due to donor restrictions. The increase in
MANAGEMENT’S DISCUSSION AND ANALYSIS (UNAUDITED)
MANAGEMENT’S DISCUSSION AND ANALYSIS (UNAUDITED)
10 | FINANCIAL REPORT 2013–14
nonexpendable net position included new gifts of $12 million.
Restricted expendable net position includes spendable earnings on permanent and quasi endowments, gifts, grants and contracts, and loan funds that are subject to externally imposed restrictions govern-ing their use. The increase in the restricted expendable net position is almost entirely related to investment returns.
Unrestricted net position includes all other activities that are both spendable and not subject to externally imposed restrictions. The majority of the University’s unre-stricted net position has been internally designated for the core mission activities of instruction, research, and health services
programs and initiatives, and capital projects that align with the University’s highest priorities. The increase in the unrestricted net position resulted from investment performance and the Medical Center’s positive operating margin.
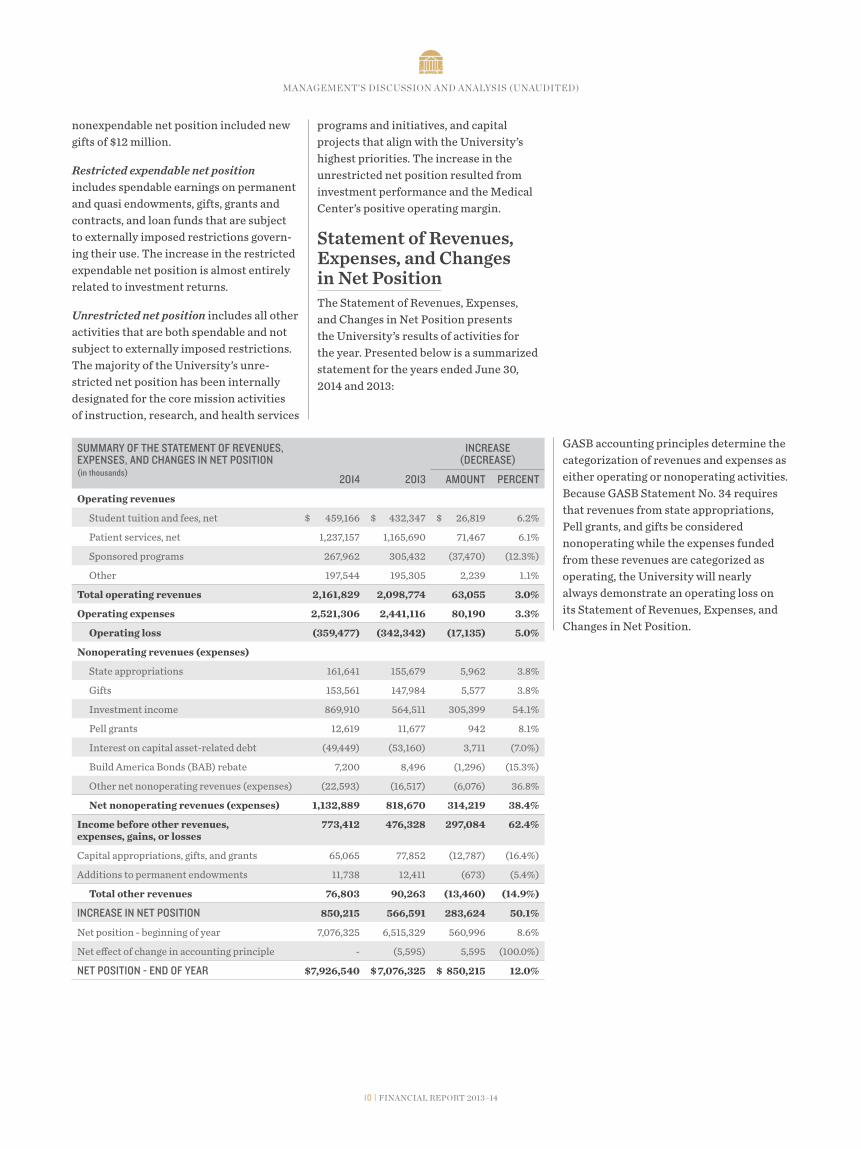
Statement of Revenues, Expenses, and Changes in Net Position The Statement of Revenues, Expenses, and Changes in Net Position presents the University’s results of activities for the year. Presented below is a summarized statement for the years ended June 30, 2014 and 2013:
SUMMARY OF THE STATEMENT OF REVENUES, EXPENSES, AND CHANGES IN NET POSITION (in thousands)
INCREASE (DECREASE)
2014 2013 AMOUNT PERCENT
Operating revenues
Student tuition and fees, net $ 459,166 $ 432,347 $ 26,819 6.2%
Patient services, net 1,237,157 1,165,690 71,467 6.1%
Sponsored programs 267,962 305,432 (37,470) (12.3%)
Other 197,544 195,305 2,239 1.1%
Total operating revenues 2,161,829 2,098,774 63,055 3.0%
Operating expenses 2,521,306 2,441,116 80,190 3.3%
Operating loss (359,477) (342,342) (17,135) 5.0%
Nonoperating revenues (expenses)
State appropriations 161,641 155,679 5,962 3.8%
Gifts 153,561 147,984 5,577 3.8%
Investment income 869,910 564,511 305,399 54.1%
Pell grants 12,619 11,677 942 8.1%
Interest on capital asset-related debt (49,449) (53,160) 3,711 (7.0%)
Build America Bonds (BAB) rebate 7,200 8,496 (1,296) (15.3%)
Other net nonoperating revenues (expenses) (22,593) (16,517) (6,076) 36.8%
Net nonoperating revenues (expenses) 1,132,889 818,670 314,219 38.4%
Income before other revenues, expenses, gains, or losses
773,412 476,328 297,084 62.4%
Capital appropriations, gifts, and grants 65,065 77,852 (12,787) (16.4%)
Additions to permanent endowments 11,738 12,411 (673) (5.4%)
Total other revenues 76,803 90,263 (13,460) (14.9%)
INCREASE IN NET POSITION 850,215 566,591 283,624 50.1%
Net position - beginning of year 7,076,325 6,515,329 560,996 8.6%
Net effect of change in accounting principle - (5,595) 5,595 (100.0%)
NET POSITION - END OF YEAR $ 7,926,540 $ 7,076,325 $ 850,215 12.0%
GASB accounting principles determine the categorization of revenues and expenses as either operating or nonoperating activities. Because GASB Statement No. 34 requires that revenues from state appropriations, Pell grants, and gifts be considered nonoperating while the expenses funded from these revenues are categorized as operating, the University will nearly always demonstrate an operating loss on its Statement of Revenues, Expenses, and Changes in Net Position.

MANAGEMENT’S DISCUSSION AND ANALYSIS (UNAUDITED)
11 | FINANCIAL REPORT 2013–14
RevenuesThe University maintains a diverse stream of revenues, which decreases its dependence on specific revenue sources and allows it to adapt during difficult economic times. The University’s revenues, for the years ended June 30, 2014, and June 30, 2013, are sum-marized below:
SUMMARY OF REVENUES (in thousands)2014 2013
TOTAL INSTITUTION INCREASE (DECREASE)
ACADEMIC DIVISION &
WISE
MEDICAL CENTER
TOTAL INSTITUTION
ACADEMIC DIVISION &
WISE
MEDICAL CENTER
TOTAL INSTITUTION
AMOUNT PERCENT
Operating revenues
Student tuition and fees, net $ 459,166 $ - $ 459,166 $ 432,347 $ - $ 432,347 $ 26,819 6.2%
Patient services, net - 1,237,157 1,237,157 - 1,165,690 1,165,690 71,467 6.1%
Federal, state, and local grants and contracts
223,144 - 223,144 252,221 - 252,221 (29,077) (11.5%)
Nongovernmental grants and contracts 44,818 - 44,818 53,211 - 53,211 (8,393) (15.8%)
Sales and services of educational departments
21,434 - 21,434 18,186 - 18,186 3,248 17.9%
Auxiliary enterprises revenue, net 124,922 - 124,922 120,387 - 120,387 4,535 3.8%
Other operating revenues 2,015 49,173 51,188 8,058 48,674 56,732 (5,544) (9.8%)
Total operating revenues 875,499 1,286,330 2,161,829 884,410 1,214,364 2,098,774 63,055 3.0%
Nonoperating revenues
State appropriations 161,641 - 161,641 155,679 - 155,679 5,962 3.8%
Private gifts 147,328 6,233 153,561 147,014 970 147,984 5,577 3.8%
Investment income 782,887 87,023 869,910 510,211 54,300 564,511 305,399 54.1%
Other nonoperating revenues 89,422 - 89,422 101,940 - 101,940 (12,518) (12.3%)
Total nonoperating revenues 1,181,278 93,256 1,274,534 914,844 55,270 970,114 304,420 31.4%
TOTAL REVENUES $ 2,056,777 $ 1,379,586 $ 3,436,363 $ 1,799,254 $ 1,269,634 $ 3,068,888 $ 367,475 12.0%
Net student tuition and fees increased due to new programs, enrollment growth, and increases in tuition. Tuition and fees revenue is reported net of scholarships and allowances provided from University sources. Net patient revenues increased due to increased patient collections after write-offs. Grant and contract activity, including direct research and the recovery of indirect facilities and administrative costs, declined primarily due to the ongoing pressure and uncertainty at the federal level. The increase in nonoperating
revenues is almost entirely attributable to positive investment returns.
Revenues and Other Sources of Operational FundingBelow is a chart of revenues by source (both operating and nonoperating). These revenues were used to fund the University’s operating activities for the fiscal year ended June 30, 2014. As noted earlier, GASB requires state appropriations, current
gifts, and Pell grants to be treated as nonop-erating revenues. Endowment spending is not current-year revenue, but a distribution of previously recognized investment income revenue. However, it is an important funding source for current operations and is included in the chart below to present a more accurate picture of the University’s funding of current operations.
Patient services, net | 46.6%Student tuition and fees, net | 17.3%Grants and contracts | 10.1%Endowment spending distribution | 6.2%State appropriations | 6.1%Private gifts | 5.8%Auxiliary enterprises revenue, net | 4.7%Other | 3.2%
3.2
46.6
17.3
10.1
6.2
6.1
5.84.7
Total University Revenues and Other Sources of Operational Funding

34.2
10.7
11.0
9.3
2.7
MANAGEMENT’S DISCUSSION AND ANALYSIS (UNAUDITED)
12 | FINANCIAL REPORT 2013–14
20.012.1
Patient services revenues accounted for nearly one-half of the University’s revenues and operational funding sources. Net student tuition and fees and grants and contracts are the next largest revenues. Private support from endowment spend-ing and gifts combined provides about 12 percent of the University’s funding. State appropriations accounted for just 6 percent of funding for operations. With ongoing economic pressures on state revenues and increasing consideration of affordability, funding from private sources continues to be vitally important to the University’s operations.
A clearer picture of the academic and research mission revenue stream emerges when the Medical Center’s data is excluded, as it is in the chart to the right. Net tuition and fees make up more than one-third of the operating revenues for the Academic Divi-sion and Wise. Contributing a combined 22 percent, private support in the form of endowment spending distribution and gifts has been, and will continue to be, essential to maintaining the University’s academic excellence. External research support from grants and contracts makes up another 20 percent of operational funding.
ExpensesThe University’s expenses for the years ended June 30, 2014, and June 30, 2013, are summarized as follows:
SUMMARY OF EXPENSES (in thousands)2014 2013
TOTAL INSTITUTION INCREASE (DECREASE)
ACADEMIC DIVISION & WISE
MEDICAL CENTER TOTAL INSTITUTION ACADEMIC DIVISION & WISE
MEDICAL CENTER TOTAL INSTITUTION AMOUNT PERCENT
Operating expenses
Compensation $ 852,095 $ 537,177 $ 1,389,272 $ 858,972 $ 507,672 $ 1,366,644 $ 22,628 1.7%
Supplies and other services 280,513 574,680 855,193 274,479 534,054 808,533 46,660 5.8%
Student aid 73,802 - 73,802 69,684 - 69,684 4,118 5.9%
Depreciation 115,928 83,260 199,188 112,086 80,187 192,273 6,915 3.6%
Other operating expense 3,851 - 3,851 3,982 - 3,982 (131) (3.3%)
Total operating expenses 1,326,189 1,195,117 2,521,306 1,319,203 1,121,913 2,441,116 80,190 3.3%
Nonoperating expenses and other
Interest expense (net of BAB rebate) 27,597 14,652 42,249 33,708 10,956 44,664 (2,415) (5.4%)
Loss on capital assets 1,136 3,343 4,479 1,802 372 2,174 2,305 106.0%
Other nonoperating expense 18,114 - 18,114 5,911 8,432 14,343 3,771 26.3%
Total nonoperating expenses 46,847 17,995 64,842 41,421 19,760 61,181 3,661 6.0%
TOTAL EXPENSES $ 1,373,036 $ 1,213,112 $ 2,586,148 $ 1,360,624 $ 1,141,673 $ 2,502,297 $ 83,851 3.4%
Increases in operating expenses are primarily driven by the Medical Center’s $41 million increase in supplies and other services and $29 million increase in compensation and are related to the Medical Center’s strategic initiatives, ongoing relationships with other health systems, and the opening of new clinics.
Following are graphic illustrations of expenses (both operating and nonoperat-ing) for the fiscal year ended June 30, 2014.
The chart on the left presents information for the total University, including the
Medical Center, while the chart on the right presents information for just the Academic and Wise divisions. In addition to their natural (object) classification, it is also informative to review operating expenses by function.
A complete matrix of expenses, natural versus functional, is contained in Note 9 of the Notes to the Financial Statements. Expenses for core mission functions of patient services, instruction, and research account for 72 percent of total operating expenses. The remainder is for support
costs of these core mission functions and includes academic support, libraries, student services, institutional support services, and operation and maintenance of facilities.
Student tuition and fees, net | 34.2%Grants and contracts | 20.0%State appropriations | 12.1%Endowment spending distribution | 10.7%Private gifts | 11.0%Auxiliary enterprises revenue, net | 9.3%Other | 2.7%
Academic and Wise Revenues and Other Sources of Operational Funding

MANAGEMENT’S DISCUSSION AND ANALYSIS (UNAUDITED)
13 | FINANCIAL REPORT 2013–14
63.5
8.4
5.4
2.0
20.4
1.7
Future Economic OutlookOverall, the University’s financial condi-tion is stable, despite challenges stemming from the Commonwealth of Virginia’s current budgetary challenges and increas-ing scrutiny of the federal budget, and the changing health care environment. The University maintains the highest credit ratings of all three ratings agencies, which provides the University with a high degree of financial flexibility. Fundraising success and the historical performance of the endowment continues to allow the University to hold a unique position among public higher education institutions. The value delivered to our students is strong with graduation rates among the highest in the country while student indebtedness levels are among the lowest.
Higher education remains a focus of attention at state and national levels, particularly in terms of access, affordabil-ity, and student outcomes. Preserving the University’s excellent academic reputation and rigor is equally crucial among students and alumni. To address these issues, in November 2013 the Board of Visitors of the University of Virginia endorsed the Cornerstone Plan (the Plan), which sets out five pillars to serve as areas of strategic emphasis over the next five years:
1. Enrich and strengthen the University’s distinctive residential culture
2. Strengthen the University’s capacity to advance knowledge and serve the Commonwealth of Virginia, the nation, and the world through research, scholarship, creative arts, and innovation
3. Provide educational experiences that deliver new levels of student engagement
4. Assemble and support a distinguishing faculty
5. Steward the University’s resources to fortify and further distinguish what is already one of the academically strongest, best managed, most financially stable, and most affordable universities in the nation
As the Cornerstone Plan moves forward, the Board of Visitors saw a need to develop a long-term financial plan and a sustainable financial/pricing model that provides the reliable and ongoing funding necessary to enhance academic excellence as outlined in the Plan and advances affordability and predictability of tuition, fees, and financial aid for students and families. Through the date of publication of this document, the subcommittee charged with this work has thoroughly evaluated the implementation cost of the Plan, including the impending generational turnover of faculty; efforts to streamline and increase effectiveness of all processes supporting the core mission; and potential revenue enhancements,
including leveraging our favorable balance sheet position. Organizational excellence remains a key focus as the University continues to enhance organizational capacity across academic and administra-tive service areas to advance excellence in the core missions and to facilitate the realization of strategic priorities.
With the majority of the University’s research funding coming from federal grants, as well as its impact on federally funded student grants and loans, the federal budget remains a key consideration of our financial outlook. Midterm elec-tions resulted in overwhelming changes in Congress; it is anticipated that the Higher Education Act reauthorization as well as federal revenues and spending will be a focus. At the University, federal research awards increased very slightly in 2014, but it will remain a top priority of the University to continue to increase proposals and awards with the strategic recruitment of highly productive faculty aligned with research priorities. The University has aggressively pursued new partnerships with industrial sponsors to diversify its institutional research portfolio and directly support key research and scholarship elements of the Cornerstone Plan, creating new external sources of funding for research and opportunities for our faculty and students, such as new domestic and global internships, access to real-world problem sets, and the expansion of our global footprint.
7.7
2.91.01.6
33.153.7 62.1
Compensation | 53.7%Supplies and other services | 33.1%Depreciation | 7.7%Student aid | 2.9%Interest expense, net | 1.6% Other | 1.0%
Total University Expenses Academic and Wise ExpensesCompensation | 62.1%
Supplies and other services | 20.4%Depreciation | 8.4%
Student aid | 5.4%Interest expense, net | 2.0%
Other | 1.7%

14 | FINANCIAL REPORT 2012–13
The University anticipates further uncertainty in state funding. Expected investments from the state general fund to support increasing enrollments and research did not materialize for fiscal year 2015, and in August 2014, the Commonwealth’s budget reconciliation process passed on an $8.2 million reduction in previously authorized state support. Any further cuts during the 2015 General Assembly session will be addressed during the University’s budget development and long-range financial planning process.
The University’s health system has continued to produce positive financial results. Looking forward, the health system’s top strategic planning goal remains becoming a top decile provider of clinical care among academic medical
centers. Leadership has developed a long-range financial plan to achieve this goal within the context of an increasingly changing health care industry. Within the industry, there will be continued downward pressure on inpatient utilization and growth in demand for outpatient service; increasing costs associated with medical supply, pharmaceutical, and medical device expenses; a growing compliance burden; a shortage of health care workers; and continued responsibility to care for the medically underserved in Virginia. The Patient Protection and Affordable Care Act, signed into law in March 2010, continues to affect the health care industry as new substantive provisions were implemented this year. The impact will be decreased reimbursements from government
payors despite increasing costs of medical delivery and an industry-wide erosion of pricing power with private payors. Medical Center volume growth is focused on outpatient services with continued implementation of the Centers of Excellence, the opening of the Battle Building for pediatric services, expansion of the Outpatient Surgery Center, and implementation of the outreach strategy.
Effective and attentive leadership, a historical commitment to financial excellence, and a diversified approach will all help the University continue to succeed and excel in the future. While it is impossible to predict the ultimate results, management continues to believe that the University’s financial condition will remain strong.
MANAGEMENT’S DISCUSSION AND ANALYSIS (UNAUDITED)

Management Responsibility
November 5, 2014
To the President and Board of Visitors of the University of Virginia:
We are pleased to submit the annual Financial Report of the University of Virginia for the year ended June 30, 2014. Management is responsible for the objectivity and integrity of the accompany-ing financial statements, which have been prepared in conformance with the Governmental Accounting Standards Board Statement No. 34, Basic Financial Statements—and Management’s Discussion and Analysis—for State and Local Governments, and Statement No. 35, Basic Financial Statements—and Management’s Discussion and Analysis—for Public Colleges and Universities. The financial statements, of necessity, included management’s estimates and judgments relating to matters not concluded by year-end. Financial information contained elsewhere in the annual Financial Report is consistent with that included in the financial statements.
Management is responsible for maintaining the University’s system of internal control that includes careful selection and development of employees, proper division of duties, and written accounting and operating policies and procedures augmented by a continuing internal audit program. Although there are inherent limitations to the effectiveness of any system of accounting controls, management believes that the University’s system provides reasonable, but not absolute, assurance that assets are safeguarded from unauthorized use or disposition and that the accounting records are sufficiently reliable to permit the preparation of financial statements that conform in all material respects with generally accepted accounting principles.
The Auditor of Public Accounts for the Commonwealth of Virginia, using the reports of independent certified public accountants for the component units, provides an independent opinion regarding the fair presentation in the financial statements of the University’s financial position. Their examination was made in accordance with generally accepted government auditing standards and included a review of the system of internal accounting controls to the extent they considered necessary to determine the audit procedures required to support their opinion. The Audit Committee of the Board of Visitors meets periodically and privately with the independent auditors, the internal auditors, and the financial officers of the University to review matters relating to the quality of the University’s financial reporting, the internal accounting controls, and the scope and results of audit examinations. The committee also reviews the scope and quality of the internal auditing program.
Respectfully submitted,
Melody S. BianchettoAssociate Vice President for Finance
David J. BolingAssistant Vice President for Finance and University Comptroller
15 | FINANCIAL REPORT 2013–14
16 | FINANCIAL REPORT 2013–14
November 5, 2014
The Honorable Terence R. McAuliffe Governor of Virginia
The Honorable John C. WatkinsChairman, Joint Legislative Audit and Review Commission
Board of VisitorsUniversity of Virginia
Independent Auditor’s Report
Report on Financial StatementsWe have audited the accompanying financial statements of the business-type activities and aggregate discretely presented component units of the University of Virginia, a component unit of the Commonwealth of Virginia, as of and for the year ended June 30, 2014 and the related notes to the financial statements, which collectively comprise the University’s basic financial statements as listed in the table of contents.
Management’s Responsibility for the Financial StatementsManagement is responsible for the preparation and fair presentation of these financial statements in accor-dance with accounting principles generally accepted in the United States of America; this includes
the design, implementation, and maintenance of internal control relevant to the preparation and fair presentation of financial statements that are free from material misstate-ment, whether due to fraud or error.
Auditor’s ResponsibilityOur responsibility is to express opinions on these financial state-ments based on our audit. We did not audit the financial statements of the aggregate discretely presented component units of the University, which are discussed in Note 1. Those financial statements were audited by other auditors whose reports thereon have been furnished to us, and our opinion, insofar as it relates to the amounts included for the component units of the University, is based on the reports of the other auditors.
We conducted our audit in accor-dance with auditing standards generally accepted in the United
States of America and the standards applicable to financial audits contained in Government Auditing Standards, issued by the Comptrol-ler General of the United States. Those standards require that we plan and perform the audit to obtain reasonable assurance about whether the financial statements are free of material misstatement. The financial statements of the compo-nent units of the University that were audited by other auditors upon whose reports we are relying were audited in accordance with auditing standards generally accepted in the United States of America, but not in accordance with Govern-ment Auditing Standards.
An audit involves performing procedures to obtain audit evidence about the amounts and disclosures in the financial statements. The procedures selected depend on the auditor’s judgment, including
www.apa.virginia.gov | (804)225-3350 | [email protected]
INDEPENDENT AUDITOR’S REPORT
www.apa.virginia.gov | (804) 225-‐3350 | [email protected]
November 5, 2014 The Honorable Terence R. McAuliffe Governor of Virginia The Honorable John C. Watkins Chairman, Joint Legislative Audit and Review Commission Board of Visitors University of Virginia
INDEPENDENT AUDITOR’S REPORT
Report on Financial Statements
We have audited the accompanying financial statements of the business-‐type activities and aggregate discretely presented component units of the University of Virginia, a component unit of the Commonwealth of Virginia, as of and for the year ended June 30, 2014, and the related notes to the financial statements, which collectively comprise the University’s basic financial statements as listed in the table of contents. Management’s Responsibility for the Financial Statements Management is responsible for the preparation and fair presentation of these financial statements in accordance with accounting principles generally accepted in the United States of America; this includes the design, implementation, and maintenance of internal control relevant to the preparation and fair presentation of financial statements that are free from material misstatement, whether due to fraud or error. Auditor’s Responsibility Our responsibility is to express opinions on these financial statements based on our audit. We did not audit the financial statements of the aggregate discretely presented component units of the University, which are discussed in Note 1. Those financial statements were audited by other auditors whose reports thereon have been furnished to us, and our opinion, insofar as it relates to

17 | FINANCIAL REPORT 2013–14
the assessment of the risks of material misstatement of the financial statements, whether due to fraud or error. In making those risk assessments, the auditor considers internal control relevant to the entity’s preparation and fair presentation of the financial statements in order to design audit procedures that are appropriate in the circumstances but not for the purpose of expressing an opinion on the effectiveness of the entity’s internal control. Accordingly, we express no such opinion. An audit also includes evaluating the appropriateness of accounting poli-cies used and the reasonableness of significant accounting estimates made by management, as well as evaluating the overall financial statement presentation.
We believe that the audit evidence we have obtained is sufficient and appropriate to provide a reasonable basis for our audit opinions.
OpinionIn our opinion, based on our audit and the reports of other auditors, the financial statements referred to above present fairly, in all material respects, the financial position of the business-type activities and aggregate discretely presented component units of the University as of June 30, 2014, and the respec-tive changes in financial position and cash flows, where applicable, thereof for the year then ended, in accordance with accounting principles generally accepted in the United States of America.
Other MattersPrior-Year Summarized Comparative Information
We have previously audited the University of Virginia’s 2013 finan-cial statements, and we expressed an unmodified audit opinion on the respective financial statements in our report dated November 1, 2013. In our opinion, the summarized comparative information presented herein as of and for the year ended June 30, 2013, is consistent, in all material respects, with the audited financial statements from which it has been derived.
Required Supplementary Information
Accounting principles generally accepted in the United States of America require that the Manage-ment’s Discussion and Analysis on pages 7 through 14 and the Funding Progress for Other Postemploy-ment Benefit Plans on page 49 be presented to supplement the basic financial statements. Such informa-tion, although not a part of the basic financial statements, is required by the Governmental Accounting Standards Board who considers it to be an essential part of the financial reporting for placing the basic finan-cial statements in an appropriate operational, economic, or historical context. We have applied certain limited procedures to the required supplementary information in accordance with auditing standards generally accepted in the United States of America, which consisted of inquiries of management about the methods of preparing the informa-tion and comparing the information
for consistency with management’s responses to our inquiries, the basic financial statements, and other knowledge we obtained during our audit of the basic financial statements. We do not express an opinion or provide any assurance on the information because the limited procedures do not provide us with sufficient evidence to express an opinion or provide any assurance.
Other Reporting Required by Government Auditing Standards
In accordance with Government Auditing Standards, we have also issued our report dated November 5, 2014, on our consideration of the University of Virginia’s internal control over financial reporting and on our tests of its compliance with certain provisions of laws, regulations, contracts and grant agreements, and other matters. The purpose of that report is to describe the scope of our testing of internal control over financial reporting and compliance and the results of that testing and not to provide an opinion on the internal control over financial reporting or on compli-ance. That report is an integral part of an audit performed in accordance with Government Auditing Standards in considering the University’s internal control over financial reporting and compliance.
Martha S. Mavredes, CPAAuditor of Public Accounts
www.apa.virginia.gov | (804)225-3350 | [email protected]
INDEPENDENT AUDITOR’S REPORT

Statement of Net Position (in thousands)
AS OF JUNE 30, 2014 (WITH COMPARATIVE INFORMATION AS OF JUNE 30, 2013)
2014 2013
ASSETS
Current assetsCash and cash equivalents (Note 2) $ 612,001 $ 502,278Short-term investments (Note 2) 180,336 187,552Appropriations available 6,758 6,366Accounts receivable, net (Note 3a) 269,427 258,962Prepaid expenses 23,062 16,690Inventories 22,296 24,018Notes receivable, net (Note 3b) 5,985 5,060Total current assets 1,119,865 1,000,926
Noncurrent assets
Cash and cash equivalents (Note 2) 22,983 33,750Endowment investments (Note 2) 4,216,644 3,690,260Other long-term investments (Note 2) 1,316,835 1,086,474Deposit with bond trustee 1,049 22Notes receivable, net (Note 3b) 35,664 35,427Pledges receivable, net (Note 3c) 4,566 4,249Capital assets - depreciable, net (Note 3d) 2,848,728 2,751,426Capital assets - nondepreciable (Note 3d) 341,244 346,503Goodwill (Note 3e) 10,683 11,187Total noncurrent assets 8,798,396 7,959,298
Deferred outflows of resources (Note 3f ) 35,108 33,827
TOTAL ASSETS AND DEFERRED OUTFLOWS OF RESOURCES $ 9,953,369 $ 8,994,051
LIABILITIES
Current liabilities
Accounts payable and accrued liabilities (Note 3g) $ 292,411 $ 227,564Unearned revenue (Note 3h) 98,326 93,177Deposits held in custody for others 13,807 31,813Commercial paper (Note 4) 205,893 139,593Long-term debt - current portion (Note 5a) 13,303 12,814Long-term liabilities - current portion (Note 5b) 92,061 98,096Total current liabilities 715,801 603,057
Noncurrent liabilities
Long-term debt (Note 5a) 1,178,213 1,191,167Derivative instrument liability (Note 6) 20,448 18,659Other noncurrent liabilities (Note 5b) 112,367 104,843Total noncurrent liabilities 1,311,028 1,314,669
TOTAL LIABILITIES $ 2,026,829 $ 1,917,726
NET POSITION
Invested in capital assets, net of related debt $ 1,782,053 $ 1,741,026Restricted:
Nonexpendable 588,627 574,465Expendable 3,062,089 2,670,142
Unrestricted 2,493,771 2,090,692TOTAL NET POSITION $ 7,926,540 $ 7,076,325
Certain 2013 amounts have been restated to conform to the 2014 classifications.The accompanying Notes to Financial Statements are an integral part of this statement.
18 | FINANCIAL REPORT 2013–14
UNIVERSITY OF VIRGINIA

Component Units, Combined Statements of Financial Position (in thousands)
AS OF JUNE 30, 2014 (WITH COMPARATIVE INFORMATION AS OF JUNE 30, 2013)
ASSETS 2014 2013
Current assets
Cash and cash equivalents $ 57,466 $ 67,501
Receivables 100,555 99,103
Other current assets 362,222 171,256
Total current assets 520,243 337,860
Noncurrent assets
Pledges receivable, net of current portion of $27,773 42,718 50,132
Long-term investments 7,156,032 6,187,123
Capital assets, net of depreciation 376,087 462,780
Other noncurrent assets 44,873 41,723
Total noncurrent assets 7,619,710 6,741,758
TOTAL ASSETS $ 8,139,953 $ 7,079,618
LIABILITIES AND NET ASSETS
Current liabilities
Assets held in trust for others $ 95,209 $ 89,034
Other liabilities 188,721 187,722
Total current liabilities 283,930 276,756
Noncurrent liabilities
Long-term debt, net of current portion of $30,889 236,389 248,612
Other noncurrent liabilities 5,958,048 5,110,591
Total noncurrent liabilities 6,194,437 5,359,203
TOTAL LIABILITIES $ 6,478,367 $ 5,635,959
NET ASSETS
Unrestricted $ 392,105 $ 329,759
Temporarily restricted 708,855 593,460
Permanently restricted 560,626 520,440
TOTAL NET ASSETS $ 1,661,586 $ 1,443,659
TOTAL LIABILITIES AND NET ASSETS $ 8,139,953 $ 7,079,618
The accompanying Notes to Financial Statements are an integral part of this statement.
19 | FINANCIAL REPORT 2013–14
UNIVERSITY OF VIRGINIA

20 | FINANCIAL REPORT 2013–14
Statement of Revenues, Expenses, and Changes in Net Position (in thousands)
FOR THE YEAR ENDED JUNE 30, 2014 (WITH COMPARATIVE INFORMATION FOR THE YEAR ENDED JUNE 30, 2013)
2014 2013
REVENUES
Operating revenues
Student tuition and fees (net of scholarship allowances of $99,386 and $88,656) $ 459,166 $ 432,347
Patient services (net of charity care of $2,741,511 and $2,346,855) 1,237,157 1,165,690
Federal grants and contracts 218,394 243,621
State and local grants and contracts 4,750 8,600
Nongovernmental grants and contracts 44,818 53,211
Sales and services of educational departments 21,434 18,186
Auxiliary enterprises revenue (net of scholarship allowances of $13,325 and $14,494) 124,922 120,387
Other operating revenues 51,188 56,732
TOTAL OPERATING REVENUES 2,161,829 2,098,774
EXPENSES
Operating expenses (Note 9)
Compensation and benefits 1,389,272 1,366,644
Supplies and other services 855,193 808,533
Student aid 73,802 69,684
Depreciation 199,188 192,273
Other 3,851 3,982
TOTAL OPERATING EXPENSES 2,521,306 2,441,116
OPERATING LOSS (359,477) (342,342)
NONOPERATING REVENUES (EXPENSES)
State appropriations (Note 10) 161,641 155,679
Gifts 153,561 147,984
Investment income 869,910 564,511
Pell grants 12,619 11,677
Interest on capital asset–related debt (49,449) (53,160)
Build America Bonds rebate 7,200 8,496
Losses on capital assets (4,479) (2,174)
Other nonoperating expenses (18,114) (14,343)
NET NONOPERATING REVENUES 1,132,889 818,670
INCOME BEFORE OTHER REVENUES, EXPENSES, GAINS, OR LOSSES 773,412 476,328
Capital appropriations 42,414 42,566
Capital grants and gifts 22,651 35,286
Additions to permanent endowments 11,738 12,411
TOTAL OTHER REVENUES 76,803 90,263
INCREASE IN NET POSITION 850,215 566,591
NET POSITION
Net position—beginning of year 7,076,325 6,515,329
Net effect of change in accounting principle (Note 1) - (5,595)
NET POSITION—BEGINNING OF YEAR AS RESTATED 7,076,325 6,509,734
NET POSITION—END OF YEAR $ 7,926,540 $ 7,076,325
Certain 2013 amounts have been restated to conform to the 2014 classifications.The accompanying Notes to Financial Statements are an integral part of this statement.
UNIVERSITY OF VIRGINIA

STATEMENT OF CASH FLOWS
Component Units,Combined Statements of Activities (in thousands)
FOR THE YEAR ENDED JUNE 30, 2014 (WITH COMPARATIVE INFORAMTION FOR THE YEAR ENDED JUNE 30, 2013)
2014 2013
UNRESTRICTED REVENUES AND SUPPORT
Contributions $ 25,914 $ 22,144
Fees for services, rentals, and sales 372,387 338,868
Investment income 46,944 52,860
Reclassification per donor stipulation (105) (6,588)
Net assets released from restriction 105,205 99,862
Other revenues 137,715 130,907
TOTAL UNRESTRICTED REVENUES AND SUPPORT 688,060 638,053
EXPENSES
Program services, lectures, and special events 421,339 407,239
Scholarships and financial aid 81,788 74,501
Management and general 33,415 33,489
Other expenses 89,468 77,509
TOTAL EXPENSES 626,010 592,738
EXCESS OF UNRESTRICTED REVENUES AND SUPPORT OVER EXPENSES 62,050 45,315
CHANGES IN TEMPORARILY RESTRICTED NET ASSETS
Contributions 49,964 52,412
Investment and other income 176,901 113,118
Reclassification per donor stipulation (6,094) 7,044
Net assets released from restriction (105,207) (99,862)
NET CHANGES IN TEMPORARILY RESTRICTED NET ASSETS 115,564 72,712
CHANGES IN PERMANENTLY RESTRICTED NET ASSETS
Contributions 30,168 24,937
Investment and other income 5,550 (3,035)
Reclassification per donor stipulation 4,450 (456)
Net assets released from restriction 2 -
NET CHANGES IN PERMANENTLY RESTRICTED NET ASSETS 40,170 21,446
CHANGE IN NET ASSETS 217,784 139,473
Net assets-beginning of year 1,443,659 1,297,961
Other activity 143 6,225
NET ASSETS-END OF YEAR $ 1,661,586 $ 1,443,659
The accompanying Notes to Financial Statements are an integral part of this statement.
21 | FINANCIAL REPORT 2013–14
UNIVERSITY OF VIRGINIA

22 | FINANCIAL REPORT 2013–14
Statement of Cash Flows (in thousands)
FOR THE YEAR ENDED JUNE 30, 2014 (WITH COMPARATIVE INFORMATION FOR THE YEAR ENDED JUNE 30, 2013)
2014 2013
CASH FLOWS FROM OPERATING ACTIVITIESTuition and fees $ 460,826 $ 435,030Grants and contracts 272,717 304,393Patient services 1,249,671 1,186,229Sales and services of educational activities 41,648 20,703Sales and services of auxiliary enterprises 125,785 119,606Payments to employees and fringe benefits (1,368,619) (1,364,284)Payments to vendors and suppliers (854,823) (780,652)Payments for scholarships and fellowships (73,802) (69,684)Perkins and other loans issued to students (20,274) (6,225)Collection of Perkins and other loans to students 16,828 4,948Other receipts 55,811 43,105
NET CASH USED BY OPERATING ACTIVITIES (94,232) (106,831)CASH FLOWS FROM NONCAPITAL FINANCING ACTIVITIES
State appropriations 161,204 156,176Additions to true endowments 11,738 12,411Federal Family Education Loan Program receipts - 5Federal Family Education Loan Program payments - (5)Federal Direct Loan Program receipts 123,554 118,427Federal Direct Loan Program payments (123,554) (118,427)Pell grants 12,619 11,677Deposits held in custody for others (18,006) (4,097)Noncapital gifts and grants and endowments received 159,590 137,178Other net nonoperating expenses (913) (7,511)
NET CASH PROVIDED BY NONCAPITAL FINANCING ACTIVITIES 326,232 305,834CASH FLOWS FROM CAPITAL AND RELATED FINANCING ACTIVITIES
Capital appropriations 42,551 42,986Capital gifts and grants received 23,570 45,714Proceeds from capital debt 101,741 411,622Proceeds from sale of capital assets 18,585 7,658Acquisition and construction of capital assets (327,818) (398,843)Principal paid on capital debt and leases (47,284) (297,213)Interest paid on capital debt and leases (43,026) (47,064)Deposit with trustee (1,028) 17,766
NET CASH USED BY CAPITAL AND RELATED FINANCING ACTIVITIES (232,709) (217,374)CASH FLOWS FROM INVESTING ACTIVITIES
Proceeds from sales and maturities of investments 318,782 314,447Interest on investments 4,230 8,222Purchase of investments and related fees (218,333) (162,664)Other investment activities (5,014) (36,182)
NET CASH PROVIDED BY INVESTING ACTIVITIES 99,665 123,823NET INCREASE IN CASH AND CASH EQUIVALENTS 98,956 105,452
Cash and cash equivalents, July 1 536,028 430,576CASH AND CASH EQUIVALENTS, JUNE 30 $ 634,984 $ 536,028
RECONCILIATION OF OPERATING LOSS TO NET CASH USED BY OPERATING ACTIVITIESOperating loss $ (359,477) $ (342,342)Adjustments to reconcile operating loss to net cash used by operating activities
Depreciation expense 199,188 192,273Provision for uncollectible loans and write-offs 2,645 399Changes in assets and liabilities:
Receivables, net (15,162) 47,898Inventories (4,129) 305Other assets - 34Prepaid expenses (521) (431)Notes receivable, net (3,808) (1,276)Accounts payable and accrued liabilities 57,760 (49,910)Unearned revenue 20,297 40,424Accrual for compensated absences 8,975 5,795TOTAL ADJUSTMENTS 265,245 235,511
NET CASH USED BY OPERATING ACTIVITIES $ (94,232) $ (106,831)
NONCASH INVESTING, CAPITAL, AND FINANCING ACTIVITIES—ACADEMIC ONLYAssets acquired through assumption of a liability $ 82,105 $ 357,371
Assets acquired through a gift 2,557 6,919
Change in fair value of investments 790,193 513,152
Increase in receivables related to nonoperating income 4,671 11,744
Loss on disposal of capital assets 1,135 1,802
Certain 2013 amounts have been restated to conform to 2014 classifications.The accompanying Notes to Financial Statements are an integral part of this statement.
NOTES TO FINANCIAL STATEMENTS

23 | FINANCIAL REPORT 2013–1423 | FINANCIAL REPORT 2013–14
Notes to Financial Statements
NOTES TO FINANCIAL STATEMENTS

24 | FINANCIAL REPORT 2013–1424 | FINANCIAL REPORT 2013–14
NOTE 1: ORGANIZATION AND SUMMARY OF SIGNIFICANT ACCOUNTING POLICIES
Organization and PurposeThe University of Virginia (the University) is an agency of the Commonwealth of Virginia (the Commonwealth) and is governed by the University’s Board of Visitors (the Board). A separate report is prepared for the Commonwealth that includes all agencies, boards, commissions, and authorities over which the Com-monwealth exercises or has the ability to exercise oversight authority. The Univer-sity is a discretely presented component unit of the Commonwealth and is included in its basic financial statements. The University consists of three divisions. The Academic Division and the University of Virginia’s College at Wise (the College at Wise) generate and disseminate knowledge in the humanities, arts, and scientific and professional disciplines through instruction, research, and public service. The Medical Center Division (the Medical Center), along with its three controlled subsidiary companies—Univer-sity of Virginia Imaging, LLC; Community Medicine, LLC; and Hematology Oncology Patient Enterprises, Inc.—provides routine and ancillary patient services through a full-service hospital and clinics.
Income Tax StatusThe University is an agency of the Com-monwealth and is exempt from federal income tax under Section 115(a) of the Internal Revenue Code. The University’s related organizations are 501(c)(3) organizations and are exempt from federal income tax under the Internal Revenue Code. Certain activities may be subject to taxation as unrelated business income per Internal Revenue Code requirements.
Financial Reporting EntityThe University has twenty-five legally separate, tax-exempt related foundations operating in support of the interests of the University (the Foundations). These related foundations are not-for-profit cor-porations controlled by separate boards of directors. The University determined that the following eight foundations qualify as
component units of the University because of the nature and significance of their relationship with the University, including their ongoing financial support of the University. As such, they are presented discretely in the financial statements as of and for the year ended June 30, 2014.
• University of Virginia Law School Foundation
• University of Virginia Darden School Foundation
• Alumni Association of the University of Virginia
• Virginia Athletics Foundation• University of Virginia Foundation • University of Virginia
Physicians Group• University of Virginia Investment
Management Company• Jefferson Scholars Foundation
The component units’ combined financial information is included in the accompany-ing financial statements. Condensed financial statements for each component unit are disclosed in Note 8. Information on the organization and nature of activities for each component unit is presented below.
The University of Virginia Law School Foundation (Law School Foundation) was established as a tax-exempt organiza-tion to foster the study and teaching of law at the University and to receive and administer funds for that purpose. It expends funds to support professorships, faculty benefits, financial aid, student activities, and other academic programs within the University’s Law School. For additional information, contact the Treasurer’s Office at Slaughter Hall, 580 Massie Road, Charlottesville, VA 22903.
The University of Virginia Darden School Foundation (Darden School Foundation) was established as a nonstock corporation created under the laws of the Common-wealth. Its primary purposes are to promote the advancement and further the aims and purposes of the Colgate Darden Graduate School of Business Administration of the University and to provide education for business executives. For additional information, contact the Finance and Administration Office at P.O. Box 7263, Charlottesville, VA 22906.
The Alumni Association of the University of Virginia (Alumni Association) was established as a legally separate, tax-exempt organization to provide services to all alumni of the University, thereby assisting the University and all its students, faculty, and administration in attaining the University’s highest priority of achieving eminence as a center of higher learning. For additional information, contact the Finance and Administration Office at P.O. Box 400314, Charlottesville, VA 22904.
The Virginia Student Aid Foundation, Inc., T/A Virginia Athletics Foundation (VAF), was established as a tax-exempt organiza-tion to support intercollegiate athletic programs at the University by providing student-athletes the opportunity to achieve academic and athletic excellence. It provides funding for student-athlete scholarships, funding for student-athlete academic advising programs, operational support for various sports, informational services to its members and the general public, and ancillary support to the athletic programs. VAF has adopted December 31 as its year end. All amounts reflected are as of Decem-ber 31, 2013. For additional information, contact the Gift Accounting Office at P.O. Box 400833, Charlottesville, VA 22904.
The University of Virginia Foundation (UVAF), including the University of Virginia Real Estate Foundation, was established as a nonstock corporation under applicable Virginia statutes to provide administrative services to the University and supporting organizations; engage in any and all matters pertaining to real property for the benefit of the University; and use and administer gifts, grants and bequests, and devises for the benefit of the University. For additional information, contact the Financial Services Office at P.O. Box 400218, Charlottesville, VA 22904.
The University of Virginia Physicians Group (UPG) was established as a non-profit group practice health care provider organization designed to assist medical education through teaching and research within the academic environment of the Health System of the University, and to coordinate and develop superior patient care in the Health System. UPG entered into an affiliation agreement with the
NOTES TO FINANCIAL STATEMENTS

25 | FINANCIAL REPORT 2013–14
University for UPG, through its member clinical departments, to provide patient care at the Health System. UPG provides patient care services to Health System patients, and in conjunction with the care of patients, provides teaching services. The University provides space and certain administrative services to UPG, which reimburses the University for the salaries and fringe benefits of classified and hourly employees of the clinical departments paid by the University and not funded by the Commonwealth or by gifts, grants, and contracts. For additional information, contact the Finance Office at 500 Ray C. Hunt Drive, Charlottesville, VA 22903.
The University of Virginia Investment Management Company (UVIMCO) was established to provide investment manage-ment services to the University, independent foundations, and other entities affiliated with the University and operating in support of its mission. For additional information, contact UVIMCO at P.O. Box 400215, Charlottesville, VA 22904.
The Jefferson Scholars Foundation was established to develop and administer a merit-based scholarship, fellowship, and professorship program. The mission of the Jefferson Scholars Foundation is to serve the University by identifying, attracting, and nurturing individuals of extraordinary intellectual range and depth, who possess the highest concomitant qualities of leader-ship, scholarship, and citizenship. For additional information, contact the Finance Team at P.O. Box 400891, Charlottesville, VA 22904.
Reporting Basis and Measurement FocusThe University prepares its financial statements in conformity with U.S. gener-ally accepted accounting principles (U.S. GAAP). As a public institution, the Univer-sity adheres to standards promulgated by the Governmental Accounting Standards Board (GASB). In accordance with GASB Statement No. 34, Basic Financial State-ments—and Management’s Discussion and Analysis—for State and Local Governments, the University has elected to report as an entity engaged in business-type activities. Entities engaged in business-type activities
are financed in whole or in part by fees charged to external parties for goods and services. Statement No. 34 establishes standards for external financial reporting for public colleges and universities.
The accompanying financial statements use the economic resources measurement focus and the full accrual basis of account-ing. Revenues, including all exchange and nonexchange transactions, are recorded when earned and expenses are recorded when incurred and measurable, regardless of when the related cash flows take place. In accordance with GASB requirements, revenues from nonexchange transactions are recognized in the fiscal year in which all eligibility requirements (resource provider conditions) have been satisfied, if measurable and probable of collection.
The component units included herein follow the pronouncements of the Finan-cial Accounting Standards Board (FASB). Their financial statements are presented in accordance with those standards and use the full accrual basis of accounting.
Cash and Cash EquivalentsIn addition to cash on deposit in private bank accounts, petty cash, and undepos-ited receipts, cash and cash equivalents includes cash on deposit with fiscal agents and investments with original maturities of ninety days or less. Substantially all cash and cash equivalents are concen-trated in accounts in which balances exceed Federal Deposit Insurance Corporation (FDIC) insurance limits.
InventoriesInventories, consisting primarily of supplies and merchandise for resale, are valued at the lower of cost (generally determined on the weighted-average method) or market value.
InvestmentsInvestments in corporate stocks and marketable bonds are recorded at market value. All real estate investments are capital assets, and thus recorded at cost. Certain less-marketable investments, such as private equity investments, are generally carried at estimated values as
determined by management. Because of the inherent uncertainty in the use of estimates, values that are based on estimates may differ from the values that would have been used had a ready market existed for the investments.
EndowmentEndowment assets are held in the custody and control of UVIMCO on behalf of the University and the Foundations within a unitized investment pool. The Long-Term Pool (LTP) commingles endowment, charitable trust, and other assets of the University and the Foundations. Assets of the LTP are pooled on a fair value basis in accordance with U.S. GAAP and unitized monthly. Deposits and withdrawals are processed monthly. Each depositor subscribes to or disposes of units on the basis of the value per share at fair value as calculated on the last calendar day of the month in which a deposit or redemp-tion request is received by UVIMCO.
Pledges ReceivableThe University receives pledges and bequests of financial support from corporations, foundations, and individu-als. Revenue is recognized when a pledge representing an unconditional promise to pay is received and all eligibility requirements, including time require-ments, have been met. In the absence of such a promise, revenue is recognized when the gift is received. Endow-ment pledges do not meet eligibility requirements, as defined by GASB requirements, and are not recorded as assets until the related gift is received.
Unconditional promises to give that are expected to be collected in future years are recorded at the present value of the estimated future cash flows. The discounts on these amounts are computed using risk-free interest rates applicable to the years in which the promises are made, commensurate with expected future payments. An allowance for uncollectible pledges receivable is determined based on management’s judgment of potential uncollectible amounts. The determination includes such factors as prior collection history and the type of gift.
NOTES TO FINANCIAL STATEMENTS

26 | FINANCIAL REPORT 2013–14
Capital Assets and DepreciationCapital assets are recorded at cost at date of acquisition, or, if donated, at the appraised value at date of donation. Capital assets are depreciated or amortized on a straight-line basis over their estimated useful lives unless they are inexhaustible, or are intangible assets with indefinite useful lives. The University capitalizes construction costs that have a value or cost in excess of $250,000 at the date of acquisition. Renovations in excess of $250,000 are capitalized if they signifi-cantly extend the useful life of the existing asset. The Academic Division capitalizes moveable equipment at a value or cost of $5,000 and an expected useful life of greater than one year.
The Medical Center capitalizes moveable equipment at a value or cost of $2,000 and an expected useful life of two or more years. Maintenance or renovation expendi-tures of $250,000 or more are capitalized only to the extent that such expenditures prolong the life of the asset or otherwise enhance its capacity to render service.
Expenditures related to construction are capitalized as they are incurred. Projects
that have not been completed as of the date of the Statement of Net Position are classified as Construction in Progress.
Capital assets, such as roads, parking lots, sidewalks, and other non-building struc-tures and improvements, are capitalized as infrastructure and depreciated accordingly.
In accordance with GASB standards, the University capitalizes intangible assets such as computer software developed or obtained for internal use, easements, patents, and trademarks. Capitalization begins when the asset is considered identifiable. For computer software, this is often at the application development stage, which consists of the design, coding, installation, and testing of the software and interfaces.
Interest expense incurred during the construction of capital assets is capitalized, if material, net of interest income earned on resources set aside for this purpose. The University incurred capital project interest expense of $1.6 million and earned capital project interest income of $296,226 for the fiscal year ended June 30, 2014, resulting in net interest capitalized of $1.3 million.
The estimated useful lives of capital assets are as follows:
ASSETS YEARS
Buildings, improvements other than buildings, and infrastructure
10—50
Equipment 1—20
Intangible assets 1—40
Library books 10
CollectionsThe University does not capitalize works of art or historical treasures that are held for exhibition, education, research, and public service. These collections are protected and preserved, neither disposed of for financial gain, nor encumbered in any means. Accord-ingly, such collections are not recognized or capitalized for financial statement purposes.
Deferred Outflows of ResourcesDeferred outflows of resources are the consumption of net assets applicable to a future reporting period and have a positive effect on net position similar to assets.
Unearned RevenueUnearned revenue consists primarily of cash received from grant and contract sponsors that has not been earned under the terms of the agreement, and amounts received in advance of an event, such as student tuition and fees and fees for housing and dining services.
DepositsDeposits held in custody for others represent cash and invested funds held by the University on behalf of others as a result of agency relationships with various groups and organizations.
Compensated AbsencesThe amount of leave earned but not taken by nonfaculty salaried employees is recorded as a liability on the Statement of Net Position. The amount reflects, as of June 30, 2014, all unused vacation leave, and the amount payable on termination under the Common-wealth’s sick leave payout policy. The applicable share of employer-related taxes payable on the eventual termination payments is also included.
Long-term Debt and Debt Issuance CostsLong-term debt on the Statement of Net Position is reported net of related discounts and premiums, which are amortized over the life of the debt. Debt issuance costs, except portions related to prepaid insurance, are expensed as nonoperating expenses.
NOTES TO FINANCIAL STATEMENTS

27 | FINANCIAL REPORT 2013–14
Net PositionThe University’s net position is required to be classified for accounting and report-ing purposes into the following categories:
Net Investment in Capital Assets. This category represents all of the University’s capital assets, net of accumulated deprecia-tion, reduced by outstanding debt attributable to the acquisition, construc-tion, or improvement of those assets.
Restricted. The University classifies the net position resulting from transactions with purpose restrictions as restricted net position until the specific resources are used for the required purpose, or for as long as the provider requires the resources to remain intact.
Nonexpendable. The net position subject to externally imposed restric-tions, which must be retained in perpetuity by the University, is classified as nonexpendable net position. This includes the corpus portion (historical value) of gifts to the University’s permanent endowment funds and certain investment earnings stipulated by the donor to be reinvested.
Expendable. The University’s net position subject to externally imposed restrictions that can be fulfilled by actions of the University pursuant to those restrictions or that expire by the passage of time is classified as expend-able net position. This includes net appreciation of the University’s perma-nent endowment funds that has not been stipulated by the donor to be reinvested permanently.
Unrestricted. The net position that is neither restricted nor invested in capital assets, net of related debt, is classified as unrestricted net position. The University’s unrestricted net position may be designated for specific purposes by the Board. Substan-tially all of the University’s unrestricted net position is allocated for academic and research initiatives or programs, for capital programs, or for other purposes.
Expenses are charged to either restricted or unrestricted net position based on a variety of factors, including consideration of prior
and future revenue sources, the type of expenditure incurred, the University’s budgetary policies surrounding the various revenue sources, and whether the expense is a recurring cost.
Student Tuition and FeesStudent tuition and auxiliary fees are presented net of scholarships, discounts and fellowships applied to student accounts. Scholarship discount and allowance is the difference between the stated charge for goods and services provided by the University and the amount paid by students and/or third parties making payments on the students’ behalf.
Medical Center Sales and ServiceA significant portion of the Medical Center services is rendered to patients covered by Medicare, Medicaid, or other third-party payors. The Medical Center has entered into contractual agreements with these third parties to accept payment for services in amounts less than scheduled charges. In accordance with these agreements, the difference between the contractual payments due and the Medical Center scheduled billing rates results in contrac-tual adjustments. Patient care revenues are reported net of contractual allowances in the Statement of Revenues, Expenses, and Changes in Net Position in the period in which the related services are rendered.
Certain annual settlements of amounts due for Medical Center services covered by third parties are determined through cost reports that are subject to audit and retroactive adjustment by the third parties. Provisions for possible adjustments of cost reports have been estimated and reflected in the accompanying financial statements. Because the determination of settlements in prior years has been based on reasonable estimation, the difference in any year between the originally estimated amount and the final determination is reported in the year of determination as an adjustment to Medical Center revenues. Laws and regu-lations governing Medicare and Medicaid are complex and subject to interpretation.
Revenue and Expense ClassificationsThe University’s policy for defining operating activities as reported on the Statement of Revenues, Expenses, and Changes in Net Position are those that generally result from activities having the characteristics of exchange transactions, meaning revenues are received in exchange for goods and services. Operat-ing revenues include student tuition and fees, net of scholarship discounts and allowances; sales and services from medical centers, net of charity care allowances; educational activities and auxiliary enterprises, net of scholarship discounts and allowances; and federal, state, local, and nongovernmental grants and contracts. With the exception of interest expense and losses on the disposal of capital assets, all expense transactions are classified as operating expenses.
Certain significant revenues relied on and budgeted for fundamental operational support of the core institutional mission of the University are mandated by GASB requirements to be recorded as nonoperat-ing revenues. Nonoperating revenues and expenses include state educational appropriations, state financing appropria-tions, state fiscal stabilization funds, federal Pell grants, private gifts for other than capital purposes, investment income, net unrealized appreciation or deprecia-tion in the fair value of investments, interest expense, and gain or loss on the disposal of assets.
EliminationsCertain auxiliary operations provide goods and services to internal customers. These auxiliary operations include activities such as central stores, the print shop, and other auxiliaries with interdepartmental activi-ties. The net effect of these internal transactions has been eliminated in the Statement of Revenues, Expenses, and Changes in Net Position to avoid inflating revenues and expenses.
Comparative DataThe University presents its financial information on a comparative basis. The basic financial statements include certain
NOTES TO FINANCIAL STATEMENTS

prior-year summarized comparative information in total, but not at the level of detail required for a presentation in conformity with U.S. GAAP. Accordingly, the prior-year information should be read in conjunction with the University’s financial statements as of and for the year ended June 30, 2013, from which the summarized information was derived. Certain amounts from the prior fiscal year have been reclassified to conform to current-year presentation.
New Accounting PronouncementsIn March 2012, the GASB issued State-ment No. 65, Items Previously Reported as Assets and Liabilities, effective for the University’s fiscal year beginning July 1, 2013; however, the University adopted this statement early, effective for the fiscal year beginning July 1, 2012. This statement establishes accounting and financial reporting standards that reclas-sify, as deferred outflows of resources or deferred inflows of resources, certain items that were previously reported as assets and liabilities. The effect of the changes from the implementation of Statement No. 65 on the University’s financial statements for the year ended June 30, 2013, was a decrease to beginning net position of approximately $5.6 million.
In March 2012, the GASB issued Statement No. 66, Technical Corrections—2012—an amendment of GASB Statements No. 10 and No. 62. The objective of this statement is to improve accounting and financial reporting for a governmental financial reporting entity by resolving conflicting guidance that resulted from the issuance of two pronouncements, Statements No. 54, Fund Balance Reporting and Governmental Fund Type Definitions, and No. 62, Codification of Accounting and Financial Reporting Guidance Contained in Pre-November 30, 1989 FASB and AICPA Pronouncements. Statement No. 66 was effective for the University for the year ended June 30, 2014, and did not have a material impact to the University’s financial statements.
In June 2012, the GASB issued Statement No. 68, Accounting and Financial Reporting for Pensions, which requires governments
that participate in defined benefit pension plans to report in their statement of net position a net pension liability, which is the difference between the total pension liability and the assets set aside to pay pension benefits. Statement No. 68 also requires cost-sharing employers to record a liability and expense equal to their proportionate share of the collective net pension liability and expense for the cost-sharing plan. Statement No. 68 is effective for periods beginning after June 15, 2014. The University is currently assessing the impact that implementation of Statement No. 68 will have on the University’s financial statements.
In January 2013, the GASB issued State-ment No. 69, Government Combinations and Disposals of Government Operations, which requires mergers that do not involve an exchange of consideration to be accounted for using the carrying values of assets. Acquisitions are accounted for using acquisition values. The statement also provides guidance on reporting disposals of government operations. It is effective for periods beginning after December 15, 2013. The University is currently assessing the impact that the implementation of Statement No. 69 will have on the University’s financial statements.
In April 2013, the GASB issued Statement No. 70, Accounting and Financial Reporting for Nonexchange Financial Guarantees, which requires a state or local government that extends a nonexchange financial guarantee to recognize a liability when it is more likely than not that the government will make a payment under the guarantee. The statement also requires a government that receives a guarantee on its obligations, and that is required to repay a guarantor for making a payment on a guaranteed obligation or for assuming an obligation, to report a liability until it is legally released as an obligor. Finally, the state-ment requires disclosures by governments that extend or receive nonexchange financial guarantees. Statement No. 70 was effective for the University for the year ended June 30, 2014, and did not have a material impact to the University’s financial statements.
NOTE 2: CASH, CASH EQUIVALENTS, AND INVESTMENTS
Cash The University deposits cash in com-mercial banking accounts collateralized in accordance with the Virginia Security for Public Deposits Act, Section 2.2-4400 et seq., Code of Virginia. The Virginia Security for Public Deposits Act eliminates any custodial risk on the University’s banking deposits. This Act includes a cross guaran-tee among approved financial institutions eligible to hold public funds. In the event of a default of one of the approved financial institutions, an assessment is levied against all participating institutions to cover the uncollateralized public deposits of the defaulting entity. This cross guarantee significantly diminishes custodial credit risk. Amounts on deposit covered by the Virginia Security of Public Deposits Act totaled $72.4 million at June 30, 2014.
Cash EquivalentsThe University maintains an investment policy approved by the Board that governs its investment of operating funds. As part of this policy, the University complies with the provisions set forth in the Investment of Public Funds Act (the Act), Sections 2.2-4500 through 2.2-4518 of the Code of Virginia. It is the policy of the University to comply with the Act when investing tuition and educational fees that are used or required for day-to-day operations, as permitted under the Code of Virginia Section 23-76.1. Authorized investments under the Act include U.S. Treasury and agency securities, corporate debt securities of domestic corporations, asset-backed securities, mortgage-backed securities, AAA-rated obligations of for-eign governments, bankers’ acceptances and bank notes, negotiable certificates of deposit, repurchase agreements, and money market funds.
The University considers all highly liquid investments purchased with a maturity of three months or less to be cash equivalents. Cash equivalents include short-term money market investments in mutual funds, overnight collective funds, or other short-term, highly liquid investments regis-tered as securities held by the University.
28 | FINANCIAL REPORT 2013–14
NOTES TO FINANCIAL STATEMENTS

The short-term investments of the University are valued on a daily basis by the custodian banks. Deposits and with-drawals may be processed daily, except for the portion invested in UVIMCO’s Short-Term Pool (STP), which may be processed weekly.
Restricted cash and cash equivalents totaled $23.0 million and $33.8 million at June 30, 2014, and June 30, 2013, respectively, which is restricted in accordance with applicable debt or other contractual requirements.
RiskRisks disclosed below are direct risks to the University. The risk disclosure does not include indirect risks incurred by investing in the UVIMCO LTP.
Custodial Credit Risk is the risk that, in the event of the failure of a depository financial institution or financial counter-party, the agency will not be able to recover the value of its deposits or investments or recover collateral securities that are in the
possession of an outside third party. The University had an immaterial exposure to custodial credit risk as of June 30, 2014.
Interest Rate Risk results if changes in interest rates adversely affect the fair market value. The longer the duration of an investment, the greater the interest rate risks. Investments subject to interest rate risk at June 30, 2014, are outlined in the accompanying chart.
Credit Risk is the possibility that a loss may occur due to the failure of a counter-party to perform according to the terms of the contract. State law limits the invest-ment of certain nonendowed assets to short-term commercial paper, certificates of deposit, asset-backed securities, and debt obligations to the top rating issued by nationally recognized statistical rating organizations (NRSROs) and requires the investment be rated by at least two NRSROs. For longer-term certificates of deposit and corporate notes, the rating must be one of the top two ratings issued
by two NRSROs. Investments subject to credit risk at June 30, 2014, are outlined in the accompanying chart.
Concentration of Credit Risk is the risk of a large loss attributed to the magnitude of investment in a single issuer of fixed-income securities. The University minimizes this risk by diversifying its investments. As of June 30, 2014, the University does not have investments in any one issuer (excluding investments issued or explicitly guaranteed by the U.S. government and mutual fund or pool investments) representing 5 percent or more of its total investments.
Foreign Currency Risk is the risk that investments denominated in foreign currencies may lose value due to adverse fluctuations in the value of the U.S. dollar relative to foreign currencies. The Univer-sity has no foreign investments or deposits as of June 30, 2014.
29 | FINANCIAL REPORT 2013–14
NOTES TO FINANCIAL STATEMENTS

30 | FINANCIAL REPORT 2013–14
Details of the University’s investment risks are outlined below:
CREDIT QUALITY AND INTEREST RATE RISK (in thousands) INVESTMENT MATURITIES ( IN YEARS )
FAIR VALUE
CREDIT RATING
LESS THAN 1
YEAR
1 - 5 YEARS
6 - 10 YEARS
GREATER THAN 10
YEARS
CASH EQUIVALENTS
Short-term investment pool $ 238,383 Unrated
University of Virginia Aggregate Cash Pool 308,562 Unrated
State Non-Arbitrage Program 1,049 AAAm
TOTAL CASH EQUIVALENTS $ 547,994
INVESTMENTS SUBJECT TO INTEREST RATE RISK
Endowment investments:
Debt securities:
Demand notes due from related foundation, noninterest bearing $ 33,467 Unrated $ 33,467 $ - $ - $ -
U.S. Treasury Obligations 90,588 Aaa 90,588 - - -
Other investments:
Freddie Mac Home Loan 14,733 Aaa 14,733 - - -
Federal Home Loan Mortgage Corporation 31,989 Aaa 31,989 - - -
Federal National Mortgage Association 22,585 Aaa 22,585 - - -
TOTAL INVESTMENTS SUBJECT TO INTEREST RATE RISK $ 193,362 $ 193,362 $ - $ - $ -
100.0% 100.0% 0.0% 0.0% 0.0%
InvestmentsUVIMCO administers and manages the majority of the University’s long-term investments in its unitized LTP. Other operating funds are primarily invested for short periods of time and are managed by the University. The University invests its operating funds with a number of asset managers, including a portion invested in the UVIMCO STP.
UVIMCO’s primary investment objective for the LTP is to maximize long-term real return commensurate with the risk tolerance of the University. To achieve this objective, UVIMCO actively manages its LTP in an attempt to provide a substantial and growing stream of income to support the University’s programs, while at the same time preserving the purchasing power of its long-term investment assets. UVIMCO is governed by a board of directors, three of whom are appointed by the Board and one of whom is appointed by the University’s president. The University receives and monitors periodic reports on the long-term investment policy as executed by UVIMCO.
UVIMCO invests primarily in investment funds that allow the LTP to gain exposure
to a broad array of financial instruments and markets. UVIMCO classifies LTP investments as public equity, long/short equity, buyout, venture capital, real estate, resources, or marketable alternatives and credit according to the investment strategy of the underlying manager. These invest-ments are subject to a variety of risks, including market risk, manager risk, and liquidity risk. UVIMCO closely manages and monitors its exposure to these risks, which may be influenced by a number of factors, including the size, composition, and diversification of positions held, fund manager actions, and market volatility.
In the normal course of business, UVIMCO’s external investment fund managers trade various financial instru-ments and enter into investment activities subject to various market risks. Market risk is the risk that the value of assets such as common stocks may fall. Fixed-income investments are subject to other market risks, including interest rate and credit risk. Foreign investments are subject to currency exchange rates (foreign exchange risk), political and economic developments, limited legal recourse, and market risks.
The prices of derivative positions such as futures, options, warrants, and swap contracts may move in unexpected ways due to the use of leverage or other factors, especially in unusual market conditions, and may result in increased volatility.
Manager risk includes tracking error or active positions away from the benchmark, operational or business risks, a lack of transparency, and leverage. UVIMCO mitigates manager risk through extensive due diligence, diversification, by declining certain partnership structures, and by avoiding certain investment strategies (e.g., highly leveraged hedge funds). UVIMCO’s investment fund managers often limit the liquidity of their funds, resulting in liquidity risk for the LTP. UVIMCO manages liquidity risk by maintaining a portfolio of Treasury bills and bonds, maintaining sufficient liquidity with public equity and hedge fund managers, and managing the pace of commitments to private investments.
Biannual distributions are made from the University’s endowment to departments holding endowment accounts. The Uni-
NOTES TO FINANCIAL STATEMENTS

31 | FINANCIAL REPORT 2013–14
versity’s endowment spending policy ties annual increases to inflation as defined by the Higher Education Price Index. The cur-rent inflation factor in use by the University is 2.4 percent. If the increase causes the endowment distribution to fall outside a range defined as 4.0 percent to 6.0 percent of the market value of the endowment, then the Finance Committee of the Board
may recommend increasing or decreasing the spending rate. For fiscal year 2014, the spending distribution of $164.1 million, excluding agency, equaled 4.95 percent of the fiscal year 2012 ending market value. Since the result fell within the range, no further action by the Board was needed. The market value of the endowment invested in the LTP at June 30, 2014, was $4.1 billion.
At June 30, 2014, the University’s investment in the LTP was $5.4 billion, representing 85 percent of the University’s invested assets. At June 30, 2014, the University’s short-term investments were $180.3 million, representing 2.8 percent of invested assets. These pools are not rated by NRSROs.
For the year ended June 30, 2014, the University had the following endowment-related activities:
SUMMARY OF ENDOWMENT ACTIVITY (in thousands) TYPE OF ENDOWMENT FUND
DONOR-RESTRICTED QUASI TRUSTS AGENCY TOTAL
Investment earnings $ 296,255 $ 334,085 $ 11,414 $ 2,727 $ 644,481
Contributions to permanent endowment 11,738 - - - 11,738
Other gifts - - 3,036 - 3,036
Spending distribution (77,359) (86,745) - (515) (164,619)
Transfers in (out)* 2,447 34,230 (5,155) 226 31,748
TOTAL CHANGE IN ENDOWMENT FUNDS $ 233,081 $ 281,570 $ 9,295 $ 2,438 $ 526,384
* Transfers into donor-restricted endowments include donor-directed income capitalizations, and transfers out of trusts include payments to income beneficiaries.
NOTE 3: STATEMENT OF NET POSITION DETAILS
a. Accounts receivable: The composition of accounts receivable at June 30, 2014, is summarized as follows:
ACCOUNTS RECEIVABLE (in thousands)
Patient care $ 545,207
Grants and contracts 29,198
Student payments 21,130
Pledges 2,995
Institutional loans 817
Build America Bonds rebate 898
Equipment Trust Fund reimbursement 12,869
Auxiliary 1,516
Related foundation 15,098
Other 33,765
Less: Allowance for doubtful accounts (394,066)
TOTAL ACCOUNTS RECEIVABLE $ 269,427
b. Notes receivable: The principal repay-ment and interest rate terms of federal and University loans vary considerably. The allowance for doubtfully collectible notes only applies to University-funded notes and the University portion of federal student loans, as the University is not obligated to fund the federal portion of uncollected student loans. Federal loan programs are funded principally with federal advances to the University under the Perkins and various other loan pro-grams. The composition of notes receivable at June 30, 2014, is summarized in the table on the following page.
NOTES TO FINANCIAL STATEMENTS

32 | FINANCIAL REPORT 2013–14
NOTES TO FINANCIAL STATEMENTS
NOTES RECEIVABLE (in thousands)
Perkins $ 19,581
Nursing 1,054
Institutional 20,178
Fraternity loan 2,308
House Staff loan 8
Less: Allowance for doubtful accounts (1,480)
Total notes receivable, net 41,649
Less: Current portion, net of allowance (5,985)
TOTAL NONCURRENT NOTES RECEIVABLE $ 35,664
c. Pledges: As discussed in Note 1, permanent endowment pledges do not meet eligibility requirements, as defined by GASB requirements, until the related gift is received. Accordingly, permanent endowment pledges totaling $16.2 million and $2.7 million at June 30, 2014, and June 30, 2013, respectively, are not recognized as assets in the accompanying financial
statements. In addition, bequest intentions and other conditional promises are not recognized as assets until the specified conditions are met because of uncertain-ties with regard to their realizability and valuation. The composition of pledges receivable at June 30, 2014, is summarized as follows:
PLEDGES RECEIVABLE (in thousands)
GIFT PLEDGES OUTSTANDING
Operations $ 3,292
Capital 5,400
TOTAL GIFT PLEDGES OUTSTANDING 8,692
Less:
Allowance for uncollectible pledges (763)
Unamortized discount to present value (563)
Total pledges receivable, net 7,366
Less: Current portion, net of allowance (2,800)
TOTAL NONCURRENT PLEDGES RECEIVABLE $ 4,566

33 | FINANCIAL REPORT 2013–14
d. Capital assets: The capital assets activity for the year ended June 30, 2014, is summarized as follows:
CAPITAL ASSETS (in thousands) BEGINNING BALANCE
JULY 1, 2013
INCREASES DECREASES ENDING BALANCE
JUNE 30, 2014
NONDEPRECIABLE CAPITAL ASSETS
Land $ 49,226 $ 40,053 $ (34,416) $ 54,863
Construction in progress 297,277 232,111 (243,731) 285,657
Software in development - 724 - 724
TOTAL NONDEPRECIABLE CAPITAL ASSETS 346,503 272,888 (278,147) 341,244
DEPRECIABLE CAPITAL ASSETS
Buildings 3,227,426 182,662 (5,872) 3,404,216
Equipment 733,284 67,995 (40,127) 761,152
Infrastructure 407,586 38,180 - 445,766
Improvements other than buildings 156,076 3,007 - 159,083
Capitalized software 158,156 6,904 (310) 164,750
Library books 116,633 5,055 (1,167) 120,521
Total depreciable capital assets 4,799,161 303,803 (47,476) 5,055,488
Less: Accumulated depreciation for:
Buildings (1,080,499) (103,009) 5,822 (1,177,686)
Equipment (497,324) (60,930) 35,785 (522,469)
Infrastructure (168,229) (12,842) - (181,071)
Improvements other than buildings (104,318) (6,470) - (110,788)
Capitalized software (100,379) (13,980) - (114,359)
Library books (96,986) (4,568) 1,167 (100,387)
Total accumulated depreciation (2,047,735) (201,799) 42,774 (2,206,760)
TOTAL DEPRECIABLE CAPITAL ASSETS, NET 2,751,426 102,004 (4,702) 2,848,728
TOTAL CAPITAL ASSETS, NET $ 3,097,929 $ 374,892 $ (282,849) $ 3,189,972
e. Goodwill: In July 2004, the Medical Center purchased Virginia Ambulatory Surgery Center, now known as Virginia Outpatient Surgery Center. As a result of the purchase, the Medical Center recorded $6.9 million of goodwill to be amortized over a period of forty years.
In November 2004, the Medical Center purchased Amherst and Lynchburg renal
facilities. As a result of the purchase, the Medical Center recorded goodwill of $3.4 million and $4.0 million, respectively. The goodwill is to be amortized over a period of twenty years.
f. Deferred outflows of resources: The composition of deferred outflows of resources at June 30, 2014, is summa-rized as follows:
DEFERRED OUTFLOWS OF RESOURCES (in thousands)
Interest rate swap derivative $ 20,448
Deferred loss on early retirement of debt 14,660
TOTAL DEFERRED OUTFLOWS OF RESOURCES $ 35,108
NOTES TO FINANCIAL STATEMENTS
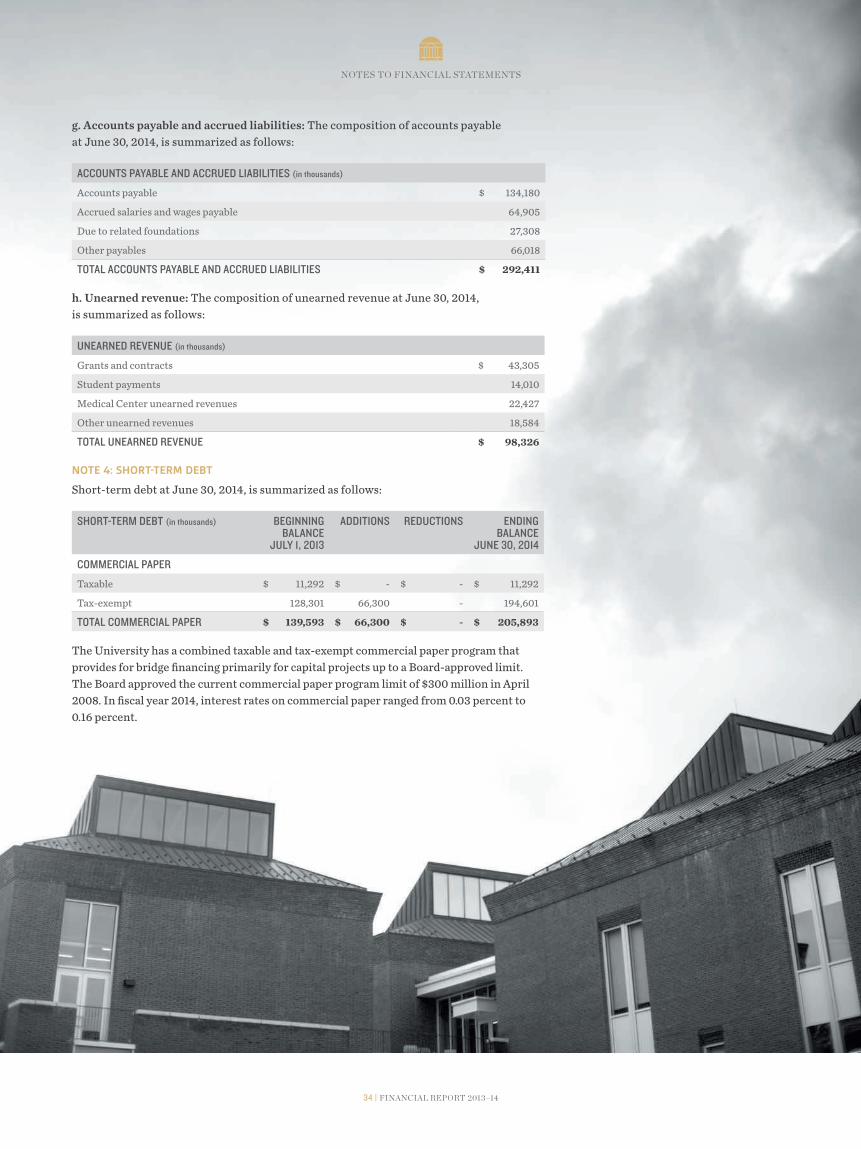
34 | FINANCIAL REPORT 2013–14
g. Accounts payable and accrued liabilities: The composition of accounts payable at June 30, 2014, is summarized as follows:
ACCOUNTS PAYABLE AND ACCRUED LIABILITIES (in thousands)
Accounts payable $ 134,180
Accrued salaries and wages payable 64,905
Due to related foundations 27,308
Other payables 66,018
TOTAL ACCOUNTS PAYABLE AND ACCRUED LIABILITIES $ 292,411
h. Unearned revenue: The composition of unearned revenue at June 30, 2014, is summarized as follows:
UNEARNED REVENUE (in thousands)
Grants and contracts $ 43,305
Student payments 14,010
Medical Center unearned revenues 22,427
Other unearned revenues 18,584
TOTAL UNEARNED REVENUE $ 98,326
NOTE 4: SHORT-TERM DEBT
Short-term debt at June 30, 2014, is summarized as follows:
SHORT-TERM DEBT (in thousands) BEGINNING BALANCE
JULY 1, 2013
ADDITIONS REDUCTIONS ENDING BALANCE
JUNE 30, 2014
COMMERCIAL PAPER
Taxable $ 11,292 $ - $ - $ 11,292
Tax-exempt 128,301 66,300 - 194,601
TOTAL COMMERCIAL PAPER $ 139,593 $ 66,300 $ - $ 205,893
The University has a combined taxable and tax-exempt commercial paper program that provides for bridge financing primarily for capital projects up to a Board-approved limit. The Board approved the current commercial paper program limit of $300 million in April 2008. In fiscal year 2014, interest rates on commercial paper ranged from 0.03 percent to 0.16 percent.
NOTES TO FINANCIAL STATEMENTS

35 | FINANCIAL REPORT 2013–14
NOTE 5: LONG-TERM OBLIGATIONS
a. Long-term debt: The composition of long-term debt at June 30, 2014, is summarized as follows:
LONG-TERM DEBT (in thousands) INTEREST RATES
FINAL MATURITY
BEGINNING BALANCE
JULY 1, 2013
ADDITIONS REDUCTIONS ENDING BALANCE
JUNE 30, 2014
CURRENT PORTION
BONDS AND NOTES PAYABLE
Revenue bonds:
University of Virginia Series 2003A (9d) 0.05% to 0.27% 2034 $ 78,639 $ - $ - $ 78,639 $ -
University of Virginia Series 2005 (9d) 4.0% to 5.0% 2037 39,350 - 3,345 36,005 3,520
University of Virginia Series 2008 (9d) 5.0% 2040 231,365 - - 231,365 -
University of Virginia Series 2009 (9d) 4.48%* 2040 250,000 - - 250,000 -
University of Virginia Series 2010 (9d) 3.61%** 2041 190,000 - - 190,000 -
University of Virginia Series 2011 (9d) 4.0% to 5.0% 2033 73,950 - 2,325 71,625 2,435
University of Virginia Series 2013A (9d) 2.0% to 5.0% 2043 168,830 - 530 168,300 535
University of Virginia Series 2013B (9d) 5.0% 2037 61,595 - - 61,595 -
Commonwealth of Virginia bonds (9c) 3.8% to 9.3% 2021 7,789 3,107 5,048 5,848 1,500
Notes payable to VCBA 2004B (9d) 3.0% to 5.0% 2020 28,100 - 4,820 23,280 5,065
Notes payable to VCBA 2007B (9d) 4.0% to 4.25% 2020 10,650 - 30 10,620 30
Notes payable to VCBA 2010B (9d) 2.0% to 5.0% 2021 3,435 - - 3,435 -
Other various 2029 153 3,004 176 2,981 218
TOTAL BONDS AND NOTES PAYABLE $ 1,143,856 $ 6,111 $ 16,274 $ 1,133,693 $ 13,303
Less: Current portion of debt (12,814) (489) - (13,303)
Bond premium 60,125 412 2,714 57,823
NET LONG-TERM DEBT $ 1,191,167 $ 6,034 $ 18,988 $ 1,178,213
* The University of Virginia Series 2009 (9d) revenue bonds are Build America Bonds, issued at 6.2%. The University receives an interest credit from the United States Treasury for a portion of the interest it pays on the bonds. On issuance of the bonds, the University received an interest credit of 35%. This amount has been reduced as noted in the footnote below. With the current credit, the effective interest rate on the bonds is reduced to 4.48%.
** The University of Virginia Series 2010 (9d) revenue bonds are Build America Bonds, issued at 5.0%. The University receives an interest credit from the United States Treasury for a portion of the interest it pays on the bonds. On issuance of the bonds, the University received an interest credit of 35%. This amount has been reduced as noted in the footnote below. With the current credit, the effective interest rate on the bonds is reduced to 3.61%.
On April 16, 2014, the Commonwealth of Virginia, on behalf of the University of Vir-ginia, issued General Obligation Refunding Bonds Series 2014B in the amount of $3.1 million to refund $3.4 million of General Obligation Bonds Series 2004B. The refund-ing reduced the aggregate debt service by $301,494, representing a net present value savings of $294,712. The bonds were issued with a premium of $411,432 and an account-ing loss of $125,468.
The University of Virginia has three revolving credit agreements from three different banks in the aggregate amount of $250 million to provide liquidity for its variable-rate debt obligations. There were no advances outstanding under any credit agreements as of June 30, 2014.
Maturities and interest on notes and bonds payable for the next five years and in subsequent five-year periods are as follows:
MATURITIES (in thousands) PRINCIPAL INTEREST BUILD AMERICA BONDS
INTEREST REBATE
NET INTEREST EXPENSE
2015* $ 13,303 $ 54,851 $ (8,120) $ 46,731
2016 14,043 54,221 (8,120) 46,101
2017 13,373 53,631 (8,120) 45,511
2018 13,978 53,077 (8,120) 44,957
2019 13,015 52,522 (8,120) 44,402
2020–24 47,444 255,156 (40,600) 214,556
2025–29 25,443 247,097 (40,600) 206,497
2030–34 103,749 240,327 (40,600) 199,727
2035–39 281,075 214,286 (40,600) 173,686
2040–43 608,270 43,517 (7,146) 36,371
TOTAL $ 1,133,693 $ 1,268,685 $ (210,146) $ 1,058,539
* FY2015 represents a 7.2% reduction in the credit interest payment for September 1, 2014. The sequestration reduction rate will be applied to all future years unless and until a law is enacted that cancels or otherwise impacts the sequester, at which time the sequestration reduction rate is subject to change.
NOTES TO FINANCIAL STATEMENTS

36 | FINANCIAL REPORT 2013–14
Prior-year Refundings. In the previous fiscal year, bonds were issued to refund a portion of previously outstanding bonds. Funds relating to the refunding were deposited into an irrevocable trust with
an escrow agent to provide for future debt service payments on the refunded bonds. The trust account assets and liabilities for the defeased bonds are not included in the University’s financial statements. At June
30, 2014, the outstanding balance of the prior year’s in-substance defeased bonds and accrued interest totaled $73.1 million.
b. Long-term liabilities: The composition of long-term liabilities at June 30, 2014, is summarized as follows:
LONG-TERM LIABILITIES (in thousands) BEGINNING BALANCE JULY 1, 2013
ADDITIONS REDUCTIONS ENDING BALANCE JUNE 30, 2014
Investments held for related entities $ 15,347 $ 3,708 $ 1,534 $ 17,521
Accrual for compensated absences 63,717 86,738 82,705 67,750
Perkins loan program 12,563 - - 12,563
Investment in Culpeper Regional Hospital 33,455 1,211 11,269 23,397
Other postemployment benefits 34,706 5,975 - 40,681
Other 43,151 15,221 15,856 42,516
Total 202,939 112,853 111,364 204,428
Less: Current portion of long-term liabilities (98,096) - (6,035) (92,061)
NET LONG-TERM LIABILITIES $ 104,843 $ 112,853 $ 105,329 $ 112,367
NOTE 6: DERIVATIVES
At June 30, 2014, the University had two fixed-payer interest rate swaps totaling $100 million in notional amount. The swaps are used as cash flow hedges by the University to provide a hedge against changes in interest rates on a similar amount of the University’s variable-rate debt. The University’s objective is to hedge the cash flow variability of a portion of its variable-rate debt. The underlying index for the swaps is the Securities Industry and Financial Markets (SIFMA) Municipal Swap Index. The swaps were entered into in January 2007 and February 2007 and both swaps mature June 1, 2038. The swaps were entered into at a zero market value and no payments were made or received when they were initiated. As of June 30, 2014, the $100 million notional amount of swaps outstand-ing had a negative market value, net of any posted collateral and netting agreements, of approximately $20.4 million, which represents the amount the University would pay if the swaps were terminated on that date. The market value of the swaps has fallen by approximately $1.7 million over the reporting period. The fair value was determined by using the quoted SIFMA index curve at the time of market valuation.
In February 2011, the University entered into an interest-sharing arrangement with UVAF. Under the arrangement, UVAF agreed to make five annual fixed-premium
payments to the University in exchange for limited financial support in the event the one-month London Interbank Offered Rate (LIBOR) falls within a certain range. The arrangement is for a notional amount of $50 million and expires on February 1, 2016, and may be terminated at any time by the mutual consent of the University and UVAF. As of June 30, 2014, the market value of the interest-sharing arrange-ment between the University and UVAF, representing the amount the University would receive if the arrangement were terminated, was approximately $364,000.
RiskThe use of derivatives may introduce certain risks for the University, including the following:
Credit risk is the risk that a counterparty will not settle an obligation in full, either when due or at any time thereafter. The University would be exposed to the credit risk of its swap counterparties any time the swaps had a positive market value. At June 30, 2014, the University had no credit risk related to its swaps. As of June 30, 2014, the University’s swap counterparties were rated at least A- from Standard & Poor’s or A3 by Moody’s Investors Service. To mitigate credit risk, the University limits market value exposure and requires the posting of collateral based on the credit rating of the counterparty. As of June
30, 2014, no collateral was required to be posted by the counterparties.
Interest rate risk is the risk that an unexpected change in interest rates will negatively affect the collective value of a hedge and a hedged item. When viewed collectively, the hedges and the hedged item are subject to interest rate risk in that a change in interest rate will impact the collective market value of both the hedge and hedged item. Conversely, the collective effect of the hedges and the hedged item serve to reduce cash flow variability caused by changes in interest rates.
Basis risk arises when different indexes are used in connection with a derivative resulting in the hedge and hedged item not experiencing price changes in entirely opposite directions from each other. The University’s swaps are deemed to be effective hedges of its variable-rate debt with an amount of basis risk that is within the guidelines for establishing hedge effectiveness.
Termination risk arises when the unsched-uled termination of a derivative could have an adverse effect on the University’s strat-egy or could lead to potentially significant unscheduled payments. The University’s derivative contracts use the International Swap Dealers Association Master Agree-ment (the Master Agreement), which includes standard termination events,
NOTES TO FINANCIAL STATEMENTS

37 | FINANCIAL REPORT 2013–14
such as failure to pay and bankruptcy. The Schedule to the Master Agreement includes an additional termination event. That is, the swap may be terminated by either party if the counterparty’s credit rating falls below BBB/Baa2 in the case of Standard & Poor’s and Moody’s Investors Service, respectively. The University or the counterparty may also terminate the swap if the other party fails to perform under the terms of the contract. If at the time of termination the swap has a negative market value, the University would be liable to the counterparty for a payment equal to the swaps’ market value.
Rollover risk arises when a derivative associated with a hedged item does not extend all the way to the maturity date of the hedged item, thereby creating a gap in the protection otherwise afforded by the derivative. The University’s hedges serve to hedge all $78.6 million of its variable-rate Series 2003A Bonds maturing in June 2034. The remaining $21.4 million of hedges serve to hedge the University’s outstanding commercial paper, which may have various maturities of no greater than 270 days each.
Market-access risk arises when an entity enters into a derivative in anticipation of entering the credit market at a later date, but is ultimately prevented from doing so. The University’s derivatives have no market-access risk.
Foreign currency risk is the risk of a hedge’s value changing due to changes in currency exchange rates. The University’s derivatives have no foreign currency risk.
Future net cash flows for these hedging derivatives for the next five years and in subsequent five-year periods are as follows:
NOTES TO FINANCIAL STATEMENTS
MATURITIES (in thousands) PRINCIPAL VARIABLE INTEREST
DERIVATIVE INSTRUMENTS,
NET
TOTAL
2015 $ - $ 115 $ 3,995 $ 4,110
2016 - 115 3,995 4,110
2017 - 115 3,995 4,110
2018 - 115 3,995 4,110
2019 - 115 3,995 4,110
2020–24 - 573 19,977 20,550
2025–29 - 573 19,977 20,550
2030–34 78,639 478 16,701 95,818
2035–39 21,361 98 3,414 24,873
TOTAL $ 100,000 $ 2,297 $ 80,044 $ 182,341

38 | FINANCIAL REPORT 2013–14
NOTE 7: AFFILIATED COMPANIES
Culpeper Regional HospitalOn December 31, 2008, the Medical Center and Culpeper Regional Hospital entered into a partnership agreement, whereby the Medical Center obtained a 49 percent interest in Culpeper Regional Hospital, with a $41.2 million investment. The Medical Center uses the equity method of consolidation to reflect the Medical Center’s investment in Culpeper Regional Hospital.
Central Virginia Health Network, Inc.In May 1995, the Medical Center joined the Central Virginia Health Network, Inc. (CVHN), a partnership of eight Richmond-area hospitals. CVHN was formed to provide an efficient and coordinated continuum of care, with services ranging from acute hospital treatment to primary physician care and home health services.
The Medical Center originally paid $100 for 10,000 shares of common stock and $109,900 as additional paid-in capital. In addition, the Medical Center is obligated for monthly dues to CVHN of $15,913. Complete financial statements can be obtained from the registered agent: Steven D. Gravely, Esq., Mezzullo and McCandlish, P.O. Box 796, Richmond, VA 23206.
University of Virginia / HEALTHSOUTH, LLCThe Medical Center entered into a joint venture with HEALTHSOUTH Corpora-
tion to establish an acute rehabilitation facility, located at the Fontaine Research Park in Charlottesville, Virginia, to provide patient services to the region. The Medical Center made a capital contribution of $2.2 million to the joint venture in May 1996, which represents a 50 percent interest. Complete financial statements can be obtained from the managing member: HEALTHSOUTH Corporation, 7700 East Parham Road, Richmond, VA 23294.
Valiance Health, LLCIn November 1997, the Medical Center became a participant with Rockingham Memorial Hospital and Augusta Health Care, Inc., in Valiance Health, LLC (Valiance), a joint venture integrating and coordinating the delivery of health care services in central and western Virginia. The Medical Center contributed $100,000 in initial capital, which entitles it to a pro rata distribution of any profits and losses of Valiance. As of June 30, 2014, the Medi-cal Center’s investment totaled $500,000.
University Health System Consortium In December 1986, the Medical Center became a member of the University Health System Consortium (UHC). Founded in 1984, UHC is an alliance of the clinical enterprises of academic health centers. While focusing on the clinical mission, UHC is mindful of and supports the research and education missions. The mission of UHC is to advance knowledge, foster collaboration, and promote change to help members compete in their respective health care
markets. In keeping with this mission, UHC helps members pool resources, create economies of scale, improve clinical and operating efficiencies, and influence the direction and delivery of health care. Accordingly, UHC is organized and operated on a cooperative basis for the benefit of its patron-member health systems.
UHC is a not-for-profit organization. It is incorporated as a nonstock corporation and designated as a nonexempt cooperative that is taxable under Subchapter T, Section 1382-1388, of the Internal Revenue Code. As such, UHC’s bylaws provide for distribu-tions of patronage dividends to its patrons. This allocation is based on the value of business done with or for each patron by UHC. The Medical Center records the portion of the patronage dividends that were held by UHC as patronage equity.
Charlottesville Program of All-Inclusive Care for the ElderlyThe Medical Center contributed $245,000 for a 24.5 percent investment in the Charlottesville Program of All-Inclusive Care for the Elderly (PACE). The program delivers various medical and support services to senior residents in Charlottesville and surrounding counties. Patients in the program have an alternative to residential nursing home care providing daily access to doc-tors and physical therapists, home health care, and personal care. Charlottesville PACE financial transactions are recorded using the equity method of accounting.
INVESTMENT IN AFFILIATED COMPANIES (in thousands) as of June 30, 2014
COMMON STOCK AND EQUITY
CONTRIBUTIONS
SHARE OF ACCUMULATED
INCOME (LOSS)
NET INVESTMENT
Culpeper Regional Hospital $ 41,248 $ 6,237 $ 47,485
Central Virginia Health Network, Inc.
233 (41) 192
HEALTHSOUTH, LLC - 12,841 12,841
Valiance, LLC - 249 249
University Health System Consortium
- 552 552
PACE Equity 245 - 245
NOTES TO FINANCIAL STATEMENTS
39 | FINANCIAL REPORT 2013–14
HealthCare Partners, Inc.In May 1995, HealthCare Partners, Inc., a nonstock, nonprofit corporation, was established to support networking, external business relationships with neighboring hospitals and physicians groups, and expansion of primary care activities. The Medical Center and UPG are the primary contributors to the funding of the corporation. The corpora-tion is governed by a board of directors composed of Medical Center staff, UPG representatives, community members, and University Board appointees.
NOTES TO FINANCIAL STATEMENTS

40 | FINANCIAL REPORT 2013–14
NOTE 8: COMPONENT UNITS
Summary financial statements and additional disclosures for the University’s discretely presented component units are presented below.
STATEMENT OF FINANCIAL POSITION (in thousands) as of June 30, 2014
UNIVERSITY OF VIRGINIA
LAW SCHOOL FOUNDATION
UNIVERSITY OF VIRGINIA
DARDEN SCHOOL
FOUNDATION
ALUMNI ASSOCIATION
OF THE UNIVERSITY OF VIRGINIA
JEFFERSON SCHOLARS
FOUNDATION
VIRGINIA ATHLETICS
FOUNDATION*
UNIVERSITY OF VIRGINIA
FOUNDATION
UNIVERSITY OF VIRGINIA PHYSICIANS
GROUP
UNIVERSITY OF VIRGINIA
INVESTMENT MANAGEMENT
COMPANY
ELIMINATIONS COMPONENT UNITS TOTAL
ASSETS
Current assets
Total current assets $ 31,872 $ 40,653 $ 24,557 $ 15,606 $ 16,968 $ 5,293 $ 94,009 $ 291,285 $ - $ 520,243
Noncurrent assets
Long-term investments 406,406 281,943 272,107 292,528 65,793 105,886 210,919 6,761,766 (1,241,316) 7,156,032
Capital assets, net and other assets
20,736 75,049 9,355 36,509 13,835 242,866 65,182 146 - 463,678
Total noncurrent assets 427,142 356,992 281,462 329,037 79,628 348,752 276,101 6,761,912 (1,241,316) 7,619,710
TOTAL ASSETS $ 459,014 $ 397,645 $ 306,019 $ 344,643 $ 96,596 $ 354,045 $ 370,110 $ 7,053,197 $ (1,241,316) $ 8,139,953
LIABILITIES AND NET ASSETS
Current liabilities
Total current liabilities $ 442 $ 6,164 $ 96,881 $ 8,577 $ 1,052 $ 39,544 $ 128,005 $ 3,265 $ - $ 283,930
Noncurrent liabilities
Long-term debt, net of current portion of $30,889
- 16,408 - 22,500 - 162,445 35,036 - - 236,389
Other noncurrent liabilities 563 - 2,984 19,055 268 43,359 100,379 7,032,756 (1,241,316) 5,958,048
Total noncurrent liabilities 563 16,408 2,984 41,555 268 205,804 135,415 7,032,756 (1,241,316) 6,194,437
TOTAL LIABILITIES $ 1,005 $ 22,572 $ 99,865 $ 50,132 $ 1,320 $ 245,348 $ 263,420 $ 7,036,021 $ (1,241,316) $ 6,478,367
NET ASSETS
Unrestricted $ 62,532 $ 95,855 $ 66,945 $ (12,164) $ 32,147 $ 23,039 $ 106,575 $ 17,176 $ - $ 392,105
Temporarily restricted 255,323 136,830 90,337 125,577 29,791 70,882 115 - - 708,855
Permanently restricted 140,154 142,388 48,872 181,098 33,338 14,776 - - - 560,626
TOTAL NET ASSETS 458,009 375,073 206,154 294,511 95,276 108,697 106,690 17,176 - 1,661,586
TOTAL LIABILITIES AND NET ASSETS $ 459,014 $ 397,645 $ 306,019 $ 344,643 $ 96,596 $ 354,045 $ 370,110 $ 7,053,197 $ (1,241,316) $ 8,139,953
* December 31, 2013, year-end
NOTES TO FINANCIAL STATEMENTS
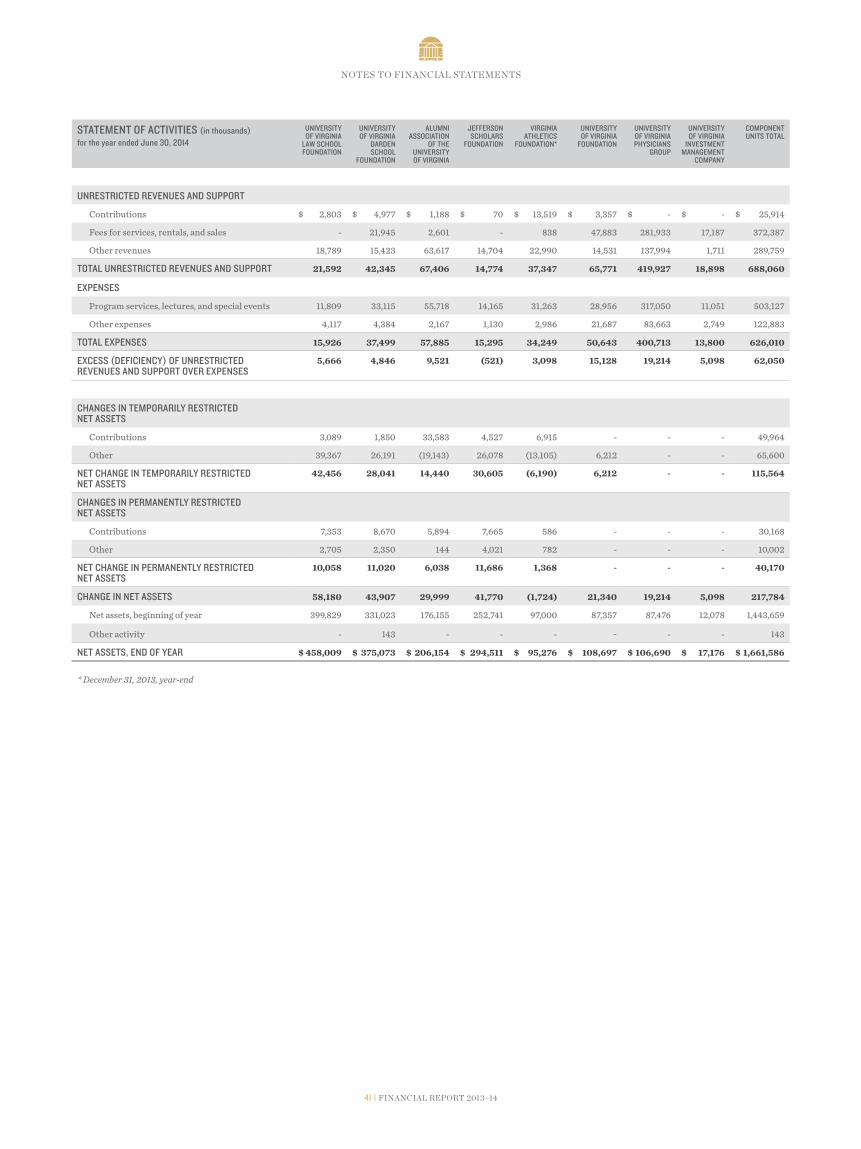
41 | FINANCIAL REPORT 2013–14
STATEMENT OF ACTIVITIES (in thousands) for the year ended June 30, 2014
UNIVERSITY OF VIRGINIA
LAW SCHOOL FOUNDATION
UNIVERSITY OF VIRGINIA
DARDEN SCHOOL
FOUNDATION
ALUMNI ASSOCIATION
OF THE UNIVERSITY OF VIRGINIA
JEFFERSON SCHOLARS
FOUNDATION
VIRGINIA ATHLETICS
FOUNDATION*
UNIVERSITY OF VIRGINIA
FOUNDATION
UNIVERSITY OF VIRGINIA PHYSICIANS
GROUP
UNIVERSITY OF VIRGINIA
INVESTMENT MANAGEMENT
COMPANY
COMPONENT UNITS TOTAL
UNRESTRICTED REVENUES AND SUPPORT
Contributions $ 2,803 $ 4,977 $ 1,188 $ 70 $ 13,519 $ 3,357 $ - $ - $ 25,914
Fees for services, rentals, and sales - 21,945 2,601 - 838 47,883 281,933 17,187 372,387
Other revenues 18,789 15,423 63,617 14,704 22,990 14,531 137,994 1,711 289,759
TOTAL UNRESTRICTED REVENUES AND SUPPORT 21,592 42,345 67,406 14,774 37,347 65,771 419,927 18,898 688,060
EXPENSES
Program services, lectures, and special events 11,809 33,115 55,718 14,165 31,263 28,956 317,050 11,051 503,127
Other expenses 4,117 4,384 2,167 1,130 2,986 21,687 83,663 2,749 122,883
TOTAL EXPENSES 15,926 37,499 57,885 15,295 34,249 50,643 400,713 13,800 626,010
EXCESS (DEFICIENCY) OF UNRESTRICTED REVENUES AND SUPPORT OVER EXPENSES
5,666 4,846 9,521 (521) 3,098 15,128 19,214 5,098 62,050
CHANGES IN TEMPORARILY RESTRICTED NET ASSETS
Contributions 3,089 1,850 33,583 4,527 6,915 - - - 49,964
Other 39,367 26,191 (19,143) 26,078 (13,105) 6,212 - - 65,600
NET CHANGE IN TEMPORARILY RESTRICTED NET ASSETS
42,456 28,041 14,440 30,605 (6,190) 6,212 - - 115,564
CHANGES IN PERMANENTLY RESTRICTED NET ASSETS
Contributions 7,353 8,670 5,894 7,665 586 - - - 30,168
Other 2,705 2,350 144 4,021 782 - - - 10,002
NET CHANGE IN PERMANENTLY RESTRICTED NET ASSETS
10,058 11,020 6,038 11,686 1,368 - - - 40,170
CHANGE IN NET ASSETS 58,180 43,907 29,999 41,770 (1,724) 21,340 19,214 5,098 217,784
Net assets, beginning of year 399,829 331,023 176,155 252,741 97,000 87,357 87,476 12,078 1,443,659
Other activity - 143 - - - - - - 143
NET ASSETS, END OF YEAR $ 458,009 $ 375,073 $ 206,154 $ 294,511 $ 95,276 $ 108,697 $ 106,690 $ 17,176 $ 1,661,586
* December 31, 2013, year-end
NOTES TO FINANCIAL STATEMENTS

42 | FINANCIAL REPORT 2013–14
Pledges ReceivableUnconditional promises to give (pledges) are recorded as receivables and revenues and are assigned to net asset categories based on the presence or absence of donor-imposed restrictions. Pledges expected to
be collected within one year are recorded at net realizable value. Pledges that are expected to be collected in future years are recorded at the net present value of their estimated future cash flows. The discounts on these amounts are computed using risk-free interest rates applicable to the
years in which the promise was received and then remain consistent throughout the pledge’s life. The component units record an allowance against pledges receivable for estimated uncollectible amounts. UPG does not accept gifts. Unconditional prom-ises to give at June 30, 2014, are as follows:
PLEDGES RECEIVABLE (in thousands) as of June 30, 2014
UNIVERSITY OF VIRGINIA
LAW SCHOOL FOUNDATION
UNIVERSITY OF VIRGINIA
DARDEN SCHOOL
FOUNDATION
ALUMNI ASSOCIATION
OF THE UNIVERSITY OF VIRGINIA
JEFFERSON SCHOLARS
FOUNDATION
VIRGINIA ATHLETICS
FOUNDATION*
COMPONENT UNITS TOTAL
Total pledges receivable $ 10,770 $ 20,019 $ 8,359 $ 18,227 $ 24,346 $ 81,721
Less:
Allowance for uncollectible accounts
(519) (1,769) (935) (1,035) (3,390) (7,648)
Unamortized discount to present value
(289) (2,234) (275) (667) (117) (3,582)
Total pledges receivable, net 9,962 16,016 7,149 16,525 20,839 70,491
Less: Current portion, net of allowance
(4,324) (7,540) (1,505) (6,169) (8,235) (27,773)
TOTAL NONCURRENT PLEDGES RECEIVABLE
$ 5,638 $ 8,476 $ 5,644 $ 10,356 $ 12,604 $ 42,718
* December 31, 2013, year-end
The Law School Foundation has received bequest intentions and certain other condi-tional promises to give of approximately $4.5 million at June 30, 2014. These intentions and conditional promises to give are not recognized as assets, and if they are received, will generally be restricted for specific purposes stipulated by the donors, primarily endowments for scholarships and professorships.
Pledges receivable for the Virginia Athletics Foundation are for several programs. The majority of these are for facility improvements.
InvestmentsInvestments are recorded at market value, which is determined by readily available quotes on the stock exchange or as quoted by UVIMCO. Realized gains (losses) from the sale of securities and unrealized gains (losses) from the appreciation (depreciation) of the value of securities held are recognized in the year incurred. The fair values of investments by investment class at June 30, 2014, for the component units are as follows:
SUMMARY SCHEDULE OF INVESTMENTS (in thousands) as of June 30, 2014
UNIVERSITY OF VIRGINIA
LAW SCHOOL FOUNDATION
UNIVERSITY OF VIRGINIA
DARDEN SCHOOL
FOUNDATION
ALUMNI ASSOCIATION
OF THE UNIVERSITY OF VIRGINIA
JEFFERSON SCHOLARS
FOUNDATION
VIRGINIA ATHLETICS
FOUNDATION*
UNIVERSITY OF VIRGINIA
FOUNDATION
UNIVERSITY OF VIRGINIA PHYSICIANS
GROUP
UNIVERSITY OF VIRGINIA
INVESTMENT MANAGEMENT
COMPANY
ELIMINATIONS COMPONENT UNITS TOTAL
Common stocks, corporate notes, bonds, limited partnerships, and agency securities
$ 18,872 $ 9,852 $ 24,356 $ 5,681 $ 117 $ - $ 86,778 $ 4,439,566 $ - $ 4,585,222
University of Virginia Investment Management Company
271,382 272,025 235,812 266,325 65,152 66,561 64,059 - (1,241,316) -
Mutual and money market funds
27,390 25,876 - - 524 974 37,423 109,821 - 202,008
Other 116,152 - 18,563 24,437 - 40,030 26,264 2,499,938 - 2,725,384
Total investments 433,796 307,753 278,731 296,443 65,793 107,565 214,524 7,049,325 (1,241,316) 7,512,614Less: Amounts shown in current assets
(27,390) (25,810) (6,624) (3,915) - (1,679) (3,605) (287,559) - (356,582)
LONG-TERM INVESTMENTS
$ 406,406 $ 281,943 $ 272,107 $ 292,528 $ 65,793 $ 105,886 $ 210,919 $ 6,761,766 $ (1,241,316) $ 7,156,032
* December 31, 2013, year-end
NOTES TO FINANCIAL STATEMENTS
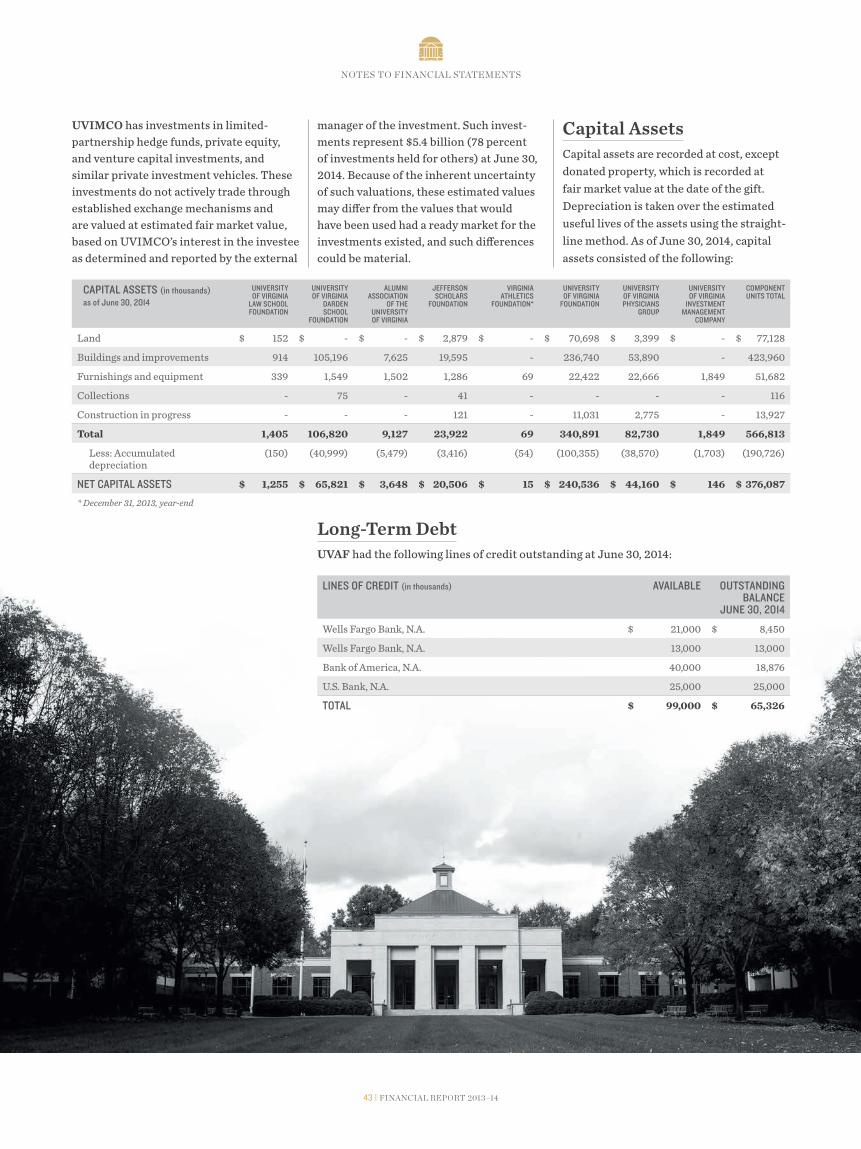
43 | FINANCIAL REPORT 2013–14
UVIMCO has investments in limited-partnership hedge funds, private equity, and venture capital investments, and similar private investment vehicles. These investments do not actively trade through established exchange mechanisms and are valued at estimated fair market value, based on UVIMCO’s interest in the investee as determined and reported by the external
manager of the investment. Such invest-ments represent $5.4 billion (78 percent of investments held for others) at June 30, 2014. Because of the inherent uncertainty of such valuations, these estimated values may differ from the values that would have been used had a ready market for the investments existed, and such differences could be material.
Capital AssetsCapital assets are recorded at cost, except donated property, which is recorded at fair market value at the date of the gift. Depreciation is taken over the estimated useful lives of the assets using the straight-line method. As of June 30, 2014, capital assets consisted of the following:
CAPITAL ASSETS (in thousands) as of June 30, 2014
UNIVERSITY OF VIRGINIA
LAW SCHOOL FOUNDATION
UNIVERSITY OF VIRGINIA
DARDEN SCHOOL
FOUNDATION
ALUMNI ASSOCIATION
OF THE UNIVERSITY OF VIRGINIA
JEFFERSON SCHOLARS
FOUNDATION
VIRGINIA ATHLETICS
FOUNDATION*
UNIVERSITY OF VIRGINIA
FOUNDATION
UNIVERSITY OF VIRGINIA PHYSICIANS
GROUP
UNIVERSITY OF VIRGINIA
INVESTMENT MANAGEMENT
COMPANY
COMPONENT UNITS TOTAL
Land $ 152 $ - $ - $ 2,879 $ - $ 70,698 $ 3,399 $ - $ 77,128
Buildings and improvements 914 105,196 7,625 19,595 - 236,740 53,890 - 423,960
Furnishings and equipment 339 1,549 1,502 1,286 69 22,422 22,666 1,849 51,682
Collections - 75 - 41 - - - - 116
Construction in progress - - - 121 - 11,031 2,775 - 13,927
Total 1,405 106,820 9,127 23,922 69 340,891 82,730 1,849 566,813
Less: Accumulated depreciation
(150) (40,999) (5,479) (3,416) (54) (100,355) (38,570) (1,703) (190,726)
NET CAPITAL ASSETS $ 1,255 $ 65,821 $ 3,648 $ 20,506 $ 15 $ 240,536 $ 44,160 $ 146 $ 376,087
* December 31, 2013, year-end
Long-Term DebtUVAF had the following lines of credit outstanding at June 30, 2014:
LINES OF CREDIT (in thousands) AVAILABLE OUTSTANDING BALANCE
JUNE 30, 2014
Wells Fargo Bank, N.A. $ 21,000 $ 8,450
Wells Fargo Bank, N.A. 13,000 13,000
Bank of America, N.A. 40,000 18,876
U.S. Bank, N.A. 25,000 25,000
TOTAL $ 99,000 $ 65,326
NOTES TO FINANCIAL STATEMENTS

44 | FINANCIAL REPORT 2013–14
The University has allocated up to $37.8 million of its quasi-endowment funds for use by UVAF to acquire and develop real estate. As of June 30, 2014, UVAF had borrowed $33.5 million of these funds to acquire properties on behalf of
the University. These notes payable are noninterest bearing and due on demand.
The composition of the long-term debt of the component units at June 30, 2014, is summarized as follows:
LONG-TERM DEBT (in thousands) as of June 30, 2014
UNIVERSITY OF VIRGINIA
DARDEN SCHOOL
FOUNDATION
JEFFERSON SCHOLARS
FOUNDATION
UNIVERSITY OF VIRGINIA
FOUNDATION
UNIVERSITY OF VIRGINIA PHYSICIANS
GROUP
COMPONENT UNITS TOTAL
University of Virginia Phase I and II Darden School Facilities $ 18,734 $ - $ - $ - $ 18,734
Notes payable SunTrust Bank - 4,500 - - 4,500
Recovery Zone Facility Bond - - 9,979 - 9,979
Note payable Augusta Professional Park - - - 2,771 2,771
1997 Industrial Development Authority revenue bonds - Louisa - - 3,306 - 3,306
1998 Refunding bonds - - - 9,880 9,880
2000 Industrial Development Authority revenue bonds - Louisa
- - - 4,050 4,050
2001 Refinancing demand bonds - - 32,905 - 32,905
2004 Refinancing note payable - - 8,320 - 8,320
2009 Economic Development Authority revenue bonds - Albemarle - - - 21,330 21,330
2011 Refinancing demand bonds - 18,000 34,710 - 52,710
Notes payable University of Virginia - - 33,467 - 33,467
Lines of credit - - 65,326 - 65,326
Total 18,734 22,500 188,013 38,031 267,278
Less: Current portion (2,326) - (25,568) (2,995) (30,889)
NET LONG-TERM DEBT $ 16,408 $ 22,500 $ 162,445 $ 35,036 $ 236,389
Principal maturities of long-term debt obligations are as follows:
MATURITIES (in thousands) as of June 30, 2014
UNIVERSITY OF VIRGINIA
DARDEN SCHOOL
FOUNDATION
JEFFERSON SCHOLARS
FOUNDATION
UNIVERSITY OF VIRGINIA
FOUNDATION
UNIVERSITY OF VIRGINIA PHYSICIANS
GROUP
COMPONENT UNITS TOTAL
2015 $ 2,326 $ - $ 25,568 $ 2,995 $ 30,889
2016 2,439 - 29,289 2,871 34,599
2017 2,564 - 23,342 1,665 27,571
2018 2,727 - 10,894 1,750 15,371
2019 2,840 - 4,336 1,845 9,021
Thereafter 5,838 22,500 94,584 26,905 149,827
TOTAL $ 18,734 $ 22,500 $ 188,013 $ 38,031 $ 267,278
NOTES TO FINANCIAL STATEMENTS

45 | FINANCIAL REPORT 2013–14
Significant Transactions with the UniversityThe University provides certain services for the Darden School Foundation that are reimbursed by the Darden School Founda-tion monthly.
Direct payments to the University from the Alumni Association for the year ended June 30, 2014, totaled $1.1 million. This amount includes gift transfers, payment
for facilities and services, and other support for University activities.
In March 2014, the University acquired 560 Ray C. Hunt Drive from UVAF. The acquisi-tion price of the property was $15.9 million. In accordance with GASB requirements, the University recorded the capital asset at UVAF’s carrying value of $5.9 million.
UPG has contracted with the University to provide certain professional and technical
services. Payments received for these services were approximately $76.9 million for the year ended June 30, 2014. Approximately $21.3 million of the fiscal year payments received relate to disproportionate share funds paid for indigent patients served by UPG, which contributed $20.9 million to the University in support of various academic programs, equipment, teaching, and research for the year ended June 30, 2014.
NOTE 9: EXPENSE CLASSIFICATION MATRIX
OPERATING EXPENSES BY FUNCTIONAL CLASSIFICATION (in thousands) for the year ended June 30, 2014
COMPENSATION AND BENEFITS
SUPPLIES, UTILITIES, AND
OTHER SERVICES
STUDENT AID DEPRECIATION OTHER TOTAL
Instruction $ 312,625 $ 33,613 $ 5,015 $ - $ 857 $ 352,110
Research 151,247 96,488 15,814 - 651 264,200
Public service 22,231 14,971 651 - 586 38,439
Academic support 103,677 32,349 355 - 184 136,565
Student services 30,966 10,184 156 - 154 41,460
Institutional support 84,037 21,652 72 - 407 106,168
Operation of plant 78,800 11,194 - - 142 90,136
Student aid 706 4,716 51,611 - 170 57,203
Auxiliary 66,994 84,963 128 - 689 152,774
Depreciation - - - 115,928 - 115,928
Patient services 537,177 574,680 - 83,260 - 1,195,117
Other 812 (12,152) - - 11 (11,329)
Central services recoveries - (17,465) - - - (17,465)
TOTAL OPERATING EXPENSES $ 1,389,272 $ 855,193 $ 73,802 $ 199,188 $ 3,851 $ 2,521,306
NOTE 10: APPROPRIATIONS
The University receives state appropriations from the General Fund of the Common-wealth. The Appropriation Act specifies that such unexpended appropriations shall revert, as specifically provided by the General Assembly, at the end of the bien-nium. For years ending at the middle of a biennium, unexpended appropriations that have not been approved for reappropriation in the next year by the governor become part of the General Fund of the Commonwealth and are, therefore, no longer available to the University for disbursements.
A summary of state appropriations received by the University and the University’s College at Wise, including all supplemental appropriations and reversions for the year ended June 30, 2014, is provided in the chart to the right.
APPROPRIATIONS (in thousands)
Original legislative appropriation per Chapter 806
$ 132,453
Adjustments:
Financial aid - General Fund 12,746
Financial assistance for educational and general 6,825
Miscellaneous educational and general 9,617
TOTAL STATE APPROPRIATIONS $ 161,641
NOTES TO FINANCIAL STATEMENTS
46 | FINANCIAL REPORT 2013–14
NOTE 11: RETIREMENT PLANS
Virginia Retirement SystemEmployees of the University are employees of the Commonwealth and therefore participate in the Commonwealth’s defined benefit pension plan. The Virginia Retirement System (VRS) administers this plan. VRS is a multiple-employer public employee retirement system that acts as a common investment and administrative agency for the Commonwealth and its political subdivisions. VRS does not measure assets and pension benefit obligations separately for individual state institutions. Information relating to this plan is available at the statewide level only in the Commonwealth’s Comprehensive Annual Financial Report (CAFR). The CAFR provides disclosure of the Commonwealth’s unfunded pension benefit obligation at June 30, 2014. The Commonwealth, not the University, has overall responsibility for contributions to this plan.
Essentially all regular employees of the University are eligible to enroll in VRS. Eighty-four percent of salaried classified and University staff employees, 13 percent of faculty, and 13 percent of Medical Center employees participate in this defined benefit pension plan. The University’s total VRS contributions for the year ended June 30, 2014, were $30.3 million.
Optional Retirement PlansFull-time faculty and certain administra-tive staff may participate in Optional Retirement Plans, as authorized by the Code of Virginia, rather than the VRS defined benefit retirement plan. The Optional Retirement Plans are defined contribution plans to which the University contributes an amount established by statute. Eighty-seven percent of teaching, research, and administrative faculty, 16 percent of University staff, and 87 percent of Medical Center employees participate in Optional Retirement Plans offered through TIAA-CREF and Fidelity Investments, Inc.
There are two defined contribution plans for eligible academic employees. Plan 1 is for employees hired prior to July 1, 2010,
and retirement benefits received are based on the employer’s 10.4 percent contribu-tions, plus interest and dividends. Plan 2 is for employees hired on or after July 1, 2010, and retirement benefits received are based on the employer’s 8.9 percent contribu-tions and the employee’s 5.0 percent contributions, plus interest and dividends. Individual contracts issued under these plans provide for full and immediate vesting of both the University’s and the employees’ contributions.
Medical Center employees hired after July 1, 1999, cannot participate in Plan 1 or Plan 2 noted above, but have the option of participating in the Medical Center’s Optional Retirement Plan. This is a defined contribution plan where the retirement benefits received are based on the employer and employee contributions, all of which are paid by the Medical Center, plus interest and dividends. Medical Center employees are fully vested after one or two years of employment, depending on their date of hire.
Total pension costs under the Optional Retirement Plans were approximately $50.9 million, and were calculated using base salaries of $641.9 million, for the year ended June 30, 2014. The contribution percentage amounted to 7.9 percent.
Deferred Compensation PlansState employees may elect to participate in the Commonwealth’s Deferred Com-pensation 457 Plan or the University’s 403(b) Plan. Participating employees can contribute to either plan each pay period, with the Commonwealth matching at 50 percent up to $20 per pay period, or $40 per month. This dollar amount match can change depending on the funding available in the Commonwealth’s budget. The Employer Matching Plan falls under Section 401(a) of the Internal Revenue Code. Employer contributions for University employees to the 401(a) plan were $2.6 million and employee contributions were $35.6 million for the year ended June 30, 2014.
The Deferred Compensation plan for the University Medical Center employees hired
on or after September 30, 2002, allows employee contributions up to 4 percent of their salary and an employer match of 50 percent of the employee’s 4 percent defer-ral amount, not to exceed 2 percent of the employee’s salary. Employer contributions under this plan were approximately $1.4 million for the year ended June 30, 2014.
NOTE 12: POSTEMPLOYMENT BENEFITS OTHER THAN PENSION BENEFITS
The University participates in the Com-monwealth-sponsored VRS-administered statewide group life insurance program, which provides postemployment life insurance benefits to eligible retired and terminated employees. The Commonwealth also provides health care credits against the monthly health insurance premiums of its retirees who have at least fifteen years of state service. Information related to these plans is available at the statewide level in the Commonwealth’s CAFR.
The University’s annual postemployment benefits expense is actuarially determined in accordance with the parameters of GASB Statement No. 45, Accounting and Financial Reporting by Employers for Postemployment Benefits Other Than Pensions, which calls for the measurement and recognition of the cost of other postemployment benefits (OPEB) during the periods when employees render their services. The statement also establishes comprehensive disclosures for OPEB obligations. OPEB refers to postemployment benefits other than pension benefits and includes postemployment health care benefits and other types of postemployment benefits if provided separately from a pension plan. The University implemented GASB Statement No. 45 prospectively as of June 30, 2008, with a zero net OPEB obligation at transition.
Plan Description and Funding PolicyOptional Retirement Retiree Life Insurance Plans. University faculty who participate in the Optional Retirement Plans receive $10,000 in retiree life insurance. Medical Center employees who participate in the Optional Retirement Plan have a variety of retiree life insurance options depending on termination date and years of service. Benefit provisions for these plans are established and maintained by the
NOTES TO FINANCIAL STATEMENTS

47 | FINANCIAL REPORT 2013–14
University under the authority of the Board. The University pays the total cost of the insurance. The Optional Retirement Retiree Life Insurance Plans are single-employer plans administered by the University. The University does not issue stand-alone financial statements for the plans.
Retiree Health Plan. University employees who retire before becoming eligible for Medicare participate in the Retiree Health Plan, which mirrors the University’s Health Plan for active employees, until they are eligible for Medicare. At that time, University retirees can participate in the Commonwealth’s Medicare Supplement Plan. Benefit provisions for this plan are established and maintained by the Univer-sity under the authority of the Board. This Retiree Health Plan is a single-employer plan administered by the University. The University does not issue stand-alone financial statements for this plan.
The contribution requirements of plan members and the University are based on projected pay-as-you-go financing require-ments. For fiscal year 2014, the University contributed $3.9 million to the plan for
retiree claims. Retirees receiving benefits contributed $4.4 million, or approximately 53 percent of the total premiums, through their required contributions, ranging from $435 to $1,900 per month.
Annual OPEB Costs and Funded Status The University’s annual OPEB cost (expense) is calculated based on the annual required contribution (ARC) of the employer, an amount actuarially determined in accordance with the parameters of GASB Statement No. 45. The total cost of providing postemployment benefits is projected, taking into account assumptions about demographics, turnover, mortality, dis-ability, retirement, health care trends, and other actuarial assumptions. This amount is discounted to determine the actuarial present value of total projected benefits. The actuarial accrued liability (AAL) is the portion of the present value of the total projected benefits allocated to years of employment prior to the measurement date. The unfunded actuarial accrued liability (UAAL) is the difference between the AAL and actuarial value of assets in the plan.
Once the UAAL is determined, the ARC is determined as the normal cost and the amortization of the UAAL. This ARC is compared to actual contributions made and any difference is reported as the net OPEB obligation. The ARC represents a level of funding that, if paid on an ongoing basis, is projected to cover normal cost each year and amortize any unfunded actuarial accrued liabilities (or funding excess) over a period not to exceed thirty years. The table to the lower left shows the components of the Uni-versity’s annual OPEB costs for the year, the amount actually contributed to the plans, and changes in the net OPEB obligation for the Optional Retirement Plans Retiree Life and the Retiree Health Plan.
Actuarial Methods and AssumptionsActuarial valuations of an ongoing plan involve estimates of the value of reported amounts and assumptions about the probability of events far into the future. Amounts determined regarding the funded status of the plan and the required annual contributions of the employer are subject to continual revision as actual results are compared with past expectations and new estimates are made about the future. The schedule of funding progress presented as required supplementary information following the Notes to the Financial Statements presents multiyear trend information that shows whether the actuarial value of plan assets is increasing or decreasing over time relative to the AAL for benefits.
Projections of benefits for financial reporting purposes are based on the substantive plans (as understood by the University and the plan members) and include the types of benefits provided at the time of each valu-ation and the historical pattern of sharing of benefit costs between the employer and plan members to that point. The projection of benefits for financial reporting purposes does not explicitly incorporate the potential effects of legal or contractual funding limita-tions on the pattern of cost sharing between the employer and plan members in the future. The actuarial methods and assump-tions used include techniques that are designed to reduce the effects of short-term
NOTES TO FINANCIAL STATEMENTS
SUMMARY OF VALUATION RESULTS (in thousands)
ACTUARIAL ACCRUED LIABILITY BY CATEGORY AS OF JUNE 30, 2014
Current retirees, beneficiaries, dependents, and terminated vested members
$ 20,641
Current active members 67,722
TOTAL ACTUARIAL ACCRUED LIABILITY $ 88,363
Covered payroll $ 415,500
Actuarial accrued liability as percentage of covered payroll
21.3%
2014 2013 2012
NET OPEB OBLIGATION AS OF JUNE 30
Annual required contribution (ARC) $ 10,571 $ 11,766 $ 10,317
Interest on net OPEB obligation 1,562 849 849
Adjustment to the ARC (2,291) (1,246) (1,246)
Annual OPEB cost 9,842 11,369 9,920
Actual contributions (3,867) (1,990) (3,469)
Net increase in net OPEB obligation 5,975 9,379 6,451
Net OPEB obligation, beginning of year 34,706 25,327 18,876
NET OPEB OBLIGATION, END OF YEAR $ 40,681 $ 34,706 $ 25,327
Percentage of annual OPEB cost contributed 39.3% 17.5% 35.0%
As of June 30, 2014, the University has not funded these postemployment benefit plans.

48 | FINANCIAL REPORT 2013–14
volatility in actuarial accrued liabilities and the actuarial value of assets, consistent with the long-term perspective of the calculations.
In the June 30, 2014, actuarial valuation, the University elected to use the entry age normal level dollar method. The actuarial assump-tions include a 4.5 percent investment rate of return, which is a blended rate of the expected long-term investment returns on plan assets and the University’s own investments calcu-lated based on the funded level of the plan at the valuation date, and an annual health care cost trend rate and a drug cost trend rate of 8.0 percent for the fiscal year ended June 30, 2014, grading to 5.0 percent for the fiscal year ending June 30, 2026, and thereafter. All rates include a 4.0 percent inflation assumption. Past service liability is amortized over an open thirty-year period as a level dollar amount.
NOTE 13: SELF-INSURANCE
All University employees have the option to participate in the University’s self-funded, comprehensive medical care benefits program. The cost of medical care is paid out of employee and employer contributions. The market value of investments at June 30, 2014, was $64.2 million. Claims and expenses are reported when it is probable that a loss has occurred and the amount of the loss can be reasonably estimated. Those losses include an estimate of claims that have been incurred but not reported and the future costs of handling claims. The estimated liability for outstanding claims at June 30, 2014, was $14.9 million. The University has contracted with several third-party claims administrators: Aetna for its medical claims; United Concordia for its dental claims; and CatalystRx for its pharmacy claims.
University employees are covered by a self-insured workers’ compensation benefits program administered by the Common-wealth’s Department of Human Resource Management. Information relating to this plan is available at the statewide level only in the Commonwealth’s CAFR.
The University’s Office of Risk Management manages all property and casualty insurance programs for the University, including the Medical Center and the College at Wise. At present, most insurance coverages are obtained through participation in the state risk management self-insurance plans,
which the Virginia Department of the Treasury, Division of Risk Management, administers. Risk management insurance includes property, mechanical breakdown, crime, employee bond (employee dishon-esty), general (tort) liability, professional liability (includes medical malpractice), aviation and watercraft coverage, and automobile liability. The University is self-insured for the first $100,000 of each property and mechanical breakdown loss, and for physical damage on all vehicles valued up to $20,000. The University also maintains excess crime/employee dishon-esty insurance, network security and privacy insurance (response and liability), and insurance for physical damage on vehicles valued in excess of $20,000. Separate insur-ance coverage is maintained as appropriate on subsidiary organizations owned by the Medical Center, such as Community Medicine University of Virginia, LLC.
NOTE 14: FUNDS HELD IN TRUST BY OTHERS
Assets of funds held by trustees for the benefit of the University are not reflected in the accompanying Statement of Net Position. The University has irrevocable rights to all or a portion of the income of these funds, but the assets of the funds are not under the management of the Univer-sity. The market value of the funds held by trustees for the benefit of the University at June 30, 2014, was $137.2 million and income received totaled $5.9 million.
NOTE 15: COMMITMENTS AND
CONTINGENCIES
Authorized expenditures for construction and other projects unexpended as of June 30, 2014, were approximately $79.9 million.
The University has entered into numer-ous operating lease agreements to rent, lease, and maintain land, buildings, and equipment, which expire at various dates. In most cases, the University has renewal options on the leased assets for another similar term, and expects that, in the normal course of business, these leases will be replaced by similar leases. Operating lease expense totaled approximately $25.7 million for the year ended June 30, 2014.
The University’s ongoing minimum commitments for operating leases for land,
office and clinical buildings, and equipment are as follows:
YEARS ENDING JUNE 30 (in thousands)
LEASE OBLIGATION
2015 $ 16,732
2016 8,528
2017 7,567
2018 5,375
2019 5,936
2020–24 10,992
2025–29 3,214
2030–34 823
2035–39 823
2040–44 823
2045–49 823
2050–54 165
TOTAL $ 61,801
LitigationThe University is a party to various legal actions and other claims in the normal course of business. While the final outcome cannot be determined at this time, management is of the opinion that the liability, if any, for these legal actions will not have a material effect on the University’s financial position.
NOTE 16: SUBSEQUENT EVENTS
On July 31, 2014, the University renewed two of its revolving credit agreements and entered into a new revolving credit agreement with a new bank. The aggregate amount of revolving credit agreements outstanding is $200 million.
On August 26, 2014, the University entered into an agreement with Aramark Educa-tional Services, LLC (Aramark), for Aramark to provide a dining services program to the University including board, retail, conces-sions, vending, and athletic dining through June 30, 2034. Aramark is required to make an up-front payment to the University in the amount of $70 million, of which $35 million was paid within thirty days of execution of the contract with the remaining amount to be paid by December 31, 2014. Additional financial commitments are required of Aramark over the term of the contract for capital improvements totaling $22.6 million.
The Medical Center acquired 100 percent ownership of Culpeper Regional Hospital on October 1, 2014.
NOTES TO FINANCIAL STATEMENTS

49 | FINANCIAL REPORT 2013–14
Required Supplementary Information (Unaudited)
FUNDING PROGRESS FOR OTHER POSTEMPLOYMENT BENEFIT PLANS (in thousands)
VALUATION DATE ACTUARIAL VALUE OF ASSETS (a)
ACTUARIAL ACCRUED LIABILITY (AAL) (b)
UNFUNDED AAL (UAAL) (b-a)
FUNDED RATIO (a/b)
COVERED PAYROLL (c)
UAAL AS A PERCENTAGE OF COVERED PAYROLL
(b-a)/(c)
6/30/2014 $ - $ 88,363 $ 88,363 0% $ 415,500 21.3%
6/30/2012 $ - $ 72,090 $ 72,090 0%
6/30/2010 $ - $ 76,440 $ 76,440 0%
NOTES TO FINANCIAL STATEMENTS

WWW.VIRGINIA.EDU