first quarter 2018 results april 26, 2018 - fcagroup.com · launch costs of €0.3; ... to “a2”...
TRANSCRIPT
• First Quarter 2018 Results
• April 26, 2018

• This document, and in particular the section entitled “2018 guidance – confirmed”, contains forward-looking statements. These statements may include terms such as “may”, “will”, “expect”, “could”, “should”, “intend”, “estimate”, “anticipate”, “believe”, “remain”, “on track”, “design”, “target”, “objective”, “goal”, “forecast”, “projection”, “outlook”, “prospects”, “plan”, or similar terms. Forward-looking statements are not guarantees of future performance. Rather, they are based on the Group’s current expectations and projections about future events and, by their nature, are subject to inherent risks and uncertainties. They relate to events and depend on circumstances that may or may not occur or exist in the future and, as such, undue reliance should not be placed on them. Actual results may differ materially from those expressed in such statements as a result of a variety of factors, including: the Group's ability to maintain vehicle shipment volumes; changes in the global financial markets, general economic environment and changes in demand for automotive products, which is subject to cyclicality; changes in local economic and political conditions, including with regard to trade policy, the enactment of tax reforms or other changes in tax laws and regulations; the Group's ability to expand certain of the Group's brands globally; the Group’s ability to offer innovative, attractive products; various types of claims, lawsuits, governmental investigations and other contingent obligations against the Group, including product liability and warranty claims and environmental claims, governmental investigations and lawsuits; material operating expenditures in relation to compliance with environmental, health and safety regulations; the high level of competition in the automotive industry, which may increase due to consolidation; exposure to shortfalls in the Group's defined benefit pension plans; the Group's ability to provide or arrange for access to adequate financing for the Group's dealers and retail customers and associated risks related to financial services companies; the Group's ability to access funding to execute the Group's business plan and improve the Group's business, financial condition and results of operations; a significant malfunction, disruption or security breach compromising the Group’s information technology systems or the electronic control systems contained in the Group’s vehicles; the Group's ability to realize anticipated benefits from joint venture arrangements; disruptions arising from political, social and economic instability; risks associated with our relationships with employees, dealers and suppliers; increases in costs, disruptions of supply or shortages of raw materials; developments in labor and industrial relations and developments in applicable labor laws; exchange rate fluctuations, interest rate changes, credit risk and other market risks; political and civil unrest; earthquakes or other disasters and other risks and uncertainties.
• Any forward-looking statements contained in this document speak only as of the date of this document and the Company does not undertake any obligation to update or revise publicly forward-looking statements. Further information concerning the Group and its businesses, including factors that could materially affect the Company’s financial results, is included in the Company’s reports and filings with the U.S. Securities and Exchange Commission, the AFM and CONSOB. Safe Harbor Statement

• * Refer to Appendix for definitions of supplemental financial measures and reconciliations to applicable IFRS metrics. Guidance is not provided on the most directly comparable IFRS financial statement line item for Adjusted EBIT and Adjusted net profit as the income or expense excluded from these non-GAAP financial measures in accordance with our policy are, by definition, not predictable and uncertain. Highlights 2018 guidance – confirmed €B Record Q1 with Adjusted EBIT at €1.6B and margin up 50 bps to 6.0%; Adjusted net profit up 55% to €1.0B Continued strong performance in NAFTA notwithstanding launch costs of €0.3B; significant improvement in LATAM Cash flows from industrial operating activities, net of capex, of €1.0B with Net industrial debt further reduced to €1.3B Repaid €1.3B maturing capital markets debt with cash on hand S&P raised FCA’s credit rating to “BB+”; Moody’s raised rating to “Ba2” Initial phase of NAFTA capacity realignment plan completed with launch of all-new Ram 1500 at Sterling Heights (Michigan) plant Waymo partnership strengthened with agreement to deliver additionalChrysler Pacifica Hybrid minivans BoD authorized development and implementationof plan to spin off Magneti Marelli Amounts do not include any impacts from the previously announced potential spin-off of the Magneti Marelli business

• Products Debuted at 2018 New York International Auto Show
• Equipped with Ferrari-built 3.8-liter twin-turbo V8 engine, delivering 590 hp and 730 nm peak torque
• 0-100 km/h in 3.9 seconds, with top speed reaching over 300 km/h
• Features new carbon fiber exterior design cues and exclusive interiors Levante Trofeo V8
• world premiere All-new premium seven passenger SUV announced in Apr ‘18
• Production to commence in Q2 ‘18 at China JV plant in Changsha
• Equipped with 2.0-liter twin-turbo engine, delivering 265 hp and 400 nm peak torque Three-row SUV exclusive to the Chinese market Production of all-new Ram 1500 began at Sterling Heights (Michigan) plant, with first shipments in Mar ’18
• Fully redesigned, state-of-the-art, light duty truck with best-in-class V8 towing and improved payload
• Uncompromising strength, technology and fuel efficiency, with more than 100 standard and available safety and security features
• Most technologically advanced pickup in the market Revealed at 2018 Geneva International Motor Show
• Production limited to 108 units for each model to commemorate the 108 year history of the Alfa Romeo brand
• Equipped with 2.9-liter V6 twin-turbo 510 hp engine Stelvio and Giulia Quadrifoglio Nürburgring Editions

• * Refer to Appendix for definitions of supplemental financial measures and reconciliations to applicable IFRS metrics.
Figures may not add due to rounding. Q1 ‘18 summary Adjusted net profit* (€M) Shipments (k units) Net revenues (€B) Adjusted EBIT* (€M) Combined shipments up 5%, primarily due to growth in NAFTA and LATAM; global Jeep shipments up 37%
• Lower JV shipments in APAC Net revenues down 2%
• Up 9% at constant exchange rates (CER) Record Q1, up 5%; up 19% at CER
• Record Q1 margin, up 50 bps Net industrial debt* (€M) Record Q1, up 55%
• Financial charges further reduced
• Lower tax expense largely due to U.S. tax reform
• Net profit up 59% to €1.0B €1.1B reduction
• Cash flows from operating activities, net of capex, €1.7B better than Q1 ’17, with lower capex due to program timing
• €1.3B repayment of capital markets debt at maturity
• Extended maturity of €6.25B RCF to Mar ‘23 Available liquidity (€B) Mar 31 ‘18 Dec 31 ‘17 Q1 ‘18 Q1 ‘17 (2,390) (1,313) JVs 1,204 1,145 Combined 6.0%margin 5.5%margin Cash & marketable securities Undrawn committed credit lines 20.4 19.4 Consolidated

• €M% = Adjusted EBIT margin 1,535 5.5% Q1 ‘17 NAFTA LATAM APAC EMEA Maserati Components Others & Eliminations Q1 ‘18 6.0% By segment Q1 ‘18 Adjusted EBIT walk Volume & Mix Net price Industrial costs SG&A Other By operational driver Refer to Appendix for definitions of supplemental financial measures and reconciliations to applicable IFRS metrics. Figures may not add due to rounding.
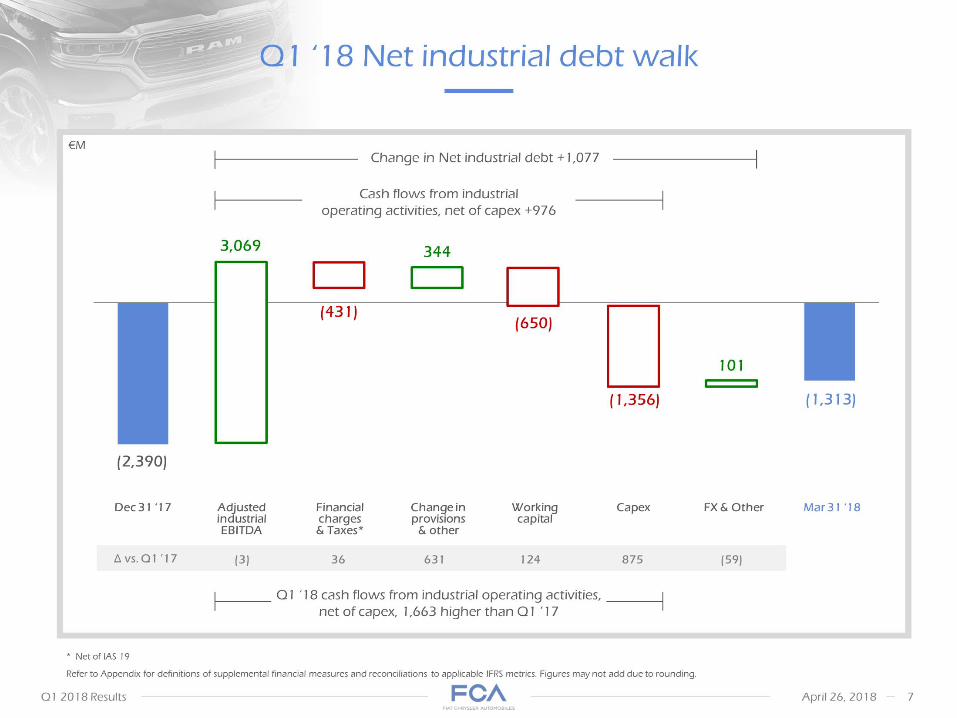
• * Net of IAS 19 Dec 31 ‘17 Adjusted industrial
• EBITDA Financial charges
• & Taxes* Change in provisions & other Capex FX & Other Mar 31 ‘18 €M Change in Net industrial debt +1,077 Cash flows from industrial operating activities, net of capex +976 Q1 ‘18 Net industrial debt walk (2,390) Workingcapital Refer to Appendix for definitions of supplemental financial measures and reconciliations to applicable IFRS metrics. Figures may not add due to rounding.

• U.S. sales up 1%; Canada down 5%; Mexico down 17%
• U.S. share at 12.3% (-20 bps) with retail share at 12.0% (+30 bps); U.S. fleet mix reduced to 23% vs. 26%
• Jeep sales up 22% mainly due to all-new Wrangler and Compass, as well as new Cherokee; Ram down 13% due to lower fleet sales with Ram U.S. retail up 1%; Chrysler and Dodge down 5% and 16%, respectively Down from 86 days at Dec ‘17 Increase driven by all-new Jeep Wrangler and Compass, as well as Chrysler Pacifica, partially offset by lower fleet volumes Up 10% at CER
• Higher shipments
• Positive mix and net pricing
• Represents sales to retail and fleet customers and limited deliveries to Group-related persons. Sales by dealers to customers are reported through a new-vehicle delivery system.
• Calculated using dealer inventories, as well as total sales including fleet. NAFTA Q1 ‘17 Volume & Mix Net price Industrial costs SG&A Other Q1 ‘18 Adjusted EBIT walk €M
• % = Adjusted EBIT margin Higher volumes
• Positive vehicle and market mix Positive pricing on existing vehicles and new launches, partially offset by higher incentives Launch costs and D&A related to new vehicles
• Increased product content costs 1,241 7.3% 7.4% Cost efficiencies and advertising timing U.S. dealer inventories (2)
• (days of supply) Sales (1)(k units) Market share Shipments(k units) Net revenues(€B) 597 83 609 17.1 594 81 646 16.4 Adjusted EBIT margin Mar ‘17 Mar ‘18 Unfavorable FX translation U.S. Retail 11.7% 12.2% 11.9% 12.0% Q1 ’18 includes launch costs of €0.3B related to all-new Jeep Wrangler and Ram 1500, as well as new Jeep Cherokee
•
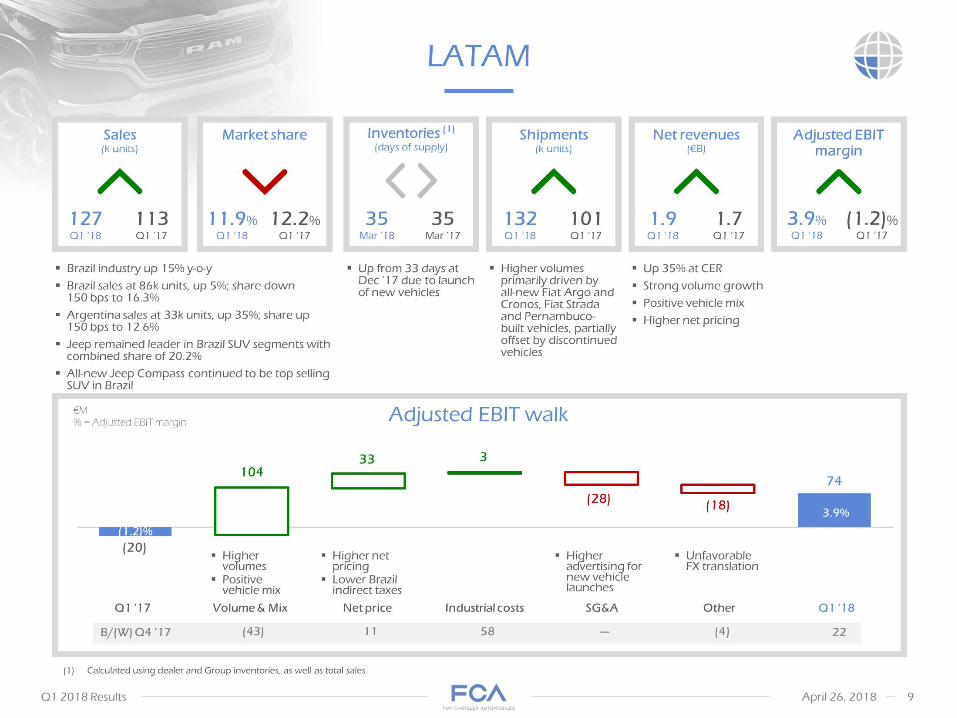
• Brazil industry up 15% y-o-y
• Brazil sales at 86k units, up 5%; share down 150 bps to 16.3%
• Argentina sales at 33k units, up 35%; share up 150 bps to 12.6%
• Jeep remained leader in Brazil SUV segments with combined share of 20.2%
• All-new Jeep Compass continued to be top selling SUV in Brazil Up from 33 days atDec ’17 due to launch of new vehicles
• Higher volumes primarily driven by all-new Fiat Argo and Cronos, Fiat Strada and Pernambuco-built vehicles, partially offset by discontinued vehicles Up 35% at CER
• Strong volume growth
• Positive vehicle mix
• Higher net pricing LATAM Adjusted EBIT walk €M
• % = Adjusted EBIT margin Calculated using dealer and Group inventories, as well as total sales. Net revenues(€B) Q1 ‘17 1.7 Q1 ‘18 1.9 35 Inventories (1)
• (days of supply) 113 127 Sales(k units) 101 132 Shipments(k units) 12.2% 11.9% Market share Adjusted EBIT margin (1.2)% 3.9% Mar ’17 Mar ’18 Volume & Mix Net price Industrial costs SG&A Other Higher volumes
• Positive vehicle mix (20) Higher net pricing
• Lower Brazil indirect taxes Higher advertising for new vehicle launches Unfavorable FX translation

• China share down 30 bps to 0.8%, largely due to lower JV sales for Jeep Cherokee and Renegade
• India share up 60 bps to 0.7% mainly due to all-new Jeep Compass Increase to support launch of Alfa Romeo Giulia and Stelvio in China and all-new Jeep Compass in right-hand drive markets
• Up from 86 days at Dec ‘17 Lower Jeep Cherokee and Renegade shipments from China JV
• Increased shipments of all-new Jeep Compass and Alfa Romeo Giulia and Stelvio
• Up 3% at CER
• Higher consolidated shipments
• Unfavorable vehicle mix APAC Reflects aggregate for major markets where Group competes (China, Australia, Japan, South Korea and India). Market share is based on retail registrations, except in India where market share is based on wholesale volumes, as well as management’s estimates of industry sales data, which use certain data provided by third party sources.
• Calculated using dealer and Group inventories, as well as total combined sales. Adjusted EBIT walk €M
• % = Adjusted EBIT margin Sales(k units) Combined JV 62 43 Q1 ‘17 Q1 ‘18 42 Net revenues(€M) 666 619 Inventories (2)
• (days of supply) 73 91 Market share (1) 0.8% 0.7% Shipments(k units) 66 50 56 37 Adjusted EBIT margin 3.2% 1.6% Mar ’17 Mar ’18 Volume & Mix 21 Higher consolidated shipments Alfa Romeo commercial launch activities Net price Industrial costs SG&A Other Lower China JV results
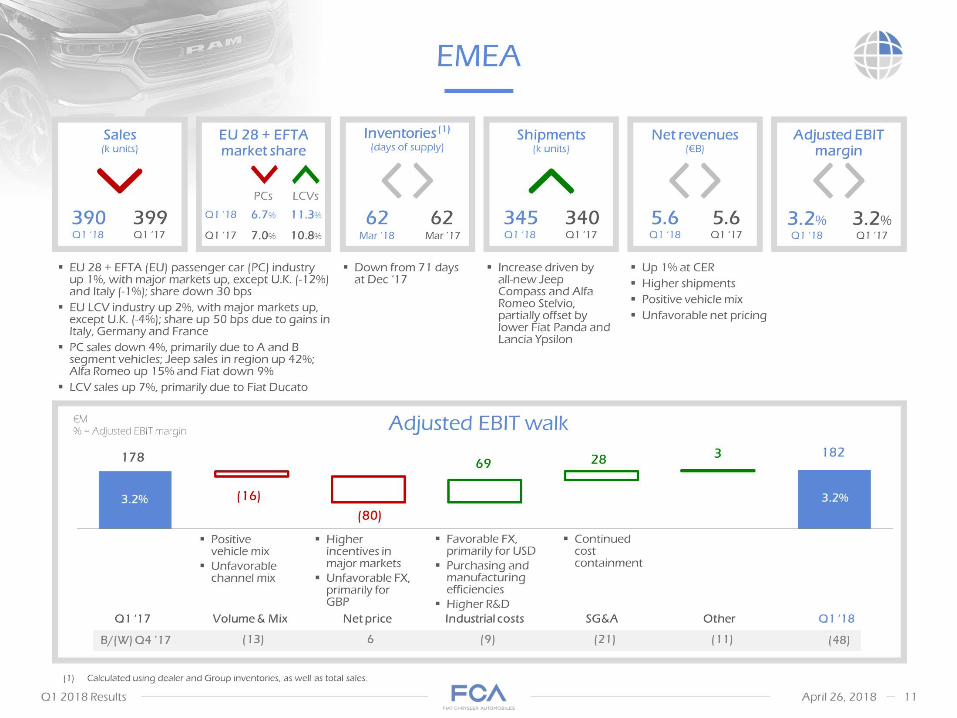
• Adjusted EBIT walk EU 28 + EFTA (EU) passenger car (PC) industry up 1%, with major markets up, except U.K. (-12%) and Italy (-1%); share down 30 bps
• EU LCV industry up 2%, with major markets up, except U.K. (-4%); share up 50 bps due to gains in Italy, Germany and France
• PC sales down 4%, primarily due to A and B segment vehicles; Jeep sales in region up 42%; Alfa Romeo up 15% and Fiat down 9%
• LCV sales up 7%, primarily due to Fiat Ducato Down from 71 days at Dec ‘17 Increase driven byall-new Jeep Compass and Alfa Romeo Stelvio, partially offset by lower Fiat Panda and Lancia Ypsilon Up 1% at CER
• Higher shipments
• Positive vehicle mix
• Unfavorable net pricing Positive vehicle mix
• Unfavorable channel mix Favorable FX, primarily for USD
• Purchasing and manufacturing efficiencies
• Higher R&D EMEA 178 €M
• % = Adjusted EBIT margin 3.2% Higher incentives in major markets
• Unfavorable FX, primarily for GBP Calculated using dealer and Group inventories, as well as total sales. Inventories (1)
• (days of supply) 62 Shipments(k units) 340 Q1 ‘17 345 Q1 ‘18 Net revenues(€B) 5.6 Sales(k units) 399 390 EU 28 + EFTA market share 7.0% 10.8% PCs LCVs 6.7% 11.3% Adjusted EBIT margin Mar ’17 Mar ’18 Continued cost containment Volume & Mix Net price Industrial costs SG&A Other

• Maserati Commercial performance
• Lower shipments across all markets, largely due to Levante, partially offset by higher GranTurismo and GranCabrio volumes
• Financial performance
• Lower Net revenues primarily due to lower volumes and unfavorable FX impact, partially offset by positive market mix and net pricing
• Adjusted EBIT decrease primarily due to lower volumes and unfavorable FX impact, partially offset by industrial and SG&A cost efficiencies, as well as favorable market mix Shipments
• (k units) Q1 ‘17 Q1 ‘18 Sales(k units) Net revenues(€M) Shipments(k units) Adjusted EBIT(€M) Adjusted EBIT margin
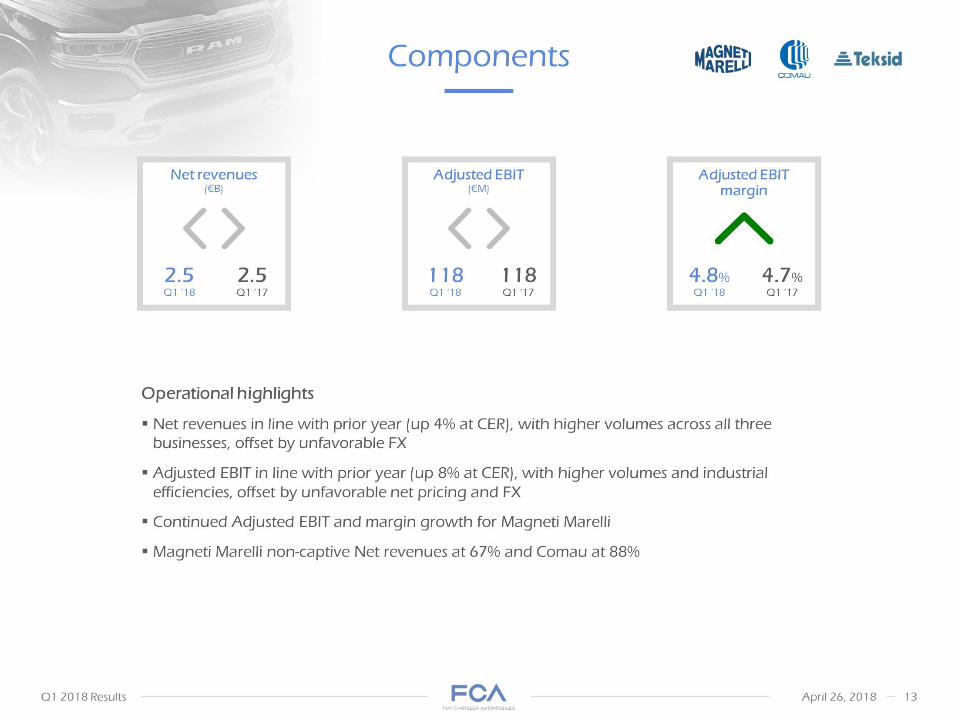
• Components Net revenues(€B) 2.5 Q1 ‘17 Q1 ‘18 Adjusted EBIT(€M) 118 Adjusted EBIT margin 4.7% 4.8% Operational highlights
• Net revenues in line with prior year (up 4% at CER), with higher volumes across all three businesses, offset by unfavorable FX
• Adjusted EBIT in line with prior year (up 8% at CER), with higher volumes and industrial efficiencies, offset by unfavorable net pricing and FX
• Continued Adjusted EBIT and margin growth for Magneti Marelli
• Magneti Marelli non-captive Net revenues at 67% and Comau at 88%

• Industry outlook M units LATAM
• (passenger cars & LCVs) APAC (1)
• (passenger cars only) EMEA
• (passenger cars & LCVs) NAFTA
• (total vehicle sales including medium/heavy trucks) APAC industry reflects aggregate for major markets where Group competes (China, Australia, Japan, South Korea and India) FY ’18E FY ’17 FY ‘17 Outlook unchanged
• FY ‘18 Brazil industry forecasted at 2.4M units, up 0.2M y-o-y
• Q1 ‘18 Brazil industry at 0.5M units, +15% over last year Outlook unchanged
• FY ‘18 China industry expected at 23.3M units, compared to 23.2M in FY ‘17
• Q1 ’18 China industry at 5.4M units, +19% over Q1 ‘17 Outlook unchanged
• FY ‘18 EU industry forecasted at 18.0M units, up 0.3M y-o-y
• Q1 ‘18 EU industry at 4.9M units, +1% y-o-y Outlook unchanged
• FY ‘18 U.S. industry forecasted at 17.3M units, down slightly from 17.6M in FY ‘17
• Q1 ‘18 U.S. SAAR at 17.6M units, +1% over Q1 ‘17
•

• 2018 guidance – confirmed * Refer to Appendix for definitions of supplemental financial measures and reconciliations to applicable IFRS metrics. Guidance is not provided on the most directly comparable IFRS financial statement line item for Adjusted EBIT and Adjusted net profit as the income or expense excluded from these non-GAAP financial measures in accordance with our policy are, by definition, not predictable and uncertain. €B 2018-2022 Business Plan to be presented on June 1st Note: Amounts do not include any impacts from the previously announced potential spin-off of the Magneti Marelli business
• Appendix

• FCA monitors its operations through the use of various supplemental financial measures that may not be comparable to other similarly titled measures of other companies. Accordingly, investors and analysts should exercise appropriate caution in comparing these supplemental financial measures to similarly titled financial measures reported by other companies. Group management believes these supplemental financial measures provide comparable measures of its financial performance which then facilitate management’s ability to identify operational trends, as well as make decisions regarding future spending, resource allocations and other operational decisions.
• FCA’s supplemental financial measures are defined as follows:
• Earnings before interest, taxes, depreciation and amortization (“EBITDA”) is computed starting with Net profit and adding back Net financial expenses, Tax expense/(benefit) and depreciation and amortization expense
• Adjusted earnings before interest and taxes (“Adjusted EBIT”) excludes certain adjustments from Net profit including: gains/(losses) on the disposal of investments, restructuring, impairments, asset write-offs and unusual income/(expenses) that are considered rare or discrete events that are infrequent in nature, and also excludes Net financial expenses and Tax expense/(benefit)
• Adjusted net profit is calculated as Net profit excluding post-tax impacts of the same items excluded from Adjusted EBIT, as well as financial income/(expenses) and tax income/(expenses) considered rare or discrete events that are infrequent in nature Adjusted diluted EPS is calculated by adjusting Diluted EPS for the post-tax impact of the same items excluded from Adjusted EBIT, as well as financial income/(expenses) and tax income/(expenses) considered rare or discrete events that are infrequent in nature
• Net industrial cash/(debt) is computed as: Debt plus derivative financial liabilities related to industrial activities less (i) cash and cash equivalents, (ii) certain current debt securities, (iii) current financial receivables from Group or jointly controlled financial services entities and (iv) derivative financial assets and collateral deposits; therefore, debt, cash and cash equivalents and other financial assets/liabilities pertaining to financial services entities are excluded from the computation of Net industrial cash/(debt)
• Net industrial cash/(debt) should not be considered as a substitute for cash flows or other financial measures under IFRS; in addition, Net industrial cash/(debt) depends on the amount of cash and cash equivalents at each balance sheet date, which may be affected by the timing of monetization of receivables and the payment of accounts payable, as well as changes in other components of working capital, which can vary from period to period due to, among other things, cash management initiatives and other factors, some of which may be outside of the Group’s control. Net industrial cash/(debt) should therefore be evaluated alongside these other measures as reported under IFRS for a more complete view of the Company’s capital structure and liquidity. Supplemental financial measures
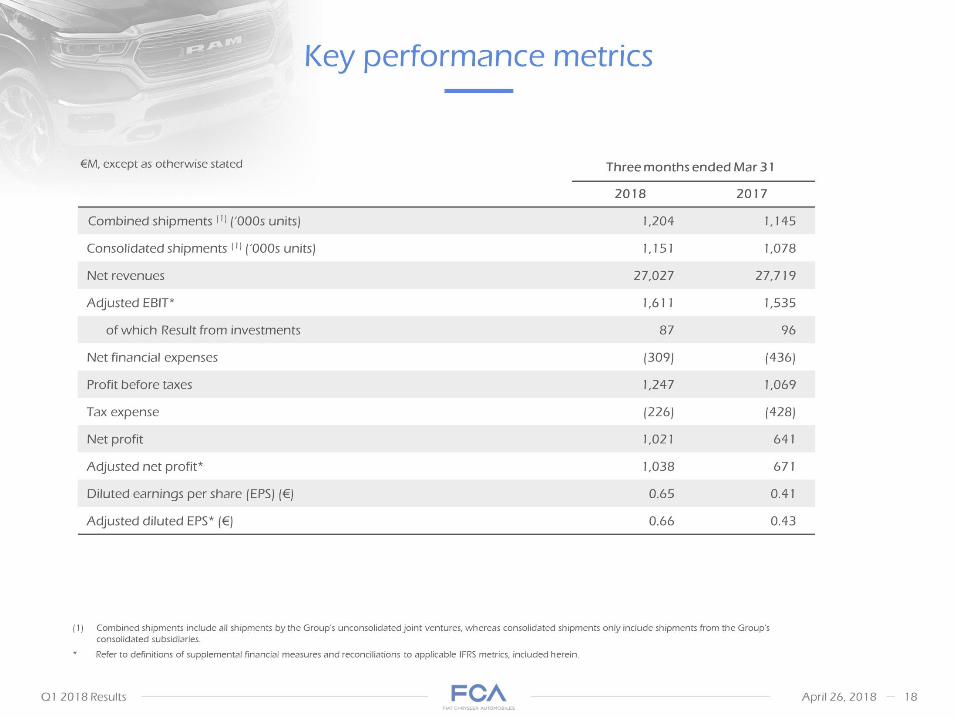
• Key performance metrics €M, except as otherwise stated Combined shipments include all shipments by the Group's unconsolidated joint ventures, whereas consolidated shipments only include shipments from the Group's consolidated subsidiaries.
• * Refer to definitions of supplemental financial measures and reconciliations to applicable IFRS metrics, included herein.

• Q1 ‘18 Adjusted EBIT excludes adjustments primarily related to:
• Special bonus payment of $2,000 to approximately 60,000 employees in NAFTA as a result of the Tax Cuts and Jobs Act
• Recovery of amounts accrued in 2016 in relation to costs for recall contested with a supplier €M, except as otherwise stated Reconciliation of Net profit to Adjusted EBIT
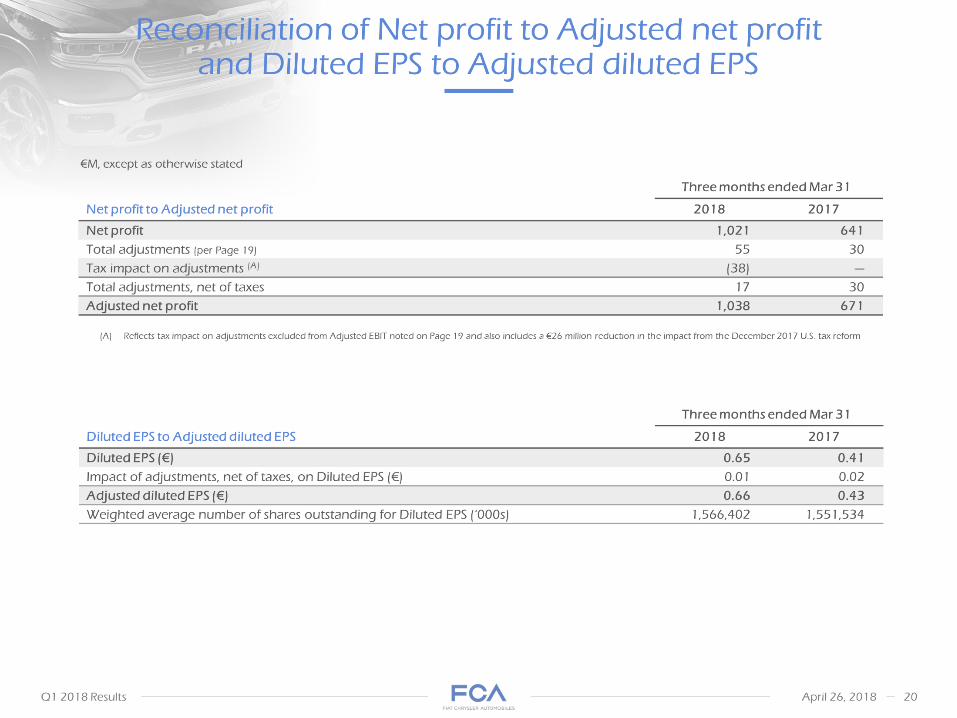
• Reconciliation of Net profit to Adjusted net profitand Diluted EPS to Adjusted diluted EPS Reflects tax impact on adjustments excluded from Adjusted EBIT noted on Page 19 and also includes a €26 million reduction in the impact from the December 2017 U.S. tax reform
• €M, except as otherwise stated

• Reconciliation of Debt to Net industrial debt €M
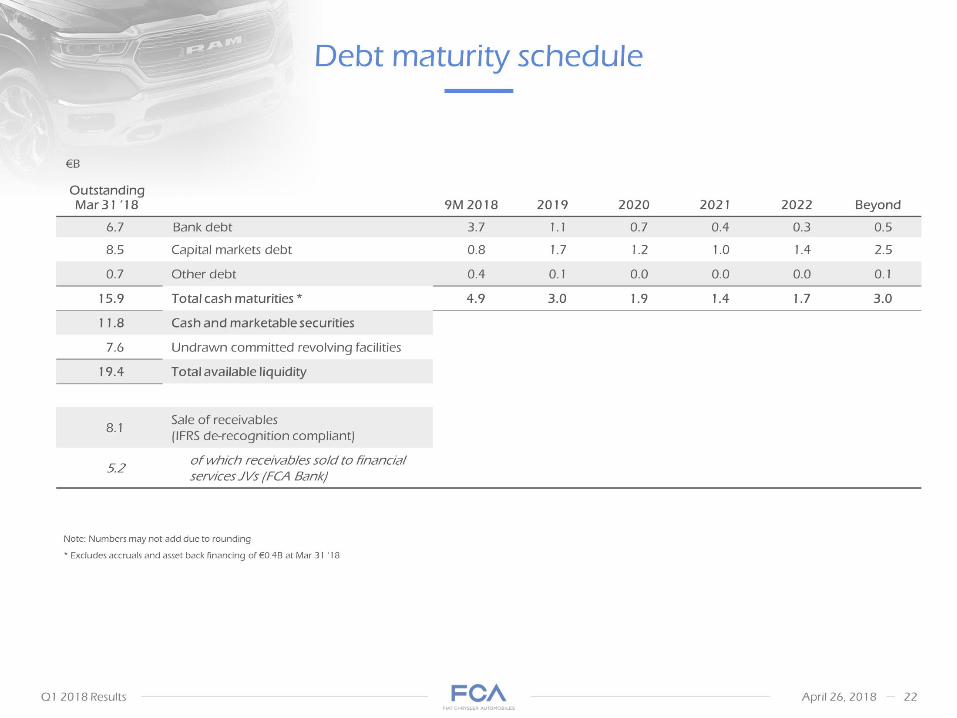
• Debt maturity schedule Note: Numbers may not add due to rounding
• * Excludes accruals and asset back financing of €0.4B at Mar 31 ‘18 €B
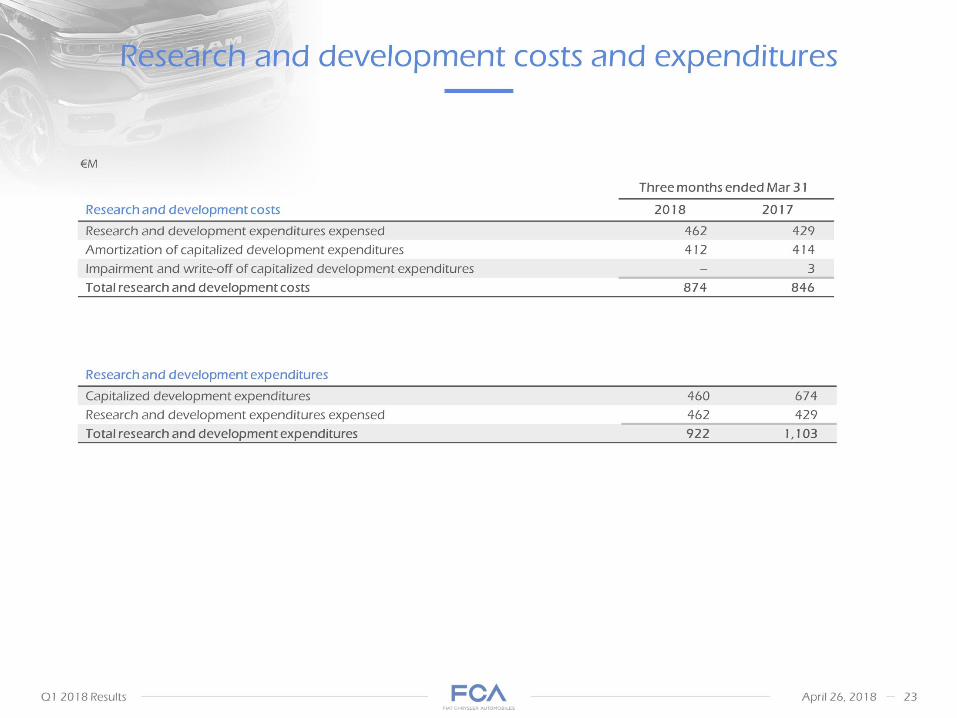
• Research and development costs and expenditures €M
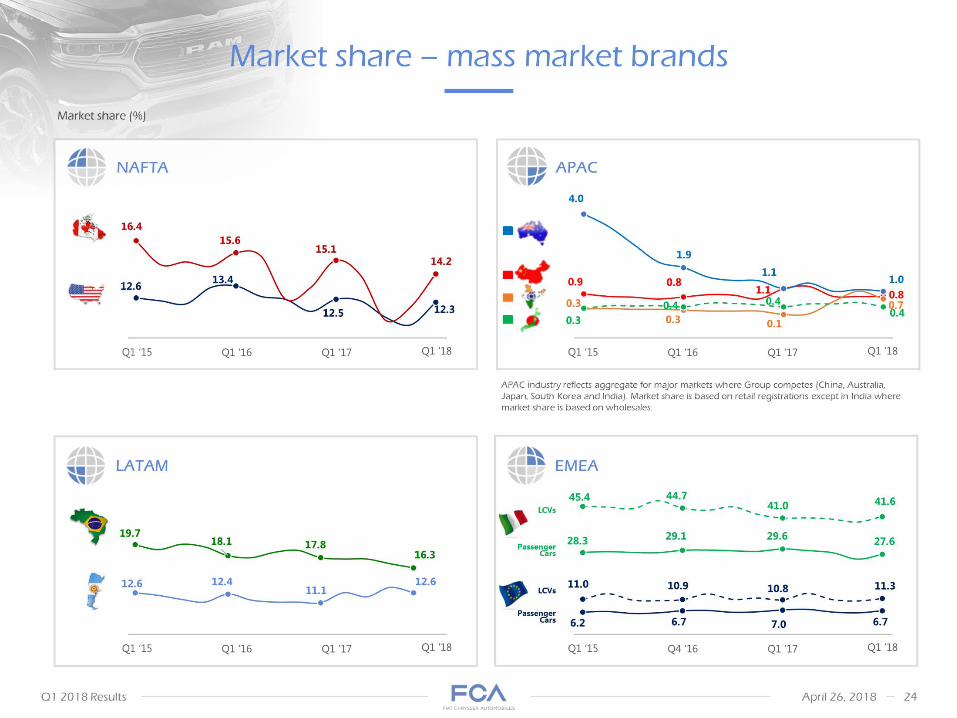
• Market share – mass market brands APAC industry reflects aggregate for major markets where Group competes (China, Australia, Japan, South Korea and India). Market share is based on retail registrations except in India where market share is based on wholesales. Market share (%) LATAM APAC EMEA Q4 ‘16 Q1 ’17 Q1 ‘18 Q1 ‘15 Q1 ‘16 LCVs Passenger Cars NAFTA

•