first quarter 2021 earnings conference call
TRANSCRIPT

First Quarter 2021Earnings Conference CallApril 29, 2021

Introduction Igor KhislavskyVice President, Investor Relations
Opening Remarks Tom BartlettPresident and Chief Executive Officer
Financial Results
Q&A
Rod SmithExecutive Vice President, Chief Financial Officer and Treasurer
Agenda
2

Forward-Looking Statements
3
“Safe Harbor” Statement under the Private Securities Litigation Reform Act of 1995: This presentation contains forward-looking statements concerning our goals, beliefs, strategies, future operating results and underlying assumptions. Actual results may differ materially from those indicated by these forward-looking statements as a result of various important factors, including those described in the appendix attached hereto, and in Item 1A of our Form 10-K for the year ended December 31, 2020 under the caption “Risk Factors,” and other filings we make with the Securities and Exchange Commission. We undertake no obligation to update the information contained in this presentation to reflect subsequently occurring events or circumstances. Definitions and reconciliations are provided at the end of the presentation.

$ in millions, except per share data Q1 2021 Q1 2020 Y/YChange
Y/Y FX-Neutral Change
Total Property Revenue $2,130 $1,973 7.9% 9.8%
Total Revenue $2,159 $1,993 8.3% 10.1%
Net income attributable to AMT Common Stockholders $645 $415 55.4% N/A
Per diluted share attributable to AMT $1.45 $0.93 55.9% N/A
Adjusted EBITDA $1,440 $1,271 13.3% 14.9%
Adjusted EBITDA Margin 66.7% 63.8%
Consolidated AFFO $1,123 $907 23.8% 25.9%
Per diluted share $2.52 $2.03 24.1% 26.1%
Consolidated Results Highlights
4
Definitions and reconciliations are provided at the end of this presentation.
4(1) See reconciliations for FX-neutral growth rates on page 22 of this presentation.(2) Q1 2021 growth rates positively impacted by approximately $95 million of foreign currency gains in the current period as compared to foreign currency losses of approximately $66 million in the prior-
year period.(3) The impact of foreign currency exchange rate fluctuations on net income attributable to AMT common stockholders and net income attributable to AMT common stockholders per diluted share is not
provided, as the impact on all components of the net income measure cannot be calculated without unreasonable effort.(4) Q1 2021 growth rates positively impacted by a one-time cash interest charge of approximately $63 million related to a payment in Q1 2020 to acquire MTN’s stakes in each of our joint ventures
in Ghana and Uganda.
(3)
(3)
(1)
(4)
(4)
(2)
(2)

Financial ResultsRod SmithExecutive Vice President, Chief Financial Officer and Treasurer

$1,973
$2,130
Q1 2020 Q1 2021
› Solid U.S. property revenue growth driven by comprehensive MLAs, contributions from new assets and accelerating 5G deployments
› International led by organic contributions in Latin America and Africa
Q1 2021 Property Revenue($ in millions)
6
Continued Elevated Global Demand for Communications Sites Continued Elevated Global Demand for Communications Sites
Organic Tenant Billings Growth Property Revenue
Definitions and reconciliations are provided at the end of this presentation.
(1) See reconciliations for FX-neutral growth rates on page 22 of this presentation.
7.9% Growth9.8% FX-neutral Growth(1)
7.8% Tenant Billings Growth
4.1% 3.6%5.0%
7.9% 7.4%
3.3%
(1.6%)
Total U.S. &Canada
Intl LatAm Africa Europe APAC

$907
$1,123
Q1 2020 Q1 2021
$1,271
$1,440
Q1 2020 Q1 202163.8% Margin
› Strong Adjusted EBITDA growth driven by solid revenue growth and cost discipline across the business
› High cash Adjusted EBITDA conversion, timing of cash taxes and maintenance capex, and non-recurrence of Q1 2020 1x cash interest expense item driving elevated Consolidated AFFO growth
Q1 2021 Adjusted EBITDA and Consolidated AFFO(1)($ in millions, except per share data)
7
Continue to Generate Sustainable, Recurring Cash Flow GrowthContinue to Generate Sustainable, Recurring Cash Flow Growth
13.3% Growth14.9% FX-neutral Growth
23.8% Growth24.1% Per Share Growth
26.1% FX-neutral Per Share Growth
$2.03/Share $2.52/Share66.7% Margin
Adjusted EBITDA
Definitions and reconciliations are provided at the end of this presentation.
(1) See reconciliations for FX-neutral growth rates on page 22 of this presentation.(2) Q1 2021 growth rates positively impacted by a one-time cash interest charge of approximately $63 million related to a payment in Q1 2020 to acquire MTN’s stakes in each
of our joint ventures in Ghana and Uganda.
Consolidated AFFO(2)
(2)

(1) Reflects 2021 outlook midpoints, as reported in the Company’s Form 8-K dated April 29, 2021.(2) Does not include impact from our pending acquisition of Telxius Telecom, S.A.’s European and Latin American tower divisions (the “Pending Telxius Acquisition”).
Updating Property Revenue Outlook(1)(2)($ in millions)
8
› Solid global demand trends supporting consistent expectations for core business› Expect to add meaningful additional revenue through closing of Pending Telxius
Acquisition later in 2021
Definitions and reconciliations are provided at the end of this presentation.
7.5% Growth vs. 2020, with Nearly $600 Million in Incremental Property Revenue
Prior Outlook Straight-line/Pass-through
FX Current Outlook
(~$48)~$23$8,575 $8,550

› Core leasing trends consistent with prior assumptions across all regions› Continue to expect gross new business activity in U.S. & Canada to ramp up in the
back half of 2021, driven by accelerating 5G deployments› Gross new business trends in Europe improving, particularly in Germany
~3%
~5%
>8%~7%
>3%
~0%
~4%
Total U.S. & Canada International Africa LatAm Europe APAC
Reiterating Organic Tenant Billings Growth Outlook(1)
9
Definitions and reconciliations are provided at the end of this presentation.
~3-4%
>4%
Impact of Sprint Churn(2)
(1) Reflects 2021 outlook midpoints, as reported in the Company’s Form 8-K dated April 29, 2021.(2) Sprint churn reflects both churn as part of MLA with T-Mobile US, Inc. (the “T-Mobile MLA”) and churn that is expected to occur outside of the T-Mobile MLA.

$5,640 $5,650~$3 ~$4
(~$30)
10(1) Reflects 2021 outlook midpoints, as reported in the Company’s Form 8-K dated April 29, 2021.(2) Does not include impact from our Pending Telxius Acquisition.(3) See reconciliation for cash SG&A as a percent of total property revenue on page 24 of this presentation.
› Cash gross margin growth includes significant expected acceleration in services segment
› Cash SG&A as a percent of total property revenue expected to be 7.2%(3) at the midpoint, down ~90 basis points year over year and ~10 basis points vs. prior outlook
Definitions and reconciliations are provided at the end of this presentation.
64.9% Margin
Raising Adjusted EBITDA Outlook(1)(2)($ in millions)
9.6% Growth vs. 2020, +$10m vs. Prior Outlook
Services Gross Margin
Net Straight-line Cash SG&A FX
64.8% Margin
~$33
Prior Outlook Current Outlook
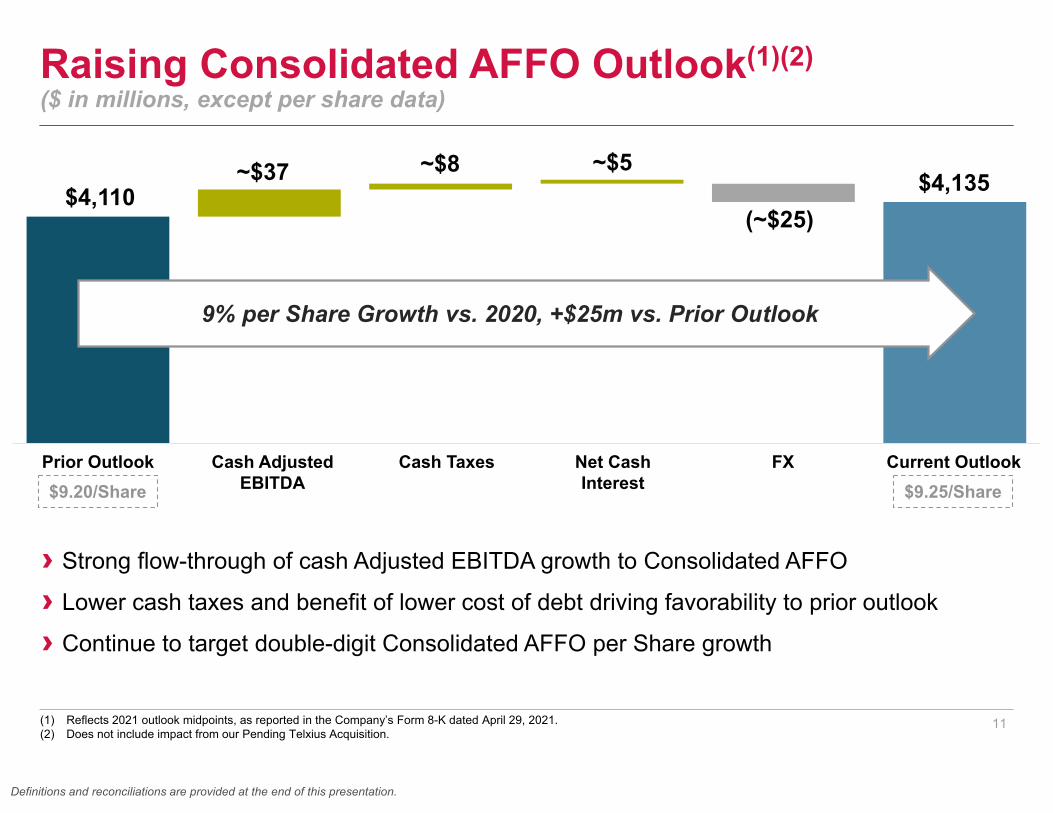
Raising Consolidated AFFO Outlook(1)(2)($ in millions, except per share data)
11(1) Reflects 2021 outlook midpoints, as reported in the Company’s Form 8-K dated April 29, 2021.(2) Does not include impact from our Pending Telxius Acquisition.
› Strong flow-through of cash Adjusted EBITDA growth to Consolidated AFFO
› Lower cash taxes and benefit of lower cost of debt driving favorability to prior outlook
› Continue to target double-digit Consolidated AFFO per Share growth
Definitions and reconciliations are provided at the end of this presentation.
$9.20/Share
9% per Share Growth vs. 2020, +$25m vs. Prior Outlook
Prior Outlook Current OutlookCash Adjusted EBITDA
Cash Taxes FX$9.25/Share
$4,110~$37
(~$25)$4,135
Net Cash Interest
~$8 ~$5

M&A$9.7
Common Stock
Dividends$2.3
DiscretionaryCapex$1.3
Consolidated AFFO per Share
12(1) Reflects common stock dividends declared and expected in 2021. Future dividends are subject to board approval. (2) Includes approximately $9.4 billion committed to the Pending Telxius Acquisition as well as approximately $177 million to redeem Macquarie’s shares in ATC TIPL.(3) Subject to regulatory approval and customary closing conditions.
2021E Capital Deployment
Disciplined Capital Allocation($ in billions, except per share data, totals may not add due to rounding)
› Consistent expectations for overall capital deployment in 2021, with slight increases for land and start-up capex› Remain focused on driving solid Consolidated AFFO per Share and dividend growth, with
continued investments in growth assets on a global basis
2011 2021E
Transformational Telxius Transaction on Track to Begin Adding Value in Q2 2021(3)Transformational Telxius Transaction on Track to Begin Adding Value in Q2 2021(3)
(1) (2)
$2.64
Definitions and reconciliations are provided at the end of this presentation.
Non-Discretionary
Capex$0.2
$9.25
Telxius Update
› On track to close majority of sites in Q2, with additional closing(s) expected in Q3(3)
› Making progress on financing front, including with potential private capital partners
Impact of Tata Settlement

12%
15%
10% 10%8%
TotalIntl
APAC Africa LatAm Europe
Day 1 New Build NOI Yield
13(1) Reflects 2021 outlook midpoints, as reported in the Company’s Form 8-K dated April 29, 2021.(2) Day 1 NOI yields for new builds completed in Q1 2021.
Attractive International New Build Program
› Double-digit average day one NOI yields on new builds across the international portfolio, with future colocation expected to provide additional upside› Carrier demand for new sites remains elevated as densification efforts and new technology
rollouts accelerate in international markets
Global New Build Program Expected to Continue to Drive Strong ReturnsGlobal New Build Program Expected to Continue to Drive Strong Returns
(2)
Definitions and reconciliations are provided at the end of this presentation.
2021E New Builds by RegionHistorical New Build Trend
2016 2021E
1,869
6,500
APAC Africa LatAm Europe
~600
~4,500
~1,300~100
(1)
(1)
Strong First Quarter› Healthy demand trends driving solid organic growth and new build activity throughout global
footprint
› Signed agreements for transformational Telxius Towers transaction
› Signed value-additive, long term MLA with DISH
› Continued opportunistic refinancing at attractive rates
Positioned to Execute in 2021 and Beyond› Energized by accelerating 5G momentum in the U.S.
› Leveraging constructive demand environment internationally to drive sustainable, long-term growth
› Remain focused on operational efficiency and platform expansion initiatives to drive further upside over time
In Summary
14
Definitions and reconciliations are provided at the end of this presentation.

Definitions
15
Adjusted EBITDA: Net income before income (loss) from equity method investments; Income tax benefit (provision); Other income (expense); Gain (loss) on retirement of long-term obligations; Interest expense; Interest income; Other operating income (expense); Depreciation, amortization and accretion; and Stock-based compensation expense. The Company believes this measure provides valuable insight into the profitability of its operations while at the same time taking into account the central overhead expenses required to manage its global operations. In addition, it is a widely used performance measure across the telecommunications real estate sector.
Adjusted EBITDA Margin: The percentage that results from dividing Adjusted EBITDA by total revenue.
Consolidated Adjusted Funds From Operations, or Consolidated AFFO: Nareit FFO attributable to American Tower Corporation common stockholders before (i) straight-line revenue and expense, (ii) stock-based compensation expense, (iii) the deferred portion of income tax, (iv) non-real estate related depreciation, amortization and accretion, (v) amortization of deferred financing costs, capitalized interest, debt discounts and premiums and long-term deferred interest charges, (vi) other income (expense), (vii) gain (loss) on retirement of long-term obligations, (viii) other operating income (expense), and adjustments for (ix) unconsolidated affiliates and (x) noncontrolling interests, less cash payments related to capital improvements and cash payments related to corporate capital expenditures. The Company believes this measure provides valuable insight into the operating performance of its property assets by further adjusting the Nareit FFO attributable to American Tower Corporation common stockholders metric to exclude the factors outlined above, which if unadjusted, may cause material fluctuations in Nareit FFO attributable to American Tower Corporation common stockholders growth from period to period that would not be representative of the underlying performance of the Company’s property assets in those periods. In addition, it is a widely used performance measure across the telecommunications real estate sector.
Consolidated AFFO per Share: Consolidated AFFO divided by the diluted weighted average common shares outstanding.
Churn: Tenant Billings lost when a tenant cancels or does not renew its lease or, in limited circumstances, when the lease rates on existing leases are reduced.
Indian Carrier Consolidation-Driven Churn (ICCC): Tenant cancellations specifically attributable to short-term carrier consolidation in India. Includes impacts of carrier exits from the marketplace and carrier cancellations as a result of consolidation, but excludes normal course churn. In prior periods, the Company provided this additional metric to enhance transparency and provide a better understanding of its recurring business.
International Pass-through Revenues: In several of our international markets we pass through certain operating expenses to our tenants, including in Latin America where we primarily pass through ground rent expenses, and in India and South Africa, where we primarily pass through power and fuel costs. We record pass-through as revenue and a corresponding offsetting expense for these events.
Nareit Funds From Operations Attributable to American Tower Corporation Common Stockholders: Net income before gains or losses from the sale or disposal of real estate, real estate related impairment charges, real estate related depreciation, amortization and accretion and dividends on preferred stock, and including adjustments for (i) unconsolidated affiliates and (ii) noncontrolling interests. The Company believes this measure provides valuable insight into the operating performance of its property assets by excluding the charges described above, particularly depreciation expenses, given the high initial, up-front capital intensity of the Company’s operating model. In addition, it is a widely used performance measure across the telecommunications real estate sector.
Net Leverage Ratio: Net debt (total long-term debt, including current portion, and for periods beginning in the first quarter of 2019, finance lease liabilities, less cash and cash equivalents) divided by the quarter’s annualized Adjusted EBITDA. The Company believes that including this calculation is important for investors and analysts given it is a critical component underlying its credit agency ratings.
NOI Yield: The percentage that results from dividing gross margin by total investment.
New Site Tenant Billings Growth: The portion of Tenant Billings Growth attributable to New Site Tenant Billings. The Company believes this measure provides valuable insight into the growth attributable to Tenant Billings from recently acquired or constructed properties. The Company believes this measure provides valuable insight into the growth attributable to Tenant Billings from recently acquired or constructed properties.
New Site Tenant Billings: Day-one Tenant Billings associated with sites that have been built or acquired since the beginning of the prior-year period. Incremental colocations/amendments, escalations or cancellations that occur on these sites after the date of their addition to our portfolio are not included in New Site Tenant Billings. The Company believes providing New Site Tenant Billings enhances an investor’s ability to analyze the Company’s existing real estate portfolio growth as well as its development program growth, as the Company’s construction and acquisition activities can drive variability in growth rates from period to period.

Definitions(continued)
16
Organic Tenant Billings: Tenant Billings on sites that the Company has owned since the beginning of the prior-year period, as well as Tenant Billings activity on new sites that occurred after the date of their addition to the Company’s portfolio.
Organic Tenant Billings Growth: The portion of Tenant Billings Growth attributable to Organic Tenant Billings. The Company believes that organic growth is a useful measure of its ability to add tenancy and incremental revenue to its assets for the reported period, which enables investors and analysts to gain additional insight into the relative attractiveness, and therefore the value, of the Company’s property assets.
Segment Gross Margin: Segment revenue less segment operating expenses, excluding stock-based compensation expense recorded in costs of operations; depreciation, amortization and accretion; selling, general, administrative and development expense; and other operating expenses. For periods through the third quarter of 2018, Latin America Property segment includes interest income (expense), TV Azteca, net.
Segment Operating Profit: Segment gross margin less segment selling, general, administrative and development expense attributable to the segment, excluding stock-based compensation expense and corporate expenses. For periods through the third quarter of 2018, Latin America Property segment includes interest income (expense), TV Azteca, net.
Return on Invested Capital: Adjusted EBITDA less maintenance capital expenditures and corporate capital expenditures and cash taxes, divided by gross property, plant and equipment, intangible assets and goodwill (excluding the impact of recording deferred tax adjustments related to valuation).
Straight-line expenses: We calculate straight-line ground rent expense for our ground leases based on the fixed non-cancellable term of the underlying ground lease plus all periods, if any, for which failure to renew the lease imposes an economic penalty to us such that renewal appears, at the inception of the lease, to be reasonably assured. Certain of our tenant leases require us to exercise available renewal options pursuant to the underlying ground lease, if the tenant exercises its renewal option. For towers with these types of tenant leases at the inception of the ground lease, we calculate our straight-line ground rent over the term of the ground lease, including all renewal options required to fulfill the tenant lease obligation.
Straight-line revenues: We calculate straight-line rental revenues from our tenants based on the fixed escalation clauses present in non-cancellable lease agreements, excluding those tied to the Consumer Price Index or other inflation-based indices, and other incentives present in lease agreements with our tenants. We recognized revenues on a straight-line basis over the fixed, non-cancellable terms of the applicable leases.
Tenant Billings: The majority of the Company’s revenue is generated from non-cancellable, long-term tenant leases. Revenue from Tenant Billings reflects several key aspects of the Company’s real estate business: (i) “colocations/amendments” reflects new tenant leases for space on existing sites and amendments to existing leases to add additional tenant equipment; (ii) “escalations” reflects contractual increases in billing rates, which are typically tied to fixed percentages or a variable percentage based on a consumer price index; (iii) “cancellations” reflects the impact of tenant lease terminations or non-renewals or, in limited circumstances, when the lease rates on existing leases are reduced; and (iv) “new sites” reflects the impact of new property construction and acquisitions.
Tenant Billings Growth: The increase or decrease resulting from a comparison of Tenant Billings for a current period with Tenant Billings for the corresponding prior-year period, in each case adjusted for foreign currency exchange rate fluctuations. The Company believes this measure provides valuable insight into the growth in recurring Tenant Billings and underlying demand for its real estate portfolio.

This presentation contains “forward-looking statements” concerning our goals, beliefs, expectations, strategies, objectives, plans, future operating results and underlying assumptions and other statements that are not necessarily based on historical facts. Examples of these statements include, but are not limited to, statements regarding our full year 2021 outlook and other targets, foreign currency exchange rates, our expectations for the closing of signed acquisitions, including the Pending Telxius Acquisition, our expectations for the redemption of shares in ATC TIPL, our expectations regarding the potential impacts of the Adjusted Gross Revenue court ruling in India and factors that could affect such expectations, our expectations regarding the impacts of COVID-19 and actions in response to the pandemic on our business and our operating results and factors that could affect such expectations and our expectations regarding the leasing demand for communications real estate. Actual results may differ materially from those indicated in our forward-looking statements as a result of various important factors, including: (1) a significant decrease in leasing demand for our communications infrastructure would materially and adversely affect our business and operating results, and we cannot control that demand; (2) if our tenants consolidate their operations, exit the telecommunications business or share site infrastructure to a significant degree, our growth, revenue and ability to generate positive cash flows could be materially and adversely affected; (3) a substantial portion of our revenue is derived from a small number of tenants, and we are sensitive to adverse changes in the creditworthiness and financial strength of our tenants; (4) increasing competition within our industry may materially and adversely affect our revenue; (5) our expansion initiatives involve a number of risks and uncertainties, including those related to integrating acquired or leased assets, that could adversely affect our operating results, disrupt our operations or expose us to additional risk; (6) new technologies or changes in our or a tenant’s business model could make our tower leasing business less desirable and result in decreasing revenues and operating results; (7) competition for assets could adversely affect our ability to achieve our return on investment criteria; (8) our leverage and debt service obligations may materially and adversely affect our ability to raise additional financing to fund capital expenditures, future growth and expansion initiatives and to satisfy our distribution requirements; (9) restrictive covenants in the agreements related to our securitization transactions, our credit facilities and our debt securities could materially and adversely affect our business by limiting flexibility, and we may be prohibited from paying dividends on our common stock, which may jeopardize our qualification for taxation as a REIT; (10) we may be adversely affected by changes in LIBOR reporting practices, the method in which LIBOR is determined or the use of alternative reference rates; (11) our business, and that of our tenants, is subject to laws, regulations and administrative and judicial decisions, and changes thereto, that could restrict our ability to operate our business as we currently do or impact our competitive landscape; (12) our foreign operations are subject to economic, political and other risks that could materially and adversely affect our revenues or financial position, including risks associated with fluctuations in foreign currency exchange rates; (13) if we fail to remain qualified for taxation as a REIT, we will be subject to tax at corporate income tax rates, which may substantially reduce funds otherwise available, and even if we qualify for taxation as a REIT, we may face tax liabilities that impact earnings and available cash flow; (14) complying with REIT requirements may limit our flexibility or cause us to forego otherwise attractive opportunities;
Risk Factors
17

(15) we could have liability under environmental and occupational safety and health laws; (16) our towers, fiber networks, data centers or computer systems may be affected by natural disasters, security breaches and other unforeseen events for which our insurance may not provide adequate coverage; (17) our costs could increase and our revenues could decrease due to perceived health risks from radio emissions, especially if these perceived risks are substantiated; (18) if we are unable to protect our rights to the land under our towers, it could adversely affect our business and operating results; and (19) if we are unable or choose not to exercise our rights to purchase towers that are subject to lease and sublease agreements at the end of the applicable period, our cash flows derived from those towers will be eliminated. For additional information regarding factors that may cause actual results to differ materially from those indicated in our forward-looking statements, we refer you to the information contained in Item 1A of our Form 10-K for the year ended December 31, 2020, under the caption “Risk Factors.” We undertake no obligation to update the information contained in this presentation to reflect subsequently occurring events or circumstances.
Risk Factors(continued)
18

RECONCILIATION OF ADJUSTED EBITDA TO NET INCOME
2011 2012 2013 2014 2015 2016 2017 2018 2019 2020 1Q20 1Q21Net income $382 $594 $482 $803 $672 $970 $1,225 $1,265 $1,917 $1,692 $419 $652Income from equity method investments (0) (0) - - - - - - - - - -Income tax provision (benefit) 125 107 60 63 158 156 31 (110) (0) 130 21 50Other expense (income) 123 38 208 62 135 48 (31) (24) (18) 241 64 (95)Loss (gain) on retirement of long-term obligations - 0 39 4 80 (1) 70 3 22 72 35 26Interest expense 312 402 458 580 596 717 750 826 814 794 209 207Interest income (7) (8) (10) (14) (17) (26) (35) (55) (47) (40) (10) (11)Other operating expenses 58 62 72 69 67 73 256 513 166 266 14 50Depreciation, amortization and accretion 556 644 800 1,004 1,285 1,526 1,716 2,111 1,778 1,882 472 523Stock-based compensation expense 47 52 68 80 91 90 109 138 111 121 48 38ADJUSTED EBITDA $1,595 $1,892 $2,176 $2,650 $3,067 $3,553 $4,090 $4,667 $4,745 $5,156 $1,271 $1,440Divided by total revenue $2,444 $2,876 $3,361 $4,100 $4,772 $5,786 $6,664 $7,440 $7,580 $8,042 $1,993 $2,159ADJUSTED EBITDA MARGIN 65% 66% 65% 65% 64% 61% 61% 63% 63% 64% 64% 67%
AFFO RECONCILIATION
2011 2012 2013 2014 2015 2016 2017 2018 2019 2020 1Q20 1Q21Adjusted EBITDA $1,595 $1,892 $2,176 $2,650 $3,067 $3,553 $4,090 $4,667 $4,745 $5,156 $1,271 $1,440Straight-line revenue (144) (166) (148) (124) (155) (132) (194) (88) (184) (322) (56) (120)Straight-line expense 31 34 30 38 56 68 62 58 44 52 13 15Cash interest (301) (381) (435) (572) (573) (694) (723) (807) (800) (824) (264) (198)Interest Income 7 8 10 14 16 26 35 55 47 40 10 11Cash paid for income taxes (54) (69) (52) (69) (64) (96) (137) (164) (147) (146) (35) (6)Dividends on preferred stock - - - (24) (90) (107) (87) (9) - - - -Dividends to noncontrolling interest holders - - - - - - (13) (14) (13) (8) - -Capital improvement Capex (61) (75) (81) (75) (90) (110) (114) (150) (160) (150) (30) (18)Corporate Capex (19) (20) (30) (24) (16) (16) (17) (9) (11) (9) (1) (1)Consolidated AFFO $1,055 $1,223 $1,470 $1,815 $2,150 $2,490 $2,902 $3,539 $3,521 $3,788 $907 $1,123Adjustments for noncontrolling interests (1) (16) (30) (24) (34) (90) (147) (349) (79) (25) 39 (23)AFFO Attributable to Common Stockholders $1,055 $1,207 $1,439 $1,791 $2,116 $2,400 $2,755 $3,191 $3,442 $3,764 $945 $1,100Divided by weighted average diluted shares outstanding 400.2 399.6 399.1 400.1 423.0 429.3 431.7 443.0 445.5 446.1 445.8 446.3Consolidated AFFO per Share 2.64$ 3.06$ 3.68$ 4.54$ 5.08$ 5.80$ 6.72$ 7.99$ 7.90$ 8.49$ 2.03$ 2.52$ AFFO Attributable to Common Stockholders per Share 2.64$ 3.02$ 3.61$ 4.48$ 5.00$ 5.59$ 6.38$ 7.20$ 7.73$ 8.44$ 2.12$ 2.46$
19
Historical Reconciliations($ in millions, totals may not add due to rounding)
(1) Includes one-time net positive impacts to 2018 Adjusted EBITDA and Consolidated AFFO related to the Company's settlement with Tata in Q4 2018. (2) Calculation of Consolidated AFFO excludes start-up related capital spending in 2012-2021.(3) In Q2 2019, the Company made a capitalized interest payment of approximately $14 million associated with the purchase of the shareholder loan previously held by its joint venture partner in Ghana. In Q1 2020, the Company made a capitalized interest payment of approximately $63 million associated with the acquisition of MTN's redeemable noncontrolling interests in each of our joint ventures in Ghana and Uganda. In each case, the deferred interest was previously expensed but excluded from Consolidated AFFO. (4) Excludes one-time GTP cash tax charge incurred during the third quarter of 2015.
(1)
(2)
(3)
(4)
(1)

Current 2021 Outlook Reconciliations(1)(2)($ in millions, totals may not add due to rounding)
20(1) As reported in the Company's Form 8-K dated April 29, 2021.(2) The Company’s outlook is based on the following average foreign currency exchange rates to 1.00 U.S. Dollar for April 29, 2021 through December 31, 2021:(a) 114
Argentinean Pesos; (b) 1.31 Australian Dollars (c) 5.65 Brazilian Reais; (d) 1.26 Canadian Dollars (e) 730 Chilean Pesos; (f) 3,650 Colombian Pesos; (g) 0.84 Euros; (h) 5.85 Ghanaian Cedis; (i) 73.80 Indian Rupees; (j) 112 Kenyan Shillings; (k) 20.40 Mexican Pesos; (l) 415 Nigerian Naira; (m) 6,390 Paraguayan Guarani; (n) 3.70 Peruvian Soles; (o) 3.85 Polish Zloty; (p) 14.75 South African Rand; (q) 3,690 Ugandan Shillings; and (r) 550 West African CFA Francs.
Reconciliations of Outlook for Adjusted EBITDA to Net Income:
Net income $2,275 to $2,375Interest expense 850 to 830 Depreciation, amortization and accretion 2,080 to 2,100 Income tax provision 200 to 210 Stock-based compensation expense 120 - 120 Other, including other operating expenses, interest income, gain (loss) on retirement of long-term
obligations and other income (expense) 75 to 65 Adjusted EBITDA 5,600$ to 5,700$
Reconciliations of Outlook for Consolidated Adjusted Funds From Operations to Net Income:
Net income $2,275 to $2,375Straight-line revenue (438) - (438) Straight-line expense 65 - 65 Depreciation, amortization and accretion 2,080 to 2,100 Stock-based compensation expense 120 - 120 Deferred portion of income tax 7 - 7 Amortization of deferred financing costs, capitalized interest and debt discounts and premiums and
long-term deferred interest charges 36 - 36 Other, including dividends to noncontrolling interest holders, other operating expense, loss on retirement
of long-term obligations and other income (expense) 105 to 95 Capital improvement capital expenditures (160) to (170) Corporate capital expenditures (5) - (5)
Consolidated Adjusted Funds From Operations 4,085$ to 4,185$
Full Year 2021
Full Year 2021

Prior 2021 Outlook Reconciliations(1)(2)($ in millions, totals may not add due to rounding)
21
Reconciliations of Outlook for Adjusted EBITDA to Net Income:
Net income $2,165 to $2,265Interest expense 860 to 840 Depreciation, amortization and accretion 2,105 to 2,125 Income tax provision 205 to 215 Stock-based compensation expense 120 - 120 Other, including other operating expenses, interest income, gain (loss) on retirement of long-term
obligations and other income (expense) 135 to 125 Adjusted EBITDA 5,590$ to 5,690$
Reconciliations of Outlook for Consolidated Adjusted Funds From Operations to Net Income:
Net income $2,165 to $2,265Straight-line revenue (435) - (435) Straight-line expense 65 - 65 Depreciation, amortization and accretion 2,105 to 2,125 Stock-based compensation expense 120 - 120 Deferred portion of income tax - - -Amortization of deferred financing costs, capitalized interest and debt discounts and premiums and
long-term deferred interest charges 37 - 37 Other, including dividends to noncontrolling interest holders, other operating expense, loss on retirement
of long-term obligations and other income (expense) 168 to 158 Capital improvement capital expenditures (160) to (170) Corporate capital expenditures (5) - (5)
Consolidated Adjusted Funds From Operations 4,060$ to 4,160$
Full Year 2021
Full Year 2021
(1) As reported in the Company's Form 8-K dated February 25, 2021.(2) The Company’s outlook is based on the following average foreign currency exchange rates to 1.00 U.S. Dollar for February 25, 2021 through December 31, 2021:(a)
107 Argentinean Pesos; (b) 1.30 Australian Dollars (c) 5.40 Brazilian Reais; (d) 1.27 Canadian Dollars (e) 730 Chilean Pesos; (f) 3,520 Colombian Pesos; (g) 0.82 Euros; (h) 5.90 Ghanaian Cedis; (i) 73.10 Indian Rupees; (j) 111 Kenyan Shillings; (k) 20.00 Mexican Pesos; (l) 400 Nigerian Naira; (m) 6,900 Paraguayan Guarani; (n) 3.65 Peruvian Soles; (o) 3.75 Polish Zloty; (p) 15.15 South African Rand; (q) 3,690 Ugandan Shillings; and (r) 540 West African CFA Francs.

2021 FX-Neutral Reconciliations($ in millions, except per share amounts, totals may not add due to rounding)
22
Q1 2020 Q1 2021Growth
RateEstimated FX Impact Q1 2020
Q1 2021 FX-Neutral
FX-Neutral Growth Rate
Total Property Revenue $1,973 $2,130 7.9% (~$37) $1,973 $2,166 9.8%International Property Revenue 883 898 1.7% (~37) 883 935 5.8%Total Revenue 1,993 2,159 8.3% (~37) 1,993 2,195 10.1%Adjusted EBITDA 1,271 1,440 13.3% (~21) 1,271 1,461 14.9%Consolidated AFFO 907 1,123 23.8% (~19) 907 1,142 25.9%Consolidated AFFO per Share $2.03 $2.52 24.1% (~$0.04) $2.03 $2.56 26.1%

NOI Yield Reconciliations
23
$ in billionsU.S. & Canada NOI Yield by Vintage
Pre-2010 TotalCash Gross Margin 2.4$ 3.7$ Divided by: Gross Investment 11.8$ 31.9$ NOI Yield % 20.2% 11.5%
$ in thousandsQ1 2021 International New Build NOI YieldAverage Cash Gross Margin 5.8$ Divided By: Average Construction Cost 50.3$
Average NOI Yield 12%Q1 2021 APAC New Build NOI YieldAverage Cash Gross Margin 3.2$ Divided By: Average Construction Cost 21.5$
Average NOI Yield 15%Q1 2021 Africa New Build NOI YieldAverage Cash Gross Margin 12.2$ Divided By: Average Construction Cost 118.5$
Average NOI Yield 10%Q1 2021 Europe New Build NOI YieldAverage Cash Gross Margin 13.4$ Divided By: Average Construction Cost 162.5$
Average NOI Yield 8%Q1 2021 LatAm New Build NOI YieldAverage Cash Gross Margin 6.7$ Divided By: Average Construction Cost 66.7$
Average NOI Yield 10%

Cash SG&A as % of Property Revenue 1Q21 2021E(1)
Cash SG&A 140$ 612$ Divided by: Property Revenue 2,130$ 8,550$ Cash SG&A as % of Property Revenue 6.6% 7.2%
Other Reconciliations($ in millions, except per share amounts, totals may not add due to rounding)
24(1) 2021E reflects 2021 outlook midpoints, as reported in the Company’s Form 8-K dated April 29, 2021.(2) Excludes stock-based compensation expense. Also excludes SG&A attributable to services segment.
(2)
Consolidated AFFO Reconciliation Q1 2020 Q1 2021 Growth RateConsolidated AFFO, as Reported $907 $1,123 23.8%Add: Cash Interest Payment for MTN JV stakes 63 -Consolidated AFFO, excluding Cash Interest Payment for MTN JV stakes $970 $1,123 15.7%
Divided by: Diluted Shares Outstanding 445.8 446.3
Consolidated AFFO per Share, as Reported $2.03 $2.52 24.1%Consolidated AFFO per Share, before Cash Interest Payment for MTN JV stakes $2.18 $2.52 15.6%