foodborne illness data 2006 us
TRANSCRIPT
DOI: 10.3201/eid1701.P11101
Suggested citation for this article: Scallan E, Hoekstra RM, Angulo FJ, Tauxe RV, Widdowson
M-A, Roy SL, et al. Foodborne illness acquired in the United States—major pathogens. Emerg
Infect Dis. 2011 Jan; [Epub ahead of print]
Foodborne Illness Acquired in the United States—Major Pathogens
Elaine Scallan,1 Robert M. Hoekstra, Frederick J. Angulo, Robert V. Tauxe,
Marc-Alain Widdowson, Sharon L. Roy, Jeffery L. Jones, and Patricia M. Griffin
Author affiliation: Centers for Disease Control and Prevention, Atlanta, Georgia, USA
1Current affiliation: Colorado School of Public Health, Aurora, Colorado, USA.
Estimates of foodborne illness can be used to direct food safety policy and interventions. We used data
from active and passive surveillance and other sources to estimate that each year 31 major pathogens
acquired in the United States caused 9.4 million episodes of foodborne illness (90% credible interval [CrI]
6.6–12.7 million), 55,961 hospitalizations (90% CrI 39,534–75,741), and 1,351 deaths (90% CrI 712–
2,268). Most (58%) illnesses were caused by norovirus, followed by nontyphoidal Salmonella spp. (11%),
Clostridium perfringens (10%), and Campylobacter spp. (9%). Leading causes of hospitalization were
nontyphoidal Salmonella spp. (35%), norovirus (26%), Campylobacter spp. (15%), and Toxoplasma
gondii (8%). Leading causes of death were nontyphoidal Salmonella spp. (28%), T. gondii (24%), Listeria
monocytogenes (19%), and norovirus (11%). These estimates cannot be compared with prior (1999)
estimates to assess trends because different methods were used. Additional data and more refined
methods can improve future estimates.
Estimates of the overall number of episodes of foodborne illness are helpful for allocating
resources and prioritizing interventions. However, arriving at these estimates is challenging
because food may become contaminated by many agents (e.g., a variety of bacteria, viruses,
parasites, and chemicals), transmission can occur by nonfood mechanisms (e.g., contact with
animals or consumption of contaminated water), the proportion of disease transmitted by food
Page 1 of 21
differs by pathogen and by host factors (e.g. age and immunity), and only a small proportion of
illnesses are confirmed by laboratory testing and reported to public health agencies.
Laboratory-based surveillance provides crucial information for assessing foodborne
disease trends. However, because only a small proportion of illnesses are diagnosed and
reported, periodic assessments of total episodes of illness are also needed. (Hereafter, episodes of
illness are referred to as illnesses.) Several countries have conducted prospective population-
based or cross-sectional studies to supplement surveillance and estimate the overall number of
foodborne illnesses (1). In 2007, the World Health Organization launched an initiative to
estimate the global burden of foodborne diseases (2).
In 1999, the Centers for Disease Control and Prevention provided comprehensive
estimates of foodborne illnesses, hospitalizations, and deaths in the United States caused by
known and unknown agents (3). This effort identified many data gaps and methodologic
limitations. Since then, new data and methods have become available. This article is 1 of 2
reporting new estimates of foodborne diseases acquired in the United States (hereafter referred to
as domestically acquired). This article provides estimates of major known pathogens; the other
provides estimates for agents of acute gastroenteritis not specified in this article (4).
Methods
Adequate data for preparing national estimates were available for 31 pathogens. We
estimated the number of foodborne illnesses, hospitalizations, and deaths caused by these 31
domestically acquired pathogens by using data shown in the Appendix Table and Technical
Appendix 1 (www.cdc.gov/EID/content/17/1/pdfs/09-1101p1-Techapp1.pdf).
Data were mostly from 2000–2008, and all estimates were based on the US population in
2006 (299 million persons). Estimates were derived from statistical models with many inputs,
each with some measure of uncertainty (5). To reflect this uncertainty, we used probability
distributions to describe a range of plausible values for all model inputs. We expressed model
outputs as probability distributions summarized by a mean point estimate with 90% credible
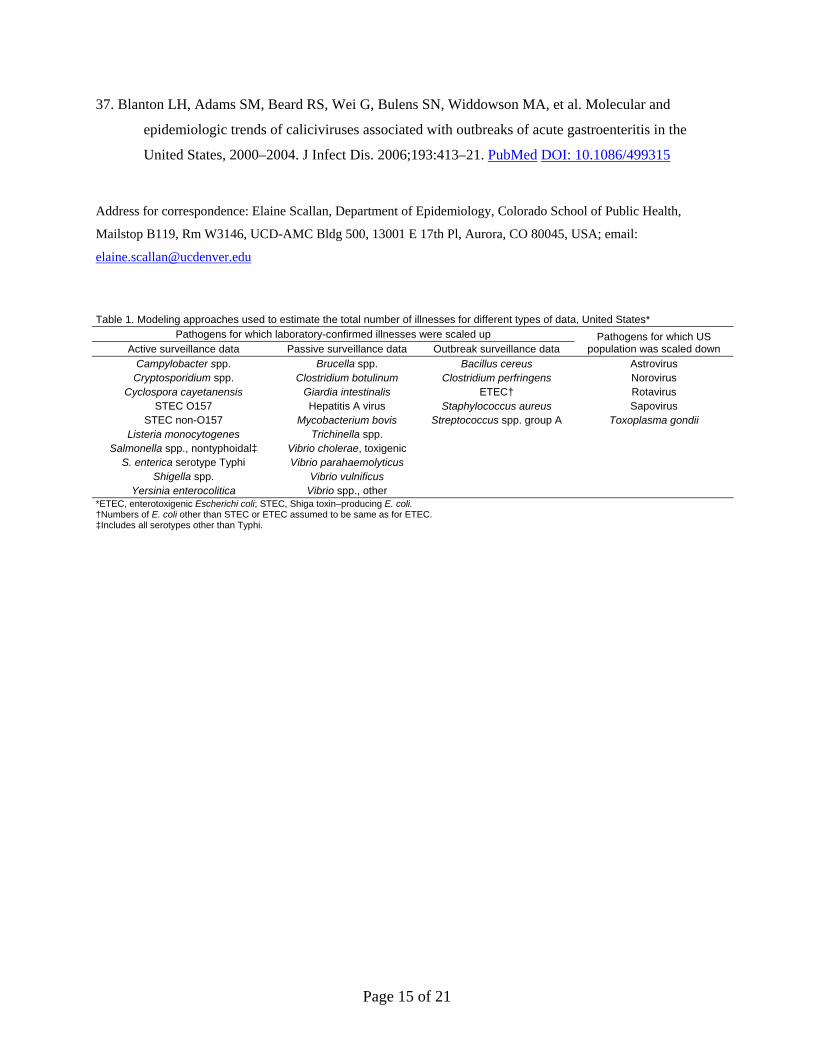
intervals (CrIs). We used 2 types of modeling approaches for different types of data: 1) models
that began with counts of laboratory-confirmed illnesses and were adjusted for undercounts
(because of underreporting and underdiagnosis) and thus scaled up to the estimated number of
Page 2 of 21
illnesses and 2) models that began with a US population and used incidence data to scale down
to the estimated number of illnesses (Table 1). The modeling approaches used and parameters of
these probability distributions are detailed in Technical Appendixes 2 and 3
(www.cdc.gov/EID/content/17/1/pdfs/09-1101p1-Techapp2.pdf and
www.cdc.gov/EID/content/17/1/pdfs/09-1101p1-Techapp3.pdf, respectively); the proportions
cited are modal values.
Illnesses
Laboratory-based surveillance data were available for 25 pathogens (Appendix Table).
The following events must occur for an illness to be ascertained and included in laboratory-based
surveillance: the ill person must seek medical care, a specimen must be submitted for laboratory
testing, the laboratory must test for and identify the causative agent, and the illness must be
reported to public health authorities. If a break occurs in any of the first 3 steps of this
surveillance chain, the causative agent will not be laboratory confirmed (underdiagnosis).
Furthermore, although all laboratory-confirmed illnesses are reported by active surveillance,
some will not be reported by passive surveillance (underreporting). Therefore, to estimate the
number of illnesses caused by pathogens under public health surveillance, we determined the
number of laboratory-confirmed illnesses and adjusted for underdiagnosis and, if necessary, for
underreporting by using a series of component multipliers.
Laboratory-confirmed illnesses for these 25 pathogens were reported through 5
surveillance programs: the Foodborne Diseases Active Surveillance Network (FoodNet) for
Campylobacter spp., Cryptosporidium spp., Cyclospora cayetanensis, Shiga toxin–producing
Escherichia coli (STEC) O157, STEC non-O157, Listeria monocytogenes, nontyphoidal
Salmonella spp., Salmonella enterica serotype Typhi, Shigella spp., and Yersinia enterocolitica;
the National Notifiable Diseases Surveillance System (NNDSS) for Brucella spp., Clostridium
botulinum, Trichinella spp., hepatitis A virus, and Giardia intestinalis; the Cholera and Other
Vibrio Illness Surveillance (COVIS) system for toxigenic Vibrio cholerae, V. vulnificus, V.
parahemolyticus, and other Vibrio spp.; the National Tuberculosis Surveillance System (NTSS)
for Mycobacterium bovis; and the Foodborne Disease Outbreak Surveillance System (FDOSS)
for Bacillus cereus, Clostridium perfringens, enterotoxigenic E. coli (ETEC), Staphylococcus
aureus, and Streptococcus spp. group A (Appendix Table; Technical Appendix 1). When data
were available from >1 surveillance system, we used active surveillance data from FoodNet,
Page 3 of 21
except for Vibrio spp., for which we used COVIS because of geographic clustering of Vibrio spp.
infections outside FoodNet sites. We used data on outbreak-associated illnesses from FDOSS
only for pathogens for which no data were available from other systems.
Because FoodNet conducts surveillance at 10 sites (6), we estimated the number of
laboratory-confirmed illnesses in the United States by applying incidence from FoodNet to the
estimated US population for 2006 (7). We constructed a probability distribution based on
extrapolation of rates by year (2005–2008) in each FoodNet site (Technical Appendix 3). We
used data from 2005–2008 because the FoodNet surveillance area was constant during that
period and because FoodNet began collecting information on foreign travel in 2004. We used
data from 2000–2007 for NNDSS, COVIS, and FDOSS and annual counts of reported illnesses
for our probability distributions. Some evidence of trend was found for illness caused by
hepatitis A virus, S. aureus, and Vibrio spp.; therefore, recent years were weighted more heavily
(Technical Appendixes 2, 3). NTSS was used to determine the number of reported illnesses
caused by M. bovis during 2004–2007.
We assumed that all laboratory-confirmed illnesses were reported to FoodNet active
surveillance in the relevant catchment areas. Because COVIS and NNDSS conduct passive
surveillance, we applied an underreporting multiplier (1.1 for bacteria and 1.3 for parasites)
derived by comparing incidence of all nationally notifiable illnesses ascertained through
FoodNet with that reported to NNDSS (Technical Appendix 4,
www.cdc.gov/EID/content/17/1/pdfs/09-1101p1-Techapp4.pdf). For the 5 bacteria for which
only outbreak data were available, we estimated the number of laboratory-confirmed illnesses by
creating an underreporting multiplier as follows. We determined the proportion of illnesses
ascertained through FoodNet that were caused by Campylobacter spp., Cryptosporidium spp., C.
cayatanensis, L. monocytogenes, Salmonella spp., Shigella spp., STEC, Vibrio spp., and Y.
enterocolitica that were also reported to FDOSS as outbreak associated and applied the inverse
of this proportion, 25.5, to those pathogens (Technical Appendix 4). We assumed that all
illnesses caused by M. bovis were reported to NTSS.
To adjust for underdiagnosis resulting from variations in medical care seeking, specimen
submission, laboratory testing, and test sensitivity, we created pathogen-specific multipliers. To
adjust for medical care seeking and specimen submission, we pooled data from FoodNet
Page 4 of 21
Population Surveys in 2000–2001, 2002–2003 (8), and 2006–2007 (Centers for Disease Control
and Prevention, unpub. data) from which we estimated the proportion of persons who in the past
month reported an acute diarrheal illness (>3 loose stools in 24 hours lasting >1 day or resulting
in restricted daily activities) and sought medical care and submitted a stool sample for that
illness. Because persons with more severe illness are more likely to seek care (9), we estimated
pathogen-specific proportions of persons with laboratory-confirmed infections who had severe
illness (e.g., bloody diarrhea) and used medical care seeking and stool sample submission rates
for bloody (35% and 36%, respectively) and nonbloody (18% and 19%, respectively) diarrhea as
surrogates for severe and mild cases of most illnesses (Technical Appendix 3). However, for
infections with L. monocytogenes, M. bovis, and V. vulnificus and severe infections with hepatitis
A virus, we assumed high rates of medical care seeking (i.e., we assumed that 100% of persons
with M. bovis infection and 90% with L. monocytogenes, V. vulnificus, or severe hepatitis A
virus infections sought care) and specimen submission (100% for hepatitis A virus and M. bovis,
80% for others). We accounted for percentage of laboratories that routinely tested for specific
pathogens (25%–100%) and test sensitivity (28%–100%) by using data from FoodNet (10,11)
and other surveys of clinical diagnostic laboratory practices (Technical Appendix 3). For the 5
pathogens for which data were from outbreaks only, we used the nontyphoidal Salmonella spp.
underdiagnosis multiplier.
Alternative approaches were used for infections not routinely reported by any
surveillance system (i.e., diarrheagenic E. coli other than STEC and ETEC, T. gondii, astrovirus,
rotavirus, sapovirus, and norovirus) (Technical Appendixes 1–3). We assumed diarrheagenic E.
coli other than STEC and ETEC to be as common as ETEC. Illnesses caused by T. gondii were
estimated by using nationally representative serologic data from the 1999–2004 National Health
and Nutrition Examination Survey (12) and an estimate that clinical illness develops in 15% of
persons who seroconvert (13). We assumed that 75% of children experience an episode of
clinical rotavirus illness by 5 years of age, consistent with findings from other studies (14), and
used this estimate for astrovirus and sapovirus. We estimated norovirus illnesses by applying
mean proportion of all acute gastroenteritis caused by norovirus (11%) according to studies in
other industrialized countries (15–18) to estimates of acute gastroenteritis from FoodNet
Population Surveys (Appendix Table; Technical Appendixes 1–3) (4).
Page 5 of 21
Hospitalizations and Deaths
For most pathogens, numbers of hospitalizations and deaths were estimated by
determining (from surveillance data) the proportion of persons who were hospitalized and the
proportion who died and applying these proportions to the estimated number of laboratory-
confirmed illnesses (Appendix Table; Technical Appendixes 1, 3). Rates of hospitalization and
death caused by G. intestinalis and T. gondii were based on the 2000–2006 Nationwide Inpatient
Sample. Because some persons with illnesses that were not laboratory confirmed would also
have been hospitalized and died, we doubled the number of hospitalizations and deaths to adjust
for underdiagnosis, similar to the method used by Mead et al. (3) but applied an uncertainty
distribution (Technical Appendix 3). For diarrheagenic E. coli other than STEC and ETEC, total
numbers of hospitalizations and deaths were assumed to be the same as those for ETEC. For
rotavirus, we used previous estimates (14). For astrovirus and sapovirus, we assumed that the
number was 25% that of rotavirus (19,20). Numbers of norovirus hospitalizations and deaths
were determined by multiplying the estimated number of hospitalizations and deaths caused by
acute gastroenteritis, estimated by using national data on outpatient visits resulting in
hospitalization, hospital discharge surveys, and death certificates (Appendix Table; Technical
Appendixes 1–3) (4), by the same norovirus proportion (11%) used to estimate illnesses (15–18).
Domestically Acquired Foodborne Illnesses
Data from published studies and surveillance were used to determine, for each pathogen,
the proportion of illnesses acquired while the person had been traveling outside the United States
(Technical Appendixes 1, 3). The remaining proportion was considered domestically acquired.
We based our estimates of the proportion of domestically acquired foodborne illnesses caused by
each pathogen on data from surveillance, risk factor studies, and a literature review (Technical
Appendixes 1, 3).
Uncertainty Analysis
We used empirical data, when available, to define entire distributions or parameters of
distributions (Technical Appendix 3). When data were sparse, we made reasoned judgments
based on context, plausibility, and previously published estimates. The parametric distribution
used for almost all multipliers was a 4-parameter beta (modified PERT) distribution (21). The
first 3 parameters are low, modal, and high. The fourth parameter is related to the variability of
the distribution. We typically fixed this last parameter at 4, which yields the simple PERT
Page 6 of 21
distribution (21). However, when describing the outbreak reporting multiplier, we used a value
of 20 (Technical Appendix 4).
Uncertainty in the estimates is the cumulative effect of uncertainty of each of the model
inputs. We iteratively generated sets of independent pathogen-specific adjustment factors and
used these multipliers to estimate illnesses, hospitalizations, and deaths (Figure; oTechnical
Appendix 2). On the basis of 100,000 iterations, we obtained empirical distributions of counts
corresponding to Bayesian posterior distributions and used these posterior distributions to
generate a point estimate (posterior mean) and upper and lower 5% limits for 90% CrIs. Because
incidence of illnesses differed by location and over time, we included these variations in the
models, which led to wider CrIs than if we had assumed that inputs represented independent
random samples of a fixed US population. We used SAS version 9.2 (SAS Institute, Cary, NC,
USA) for these analyses.
Results
Foodborne Illnesses
We estimate that each year in the United States, 31 pathogens caused 37.2 million (90%
CrI 28.4–47.6 million) illnesses, of which 36.4 million (90% CrI 27.7–46.7 million) were
domestically acquired; of these, 9.4 million (90% CrI 6.6–12.7 million) were foodborne (Table
2). We estimate that 5.5 million (59%) foodborne illnesses were caused by viruses, 3.6 million
(39%) by bacteria, and 0.2 million (2%) by parasites. The pathogens that caused the most
illnesses were norovirus (5.5 million, 58%), nontyphoidal Salmonella spp. (1.0 million, 11%), C.
perfringens (1.0 million, 10%), and Campylobacter spp. (0.8 million, 9%).
Hospitalizations
We estimate that these 31 pathogens caused 228,744 (90% CrI 188,326–275,601)
hospitalizations annually, of which 55,961 (90% CrI 39,534–75,741) were caused by
contaminated food eaten in the United States (Table 3). Of these, 64% were caused by bacteria,
27% by viruses, and 9% by parasites. The leading causes of hospitalization were nontyphoidal
Salmonella spp. (35%), norovirus (26%), Campylobacter spp. (15%), and T. gondii (8%).
Page 7 of 21
Deaths
We estimate that these 31 pathogens caused 2,612 deaths (90% CrI 1,723–3,819), of
which 1,351 (90% CrI 712–2,268) were caused by contaminated food eaten in the United States
(Table 3). Of these, 64% were caused by bacteria, 25% by parasites, and 12% by viruses. The
leading causes of death were nontyphoidal Salmonella spp. (28%), T. gondii (24%), L.
monocytogenes (19%), and norovirus (11%).
Discussion
We estimate that foods consumed in the United States that were contaminated with 31
known agents of foodborne disease caused 9.4 million illnesses, 55,961 hospitalizations, and
1,351 deaths each year. Norovirus caused the most illnesses; nontyphoidal Salmonella spp.,
norovirus, Campylobacter spp., and T. gondii caused the most hospitalizations; and nontyphoidal
Salmonella spp., T. gondii, L. monocytogenes, and norovirus caused the most deaths. Scarce data
precluded estimates for other known infectious and noninfectious agents, such as chemicals.
Foodborne diseases are also caused by agents not yet recognized as being transmitted in food and
by unknown agents (22). The numbers of illnesses caused by these unspecified agents are
estimated elsewhere (4).
Studies estimating the overall number of foodborne illnesses have been conducted in
England and Wales and in Australia (23,24). Similar to our findings, in Australia norovirus was
the leading cause of foodborne illness, accounting for 30% of illnesses caused by known
pathogens. In England and Wales, norovirus accounted for only 8% of known foodborne
illnesses; however, stool sample reexamination using molecular techniques documented higher
rates (18). Nontyphoidal Salmonella spp. and Campylobacter spp. were leading causes of
foodborne illnesses in all 3 countries (England and Wales, Australia, and the United States),
although nontyphoidal Salmonella spp. accounted for a greater proportion of illness in the United
States. Recent serologic data from Europe suggest that Salmonella spp. infections are more
common than estimated by our methods; however, many infections may be asymptomatic (25).
Our estimates did not capture mild illnesses associated with some pathogens. For example, mild
cases of botulism are often recognized as part of outbreaks, but affected persons seldom seek
medical care and are not captured by surveillance except during outbreaks (26,27). Likewise, L.
Page 8 of 21
monocytogenes is rarely diagnosed as the cause of gastroenteritis and fever, partly because this
organism is not detected by routine stool culture (28). Early spontaneous abortion or miscarriage
associated with listeriosis may also be underdiagnosed.
Accurately estimating hospitalizations and deaths caused by foodborne pathogens is
particularly challenging. National data on outpatient visits resulting in hospitalization, hospital
discharges, and death certificates probably substantially underestimate pathogen-specific cases
because for pathogen-specific diagnoses to be recorded, health care providers must order the
appropriate diagnostic tests and coding must be accurate. Particularly in vulnerable populations,
dehydration or electrolyte imbalance from a gastrointestinal illness may exacerbate a chronic
illness, resulting in hospitalization or death well after resolution of the gastrointestinal illness;
thus, the gastrointestinal illness may not be coded as a contributing factor. Moreover, if a
pathogen is not detected, infections may be coded as noninfectious illnesses (29). For norovirus,
we estimated the number of hospitalizations and deaths by applying the estimated proportion of
acute gastroenteritis illnesses caused by norovirus to overall estimates of hospitalizations and
deaths from acute gastroenteritis; this choice is supported by studies of hospitalizations for
norovirus (30,31). For most other pathogens, we used data from surveillance to estimate
pathogen-specific hospitalizations and deaths and doubled the numbers to adjust for
underdiagnosis. More precise information about the degree of undercounting of hospitalizations
and deaths for each pathogen would improve these estimates.
Our methods and data differed from those used for the 1999 estimates (3). Our estimate
of medical care seeking among persons with a diarrheal illness, derived from the 3 most recent
FoodNet Population Surveys conducted during 2000–2007, was higher than that estimated from
the 1996–1997 FoodNet Population Survey used for the 1999 estimates (35% and 18% among
persons reporting bloody and nonbloody diarrhea, respectively, compared with 15% and 12% in
the earlier [1999] study) (8). These data resulted in lower underdiagnosis multipliers, which
contributed to lower estimates of number of illnesses. The biggest change from the earlier
estimate was the estimated number of norovirus illnesses, which decreased for 2 reasons. First,
the number of acute gastrointestinal illnesses estimated from the FoodNet Population Survey and
used in the current study was lower than the estimated number of acute gastrointestinal illnesses
used in the 1999 assessment. The earlier study used data from 1996–1997; the sample size was
one fifth as large as ours and incorporated data from US studies conducted before 1980 (32,33).
Page 9 of 21
Both estimates excluded persons reporting concurrent cough or sore throat, but the proportion of
persons reporting these signs and symptoms was higher in the FoodNet Population Surveys we
used than that in the older US studies (38% vs. 25%), contributing to a lower estimated
prevalence of acute gastroenteritis (0.60 vs. 0.79 episodes/person/year) (4,32,33). Additionally,
the current study excluded persons with vomiting who were ill for <1 day or whose illness did
not result in restricted daily activities, whereas the earlier study included all vomiting episodes.
These factors contributed to the new estimate of acute gastroenteritis being 24% lower than the
earlier estimate, more likely the result of increased accuracy than a true decrease in illnesses (4).
Second, the lower current estimate for norovirus illnesses resulted from a lower proportion of
norovirus estimated to be foodborne (decreased from 40% to 26%); this lower proportion is
similar to that estimated in recent studies from other countries (23,24). Because of these reasons
and use of other data sources and methods, our estimate cannot be compared with the 1999
estimate for the purpose of assessing trends. FoodNet provides the best data on trends over time
(34).
Data used in the current study came from a variety of sources and were of variable
quality and representativeness. FoodNet sites, from which we used data for 10 pathogens, are not
completely representative of the US population, but 1 study indicated that demographic data
from FoodNet and from the 2005 US census did not differ much (6). For 5 pathogens, only data
on foodborne outbreak–related cases were available. No routine surveillance data were available
for most viruses, forcing us to use a different modeling approach for viruses than for most other
pathogens. Given the large number of norovirus illnesses in these estimates, the paucity of
supporting data is a major limitation. Moreover, combining different methods is not optimal
because methods themselves may affect the estimates. We chose our modeling approach and
used the PERT distribution for many inputs because data were sometimes limited and subjective
decisions were required. Other investigators could have chosen other distributions, for good
reasons, and arrived at different estimates.
Our assumptions about the proportion of illnesses transmitted by food profoundly affect
our estimates, but data on which to base these estimates were often lacking. We used data from
surveillance, risk factor studies, and the current literature to estimate the proportion of pathogen-
specific illnesses caused by consumption of contaminated food (35), but it is not known how
representative these data are of total illnesses and whether the foodborne proportion is similar
Page 10 of 21
across age groups. For example, the proportion of some illnesses acquired from animals (e.g.,
STEC O157) may be higher among children than adults (36), and the proportions that spread
person-to-person (e.g., norovirus) may be higher among institutionalized elderly persons (37).
Because a higher proportion of cases are reportedly associated with hospitalization or death in
these vulnerable groups, we may have overestimated the total contribution of foodborne
transmission for these outcomes.
The methods used for this study could be adapted to estimate the proportion of illnesses
attributable to other modes of transmission, such as waterborne and direct animal contact. The
estimates from this study can be used to help direct policy and interventions; to conduct other
analyses (e.g., evaluation of economic cost of these diseases and attribution to various food
commodities); and as a platform for developing estimates of effects of disease caused by
sequelae of foodborne infections.
Acknowledgments
We thank Tracy Ayers, Michael J. Beach, John Besser, Elizabeth Bosserman, Christopher R Braden,
Anthony E. Fiore, Kelly A. Jackson, Rebecca Hall, Erin Hedican, Barbara L. Herwaldt, Scott D. Holmberg, Martha
Iwamoto, Philip LoBue, Michael F. Lynch, Eric D. Mintz, John A. Painter, Ian T. Williams, Patricia A. Yu, and
David L. Swerdlow for providing data and expert advice for these estimates. We also thank Barbara Mahon for
reviewing the manuscript and the anonymous reviewers for helpful suggestions.
Dr Scallan is assistant professor in the Department of Epidemiology at the Colorado School of Public
Health. Her research focuses on the burden and attribution of foodborne diseases.
References
1. Flint JA, Van Duynhoven YT, Angulo FJ, DeLong SM, Braun P, Kirk M, et al. Estimating the burden
of acute gastroenteritis, foodborne disease, and pathogens commonly transmitted by food: an
international review. Clin Infect Dis. 2005;41:698–704. PubMed DOI: 10.1086/432064
2. Kuchenmuller T, Hird S, Stein C, Kramarz P, Nanda A, Havelaar AH. Estimating the global burden of
foodborne diseases—a collaborative effort. Euro Surveill. 2009;14:pii:19195.
3. Mead PS, Slutsker L, Dietz V, McCaig LF, Bresee JS, Shapiro C, et al. Food-related illness and death
in the United States. Emerg Infect Dis. 1999;5:607–25. PubMed DOI: 10.3201/eid0505.990502
Page 11 of 21
4. Scallan E, Griffin PM, Angulo FJ, Tauxe RV, Hoekstra RM. Foodborne illness acquired in the United
States—unspecified agents. Emerg Infect Dis. 2011 Jan; [Epub ahead of print].
http://www.cdc.gov/EID/content/17/1/09-1101p2.pdf
5. Powell M, Ebel E, Schlosser W. Considering uncertainty in comparing the burden of illness due to
foodborne microbial pathogens. Int J Food Microbiol. 2001;69:209–15. PubMed DOI:
10.1016/S0168-1605(01)00495-0
6. Scallan E. Activities, achievements, and lessons learned during the first 10 years of the Foodborne
Diseases Active Surveillance Network: 1996–2005. Clin Infect Dis. 2007;44:718–25. PubMed
7. US Census Bureau. Population estimates [cited 2010 March 9].
http://www.census.gov/popest/states/NST-ann-est.html
8. Jones TF, McMillian MB, Scallan E, Frenzen PD, Cronquist AB, Thomas S, et al. A population-based
estimate of the substantial burden of diarrhoeal disease in the United States; FoodNet, 1996–
2003. Epidemiol Infect. 2007;135:293–301. PubMed
9. Scallan E, Jones TF, Cronquist A, Thomas S, Frenzen P, Hoefer D, et al. Factors associated with
seeking medical care and submitting a stool sample in estimating the burden of foodborne illness.
Foodborne Pathog Dis. 2006;3:432–8. PubMed DOI: 10.1089/fpd.2006.3.432
10. Voetsch AC, Angulo FJ, Rabatsky-Ehr T, Shallow S, Cassidy M, Thomas SM, et al. Laboratory
practices for stool-specimen culture for bacterial pathogens, including Escherichia coli O157:H7,
in the FoodNet sites, 1995–2000. Clin Infect Dis. 2004;38(Suppl 3):S190–7. PubMed DOI:
10.1086/381586
11. Jones JL, Lopez A, Wahlquist SP, Nadle J, Wilson M. Survey of clinical laboratory practices for
parasitic diseases. Clin Infect Dis. 2004;38(Suppl 3):S198–202. PubMed DOI: 10.1086/381587
12. Jones JL, Kruszon-Moran D, Sanders-Lewis K, Wilson M. Toxoplasma gondii infection in the United
States, 1999–2004, decline from the prior decade. Am J Trop Med Hyg. 2007;77:405–10.
PubMed
13. World Health Organization. Toxoplasmosis. Technical report series no. 431. Geneva: The
Organization; 1969.
14. Widdowson MA, Meltzer MI, Zhang X, Bresee JS, Parashar UD, Glass RI. Cost-effectiveness and
potential impact of rotavirus vaccination in the United States. Pediatrics. 2007;119:684–97.
PubMed
Page 12 of 21
15. Wheeler JG, Sethi D, Cowden JM, Wall PG, Rodrigues LC, Tompkins DS, et al. Study of infectious
intestinal disease in England: rates in the community, presenting to general practice, and reported
to national surveillance. The Infectious Intestinal Disease Study Executive. BMJ.
1999;318:1046–50. PubMed
16. de Wit MA, Koopmans MP, Kortbeek LM, Wannet WJ, Vinje J, van Leusden F, et al. Sensor, a
population-based cohort study on gastroenteritis in the Netherlands: incidence and etiology. Am J
Epidemiol. 2001;154:666–74. PubMed DOI: 10.1093/aje/154.7.666
17. Marshall JA, Hellard ME, Sinclair MI, Fairley CK, Cox BJ, Catton MG, et al. Incidence and
characteristics of endemic Norwalk-like virus–associated gastroenteritis. J Med Virol.
2003;69:568–78. PubMed DOI: 10.1002/jmv.10346
18. Amar CF, East CL, Gray J, Iturriza-Gomara M, Maclure EA, McLauchlin J. Detection by PCR of
eight groups of enteric pathogens in 4,627 faecal samples: re-examination of the English case–
control Infectious Intestinal Disease Study (1993–1996). Eur J Clin Microbiol Infect Dis.
2007;26:311–23. PubMed
19. Dennehy PH, Nelson SM, Spangenberger S, Noel JS, Monroe SS, Glass RI. A prospective case–
control study of the role of astrovirus in acute diarrhea among hospitalized young children. J
Infect Dis. 2001;184:10–5. PubMed
20. Klein EJ, Boster DR, Stapp JR, Wells JG, Qin X, Clausen CR, et al. Diarrhea etiology in a children's
hospital emergency department: a prospective cohort study. Clin Infect Dis. 2006;43:807–13.
PubMed DOI: 10.1086/507335
21. Vose D. Risk analysis. A quantitative guide. 2nd ed. Chichester (UK): John Wiley & Sons; 2000.
22. Tauxe RV. Emerging foodborne pathogens. Int J Food Microbiol. 2002;78:31–41. PubMed DOI:
10.1016/S0168-1605(02)00232-5
23. Adak GK, Meakins SM, Yip H, Lopman BA, O’Brien SJ. Disease risks from foods, England and
Wales, 1996–2000. Emerg Infect Dis. 2005;11:365–72. PubMed
24. Hall G, Kirk MD, Becker N, Gregory JE, Unicomb L, Millard G, et al. Estimating foodborne
gastroenteritis, Australia. Emerg Infect Dis. 2005;11:1257–64. PubMed
25. Simonsen J, Teunis P, Van Pelt W, Van Duynhoven Y, Krogfelt KA, Sadkowska-Todys M, et al.
Usefulness of seroconversion rates for comparing infection pressures between countries.
Epidemiol Infect. 2010; Apr 12:1–8 [Epub ahead of print]. PubMed
Page 13 of 21
26. St Louis ME, Peck SH, Bowering D, Morgan GB, Blatherwick J, Banerjee S, et al. Botulism from
chopped garlic: delayed recognition of a major outbreak. Ann Intern Med. 1988;108:363–8.
PubMed
27. Sobel J, Malavet M, John S. Outbreak of clinically mild botulism type E illness from home-salted fish
in patients presenting with predominantly gastrointestinal symptoms. Clin Infect Dis.
2007;45:e14–6. PubMed DOI: 10.1086/518993
28. Dalton CB, Austin CC, Sobel J, Hayes PS, Bibb WF, Graves LM, et al. An outbreak of gastroenteritis
and fever due to Listeria monocytogenes in milk. N Engl J Med. 1997;336:100–5. PubMed DOI:
10.1056/NEJM199701093360204
29. Pinner RW, Teutsch SM, Simonsen L, Klug LA, Graber JM, Clarke MJ, et al. Trends in infectious
diseases mortality in the United States. JAMA. 1996;275:189–93. PubMed
30. Patel MM, Widdowson MA, Glass RI, Akazawa K, Vinje J, Parashar UD. Systematic literature
review of role of noroviruses in sporadic gastroenteritis. Emerg Infect Dis. 2008;14:1224–31.
PubMed
31. Jansen A, Stark K, Kunkel J, Schreier E, Ignatius R, Liesenfeld O, et al. Aetiology of community-
acquired, acute gastroenteritis in hospitalised adults: a prospective cohort study. BMC Infect Dis.
2008;8:143. PubMed DOI: 10.1186/1471-2334-8-143
32. Badger GF, Curtiss C, Dingle JH, Hodges RG, Jordan WS Jr, McCorkle LP. A study of illness in a
group of Cleveland families. XI. The occurrence of gastrointestinal symptoms. Am J Hyg.
1956;64:349–56. PubMed
33. Monto AS, Koopman JS. The Tecumseh Study. XI. Occurrence of acute enteric illness in the
community. Am J Epidemiol. 1980;112:323–33. PubMed
34. Centers for Disease Control and Prevention. Preliminary FoodNet data on the incidence of infection
with pathogens transmitted commonly through food—10 states, 2009. MMWR Morb Mortal
Wkly Rep. 2010;59:418–22. PubMed
35. Pires SM, Evers EG, van Pelt W, Ayers T, Scallan E, Angulo FJ, et al. Attributing the human disease
burden of foodborne infections to specific sources. Foodborne Pathog Dis. 2009;6:417–24.
PubMed
36. Crump JA, Sulka AC, Langer AJ, Schaben C, Crielly AS, Gage R, et al. An outbreak of Escherichia
coli O157:H7 infections among visitors to a dairy farm. N Engl J Med. 2002;347:555–60.
PubMed DOI: 10.1056/NEJMoa020524
Page 14 of 21
Page 15 of 21
37. Blanton LH, Adams SM, Beard RS, Wei G, Bulens SN, Widdowson MA, et al. Molecular and
epidemiologic trends of caliciviruses associated with outbreaks of acute gastroenteritis in the
United States, 2000–2004. J Infect Dis. 2006;193:413–21. PubMed DOI: 10.1086/499315
Address for correspondence: Elaine Scallan, Department of Epidemiology, Colorado School of Public Health,
Mailstop B119, Rm W3146, UCD-AMC Bldg 500, 13001 E 17th Pl, Aurora, CO 80045, USA; email:
Table 1. Modeling approaches used to estimate the total number of illnesses for different types of data, United States*
Pathogens for which laboratory-confirmed illnesses were scaled up Pathogens for which US population was scaled down Active surveillance data Passive surveillance data Outbreak surveillance data
Campylobacter spp. Brucella spp. Bacillus cereus Astrovirus Cryptosporidium spp. Clostridium botulinum Clostridium perfringens Norovirus
Cyclospora cayetanensis Giardia intestinalis ETEC† Rotavirus STEC O157 Hepatitis A virus Staphylococcus aureus Sapovirus
STEC non-O157 Mycobacterium bovis Streptococcus spp. group A Toxoplasma gondii Listeria monocytogenes Trichinella spp.
Salmonella spp., nontyphoidal‡ Vibrio cholerae, toxigenic S. enterica serotype Typhi Vibrio parahaemolyticus
Shigella spp. Vibrio vulnificus Yersinia enterocolitica Vibrio spp., other
*ETEC, enterotoxigenic Escherichi coli; STEC, Shiga toxin–producing E. coli. †Numbers of E. coli other than STEC or ETEC assumed to be same as for ETEC. ‡Includes all serotypes other than Typhi.
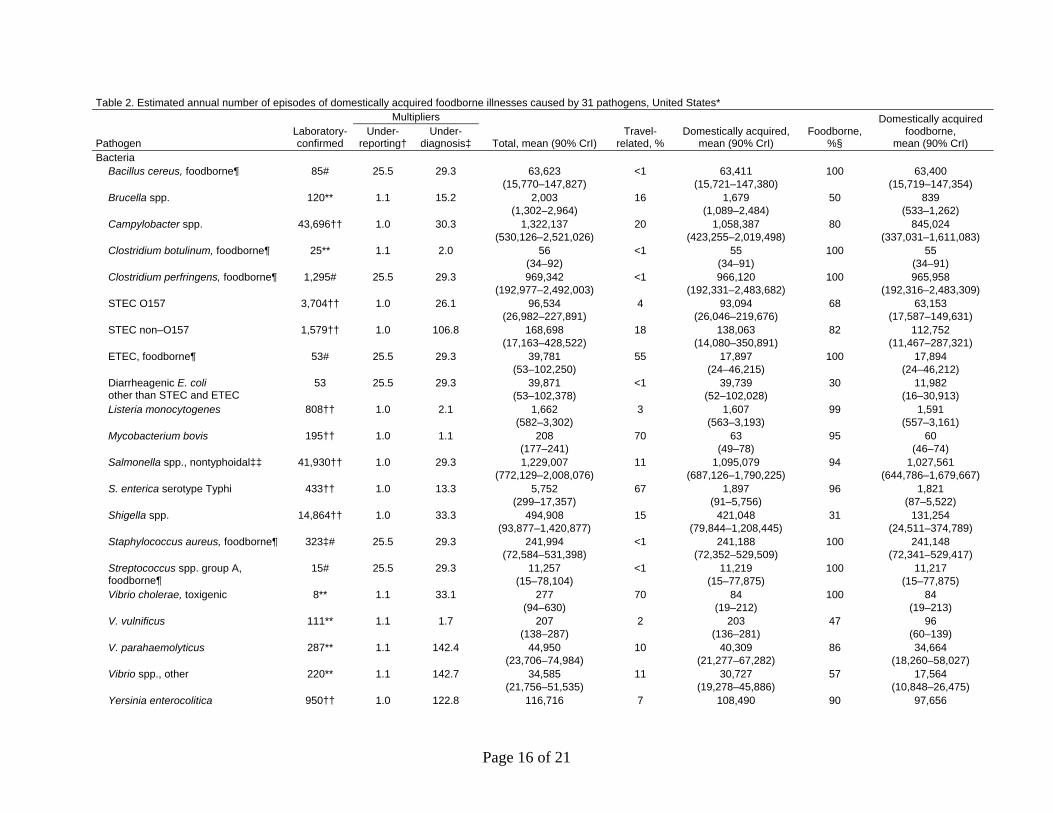
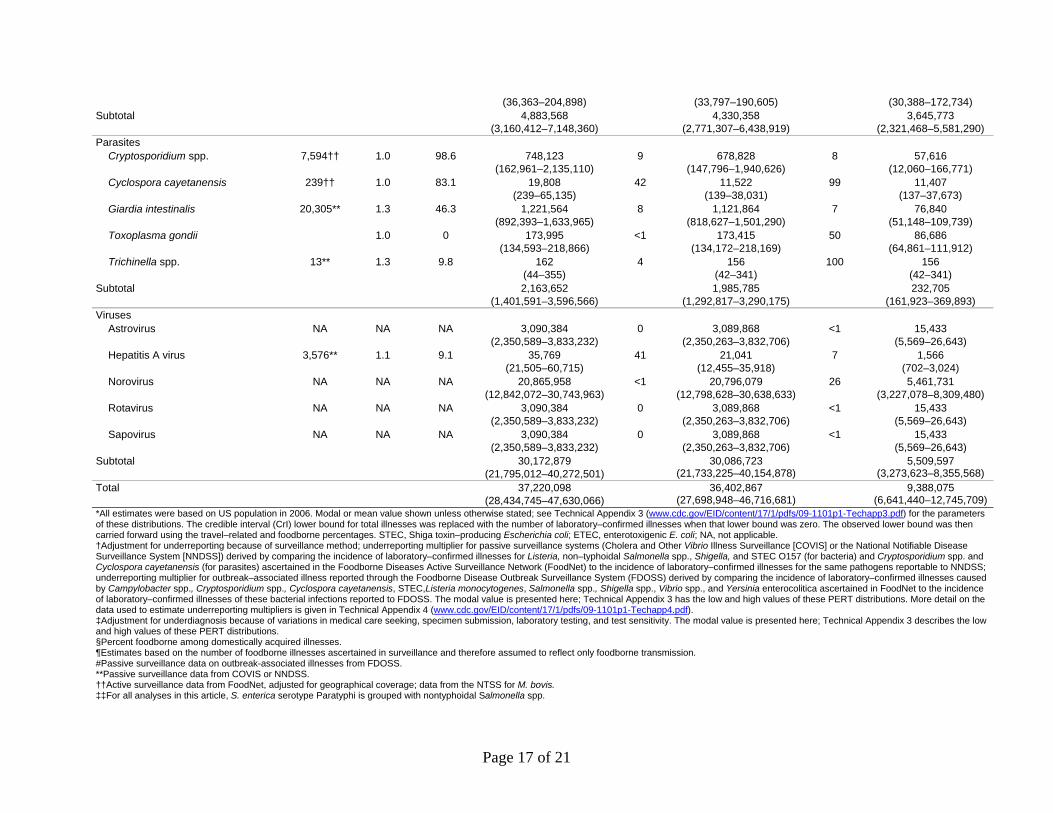
Table 2. Estimated annual number of episodes of domestically acquired foodborne illnesses caused by 31 pathogens, United States*
Pathogen Laboratory- confirmed
Multipliers
Total, mean (90% CrI) Travel-
related, % Domestically acquired,
mean (90% CrI) Foodborne,
%§
Domestically acquired foodborne,
mean (90% CrI) Under-
reporting† Under-
diagnosis‡ Bacteria Bacillus cereus, foodborne¶ 85# 25.5 29.3 63,623
(15,770–147,827) <1 63,411
(15,721–147,380) 100 63,400
(15,719–147,354) Brucella spp. 120** 1.1 15.2 2,003
(1,302–2,964) 16 1,679
(1,089–2,484) 50 839
(533–1,262) Campylobacter spp. 43,696†† 1.0 30.3 1,322,137
(530,126–2,521,026) 20 1,058,387
(423,255–2,019,498) 80 845,024
(337,031–1,611,083) Clostridium botulinum, foodborne¶ 25** 1.1 2.0 56
(34–92) <1 55
(34–91) 100 55
(34–91) Clostridium perfringens, foodborne¶ 1,295# 25.5 29.3 969,342
(192,977–2,492,003) <1 966,120
(192,331–2,483,682) 100 965,958
(192,316–2,483,309) STEC O157 3,704†† 1.0 26.1 96,534
(26,982–227,891) 4 93,094
(26,046–219,676) 68 63,153
(17,587–149,631) STEC non–O157 1,579†† 1.0 106.8 168,698
(17,163–428,522) 18 138,063
(14,080–350,891) 82 112,752
(11,467–287,321) ETEC, foodborne¶ 53# 25.5 29.3 39,781
(53–102,250) 55 17,897
(24–46,215) 100 17,894
(24–46,212) Diarrheagenic E. coli other than STEC and ETEC
53 25.5 29.3 39,871 (53–102,378)
<1 39,739 (52–102,028)
30 11,982 (16–30,913)
Listeria monocytogenes 808†† 1.0 2.1 1,662 (582–3,302)
3 1,607 (563–3,193)
99 1,591 (557–3,161)
Mycobacterium bovis 195†† 1.0 1.1 208 (177–241)
70 63 (49–78)
95 60 (46–74)
Salmonella spp., nontyphoidal‡‡ 41,930†† 1.0 29.3 1,229,007 (772,129–2,008,076)
11 1,095,079 (687,126–1,790,225)
94 1,027,561 (644,786–1,679,667)
S. enterica serotype Typhi 433†† 1.0 13.3 5,752 (299–17,357)
67 1,897 (91–5,756)
96 1,821 (87–5,522)
Shigella spp. 14,864†† 1.0 33.3 494,908 (93,877–1,420,877)
15 421,048 (79,844–1,208,445)
31 131,254 (24,511–374,789)
Staphylococcus aureus, foodborne¶ 323‡# 25.5 29.3 241,994 (72,584–531,398)
<1 241,188 (72,352–529,509)
100 241,148 (72,341–529,417)
Streptococcus spp. group A, foodborne¶
15# 25.5 29.3 11,257 (15–78,104)
<1 11,219 (15–77,875)
100 11,217 (15–77,875)
Vibrio cholerae, toxigenic 8** 1.1 33.1 277 (94–630)
70 84 (19–212)
100 84 (19–213)
V. vulnificus 111** 1.1 1.7 207 (138–287)
2 203 (136–281)
47 96 (60–139)
V. parahaemolyticus 287** 1.1 142.4 44,950 (23,706–74,984)
10 40,309 (21,277–67,282)
86 34,664 (18,260–58,027)
Vibrio spp., other 220** 1.1 142.7 34,585 (21,756–51,535)
11 30,727 (19,278–45,886)
57 17,564 (10,848–26,475)
Yersinia enterocolitica 950†† 1.0 122.8 116,716 7 108,490 90 97,656
Page 16 of 21
Page 17 of 21
(36,363–204,898) (33,797–190,605) (30,388–172,734) Subtotal 4,883,568
(3,160,412–7,148,360) 4,330,358
(2,771,307–6,438,919) 3,645,773
(2,321,468–5,581,290) Parasites Cryptosporidium spp. 7,594†† 1.0 98.6 748,123
(162,961–2,135,110) 9 678,828
(147,796–1,940,626) 8 57,616
(12,060–166,771) Cyclospora cayetanensis 239†† 1.0 83.1 19,808
(239–65,135) 42 11,522
(139–38,031) 99 11,407
(137–37,673) Giardia intestinalis 20,305** 1.3 46.3 1,221,564
(892,393–1,633,965) 8 1,121,864
(818,627–1,501,290) 7 76,840
(51,148–109,739) Toxoplasma gondii 1.0 0 173,995
(134,593–218,866) <1 173,415
(134,172–218,169) 50 86,686
(64,861–111,912) Trichinella spp. 13** 1.3 9.8 162
(44–355) 4 156
(42–341) 100 156
(42–341) Subtotal 2,163,652
(1,401,591–3,596,566) 1,985,785
(1,292,817–3,290,175) 232,705
(161,923–369,893) Viruses Astrovirus NA NA NA 3,090,384
(2,350,589–3,833,232) 0 3,089,868
(2,350,263–3,832,706) <1 15,433
(5,569–26,643) Hepatitis A virus 3,576** 1.1 9.1 35,769
(21,505–60,715) 41 21,041
(12,455–35,918) 7 1,566
(702–3,024) Norovirus NA NA NA 20,865,958
(12,842,072–30,743,963) <1 20,796,079
(12,798,628–30,638,633) 26 5,461,731
(3,227,078–8,309,480) Rotavirus NA NA NA 3,090,384
(2,350,589–3,833,232) 0 3,089,868
(2,350,263–3,832,706) <1 15,433
(5,569–26,643) Sapovirus NA NA NA 3,090,384
(2,350,589–3,833,232) 0 3,089,868
(2,350,263–3,832,706) <1 15,433
(5,569–26,643) Subtotal 30,172,879
(21,795,012–40,272,501) 30,086,723
(21,733,225–40,154,878) 5,509,597
(3,273,623–8,355,568) Total 37,220,098
(28,434,745–47,630,066) 36,402,867
(27,698,948–46,716,681) 9,388,075
(6,641,440–12,745,709) *All estimates were based on US population in 2006. Modal or mean value shown unless otherwise stated; see Technical Appendix 3 (www.cdc.gov/EID/content/17/1/pdfs/09-1101p1-Techapp3.pdf) for the parameters of these distributions. The credible interval (CrI) lower bound for total illnesses was replaced with the number of laboratory–confirmed illnesses when that lower bound was zero. The observed lower bound was then carried forward using the travel–related and foodborne percentages. STEC, Shiga toxin–producing Escherichia coli; ETEC, enterotoxigenic E. coli; NA, not applicable. †Adjustment for underreporting because of surveillance method; underreporting multiplier for passive surveillance systems (Cholera and Other Vibrio Illness Surveillance [COVIS] or the National Notifiable Disease Surveillance System [NNDSS]) derived by comparing the incidence of laboratory–confirmed illnesses for Listeria, non–typhoidal Salmonella spp., Shigella, and STEC O157 (for bacteria) and Cryptosporidium spp. and Cyclospora cayetanensis (for parasites) ascertained in the Foodborne Diseases Active Surveillance Network (FoodNet) to the incidence of laboratory–confirmed illnesses for the same pathogens reportable to NNDSS; underreporting multiplier for outbreak–associated illness reported through the Foodborne Disease Outbreak Surveillance System (FDOSS) derived by comparing the incidence of laboratory–confirmed illnesses caused by Campylobacter spp., Cryptosporidium spp., Cyclospora cayetanensis, STEC,Listeria monocytogenes, Salmonella spp., Shigella spp., Vibrio spp., and Yersinia enterocolitica ascertained in FoodNet to the incidence of laboratory–confirmed illnesses of these bacterial infections reported to FDOSS. The modal value is presented here; Technical Appendix 3 has the low and high values of these PERT distributions. More detail on the data used to estimate underreporting multipliers is given in Technical Appendix 4 (www.cdc.gov/EID/content/17/1/pdfs/09-1101p1-Techapp4.pdf). ‡Adjustment for underdiagnosis because of variations in medical care seeking, specimen submission, laboratory testing, and test sensitivity. The modal value is presented here; Technical Appendix 3 describes the low and high values of these PERT distributions. §Percent foodborne among domestically acquired illnesses. ¶Estimates based on the number of foodborne illnesses ascertained in surveillance and therefore assumed to reflect only foodborne transmission. #Passive surveillance data on outbreak-associated illnesses from FDOSS. **Passive surveillance data from COVIS or NNDSS. ††Active surveillance data from FoodNet, adjusted for geographical coverage; data from the NTSS for M. bovis. ‡‡For all analyses in this article, S. enterica serotype Paratyphi is grouped with nontyphoidal Salmonella spp.
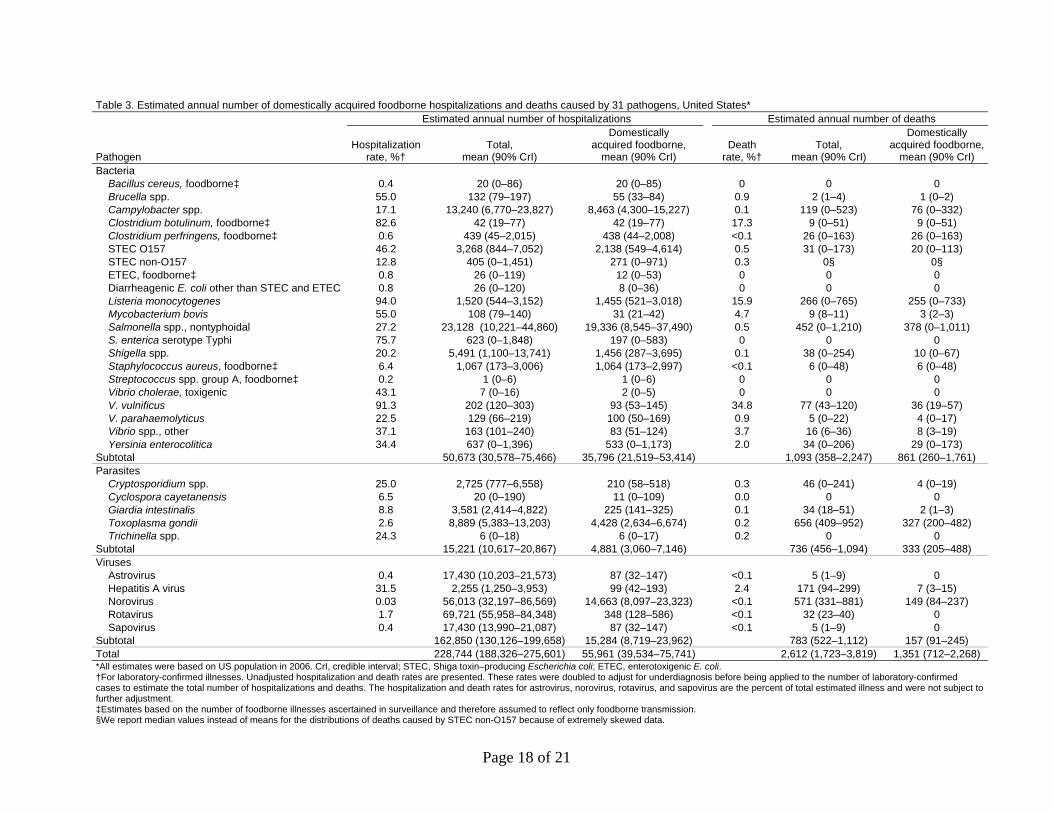
Table 3. Estimated annual number of domestically acquired foodborne hospitalizations and deaths caused by 31 pathogens, United States*
Pathogen
Estimated annual number of hospitalizations Estimated annual number of deaths
Hospitalization rate, %†
Total, mean (90% CrI)
Domestically acquired foodborne,
mean (90% CrI) Death
rate, %† Total,
mean (90% CrI)
Domestically acquired foodborne,
mean (90% CrI) Bacteria Bacillus cereus, foodborne‡ 0.4 20 (0–86) 20 (0–85) 0 0 0 Brucella spp. 55.0 132 (79–197) 55 (33–84) 0.9 2 (1–4) 1 (0–2) Campylobacter spp. 17.1 13,240 (6,770–23,827) 8,463 (4,300–15,227) 0.1 119 (0–523) 76 (0–332) Clostridium botulinum, foodborne‡ 82.6 42 (19–77) 42 (19–77) 17.3 9 (0–51) 9 (0–51) Clostridium perfringens, foodborne‡ 0.6 439 (45–2,015) 438 (44–2,008) <0.1 26 (0–163) 26 (0–163) STEC O157 46.2 3,268 (844–7,052) 2,138 (549–4,614) 0.5 31 (0–173) 20 (0–113) STEC non-O157 12.8 405 (0–1,451) 271 (0–971) 0.3 0§ 0§ ETEC, foodborne‡ 0.8 26 (0–119) 12 (0–53) 0 0 0 Diarrheagenic E. coli other than STEC and ETEC 0.8 26 (0–120) 8 (0–36) 0 0 0 Listeria monocytogenes 94.0 1,520 (544–3,152) 1,455 (521–3,018) 15.9 266 (0–765) 255 (0–733) Mycobacterium bovis 55.0 108 (79–140) 31 (21–42) 4.7 9 (8–11) 3 (2–3) Salmonella spp., nontyphoidal 27.2 23,128 (10,221–44,860) 19,336 (8,545–37,490) 0.5 452 (0–1,210) 378 (0–1,011) S. enterica serotype Typhi 75.7 623 (0–1,848) 197 (0–583) 0 0 0 Shigella spp. 20.2 5,491 (1,100–13,741) 1,456 (287–3,695) 0.1 38 (0–254) 10 (0–67) Staphylococcus aureus, foodborne‡ 6.4 1,067 (173–3,006) 1,064 (173–2,997) <0.1 6 (0–48) 6 (0–48) Streptococcus spp. group A, foodborne‡ 0.2 1 (0–6) 1 (0–6) 0 0 0 Vibrio cholerae, toxigenic 43.1 7 (0–16) 2 (0–5) 0 0 0 V. vulnificus 91.3 202 (120–303) 93 (53–145) 34.8 77 (43–120) 36 (19–57) V. parahaemolyticus 22.5 129 (66–219) 100 (50–169) 0.9 5 (0–22) 4 (0–17) Vibrio spp., other 37.1 163 (101–240) 83 (51–124) 3.7 16 (6–36) 8 (3–19) Yersinia enterocolitica 34.4 637 (0–1,396) 533 (0–1,173) 2.0 34 (0–206) 29 (0–173) Subtotal 50,673 (30,578–75,466) 35,796 (21,519–53,414) 1,093 (358–2,247) 861 (260–1,761) Parasites Cryptosporidium spp. 25.0 2,725 (777–6,558) 210 (58–518) 0.3 46 (0–241) 4 (0–19) Cyclospora cayetanensis 6.5 20 (0–190) 11 (0–109) 0.0 0 0 Giardia intestinalis 8.8 3,581 (2,414–4,822) 225 (141–325) 0.1 34 (18–51) 2 (1–3) Toxoplasma gondii 2.6 8,889 (5,383–13,203) 4,428 (2,634–6,674) 0.2 656 (409–952) 327 (200–482) Trichinella spp. 24.3 6 (0–18) 6 (0–17) 0.2 0 0 Subtotal 15,221 (10,617–20,867) 4,881 (3,060–7,146) 736 (456–1,094) 333 (205–488) Viruses Astrovirus 0.4 17,430 (10,203–21,573) 87 (32–147) <0.1 5 (1–9) 0 Hepatitis A virus 31.5 2,255 (1,250–3,953) 99 (42–193) 2.4 171 (94–299) 7 (3–15) Norovirus 0.03 56,013 (32,197–86,569) 14,663 (8,097–23,323) <0.1 571 (331–881) 149 (84–237) Rotavirus 1.7 69,721 (55,958–84,348) 348 (128–586) <0.1 32 (23–40) 0 Sapovirus 0.4 17,430 (13,990–21,087) 87 (32–147) <0.1 5 (1–9) 0 Subtotal 162,850 (130,126–199,658) 15,284 (8,719–23,962) 783 (522–1,112) 157 (91–245) Total 228,744 (188,326–275,601) 55,961 (39,534–75,741) 2,612 (1,723–3,819) 1,351 (712–2,268) *All estimates were based on US population in 2006. CrI, credible interval; STEC, Shiga toxin–producing Escherichia coli; ETEC, enterotoxigenic E. coli. †For laboratory-confirmed illnesses. Unadjusted hospitalization and death rates are presented. These rates were doubled to adjust for underdiagnosis before being applied to the number of laboratory-confirmed cases to estimate the total number of hospitalizations and deaths. The hospitalization and death rates for astrovirus, norovirus, rotavirus, and sapovirus are the percent of total estimated illness and were not subject to further adjustment. ‡Estimates based on the number of foodborne illnesses ascertained in surveillance and therefore assumed to reflect only foodborne transmission. §We report median values instead of means for the distributions of deaths caused by STEC non-O157 because of extremely skewed data.
Page 18 of 21
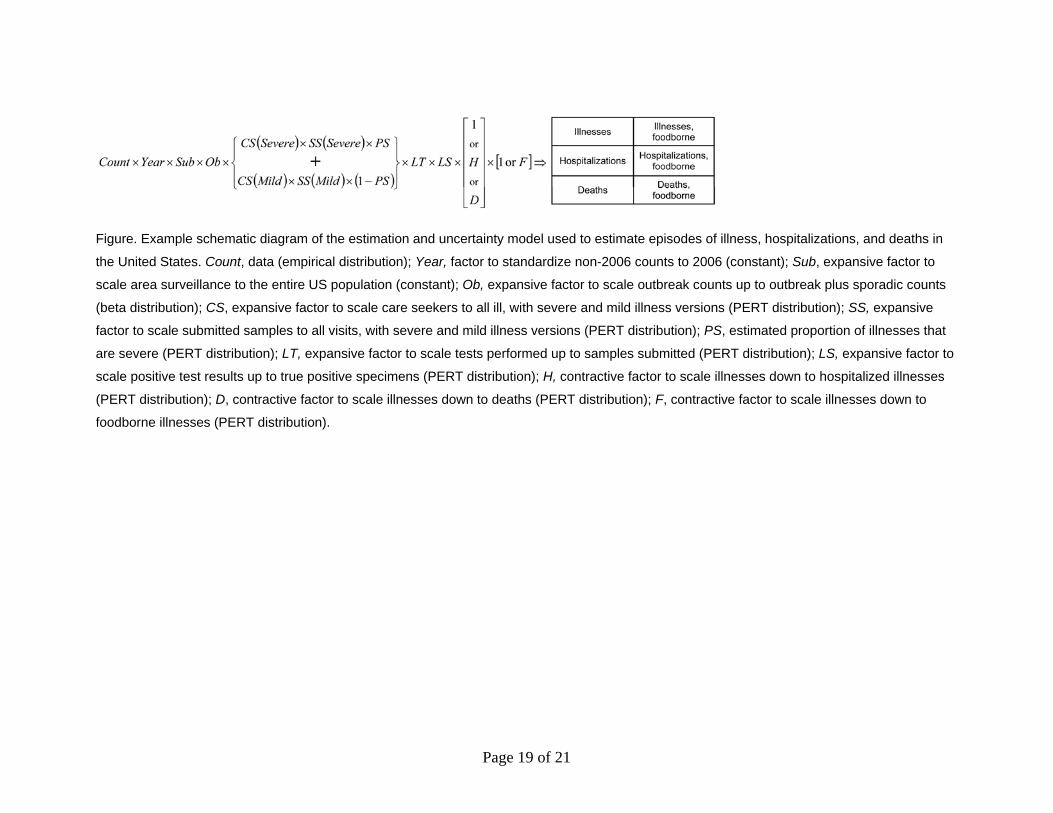
Figure. Example schematic diagram of the estimation and uncertainty model used to estimate episodes of illness, hospitalizations, and deaths in
the United States. Count, data (empirical distribution); Year, factor to standardize non-2006 counts to 2006 (constant); Sub, expansive factor to
scale area surveillance to the entire US population (constant); Ob, expansive factor to scale outbreak counts up to outbreak plus sporadic counts
(beta distribution); CS, expansive factor to scale care seekers to all ill, with severe and mild illness versions (PERT distribution); SS, expansive
factor to scale submitted samples to all visits, with severe and mild illness versions (PERT distribution); PS, estimated proportion of illnesses that
are severe (PERT distribution); LT, expansive factor to scale tests performed up to samples submitted (PERT distribution); LS, expansive factor to
scale positive test results up to true positive specimens (PERT distribution); H, contractive factor to scale illnesses down to hospitalized illnesses
(PERT distribution); D, contractive factor to scale illnesses down to deaths (PERT distribution); F, contractive factor to scale illnesses down to
foodborne illnesses (PERT distribution).
Page 19 of 21
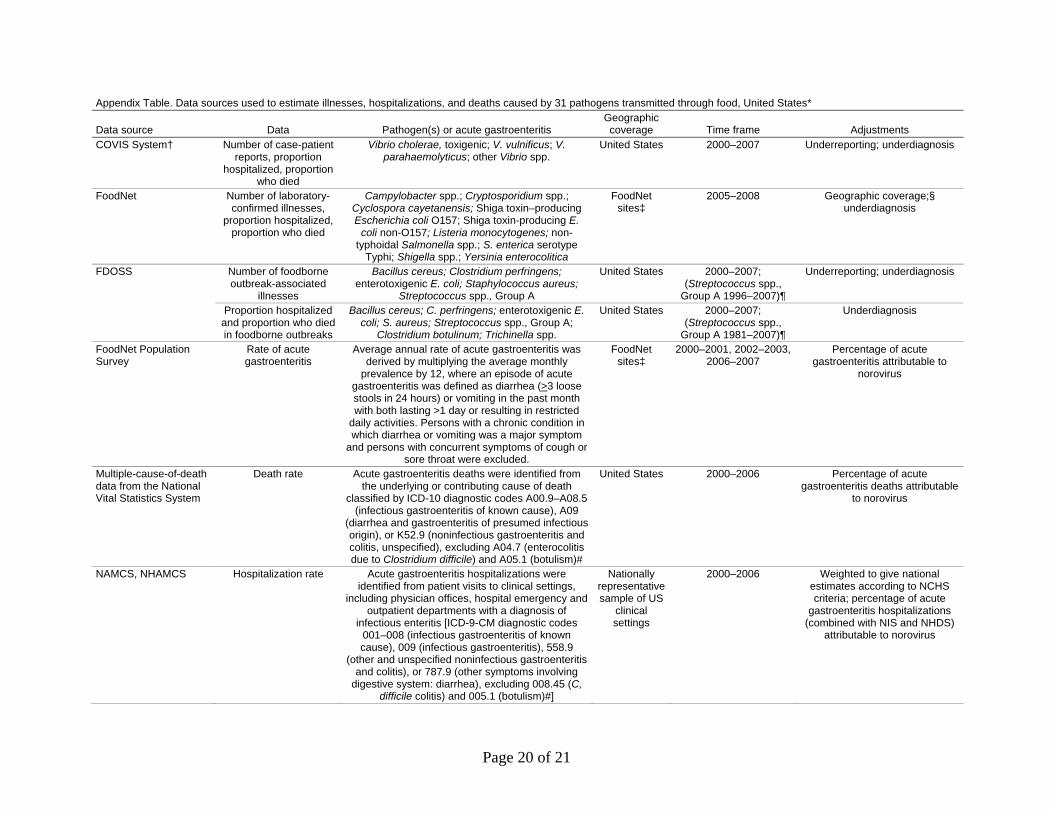
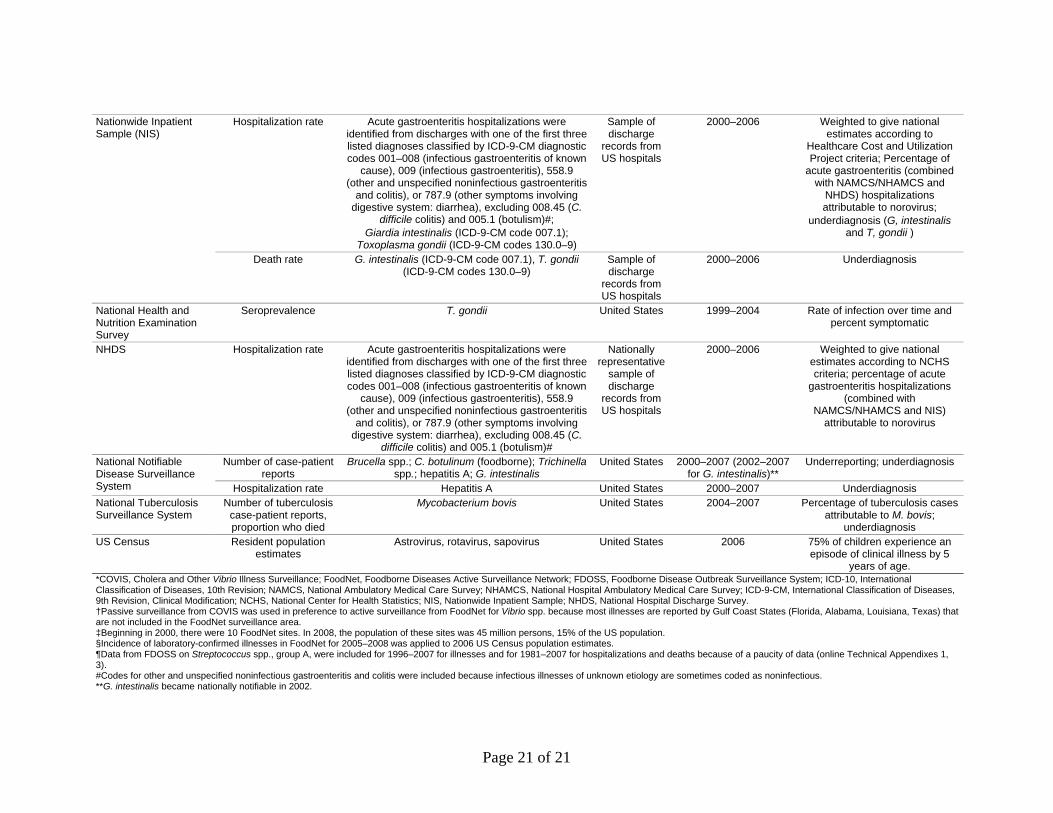
Appendix Table. Data sources used to estimate illnesses, hospitalizations, and deaths caused by 31 pathogens transmitted through food, United States*
Data source Data Pathogen(s) or acute gastroenteritis Geographic coverage Time frame Adjustments
COVIS System† Number of case-patient reports, proportion
hospitalized, proportion who died
Vibrio cholerae, toxigenic; V. vulnificus; V. parahaemolyticus; other Vibrio spp.
United States 2000–2007 Underreporting; underdiagnosis
FoodNet Number of laboratory-confirmed illnesses,
proportion hospitalized, proportion who died
Campylobacter spp.; Cryptosporidium spp.; Cyclospora cayetanensis; Shiga toxin–producing Escherichia coli O157; Shiga toxin-producing E.
coli non-O157; Listeria monocytogenes; non-typhoidal Salmonella spp.; S. enterica serotype
Typhi; Shigella spp.; Yersinia enterocolitica
FoodNet sites‡
2005–2008 Geographic coverage;§ underdiagnosis
FDOSS Number of foodborne outbreak-associated
illnesses
Bacillus cereus; Clostridium perfringens; enterotoxigenic E. coli; Staphylococcus aureus;
Streptococcus spp., Group A
United States 2000–2007; (Streptococcus spp.,
Group A 1996–2007)¶
Underreporting; underdiagnosis
Proportion hospitalized and proportion who died in foodborne outbreaks
Bacillus cereus; C. perfringens; enterotoxigenic E. coli; S. aureus; Streptococcus spp., Group A;
Clostridium botulinum; Trichinella spp.
United States 2000–2007; (Streptococcus spp.,
Group A 1981–2007)¶
Underdiagnosis
FoodNet Population Survey
Rate of acute gastroenteritis
Average annual rate of acute gastroenteritis was derived by multiplying the average monthly
prevalence by 12, where an episode of acute gastroenteritis was defined as diarrhea (>3 loose stools in 24 hours) or vomiting in the past month with both lasting >1 day or resulting in restricted
daily activities. Persons with a chronic condition in which diarrhea or vomiting was a major symptom
and persons with concurrent symptoms of cough or sore throat were excluded.
FoodNet sites‡
2000–2001, 2002–2003, 2006–2007
Percentage of acute gastroenteritis attributable to
norovirus
Multiple-cause-of-death data from the National Vital Statistics System
Death rate Acute gastroenteritis deaths were identified from the underlying or contributing cause of death
classified by ICD-10 diagnostic codes A00.9–A08.5 (infectious gastroenteritis of known cause), A09
(diarrhea and gastroenteritis of presumed infectious origin), or K52.9 (noninfectious gastroenteritis and colitis, unspecified), excluding A04.7 (enterocolitis due to Clostridium difficile) and A05.1 (botulism)#
United States 2000–2006 Percentage of acute gastroenteritis deaths attributable
to norovirus
NAMCS, NHAMCS Hospitalization rate Acute gastroenteritis hospitalizations were identified from patient visits to clinical settings,
including physician offices, hospital emergency and outpatient departments with a diagnosis of
infectious enteritis [ICD-9-CM diagnostic codes 001–008 (infectious gastroenteritis of known cause), 009 (infectious gastroenteritis), 558.9
(other and unspecified noninfectious gastroenteritis and colitis), or 787.9 (other symptoms involving
digestive system: diarrhea), excluding 008.45 (C, difficile colitis) and 005.1 (botulism)#]
Nationally representative sample of US
clinical settings
2000–2006 Weighted to give national estimates according to NCHS criteria; percentage of acute
gastroenteritis hospitalizations (combined with NIS and NHDS)
attributable to norovirus
Page 20 of 21
Page 21 of 21
Nationwide Inpatient Sample (NIS)
Hospitalization rate Acute gastroenteritis hospitalizations were identified from discharges with one of the first three listed diagnoses classified by ICD-9-CM diagnostic codes 001–008 (infectious gastroenteritis of known
cause), 009 (infectious gastroenteritis), 558.9 (other and unspecified noninfectious gastroenteritis
and colitis), or 787.9 (other symptoms involving digestive system: diarrhea), excluding 008.45 (C.
difficile colitis) and 005.1 (botulism)#; Giardia intestinalis (ICD-9-CM code 007.1);
Toxoplasma gondii (ICD-9-CM codes 130.0–9)
Sample of discharge
records from US hospitals
2000–2006
Weighted to give national estimates according to
Healthcare Cost and Utilization Project criteria; Percentage of
acute gastroenteritis (combined with NAMCS/NHAMCS and
NHDS) hospitalizations attributable to norovirus;
underdiagnosis (G, intestinalis and T, gondii )
Death rate G. intestinalis (ICD-9-CM code 007.1), T. gondii (ICD-9-CM codes 130.0–9)
Sample of discharge
records from US hospitals
2000–2006
Underdiagnosis
National Health and Nutrition Examination Survey
Seroprevalence T. gondii United States 1999–2004 Rate of infection over time and percent symptomatic
NHDS Hospitalization rate Acute gastroenteritis hospitalizations were identified from discharges with one of the first three listed diagnoses classified by ICD-9-CM diagnostic codes 001–008 (infectious gastroenteritis of known
cause), 009 (infectious gastroenteritis), 558.9 (other and unspecified noninfectious gastroenteritis
and colitis), or 787.9 (other symptoms involving digestive system: diarrhea), excluding 008.45 (C.
difficile colitis) and 005.1 (botulism)#
Nationally representative
sample of discharge
records from US hospitals
2000–2006 Weighted to give national estimates according to NCHS criteria; percentage of acute
gastroenteritis hospitalizations (combined with
NAMCS/NHAMCS and NIS) attributable to norovirus
National Notifiable Disease Surveillance System
Number of case-patient reports
Brucella spp.; C. botulinum (foodborne); Trichinella spp.; hepatitis A; G. intestinalis
United States 2000–2007 (2002–2007 for G. intestinalis)**
Underreporting; underdiagnosis
Hospitalization rate Hepatitis A United States 2000–2007 Underdiagnosis National Tuberculosis Surveillance System
Number of tuberculosis case-patient reports, proportion who died
Mycobacterium bovis United States 2004–2007 Percentage of tuberculosis cases attributable to M. bovis;
underdiagnosis US Census Resident population
estimates Astrovirus, rotavirus, sapovirus United States 2006 75% of children experience an
episode of clinical illness by 5 years of age.
*COVIS, Cholera and Other Vibrio Illness Surveillance; FoodNet, Foodborne Diseases Active Surveillance Network; FDOSS, Foodborne Disease Outbreak Surveillance System; ICD-10, International Classification of Diseases, 10th Revision; NAMCS, National Ambulatory Medical Care Survey; NHAMCS, National Hospital Ambulatory Medical Care Survey; ICD-9-CM, International Classification of Diseases, 9th Revision, Clinical Modification; NCHS, National Center for Health Statistics; NIS, Nationwide Inpatient Sample; NHDS, National Hospital Discharge Survey. †Passive surveillance from COVIS was used in preference to active surveillance from FoodNet for Vibrio spp. because most illnesses are reported by Gulf Coast States (Florida, Alabama, Louisiana, Texas) that are not included in the FoodNet surveillance area. ‡Beginning in 2000, there were 10 FoodNet sites. In 2008, the population of these sites was 45 million persons, 15% of the US population. §Incidence of laboratory-confirmed illnesses in FoodNet for 2005–2008 was applied to 2006 US Census population estimates. ¶Data from FDOSS on Streptococcus spp., group A, were included for 1996–2007 for illnesses and for 1981–2007 for hospitalizations and deaths because of a paucity of data (online Technical Appendixes 1, 3). #Codes for other and unspecified noninfectious gastroenteritis and colitis were included because infectious illnesses of unknown etiology are sometimes coded as noninfectious. **G. intestinalis became nationally notifiable in 2002.