for loan only etr - research library | center for...
TRANSCRIPT
INJECTION OF A LIQUID SOil STABILIZER I'NTO SUBGRADE SOIL
DEPARTMENTAL RESEARCH
TEXAS DEPARTMENT OF
TRANSPORTATION
DHT-30
FOR LOAN ONLY eTR
RESEARCH SECTION . FILE DIO-R. P.O. BOX 5051 AUSTTN. TX 78763-5051,512-465-7403, TexAn 241-7403
•
-~ 'if m (
1. Report No.
DHT-30
4. Title and Subtitle
2. Government Accession No.
Injection of a Liquid Soil Stabilizer into Subgrade Soil
7. Author(s) I.e B b ki P E nny 0 rows •..
9. Performing Organization Name and Address Division of Materials and Tests Texas Department of Transportation 40th & Jackson Austin Texas 78763 12. Sponsoring Agency Name and Address
Texas Department of Transportation 125 East 11 th Street Austin, Texas 78701-2183
15. Supplementary Notes
fl u •• rl
Technical Report Documentation Page 3. Recipients Catalog No.
5. Report Date February 1992
6. Performing Organization Code
8. Performing Organization Report No.
10. Work Unit No. (TRAIS)
11. Contract or Grant No.
13. Type of Report and Period Covered
DHT-30
14. Sponsoring Agency Code
... 16. Abstract
..
•
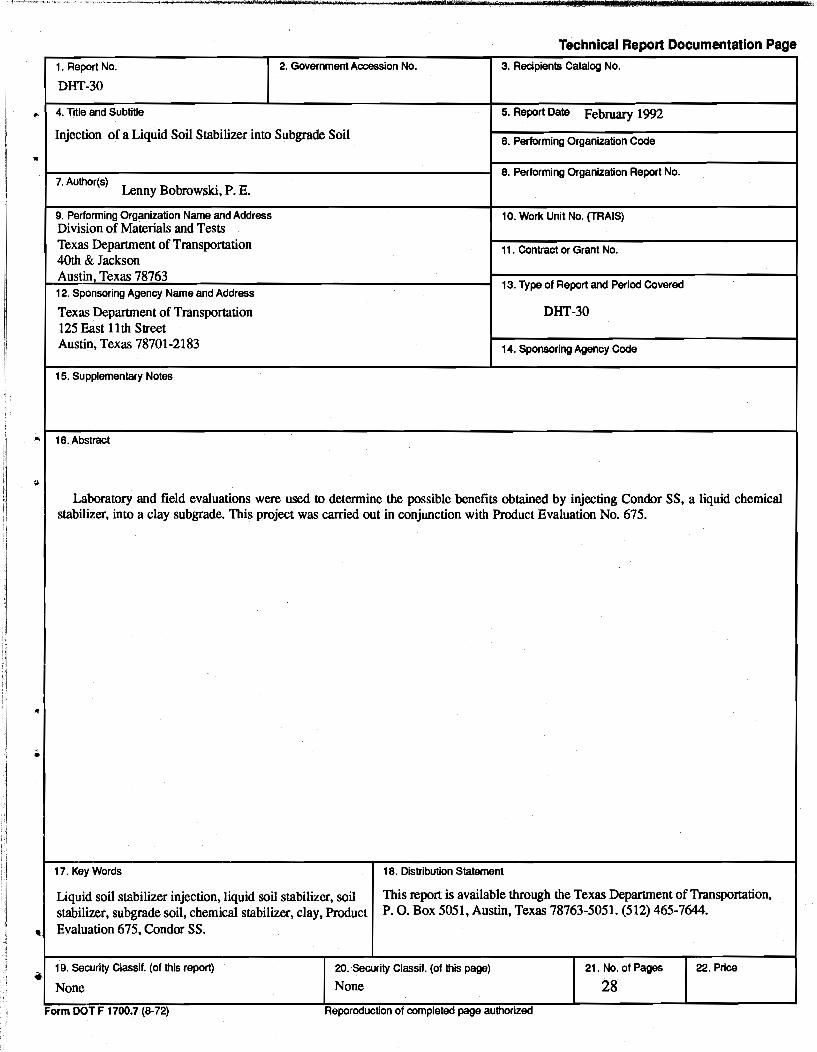
Laboratory and field evaluations were used to determine the possible benefits obtained by injecting Condor SS, a liquid chemical stabilizer, into a clay subgrade. This project was carried out in conjunction with Product Evaluation No. 675 .
17. Key Words 18. Distribution Statement
Liquid soil stabilizer injection, liquid soil stabilizer, soil This report is available through the Texas Department of Transportation, stabilizer, subgrade soil, chemical stabilizer, clay, Product P. O. Box 5051, Austin, Texas 78763-5051. (512) 465-7644. Evaluation 675, Condor SS .
., 19. Security Classif. (of this report)
None
20. Security Classif. (of this page)
None 21. No. of Pages 22. Price
28 Form DOT F 1700.7 (8-72) Reporoduction of completed page authorized

•
..
•
if.
INJECTION OF A LIQUID SOIL STABILIZER INTO SUBGRADE SOIL
Research Report DHT-30
Lenny Bobrowski, P.E .
Texas Department of Transportation
Division of Materials and Tests
February 1992
f.f PL
..
TABLE OF CONTENTS
LIST OF FIGURE-S .... " ....... " ............................................ "........................... v
LIST OF TABLES ....................................................................................... v
DISCLAIMER ............................................................................................ vii
ACI<NOWLEDG EMENTS .................................... ............ ......................... ix •
SUMMARY .................................................................................................. xi •
I. SUBJECT ............. .................... ............ ... ........ ... .................... ... ...... ...... 1
II. PURPOSE ....................... ".................................................................... 1
III. FINDINGS ......................................................................................... 1
IV. PRODUCT DESCRIPTION ................................................................ 2
V. PROJECT LOCATION ........................................................................ 2
VI. PRELIMINARY TESTING .................................................................. 4
• VII. INJECTION PROCESS ..................................................................... 7
.. VIII. POST INJECTION TESTING .......................................................... 10
IX. TEST RESULTS .................................................................................. 10
X. DISCUSSION ...................................................................................... 10
APPENDIX ................................................................................................ 21
..
iii

!!!!!!!!!!!!!!!!!!!"#$%!&'()!*)&+',)%!'-!$-.)-.$/-'++0!1+'-2!&'()!$-!.#)!/*$($-'+3!
44!5"6!7$1*'*0!8$($.$9'.$/-!")':!
po oru. I WI
LIST OF FIGURES
Exhibit A .. e ............................................................... e_'.............. ............ ......... ....... 4
Figure 1: Test Section A Boring Locations. ..... ...... .............. ... ........... .... 5
Figure 2: Test Section B Boring Locations. ............................................ 6
Figure 3: Condor SS Test Sections Typical Infection Spacing Layout. 9
• LIST OF TABLES
• Table 1: Profilometer data. ..................................................................... 8
Table 2: Comparison of Percent Moisture Content, Section A. .......... 11
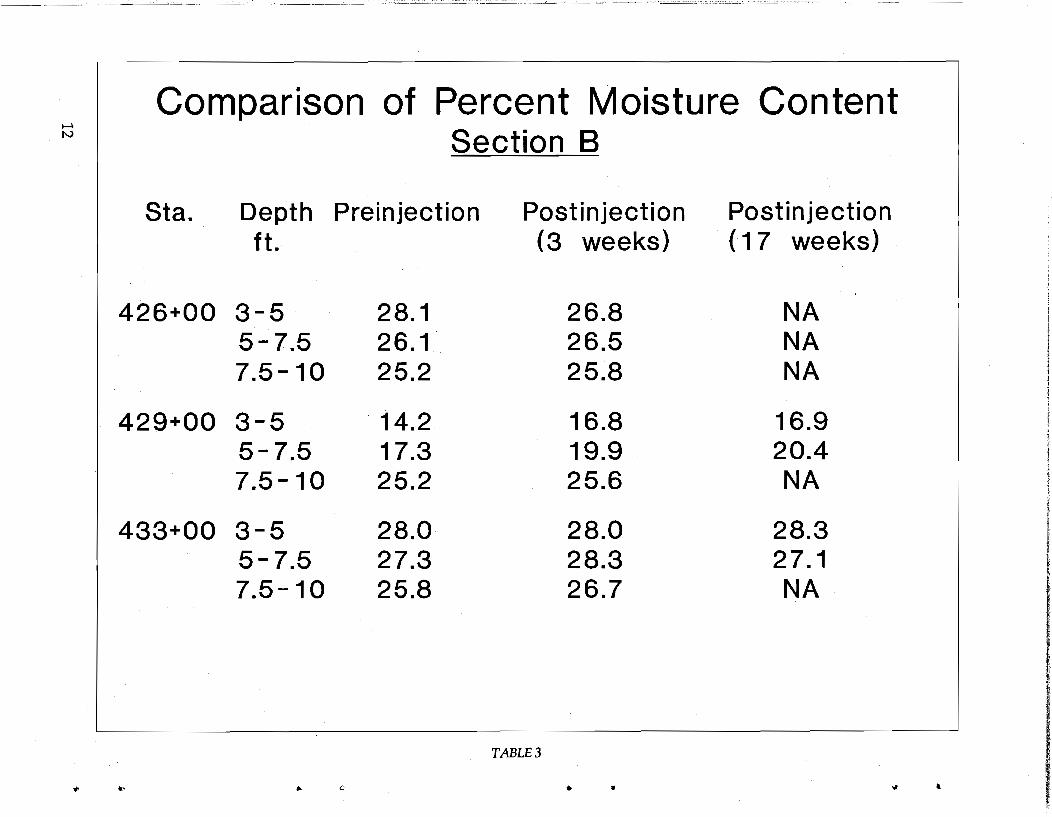
Table 3: Comparison of Percent Moisture Content, Section B ........... 12
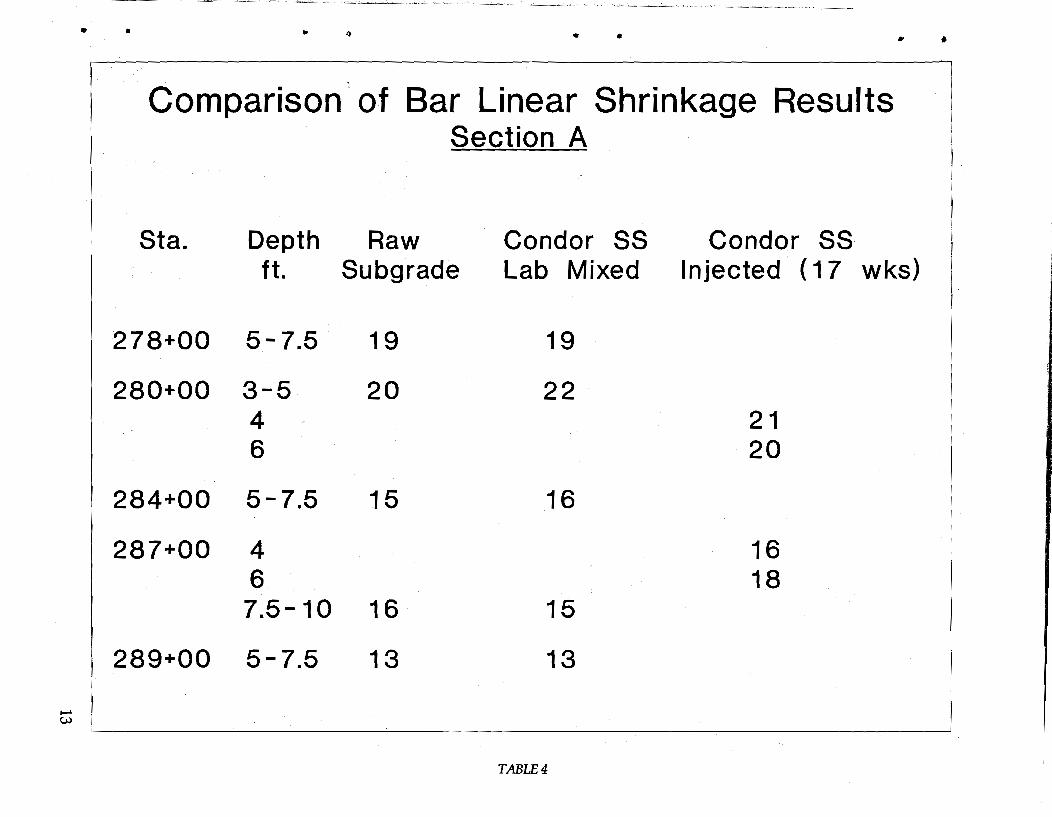
Table 4: Comparison of Bar Linear Shrinkage Results, Section A. ...... 13
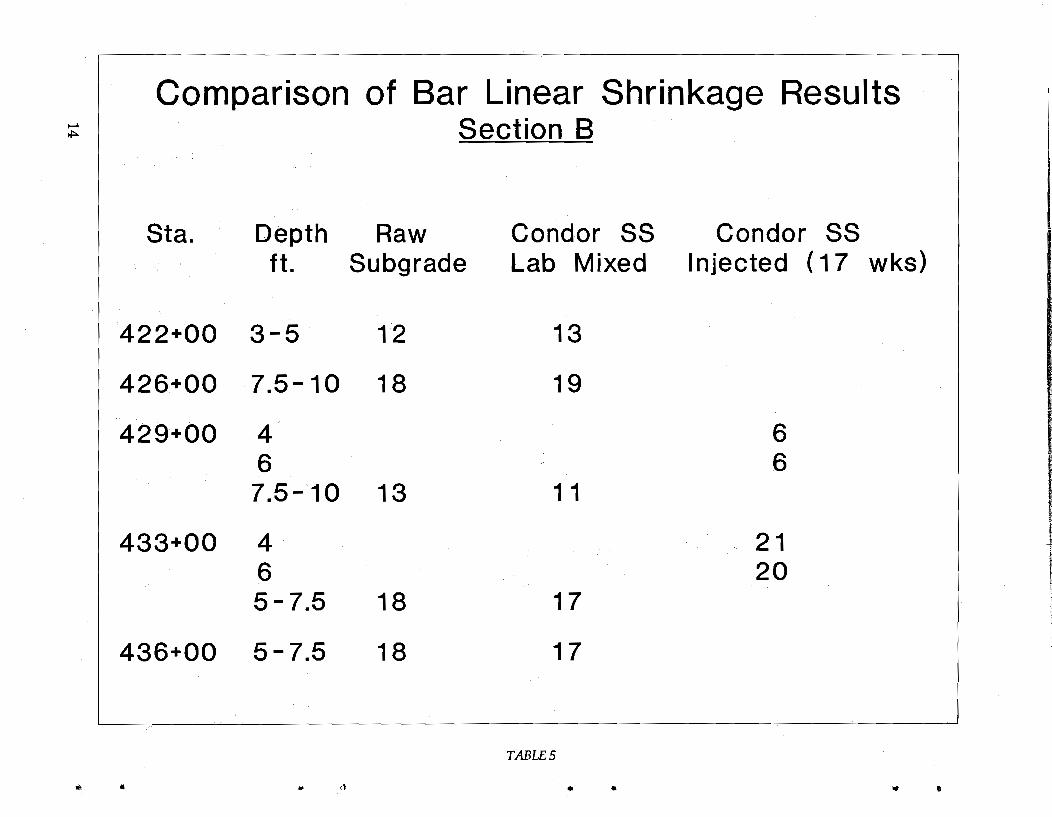
Table 5: Comparison of Bar Linear Shrinkage Results, Section B ....... 14
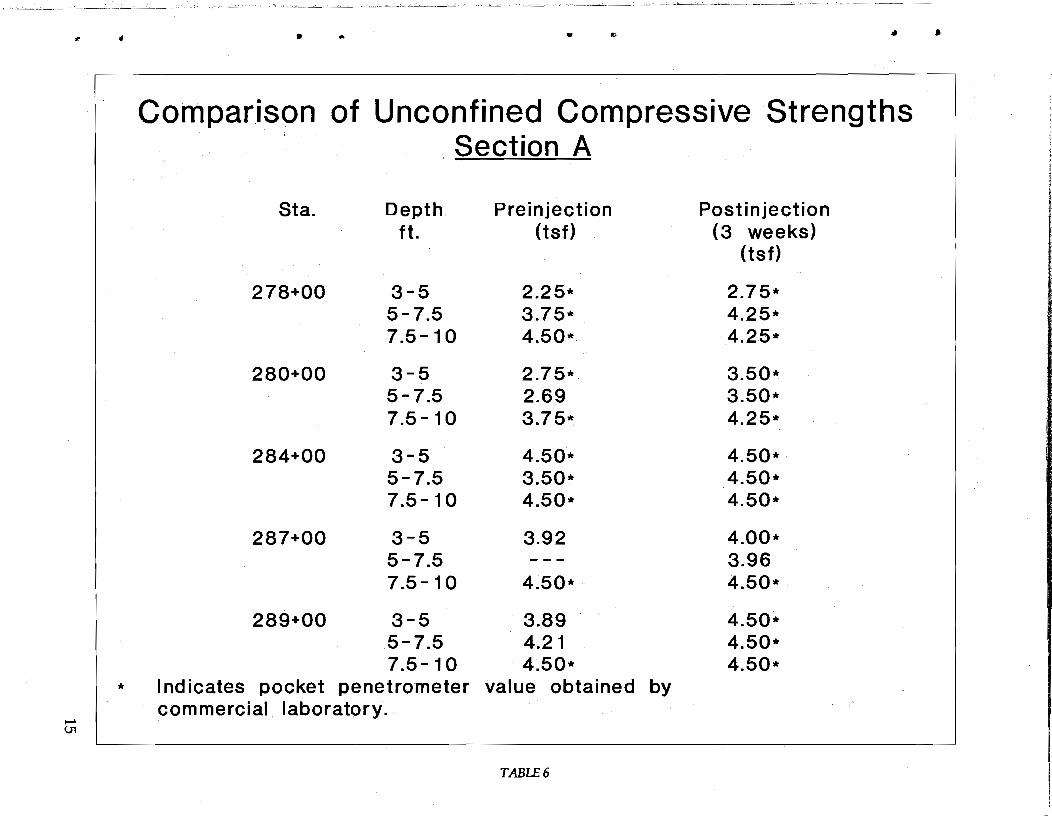
Table 6: Comparison of Unconfined Compressive Strengths, Section A. ..... ... ........ ............ ........ ...... ......... .............. ...... .......... 15
Table 7: Comparison of Unconfined Compressive Strengths, Secti on B... ...... .............. ... ... ........ ......... ............. ....... ........ ........ 16
Table 8: Comparison of Elastic Moduli of Subgrade, Section A .......... 17
Table 9: Comparison of Elastic Moduli of Subgrade, Section B .......... 18
•
• v

!!!!!!!!!!!!!!!!!!!"#$%!&'()!*)&+',)%!'-!$-.)-.$/-'++0!1+'-2!&'()!$-!.#)!/*$($-'+3!
44!5"6!7$1*'*0!8$($.$9'.$/-!")':!

..
•
•
..
..
•
t t __ le- __ f - i Tn
DISCLAIMER
The contents of this report reflect the views of the author who is responsible for the facts and the accuracy of the data presented herein. The contents do not necessarily reflect the official views or poliCies of the Texas Department of Transportation. This report does not constitute a standard, specification, or regulation, nor is it intended for construction, bidding or permit purposes.
The mentioning of brand names used is strictly for information purposes and does not imply endorsement or advertisement of a particular product by the Texas Department of Transportation.
NOT INTENDED FOR CONSTRUCTION, BIDDING, OR PERMIT PURPOSES .
vii

!!!!!!!!!!!!!!!!!!!"#$%!&'()!*)&+',)%!'-!$-.)-.$/-'++0!1+'-2!&'()!$-!.#)!/*$($-'+3!
44!5"6!7$1*'*0!8$($.$9'.$/-!")':!
•
•
•
..
•
1 ., n r r1 "r ,.
ACKNOWLEDGEMENT
The author would like to acknowledge the help extended by individuals and organizations at different stages of this project. I would like to express appreciation to the Tyler District for providing the test sections. Additionally, my gratitude goes to Mr. Dennis Cooley, P.E., of the Mineola residency and Mr. Billy Jack Rushing of the Canton Maintenance office for the various services they provided, including traffic control and the labor involved in the Condor SS injection process. Special thanks is also extended to Mr. Wayne Leake of the Tyler District Laboratory for assisting in obtaining the seventeen-week postinjection samples. My gratitude goes to Mr. Bob Briggs, P.E., of D-18 Pavement Management for gathering the profilometer and falling weight deflectometer data as well as Mr. Bob Mikulin, P.E., of D-8 for his assistance in reducing the FWD data.
Finally, the author would like to thank ProChemical for providing the Condor SS and supplying the injection apparatus and the expertise necessary to operate it.
ix

!!!!!!!!!!!!!!!!!!!"#$%!&'()!*)&+',)%!'-!$-.)-.$/-'++0!1+'-2!&'()!$-!.#)!/*$($-'+3!
44!5"6!7$1*'*0!8$($.$9'.$/-!")':!
,.
..
•
•
•
•
•
SUMMARY
This investigation resulted in two contradicting results. One indication shows there was no increase in the subgrade strength (elastic modulus as determined by the Falling Weight Deflectometer, FWD) as a result of injecting the subgrade with the Condor SS solution. Conversely, the commercial laboratory which determined compressive strengths of undisturbed samples taken prior to and after the injection process indicates an increase in unconfined compressive strength. It should be noted that due to the fractured nature of the cores, actual compressive strength testing could only be accomplished on four cores. Therefore, the strengths were determined by the pocket penetrometer.
Since the initial postinjection FWD data was obtained approximately three and one-half weeks after injection, it was felt there may not have been adequate opportunity for the dissipation of moisture from the subgrade. Therefore, additional FWD data was obtained approximately seventeen weeks postinjection.
Laboratory testing included performing moisture contents (Test Method Tex-103-E) and bar linear shrinkage (Test Method Tex-107-E) on preinjection as well as postinjection samples.
Field performance evaluation will include visual surface inspection over time to see if these two sections continue to crack, heave, and rut as badly as they have in the past.
xi
,.
•
II
•
•
• t llrriHlr 1' . II
I. SUBJECT
This project analyzed the affect of injecting a liquid soil stabilizer (Condor SS) into a clay subgrade. The analyses included evaluation of both laboratory data and field data.
II. PURPOSE
The purpose of these analyses was to determine if a liquid soil stabilizer (Condor SS) may be a viable method of stabilizing a clay subgrade susceptible to shrink/swell problems.
III. FINDINGS
1. The commerdallaboratory, by the use of the pocket penetrometer, indicates an increase in compressive strength of the treated subgrade.
2. Comparison of moisture content and bar linear shrinkage results on preinjection and postinjection samples indicate no Significant improvement due to injection of Condor SS.
3. Elastic modulus results, obtained by the. Texas Department of Transportation's FWD apparatus, indicate a slight decrease in the strength of the treated subgrade at three weeks postinjection.
4. Elastic modulus results, obtained by the Texas Department of Transportation's FWD apparatus, indicate a slight decrease in the strength of the treated subgradeof the southbound lanes and a slight increase in the strength of the treated subgrade of the northbound lanes of each section at seventeen weeks postinjection. .
S. Profilometer data may be gathered at a later date to compare with data gathered prior to the injection process to see if the serviceability index has stabilized, assuming no remedial work has been done to the test sections. If any surface work has been done to the sections, the profilometer data may be used as the baseline to compare future profilometer data. This will allow comparison of serviceability indices of the new pavement surfaces.
1
_~_' ~_"' ____________ ,_~~ __ ---,--.. -'-"'_@-'"------w'I~_~ -, _ .. _________ _
IV. PRODUCT DESCRIPTION
Condor SS is a sulfonated oil, water soluble concentrate, that when mixed with water functions as an ion exchange medium and ionizes a portion of the water to H+ , OH- , and the hydronium ion, H30+.
The concept or theory behind Condor 55 is that, when diluted with water and mixed with clay-bearing soils, the Condor 55 reacts with the bound water within the clay. The bound water on the clay platelets is ionized, and as such, is released from the clay. Once released, the previously bound water is able to permeate (drain) as "free" water.
A copy of the "Material Safety Data Sheet" (MSDS) is included in the appendix. Condor SS is composed of 1.6 percent ion exchange resins, 1.6 percent napthalene sulfonic acid, 23 percent sulfuric acid, and the balance is made up of water. It has no traces of any herbicides, pesticides, insecticides, or heavy metals.
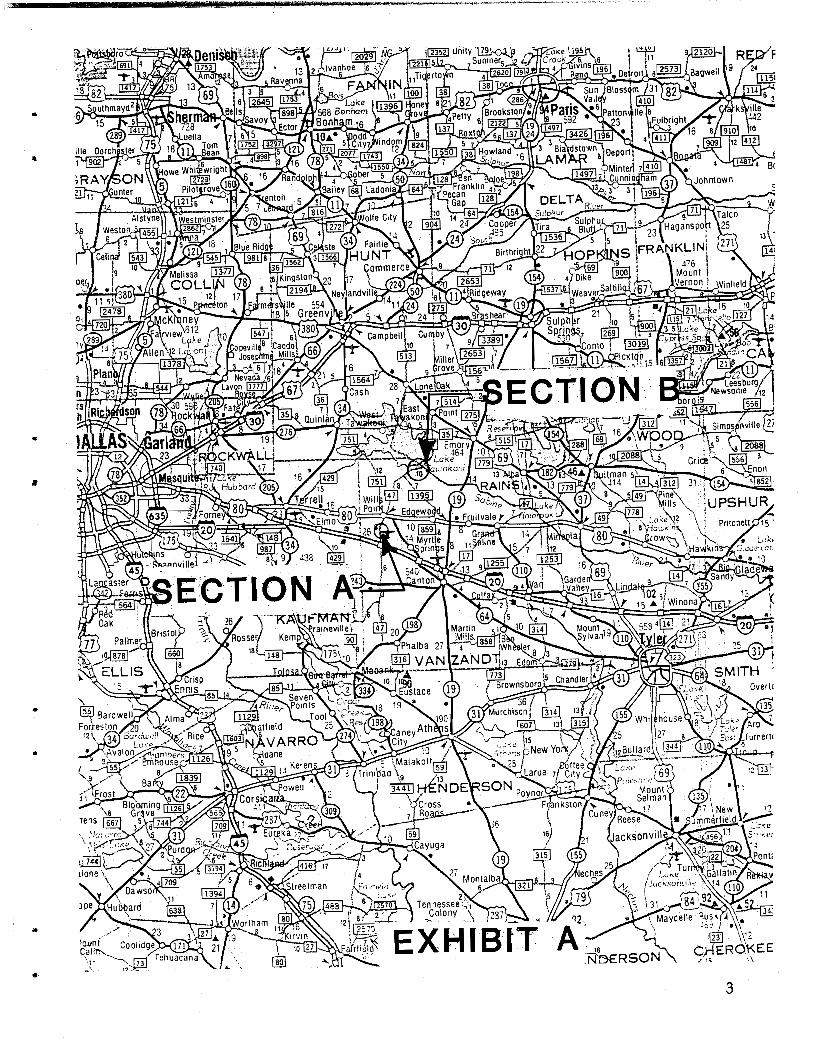
V. PROJECT LOCATION
Two test sections were identified for this project. Both sections lie in Van Zandt county, which is located in the Tyler District (see Exhibit A). These sections have a long history of exhibiting severe shrink/swell characteristics in addition to cracking and rutting. One section (A) is located approximately one-half mile north of IH-20 on FM 47. It is approximately 1100 linear feet in length. The pavement structure consists of approximately 8 inches of flexible base with a seal coat. This pavement is badly rutted with rut depths ranging from 1 inches to 2-1/2 inches. The second test section (B) is located seven miles north of Wills Point, Texas on FM 47, just north of FM 1395. This section is 700 linear feet in length. This pavement was recently reconstructed, with a flexible base layer 10 to 12 inches deep and a 2-inch HMAC surface. Overall, this pavement was in good condition; yet, even with the recent reconstruction, some extreme cracking had occurred along with some minor rutting.
2
..
•
•
•
I; s_
..
•
•
..
..
. '
3

VI. PRELIMINARY TESTING
Undisturbed cores were taken from both sections prior to injection. Five borings were taken from section A (see Figure 1), and three were taken from section B (see Figure 2). Tests performed include moisture content, liquid limit (Test Method Tex-l04-E), plastic limit (Test Method Tex-IOS-E), plasticity index (Test Method Tex-l06-E), bar linear shrinkage and unconfined compressive strength (Test Method Tex-118-E). Due to the soft, fractured nature of the cores, only four unconfined compressive strengths could actually be performed. All other strengths were determined by the pocket penetrometer. The commercial laboratory which obtained the preinjection samples as well as the three-week postinjection samples performed all tests on these samples, except the bar linear shrinkage. The bar linear shrinkage test was performed on the preinjection samples by the Division of Materials and Tests. This division performed no testing on the three-week postinjection samples since they never received them from the commercial lab.
Additional preinjection testing included gathering profilometer data and FWD data on both sections. The profilometer data generates the serviceability index (SI), which is an indicator of the ride quality of a pavement surface. It is an empirical number ranging from 0 to 5. A pavement with an SI of 0 would be extremely rough, whereas a pavement with an SI of 5 would be very smooth. The typical break point for deciding when some form of level-up treatment needs to be done to the surface is when the pavement SI is 2 or below for low-volume collector highways. The preinjection serviceability indices are shown in Table 1.
The FWD data allows the back-calculation of the subgrade modulus of elasticity, or the inherent rigidity or stiffness of the subgrade. This backcalculation was performed with version 4.0 of the "Modulus" program.
4
..
•
..
•

.. "
<.J1
• • • •
Test'Section A Boring Locations
Sta. 284+00
I
j
• !
/
, /
/
FM 47 .---- -' -.. --- ----. --
Sta. 280+00
(I)' c:: : .1 Sta. 287+00 ~
(I) -c:: (I)
U
, , • Sta. 289+00
o
f ~ FIGUREl
.. To Wills Point
Sta. 278+00
•
'II' ~

-'-"
0\
.. ,
Test Section B Boring Locations
To Wi lis Point
Sta. 422+00
-4IIIl----------- --------
Sta. 426+00
FIGURE 2
It .. .. •
fN\ A 1 Sla. 440-00
.--Sta. 436+00 • --------
~
To Towakani Dam
Area of test section
actually injected
WI :a

• •
'l
It .. • •
PROFILOMETER DATA Serviceability Indices
Section A Section B
1.81 3.13
Very good - .4.0 to 5.0 Good - 3.0 to 4.0 Fair - 2.0 to 3.0 Poor - 1.0 to 2.0 Very poor - 0.0 to 1.0
TABLE 1
• •
VII. INJECTION PROCESS
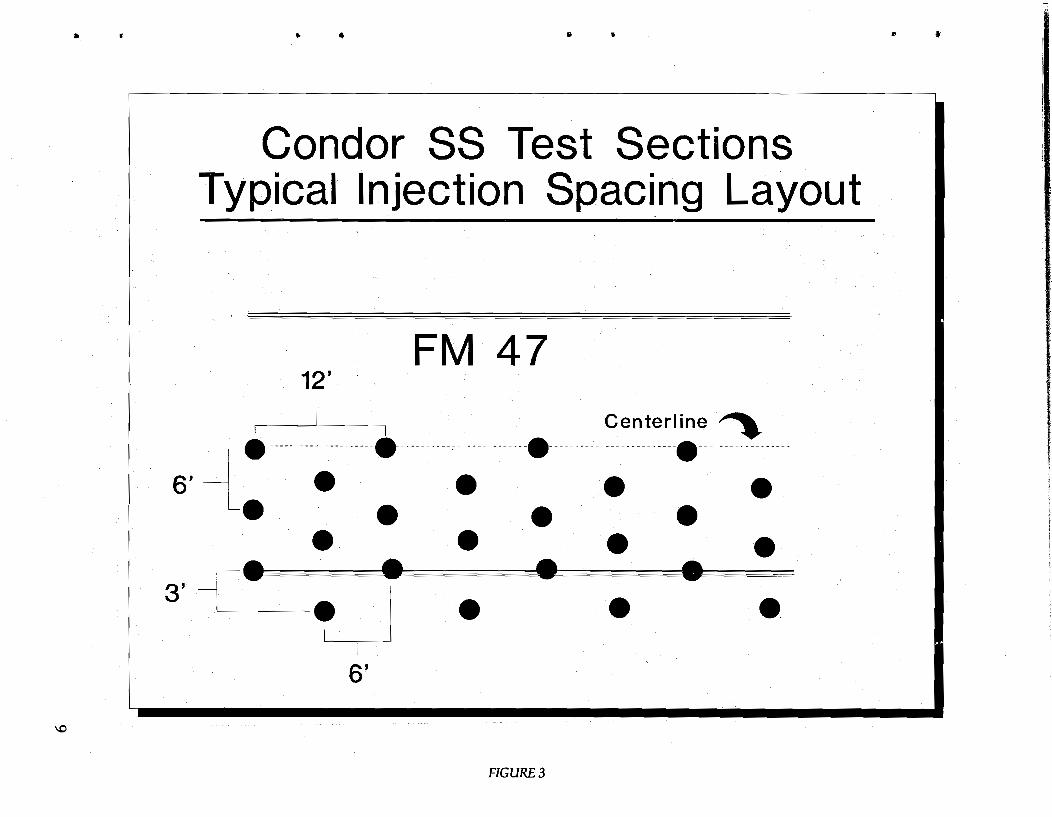
The injection of both test sections transpired from August 12, 1991, through August 16, 1991. The first section injected was Section A. The injection grid was laid out on staggered 6-foot centers (Figure 3). The injection grid was carried 3 feet into the shoulder.
Holes were punched in accordance with the pattern laid out by using a 12 inch long, 2-1/2 inch diameter pavement punch, attached to a Hughes impactor on a backhoe. This punch penetrated the seal coat and the compacted base material. This was important since it would be difficult for the injection probe to penetrate through the compacted base material.
The Condor SS/water mixture was injected using S-foot and 6-foot wands and a working pressure of approximately 2000 psi. Four wands were operated simultaneously across the pavement width. The wands were attached to a mobile trailer which housed four pumps,each rated at 18 hp and 5.1 gpm, along with two SOO-gallon plastic water tanks. Each tank supplied two wands. A lOOO-gallon water truck supplied by the TxDOT was ferried to and from the water source. This allowed continuous injection. The high injection pressure allowed the wands to penetrate the subgrade and to reach their ultimate penetration. The geotechnical report for this project specified an injection time of three minutes from inception to completion for each hole.
The injection of Section B was somewhat more difficult. Since the pavement had a base layer of 12 inches pl1.ls a 2-inch layer of HMAC, the 12-inch long pavement punch could not entirely penetrate the compacted base material. This made wand penetration extremely labor intensive and time consuming. After a futile search for a longer punch, it was decided to try a hand-held Ponjour jackhammer with an 18-inch bit. This proved very successful, and allowed much easier insertion of the wands. Aside from the above problem, all other aspects of the injection process were the same for both sections. On Section B, where extensive cracks had developed in the northbound shoulder, the injection grid was carried an additional three feet into the shoulder. Approximately 150 lineal feet were treated in this manner.
8
•
..
.. Iii .. •
_____ ._
.L
U.·'
......., :::J o
W>
' cm
0
....1
.-""""0
) U
c (1
).(1
)U
m
.......,0. W
Cl)
~c o
CI) .-(1)o C
I) ~ .~
OC
-0
-c
om
() .S:2
0.
>I-
,
Cl)
:
.~ e i:'
(1) ,
-:
C
' (1)
,
u: e
e , , , ,
• , , , , , ,
• , , , , , , ,
e e
: e e
, , , , ,
.. (0
9
VIII. POSTINJECTION TESTING
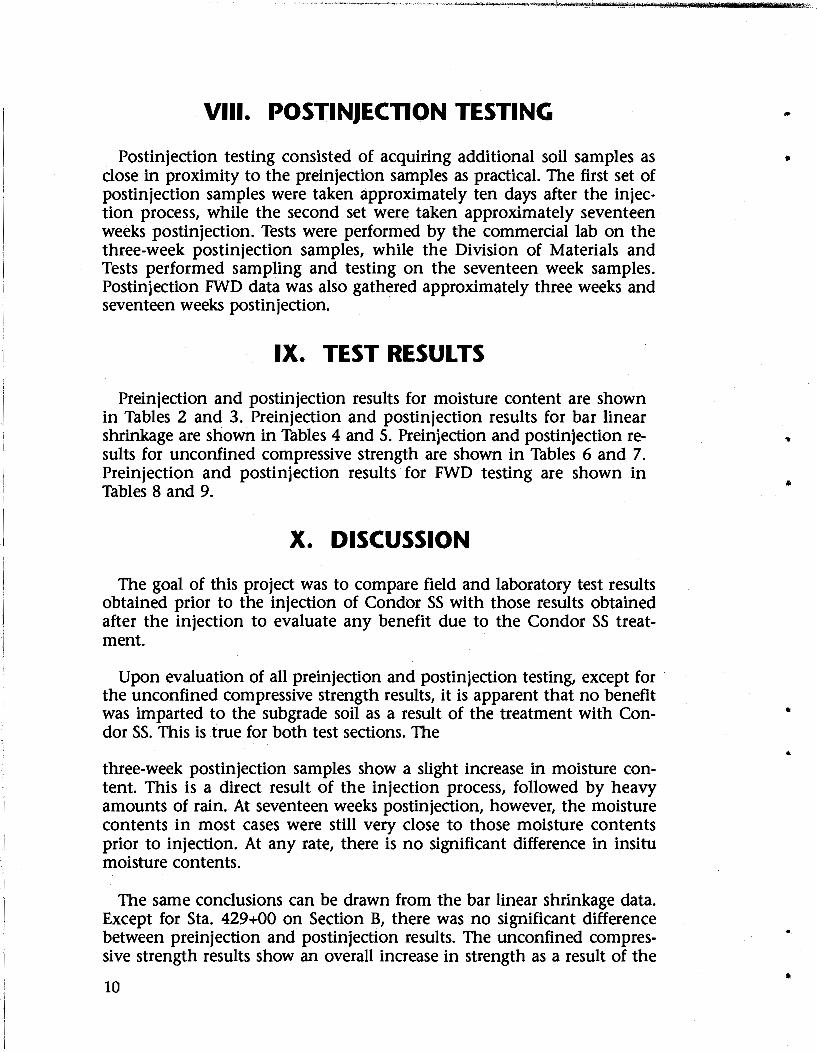
Postinjection testing consisted of acquiring additional soil samples as close in proximity to the preinjection samples as practical. The first set of postinjection samples were taken approximately ten days after the injection process, while the second set were taken approximately seventeen weeks postinjection. Tests were performed by the commercial lab on the three-week postinjection samples, while the Division of Materials and Tests performed sampling and testing on the seventeen week samples. Postinjection FWD data was also gathered approximately three weeks and seventeen weeks postin jection.
IX. TEST RESULTS
Preinjection and postinjection results for moisture content are shown in Tables 2 and 3. Preinjection and postinjection results for bar linear shrinkage are shown in Tables 4 and S. Preinjection and postinjection results for unconfined compressive strength are shown in Tables 6 and 7. Preinjection and postinjection results for FWD testing are shown in Tables 8 and 9.
X. DISCUSSION
The goal of this project was to compare field and laboratory test results obtained prior to the injection of Condor SS with those results obtained after the injection to evaluate any benefit due to the Condor SS treatment.
Upon evaluation of all preinjection and postinjection testing, except for the unconfined compressive strength results, it is apparent that no benefit was imparted to the subgrade soil as a result of the treatment with Condor SS. This is true for both test sections. The
three-week postinjection samples show a slight increase in moisture content. This is a direct result of the injection process, followed by heavy amounts of rain. At seventeen weeks postinjection, however, the moisture contents in most cases were still very close to those moisture contents prior to injection. At any rate, there is no significant difference in insitu moisture contents.
The same conclusions can be drawn from the bar linear shrinkage data. Except for Sta. 429+00 on Section B, there was no significant difference between preinjection and postinjection results. The unconfined compressive strength results show an overall increase in strength as a result of the
10
11
..

...... ......
• If . ., to • .. ,
Comparison of Percent Moisture Content Section A
Sta. Depth Preinjection Postinjection Postinjection ft. (3 weeks) (17 weeks)
278+00 3-5 24.8 24.9 NA 5-7.5 28.5 28.2 NA 7.5-10 25.2 25.6 NA
280.00 3-5 22.9 24.6 20.1 5-7.5 25.6 28.2 24.9 7.5 -10 25.2 25.6 NA
284+00 3-5 17.8 19.5 NA 5-7.5 23.8 25.8 NA 7.5-10 25.8 26.7 NA
287+00 3-5 22.0 25.0 21.6 5-7.5 19.4 20.8 20.2 7.5-10 19.6 20.1 NA
289+00 3-5 21.4 26.1 NA 5-7.5 22.5 23.5 NA 7.5-10 24.8 26.6 NA
TABLE 2
t-4 N
Comparison of Percent Moisture Content Section B
Sta. Depth Preinjection Postinjection Postinjection ft. (3 weeks) (17 weeks)
426+00 3-5 28.1 26.8 NA 5-7.5 26.1 26.5 NA 7.5-10 25.2 25.8 NA
429+00 3-5 14.2 16.8 16.9 5-7.5 17.3 19.9 20.4 7.5-10 25.2 25.6 NA
433+00 3-5 28.0 28.0 28.3 5-7.5 27.3 28.3 27.1 7.5 -10 25.8 26.7 NA
TABLE 3
.. ", .. (.; .. . >/I ,
...... VJ
.. . .. ') • •
Comparison' of Bar Linear Shrinkage Results Section A
5ta. Depth Raw Condor 55 Condor 55
.. .
ft. 5ubgrade Lab Mixed Injected (17 wks)
278+00 5-7.5 19 19
280+00 3-5 20 22 4 21 6 20
284+00 5-7.5 15 16
287+00 4 16 6 18 7.5-10 16 15
289+00 5-7.5 13 13
TABLE 4
...... ~
Comparison of Bar Linear Shrinkage Results Section B
Sta. Depth Raw Condor SS Condor SS ft. Subgrade Lab Mixed Injected (17 wks)
422+00 3-5 12 13
426+00 7.5-10 18 19
429+00 4 6 6 6 7.5-10 13 1 1
433+00 4 21 6 20 5-7.5 18 17
436+00 5-7.5 18 17
TABLES
.. . ;. ,) . .. .'41 "
it f·
* ..... 01
. ... w C; ...
Comparison of Unconfined Compressive Strengths Section A
Sta. Depth Preinjection Post injection ft. (tsf) (3 weeks)
(tsf)
278+00 3-5 2.25* 2.75* 5-7.5 3.75* 4.25* 7.5 -10 4.50* 4.25*
280+00 3-5 2.75* 3.50* 5-7.5 2.69 3.50* 7.5-10 3.75* 4.25*
284+00 3-5 4.50* 4.50* 5-7.5 3.50* 4.50* 7.5 -10 4.50* 4.50*
287+00 3-5 3.92 4.00* 5-7.5 3.96 7.5-10 4.50* 4.50*
289+00 3-5 3.89 4.50* 5-7.5 4.21 4.50* 7.5-10 4.50* 4.50*
I nd icates pocket penetrometer value obtained by commercial laboratory .
TABLE 6

J-I 0\
*
'" "'
Comparison of Unconfined Compressive Strengths Section B
Sta. Depth Preinjection ft. (tsf)
426+00 3-5 4.25* 5-7.5 2.50* 7.5-10 3.75*
429+00 3-5 2.75* 5-7.5 0.75* 7.5-10 1.25*
433+00 3-5 4.25* 5-7.5 2.75* 7.5-10 4.50*
Postinjection (3 weeks)
(tsf)
3.96 3.50* 4.25*
3.50* 2.11 1.81
4.50* 3.25* 4.50*
Indicates pocket penetrometer value obtained by commercial lab.
TABLE 7
.. ,., .. .,. ... .'

t-1 ""-l
I' f' . .. ,J .. ,. f
Comparison of Elastic Moduli of Subgrade Section A
Preinjection Modulus. psi
Northbound Lane 9,900
Southbound Lane 9,600
Postinjection Modulus, psi
(3-1/2 Weeks)
Northbound Lane 9,500
Southbound Lane 8,900
TABLE 8
Postinjection Modulus, psi (17 Weeks)
Northbound Lane 10,000
Southbound Lane 9,300

1-1 00
... (
Comparison of Elastic Moduli of Subgrade Section B
Preinjection Modulus, psi
Northbound Lane 11,400
Southbound Lane 11,600
..,. ..,
Postinjection Modulus, psi (3-1/2 Weeks)
Northbound Lane 10,300
Southbound Lane 10,300
TABLE 9
"'i ...
Postinjection Modulus, psi (17 Weeks)
Northbound Lane 12,400
Southbound Lane 10,500
.. t
T ~ !
Condor SS treatment. However, the fact that the pocket penetrometer was used and no unconfined compressive strength tests were performed by the Division of Materials and Tests lends some skepticism to these comparisons.
Finally, the FWD results for both sections show no significant improvement in elastic modulus as a result of the Condor SS injection. These findings probably are the most important set of data involved with this evaluation. This is because the Division of Highway Design (D-8) will be basing their entire flexible pavement design parameters on data obtained by the FWD. In light of this fact, a great deal of importance was placed on this particular analysis.
In summary, no significant impact or improvement was exhibited as a result of the Condor SS injection process. Except for the unconfined compressive strength results, which can not be verified by the Division of Materials and Tests, all evaluation criteria indicate no significant difference between preinjection and postinjection results. Ultimately, visual field observation over time will be the best determination of any benefit received from the Condor SS injection. These test sections have a long history of failure. If the incidence of failure and the need for maintenance decrease, then perhaps the Condor SS injection did improve the subgrade in a way which could not be measured or detected by current laboratory evaluation methods.
19

!!!!!!!!!!!!!!!!!!!"#$%!&'()!*)&+',)%!'-!$-.)-.$/-'++0!1+'-2!&'()!$-!.#)!/*$($-'+3!
44!5"6!7$1*'*0!8$($.$9'.$/-!")':!
1-· --------____ --___________ "_,_, __ , __
APPENDIX •
•
(
21

!!!!!!!!!!!!!!!!!!!"#$%!&'()!*)&+',)%!'-!$-.)-.$/-'++0!1+'-2!&'()!$-!.#)!/*$($-'+3!
44!5"6!7$1*'*0!8$($.$9'.$/-!")':!

,
EARTH SCIENCE
PRODUCTS. CORP.
A.GENERAL INFORMATION
TRADE NAME
CONDORSS
liu.! .H!
I CONDOR- SS I
CHEMICAL NAME AND/OR SYNONYM
PRODUCT SAFETY DATA SHEET
ION EXCHANGE RESINS AND SURFACTANTS IN SULFURIC ACID
MANUFACTURER
EARTHSClliNCEPRODUCTSCORPORATION 2 Yorick Lake Oswego, Oregon 97035-1918
CONTACT PHONE DATE OF ISSUE
LEONARD REINERTSEN (503) 255-6898 or RICHARD GEARHART (503) 636-0697 FEBRUARY 1988
B. FIRST AID MEASURES
EMERGENCY PHONE NUMBER 1·503·636·0697 Office Hours 1-503-678-1216 Other Hours 1-503-255-6898
SKIN OR EYES: Immediately flush with plenty of water. For eyes continue for at least 15 minutes. If irritation continues get medical attention.
INGESTION: Do not induce vomiting. If conscious give several glasses of milk (prefeITed) or water.
INHALATION: Remove to fresh air. If breathing has stopped. give artificial respiration. If breathing with difficulty, give oxygen. provided a qualified operator is available.
GET IMMEDIATE MEDICAL ASSISTANCE for ingestion, eye contact, or continued labored breathing.
23
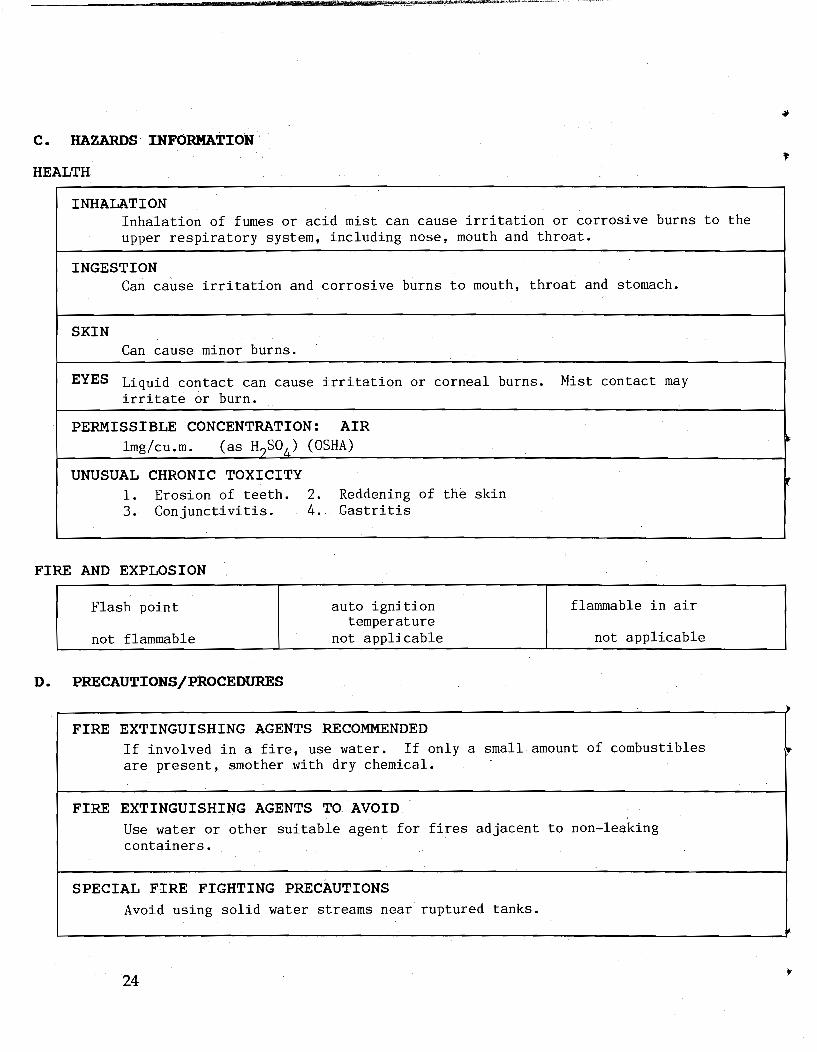
C. HAZARDS INFORMATION
HEALTH
INHALATION Inhalation of fumes or acid mist can cause irritation or corrosive burns to the upper respiratory system, including nose, mouth and throat.
INGESTION Can cause irritation and corrosive burns to mouth, throat and stomach.
SKIN Can cause minor burns.
EYES Liquid contact can cause irritation or corneal burns. Mist contact may irritate or burn.
PERMISSIBLE CONCENTRATION: AIR lmg/cu.m. (as H?SOa) (OSHA)
..
UNUSUAL CHRONIC TOXICITY , 1. Erosion of teeth. 2. Reddening of the skin 3. Conjunctivitis. 4. Gastritis
FIRE AND EXPLOSION
Flash point auto ignition flammable in air temperature
not flammable not applicable not applicable
D. PRECAUTIONS/PROCEDURES
FIRE EXTINGUISHING AGENTS RECOMMENDED If involved in a fire, use water. If only a small amount of combustibles ~ are present, smother with dry chemical.
FIRE EXTINGUISHING AGENTS TO AVOID Use water or other suitable agent for fires adjacent to non-leaking containers.
SPECIAL FIRE FIGHTING PRECAUTIONS Avoid using solid water streams near ruptured tanks.
24
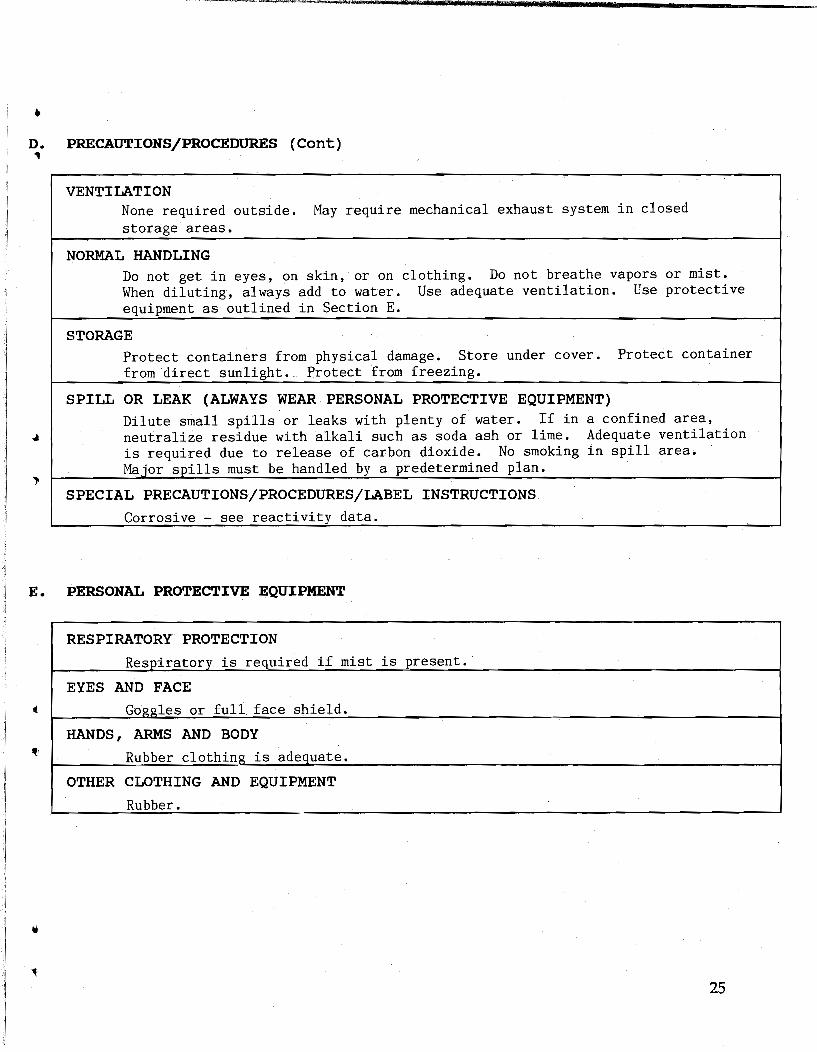
D. PRECAUTIONS/PROCEDURES (Cont) .. VENTILATION
None required outside. May require mechanical exhaust system in closed storage areas.
NORMAL HANDLING Do not get in eyes, on skin, or on clothing. Do not breathe vapors or mist. When diluting, always add to water. Use adequate ventilation. Use protective equipment as outlined in Section E.
STORAGE Protect containers from physical damage. Store under cover. Protect container from direct sunlight. Protect from freezing.
SPILL OR LEAK (ALWAYS WEAR PERSONAL PROTECTIVE EQUIPMENT) Dilute small spills or leaks with plenty of water. If in a confined area, neutralize residue with alkali such as soda ash or lime. Adequate ventilation is required due to release of carbon dioxide. No smoking in spill area. Major spills must be handled by a predetermined plan.
SPECIAL PRECAUTIONS/PROCEDURES/LABEL INSTRUCTIONS
Corrosive - see reactivity data.
E. PERSONAL PROTECTIVE EQUIPMENT
RESPIRATORY PROTECTION
Respiratorv is required if mist is present.
EYES AND FACE
Goggles or full face shield.
HANDS, ARMS AND BODY
I i Rubber clothing is adequate.
OTHER CLOTHING AND EQUIPMENT
Rubber.
25
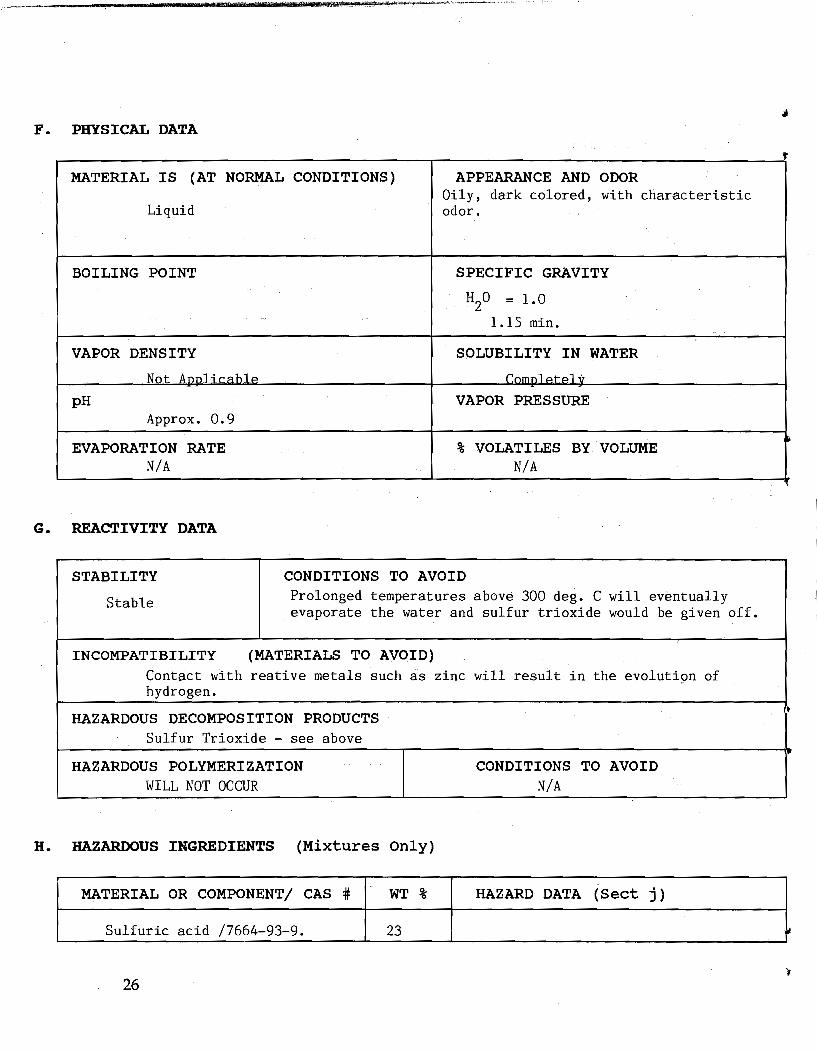
F. PHYSICAL DATA
MATERIAL IS (AT NORMAL CONDITIONS) APPEARANCE AND ODOR Oily, dark colored, with characteristic
Liquid odor.
BOILING POINT SPECIFIC GRAVITY
H2O = 1.0
1.15 min.
VAPOR DENSITY SOLUBILITY IN WATER
Not Annlicahle C.omnletelv
pH VAPOR PRESSURE Approx. 0.9
EVAPORATION RATE % VOLATILES BY VOLUME ~
N/A N/A
G. REACTIVITY DATA
STABILITY CONDITIONS TO AVOID
Stable Prolonged temperatures above 300 deg. C will eventually evaporate the water and sulfur trioxide would be given off.
INCOMPATIBILITY (MATERIALS TO AVOID) Contact with reative metals such as zinc will result in the evolution of hydrogen.
HAZARDOUS DECOMPOSITION PRODUCTS Sulfur Trioxide - see above
HAZARDOUS POLYMERIZATION CONDITIONS TO AVOID WILL NOT OCCUR N/A
H. HAZARDOUS INGREDIENTS (Mixtures Only)
MATERIAL OR COMPONENT/ CAS # WT % HAZARD DATA (Sect j)
Sulfuric acid /7664-93-9. 23 II
26
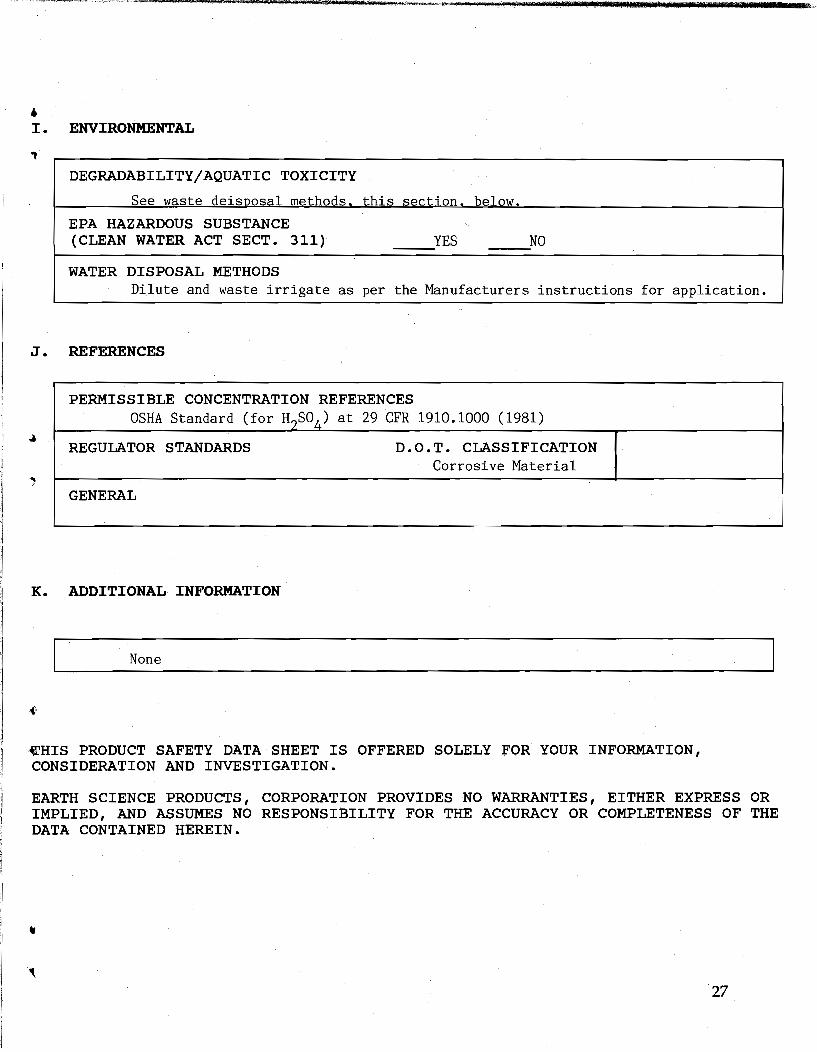
• I. ENVIRONMENTAL
, DEGRADABILITY/AQUATIC TOXICITY
See waste deisDosal methods this section below.
EPA HAZARDOUS SUBSTANCE (CLEAN WATER ACT SECT. 311) YES NO
WATER DISPOSAL METHODS Dilute and waste irrigate as per the Manufacturers instructions for application.
J. REFERENCES
PERMISSIBLE CONCENTRATION REFERENCES OSHA Standard (for H2SO4) at 29 CFR 1910.1000 (1981)
REGULATOR STANDARDS D.O.T. CLASSIFICATION Corrosive Material
GENERAL
K. ADDITIONAL INFORMATION
None
~HIS PRODUCT SAFETY DATA SHEET IS OFFERED SOLELY FOR YOUR INFORMATION, CONSIDERATION AND INVESTIGATION.
EARTH SCIENCE PRODUCTS, CORPORATION PROVIDES NO WARRANTIES, EITHER EXPRESS OR IMPLIED, AND ASSUMES NO RESPONSIBILITY FOR THE ACCURACY OR COMPLETENESS OF THE DATA CONTAINED HEREIN.
27
7