for personal use only - asx · the blackmores group’s strategic focus on retaining market...
TRANSCRIPT

healthy
For
per
sona
l use
onl
y

Blackmores improves people’s lives by delivering the world’s best natural health solutions that become people’s first choice in healthcare. We achieve this by translating our unrivalled heritage and knowledge into innovative, quality branded healthcare solutions that work.Passion for Natural HealthOur enthusiasm and belief in a natural, holistic approach to health inspires us to excellence in everything we do.IntegrityWe are honest, trustworthy and committed to the highest standards of personal, professional and business behaviour.RespectWe treat each other with fairness, dignity and compassion and we embrace diversity.LeadershipAs a company, in teams and as individuals, we use our wisdom, experience and knowledge to inspire and influence everyone to be their best.Social ResponsibilityOur actions demonstrate our care, respect and compassion for our people, the broader community and the environment.
contents01 Our Passion and our Values03 About Blackmores 05 Chairman’s Introduction07 CEO’s Year in Review20 Community22 Healthy People, Healthy Planet24 Executive Team27 Five Year History28 Directors‘Profiles31 Directors’ Report46 Auditor’s Independence Declaration 47 Independent Auditor’s Report49 Directors’ Declaration50 Consolidated Financial Statements89 Additional Information90 Company Information
COveR ImAgeCommunity commitment: Sarah Tait, Quality Compliance Officer – Distribution, and Scott Choi – Junior Legal Counsel, participate in Clean Up Day at mona vale Beach.
The 53rd Annual General Meeting of the Company will be held at 11am on Thursday 29 October 2015 at the Blackmores Campus, 20 Jubilee Avenue, Warriewood NSW 2102.
PIRLS
1B
la
ck
mo
re
s a
nn
ua
l re
po
rt
20
15
For
per
sona
l use
onl
y

about––––
Blackmores is passionate about natural health and inspires people to take control of, and invest in, their health and wellbeing. We are leaders in developing and marketing products and services that deliver a more natural approach to health, based on our expertise in vitamins, minerals, herbs and nutrients.
The Company operates in Australia, New Zealand and Asia and currently employs more than 900 people, with a head office and Campus based in Warriewood on Sydney’s Northern Beaches. Blackmores became a publicly listed company in may 1985.
Blackmores has been an industry leader in Australia for more than 80 years. The Company had its beginnings in the 1930s, thanks to the vision and passion of one man, maurice Blackmore (1906-1977), an english immigrant whose ideas about health were ahead of their time.
maurice Blackmore’s belief in the health-giving properties of herbs and minerals led him to develop a whole system of healthcare based on naturopathic principles. His views on natural health, preventative medicine, the environment and recycling were nothing short of radical in the 1930s, and his work
opened the doors to new ways of treating illness and maximising health.
maurice Blackmore was also responsible for starting one of Australia’s first health food stores in Brisbane in 1938 and worked with colleagues and friends to establish the first naturopathic colleges and professional associations in the country. His beliefs are still valid today and his teachings are incorporated into the training programs of many natural health practitioners.
Leading the company since 1975, maurice’s son marcus has furthered the vision established by his father. He has overseen the
development of Blackmores and made it a world leader in dietary supplements.
Blackmores’ heritage and values are coupled with a commitment to superior business performance. Our strategic direction is focused on delivering growth and continuous improvement to maintain and enhance Blackmores’ industry leadership position and achieve ongoing success for our company and our shareholders.
DAmOn BrOwn, Fitter, keepS the BLACkmOreS prODUCtiOn LineS rUnning eFFiCientLy.
2 3
Bl
ac
km
or
es
an
nu
al r
ep
or
t 2
01
5
Bl
ac
km
or
es
an
nu
al r
ep
or
t 2
01
5
For
per
sona
l use
onl
y

chairman‘s introduction––––
I was sent this picture of Blackmores’ Quality Sourcing manager overseeing a sustainable harvesting program in Antarctica recently. He’s standing in front of an awe-inspiring ice mass. Icebergs are often used in business metaphors because 90% of an iceberg is beneath the surface.
when i reflect on the year that has been, I see results generated from initiatives that have been seeded over the last five years, not all of them visible, and together supporting a greater structure.
I am enormously proud of the Blackmores team, led by our inspiring CeO Christine Holgate, for having the resilience to persist with the delivery of our business strategy despite the market challenges of recent years; and to have the vision to position our group to realise opportunities in the past year.
Christine and the team have had the support and guidance of my fellow Board members who bring diverse talents and experience from a breadth of industries. I warmly welcome John Armstrong as a non-executive Director. we have already benefited from his knowledge of operating in the Asia region and his considerable financial acumen.
The Blackmores group’s strategic focus on retaining market leadership in Australia, diversifying our revenue streams through the growth of Blackmores in Asia and recognising the role of innovation and research through our continued investment in BioCeuticals and the Blackmores Institute have been the pillars supporting our recent success.
The rapid growth trajectory has not been without its challenges, putting
pressure on our ability to meet the increasing demand for our products. We are committed to maintaining our unrivalled quality standards and this has meant that some of our product lines have not been available in recent months. I’d like to express my sincere thanks to our suppliers for working with us to build our stock volumes whilst never compromising on quality. Our consumers have continued to show their trust in the Blackmores name and we owe it to them to ensure this trust is well-placed.
In the prior two years, our management team has been awarded minimal, if any, incentive payments because our remuneration policy is strongly aligned to shareholder outcomes and our profit growth threshold had not been achieved given numerous market challenges. By contrast this year, it gives me great pleasure to report that maximum incentive payments will be awarded to eligible staff reflecting the strong profit performance of the group.
Our greater team also has benefited from our profit share program whereby 10% of profits are shared amongst staff, which this year was the equivalent of six weeks
additional pay. At Blackmores, we’ve always been pleased to see staff ownership of shares in our company, in fact 10 of our top 30 shareholders are current or past employees. I’m pleased to see them benefit from the company they have helped build.
Like the iceberg, there is the performance you can see: record sales, profit, share price, 170 new products and range extensions, more advertising and promotion and a growing presence in the Asia region. And some of our greatest achievements are not so visible: the tireless pursuit of quality, the countless hours of our team of 900 staff overcoming daily challenges and dedicated to meeting the needs of our retailers and consumers, and committed to upholding our values every single day without compromise. They are there, and they are bigger than you’ll ever see.
The best of health
marcus C. Blackmore AmChairman
mArCUS BLACkmOre Am, ChAirmAn OF the BOArD.
inSet – weS ipSen, QUALity SOUrCing mAnAger, OverSeeS A SUStAinABLe hArveSting prOgrAm in AntArCtiCA.
4 5
Bl
ac
km
or
es
an
nu
al r
ep
or
t 2
01
5
Bl
ac
km
or
es
an
nu
al r
ep
or
t 2
01
5
For
per
sona
l use
onl
y

ceo‘s year in review––––
Dear Shareholder,Having recently celebrated the 30th year of Blackmores as an Australian publicly listed company, I am very proud to share our full year performance with you – a record sales and profit result for the group and the highest ever returns for our shareholders.
group sales of $471.6 million were 36% up on the prior year which delivered a $46.6 million profit, an increase of 83% on the prior year’s profit. the solid financial results enabled us to continue to improve our balance sheet with strong cash flows delivering low debt.
As the leader of this team, I am particularly proud that our growth came from all regions and brands. Twelve months ago we were reporting pleasing momentum, which continued to build as the year progressed. the benefits were further bolstered by operational efficiencies and improvements to the group’s cost base, by leveraging
our increased volumes and optimising our Warriewood Campus facility.
The higher sales were the culmination of a number of programs we had put in place over recent years including reinvigorating our Australian business, establishing an enterprise in China, investing in our quality and research programs and identifying a strong brand proposition that is supported by a higher level of marketing across the group.
Consumers, both in Australia and Asia, have a clear preference for high quality products with proven efficacy. Supported by improved trade relations between Australia and several markets in Asia, demand for Blackmores products grew as our marketing message resonated with customers locally.
Our unprecedented levels of growth (including a 50% sales uplift in the second half) have created supply challenges. Our principal concern has been addressing the needs of our Australian
consumers who have loyally supported the Blackmores brand for so many years. We have increased our supply significantly, whilst remaining focused on maintaining our unrivalled quality and commitment to sustainability.
Our continued focus has been aligned to the four strategic priorities we committed to deliver at the start of the financial year:• Support Blackmores
Australia to build our brand and return the business to profitable growth
• invest in BioCeuticals, Blackmores Asia and Pure Animal Wellbeing to continue to diversify our business and build new sources of growth
• Build our product leadership position through the valued research and knowledge within Blackmores Institute and a program of product range innovation
• Continue to improve operational effectiveness and transform our cost profile
FINANCIAl AND OPERATIONAl HIGHlIGHTS
• GroupSalesof$471.6million, up 36% on the previous year
• Recordnetprofitaftertaxof$46.6million,up83% on the previous year
• 170newproductlaunchesand range extensions
• Seventhconsecutiveyearas Most Trusted Brand* in our category
• Netdebtdecreasedby87%to$7.1million
• Almostdoubledoperatingcashflow
• Netassetspershareincreasedby38%to$5.27
• Earningspershareof270.7cents, up 81.4%
* reader’s Digest most trusted Brand Survey
CHRISTINe HOLgATe, ChieF exeCUtive OFFiCer with inDepenDent DireCtOrS, heLen nASh AnD JOhn ArmStrOng.
6 7
Bl
ac
km
or
es
an
nu
al r
ep
or
t 2
01
5
Bl
ac
km
or
es
an
nu
al r
ep
or
t 2
01
5
For
per
sona
l use
onl
y

SuPPORTING OuR AuSTRAlIAN AND NEW ZEAlAND RETAIl BuSINESSES AND BuIlDING OuR CONSuMER BRANDPleasingly Blackmores Australia grew its profitability by 88%. Sales in Australia were up 43% to $317.4 million. This was achieved with double digit underlying growth across all sales channels including community pharmacy. We worked to deepen our relationships with retailers and to support consumer pull-through with more than 20% increased investment in integrated brand activity. The Australian sales result was further boosted by increased sales to Chinese consumers and entrepreneurs through Australian retailers. The profitability of our Australian business benefited from our ability to leverage the scale of our growing group as a result of the success of our export sales.
The Blackmores Sydney running Festival attracted more than 33,000 participants from over 60 countries and raised nearly $1 million for charities. Blackmores yoga was another successful
participation event and offered free yoga as part of a greater brand experience.
Blackmores’ website was upgraded with a refreshed design and improved functionality to enhance consumer engagement and make it easier to navigate products online. Almost one million consumers are connected to Blackmores through the group’s various social media and online platforms.
Blackmores New Zealand achieved sales growth of 13%, its strongest result since Blackmores has been in the New Zealand market.
INVESTING TO GROW – BlACkMORES ASIA, BIOCEuTICAlS, PuRE ANIMAl WEllBEING
Blackmores AsiaAsia is a key region for Blackmores, providing an important platform to secure profitable growth, an opportunity to better leverage our capital investments, and provide sources of alternative currencies which enable a natural hedge against the cost of raw materials that are sourced from all over the
world. The increased scale, resulting from growth in Asia, has improved the profitability of our Australian business with better protection from fluctuations in the Australian dollar, improved recoveries, and has enabled the creation of more than 100 new roles for employees in Australia.
This success is the result of a long-term strategy that began 35 years ago when Blackmores started exporting to the region. The overall contribution from Asia is significant and growing, despite continued challenges in Thailand.
Asia sales were up 26% for the year to $84.0 million, which is double that of five years ago. earnings before interest and taxes (eBIT) from Asia were up 82% to $8.3 million.
Blackmores malaysia sales were up 10%, and eBIT was up 22% to $3.3 million. Thailand continues to be impacted by a soft market with sales down 7% and eBIT down 27%. However, thailand remains profitable, contributing $6.3 million to group earnings. We have strong local leadership and
an experienced team and are optimistic about our future prospects.
Our smaller markets in the region, korea, Singapore and hong kong, have all delivered pleasing sales results and are growing.
Our headquarters in Asia, based in Singapore, is now fully operational. Having a regional base offers improved proximity to our Asian markets, as well as the resources and infrastructure to operate more effectively.
Singapore is recognised as a research and development hub giving us access to expertise and infrastructure including a strong talent pool of management personnel proficient in numerous languages and with the necessary skills and experience in the region. We have access to various government bodies which is important given the strict regulations we operate within our Asia markets.
Sales to China have multiplied. Supported by the wholly Foreign-Owned enterprise (wFOe) established the prior year. The opening of free trade zones
nAthAn CheOng AnD keith DUnne trAin FOr the Big reD rUn, A SerieS OF Five mArAthOnS thrOUgh the SimpSOn DeSert tO rAiSe FUnDS tO heLp FinD A CUre FOr type 1 DiABeteS.
group revenue for the year of $471.6 million represented growth of 36% on last year’s result.
group net profit after tax (npAt) of $46.6 million for the year represents growth of 83% on last year’s reported profit.
0
11FY
100
200
300
400
500
12 13 14 15 11FY 12 13 14 15
0
10
20
30
40
50
$ m
ILLI
ON
S
$ m
ILLI
ON
S
8 9
Bl
ac
km
or
es
an
nu
al r
ep
or
t 2
01
5
Bl
ac
km
or
es
an
nu
al r
ep
or
t 2
01
5
sales net profit after tax
For
per
sona
l use
onl
y

in 2014 created a substantial opportunity, especially as Blackmores was one of only a few companies in this category to secure a licence to directly trade within the zone.
There are a growing number of Chinese consumers shopping for our products through Australian retailers given the high level of demand for our products in China. Adding in the estimated sales to China through Australian retailers, the value of Asian consumers to group sales is approximately $150 million for the year.
Blackmores has a growing fan base of consumers in China, the most influential of those is Chinese tennis legend Li Na. In April, Li Na was announced as a Blackmores brand ambassador, she will feature in advertising campaigns and will partner with us on health and nutrition initiatives. Li Na has been recognised in Time magazine’s list of the most influential people in the world.
BioCeuticalsBioCeuticals achieved an 18% increase in sales, compared to prior corresponding period, delivering $55 million. When Blackmores acquired this company in 2012, we had expected to reach this target by 2017. This performance validates the strong fit for this company in our group and is the result of a successful pipeline of innovative new products and a talented team.
Three years ago shareholders supported our decision to acquire this business which was fully debt funded. I’m pleased to report that every cent borrowed for this has now been repaid. The BioCeuticals team has not only grown its top line, it has made an impressive contribution to our group earnings and profitability has almost doubled since acquisition.
BioCeuticals has continued to lead with product innovation such as the launch of the first listed vitamin k2 product sold in Australia, UB 500 – the
strongest probiotic on the market, and UltraClean 85 – the most concentrated fish oil and the only one with sustainability certified by the marine Stewardship Council.
BioCeuticals Theracurmin continues to be well received by doctors and other health care professionals and is supported by a growing body of evidence.
The BioCeuticals Research Symposium held in the year attracted more than 350 health care professionals for a three-day conference and masterclass series. It reflected the position of the practitioner-only brand as a thought leader in evidence –based integrative medicine with overwhelmingly positive participant feedback and delivery of a high quality of education.
Blackmores Animal HealthPure Animal Wellbeing (PAW) sales increased by 32% to $5.2 million.
The range is developed by veterinarians with specialised expertise in natural healthcare
and based on the strong research and education focus of the broader Blackmores group. The Animal Health team has developed an education program including a podcast series, which has been instrumental in helping it secure a leadership position in the natural animal health category.
The Animal Health division was honoured to receive two Australian Business Awards in recent weeks including commendation for Product Innovation and as an employer of Choice.
BuIlDING OuR PRODuCT AND RESEARCH lEADERSHIP POSITION
Blackmores InstituteBlackmores Institute held research and education symposia in Australia, New Zealand and malaysia, offering delegates access to thought-leaders in integrative medicine.
The announcement of the maurice Blackmore Chair
pAw veterinAriAn ChArmAine thAm USeS A hAnDS-On ApprOACh when DeveLOping AnimAL heALth prODUCtS.
net debt earnings per share
including this year’s final dividend of 135 cents per share, total ordinary dividends for the year were 203 cents per share (fully franked). This represents a 60% increase over last year’s total ordinary dividends of 127 cents per share.
The group’s net debt level was $7.1 million at 30 June 2015. This is compared to $54.4 million in the prior year. gearing, as measured by net Debt / (net Debt + Shareholders’ equity) was 5.1%, compared to 34.3% last year.
earnings per share increased by 81.5% to 270.7cents.
11FY 12 13 14 15
75
100
125
150
175
200
225
11FY 12 13 14 150
15
30
45
60
75
11FY 12 13 14 15100
150
200
250
300
CeN
TS
$ m
ILLI
ON
S
CeN
TS
dividends10 11
Bl
ac
km
or
es
an
nu
al r
ep
or
t 2
01
5
Bl
ac
km
or
es
an
nu
al r
ep
or
t 2
01
5
For
per
sona
l use
onl
y

1.Jos Delavega, Blackmores gym Supervisor2. Lauren mcConnell, Human Resources Coordinator3. One of Blackmores’ best-selling products, Omega Daily4. evangaline manhuyod, Distribution Operator5. Pito Hatherly, Café Staff; Scott Choi, Junior Legal Counsel; Jackie Smiles, environment & Sustainability manager6. Danielle Steedman, Advisory Naturopath7. Amanda Judge, employee Communications manager8. michael elvidge, national Business manager – pAw9. Agus Susilo, Line Warden10. Pito Hatherly in the Blackmores staff gym11. Ivy Wen, Quality Associate 12. David tuffin, national Field Sales manager13. Helen Nash, Brent Wallace (centre) and John Armstrong, independent Directors14. multi-Action + Omega packaged for korea15. Ailsa Reynolds, Quality Technician16. Paul Brazel, Distribution Operator17. Leah Boonthanom, Corporate Communications executive
12
13
1406 10
11
03
02
01
08
09
07
04
05
16
15 17
12 13
Bl
ac
km
or
es
an
nu
al r
ep
or
t 2
01
5
Bl
ac
km
or
es
an
nu
al r
ep
or
t 2
01
5
For
per
sona
l use
onl
y

of Integrative medicine at the Sydney medical School, University of Sydney honoured the legacy of our founder and reflected the growing interest in complementary medicine and its integration with other treatment modalities.
in an Australian-first, Blackmores collaborated with griffith University to launch an independent accredited short course in evidence-based integrative medicine for pharmacists and other healthcare professionals.
In 2015, Blackmores trained more than 25,000 health care professionals with independently accredited education courses in complementary medicine.
The Blackmores group has more than 25 active clinical trials underway and is strongly committed to leading with reputable research and education.
IMPROVING OuR OPERATIONAl EFFECTIVENESSOur new operating model, with a central function servicing the operational needs of all business divisions, has delivered significant financial and operational benefits to all business units. It has improved our buying power and enables us to secure improved returns from our facility at Warriewood.
Blackmores’ Operations have been adapting to the increased sales rate. We produced a record 35 million units at the Blackmores Campus over the year and shipped them to 25,000 points of distribution. Though the higher volumes have challenged us with some lines out of stock, they have improved recoveries of fixed costs and have continued to benefit our cost of goods, which can been seen in
our strong earnings before interest and tax (eBIT).
The group has considerably improved financial health, which can be seen in the strength of our balance sheet. Net debt is down from $54.4 million to $7.1 million, an 87% improvement. Interest costs are down by $1.3 million, which is 29% lower than prior year. Our interest cover at 21.1 times is up considerably, from 8.2 times in the prior year. We have almost doubled our operating cash flow.
Several years ago, shareholders noted our dependency on the Blackmores Australian business and supported a move to diversify our revenue base. Today, over 40% of our sales are generated from outside our core Australian consumer business. Furthermore, we are proud that this core business has continued to grow and remains the heart of the Blackmores group.
DIVIDENDSThe Board has declared a final dividend of 135 cents per share (fully franked), taking total dividends for the year to 203 cents (up 60% compared to last year). The dividend is payable on 22 September.
The record half year and full year dividends reward shareholders who have supported our strategy and shared our confidence in the future prospects of the Blackmores group.
COMMITMENT TO A RICHlY DIVERSE WORkFORCEBlackmores now employs around 900 people across the group, with more than 400 sales and marketing employees in Asia.
We celebrate and value the importance of diversity
in our workforce. Our commitment to creating a flexible working environment and recruiting on the basis of talent has resulted in a richly diverse workplace with a blend of skills, experience and perspective from individuals, irrespective of culture, gender or age. • more than 80% of
Blackmores staff in the group are female
• more than half of our staff have Asian origins, and more than 25 languages are spoken
• 20% of staff based in Australia are part-time workers, many of whom balance work and family commitments
• One in five of our staff have a healthcare qualification
IN SuMMARYOf our numerous achievements this year, the one that has been the most valued is the 92% vote of commitment to the organisation noted in our staff climate survey. it reflects our passionate, driven and engaged team, who have worked tirelessly throughout this year. I thank them for their energy and professionalism as they lived our values.
This has been a year of big milestones for our company. Not least of those were the 30th year anniversary of Blackmores’ public listing on the ASx and the 70th birthday of marcus Blackmore. marcus continues to be an inspirational business leader, a passionate advocate for our industry and a generous benefactor of many social causes. He is led by his values, commitment to learning and his sense of purpose, and it is with that spirit the Blackmores team will approach the coming year.
OuTlOOkWe are pleased with our full year performance, the strong financial results and the momentum in the organisation. However, we are mindful of the challenges including the need to satisfy our consumers as we manage supply to meet the growing demand for our products, and experience shortages in raw materials that meet our high quality standards.
We remain focused on the delivery of our strategic priorities for the coming year:• Deepening our relationship
with consumers, improving our connectivity to customers and expanding our digital presence
• investing in growth in Asia and continuing to tailor our products and services to meet the demands of our Asian consumers
• Leveraging the knowledge within the Blackmores Institute and BioCeuticals to drive product leadership and innovation and be the authoritative voice of natural health
• Striving to continuously improve our operational effectiveness
The Board has continued confidence in our strategy, in the capability of our team and in the strength of the brands within the group, and we are committed to growing this business and delivering improved shareholder returns in the coming year.
Thank you for your support of Blackmores.
Christine HolgateChief executive Officer
neAL merCADO, DireCtOr OF reSeArCh & DeveLOpment FOr BiOCeUtiCALS, AnD hiS teAm DeveLOpeD Over 50 new prODUCtS FOr BiOCeUtiCALS AnD iSOwhey.
14 15
Bl
ac
km
or
es
an
nu
al r
ep
or
t 2
01
5
Bl
ac
km
or
es
an
nu
al r
ep
or
t 2
01
5
For
per
sona
l use
onl
y

2014-15 has been a year of strong sales and success from all regions and brands. –––––––
we’vegrown… 36%
increase in group sales for the year
$471.6m$150m
sales contribution
of asian consumers
to the group
EST.
38%increase in net tangible assets
per share to $5.27
100new roles in
the blackmores group81%
increase in earnings per share
170new products
and range extensions launched
achieved $1.5 billion
market value
$46.6m net profit after tax
83%
16 17
Bl
ac
km
or
es
an
nu
al r
ep
or
t 2
01
5
Bl
ac
km
or
es
an
nu
al r
ep
or
t 2
01
5
For
per
sona
l use
onl
y

170 new products and range extensions across the group––––
18 19
Bl
ac
km
or
es
an
nu
al r
ep
or
t 2
01
5
Bl
ac
km
or
es
an
nu
al r
ep
or
t 2
01
5
For
per
sona
l use
onl
y

The Blackmores Sydney running Festival 2014 attracted more than 33,000 participants from over 60 countries and raised almost $1 million for charity. Blackmores also held over 26 free yoga classes across Australia with more than 1,000 registrations.
Staff rolled up their sleeves to help renovate the Quest for Life retreat at Bundanoon in NSW, as well as coordinating numerous fundraising initiatives such as BBQ breakfasts and cupcake days to benefit local organisations and colleagues in need.
MATCHED DONATIONSemployees are encouraged to participate in a charitable scheme whereby a percentage of their taxable pay is deducted each payday and placed in an interest-bearing trust account. The Company matches this and twice yearly each participating employee nominates a registered charity to receive the donation.
HEAlTH• Arthritis new Zealand• Australian himalayan
Foundation• Big red run• Cancer Council• Childline thailand• Chris O’Brien Lifehouse• Cure Brain Cancer
Foundation• Diabetes malaysia• heart research institute• macular Disease
Foundation Australia• macular Degeneration
New Zealand• mindd Foundation• national Cancer Society
malaysia• Quest for Life Foundation
COMMuNITY• mC38 Sailing regatta• yachting Australia• Bilgola Big Swim• Bilgola Surf Life Saving Club• Business Chicks• Collingwood Football Club • FoodBank• holly wawn, surfer
• mat Belcher & will ryan, Olympians
• Oxfam• people’s Association
and Project We Care management Committee, Singapore
• rSpCA• Sam Bloom,
Para Canoe Sprinter• programs for
underprivileged children supported by Blackmores malaysia and Blackmores Sungapore
ENVIRONMENT• Clean Up Day• ghostnets Australia• national University
of Singapore (tree planting project)
• world wildlife Fund
community
SArAh tAit AnD ChAnteLLe knApmAn PARTICIPATe IN CLeAN
Up DAy At mOnA vALe BeACH AS PART
OF BLACkmOreS’ eNvIRONmeNTAL
COmmITmeNT TO THe LOCAL COmmUnity.
BLACkmOreS prOUDLy SpOnSOrS AUStrALiAn pArA CAnOe Sprinter SAm BLOOm (FOregrOUnD)
AnD Other inSpirAtiOnAL AthLeteS.
the Blackmores group proudly supported the following organisations, individuals and wellbeing initiatives in the 2014/15 year:
20 21
Bl
ac
km
or
es
an
nu
al r
ep
or
t 2
01
5
Bl
ac
km
or
es
an
nu
al r
ep
or
t 2
01
5
For
per
sona
l use
onl
y

healthy people, healthy planet––––Blackmores has a strong commitment to environmental sustainability stemming from the vision of founder, maurice Blackmore, who had views on recycling that were ahead of his time. maurice Blackmore understood the link between healthy people and a healthy planet, which is still core to who we are today.
Once again, Blackmores received the ‘High Achiever’ accolade by the Australian Packaging Covenant (APC) for reducing the environmental impact of packaging. As a founding signatory to the APC, Blackmores actively explores ways to reduce the environmental impact of product packaging, increase recycling rates and develop innovative sustainable packaging solutions.
The Australian Packaging Covenant is a sustainable packaging initiative that aims to change the culture of business. It is an agreement between government, industry and community groups to find and fund solutions to address packaging sustainability issues.
A significant achievement for Blackmores in 2014 was the introduction of the ‘closed loop’ process for bulk deliveries into the packaging facility at Warriewood. This process removed inbound cardboard and plastic waste, reduced handling time and waste removal costs, and increased operational efficiencies. Twelve months on we are pleased to report that this process has resulted in the removal of nearly four times what we set out to achieve.
INNOVATIVE NEW PACkAGINGThe introduction of recyclable amber polypropylene packs
for larger bottles of capsules and tablets is a great example of how Blackmores strives to extend innovation beyond product formulation. This year we proudly received three Australian Design Awards and a prestigious WorldStar Award for packaging excellence.
Our Quality team has full visibility over the composition of materials to ensure the packs are free of toxic chemicals (e.g. plasticisers, mercury and BPA) that can leach out of other packaging materials. The anti-tamper closure ring on the lid was designed to prevent it from separating from the bottle, which is a common threat to wildlife.
SuSTAINABlE SuPPlY CHAINS Blackmores has partnerships with several stewards in sustainability including the world wildlife Fund (wwF), marine Stewardship Council (mSC) and Antarctic Wildlife research Fund (Awr). Our krill oil products are certified as sustainable and we are progressing toward achieving a certification for our fish oil products. These huge projects involve ongoing dialogue, engagement and change management with suppliers all over the world.
the wwF considers mSC to be the most credible certification recognising sustainable fisheries management. Blackmores sources only mSC certified krill and our entire krill supply chain, over which we have full transparency from catch to capsule, has been audited and certified by mSC to ensure complete traceability and integrity. We have also sent our own sourcing manager to observe the catch firsthand and ensure we are comfortable that it is fished
within the Commission for the Conservation of Antarctic marine Living Resources framework.
Through our AWR partnership, Blackmores supports research on the Antarctic ecosystem to help improve the management of the Antarctic krill fishery. Consumers can be assured of our product quality and commitment to environmental sustainability.
GHOST NETSBlackmores continued its partnership with wwF to support a conservation project called ghost Nets. marine debris enters the northern coastal regions of Australia from South east Asia during the monsoonal seasons. Spanning three to six kilometres in length, these ‘ghost Nets’, or discarded fishing nets, threaten coastal and marine ecosystems that are integral to the indigenous communities who depend upon them. Blackmores’ support is focused on initiatives to prevent this issue and further raise awareness through a travelling art exhibition featuring pieces made from recycled waste. We are proud to support a local project that helps ensure our unique environment can be shared by future generations.
SuSTAINABIlITY IN THE COMMuNITYBlackmores recognises that sustainability starts at home with the local community. Staff volunteers once again participated in the APC ‘Business Clean Up Day’, picking up rubbish ranging from discarded flippers to old chip packets at mona vale Beach and surrounding parklands.
Our ‘Buy, Swap, Sell Day’ gave staff the opportunity to
turn one person’s junk into another person’s treasure. On Campus we host permanent onsite collection points where staff can deposit their end-of-life batteries, mobile phones and accessories for recycling. Laptops are donated to selected charities throughout the year.
Our Sustainable Seafood Day, held to coincide with Clean Oceans Day, showcased sustainable seafood dishes at our staff café and provided education on making sustainable seafood choices at the supermarket. Blackmores also participated in the worldwide earth hour – excitingly managing to turn off the lights on a krill harvesting vessel in the Southern Oceans of Antarctica!
BlACkMORES CAMPuSThe Blackmores Campus at Warriewood on Sydney’s Northern Beaches is designed to reflect the Company values and embodies our commitment to environmental sustainability.
The installation of one of Australia’s first gas-fired tri-generation plants provides most of the building’s energy needs, including electrical, heating and cooling. Water from the pond located at the main entrance assists in the building cooling system. Solar chimneys facilitate ventilation and create a natural working environment.
A syphonic rainwater collection provides self-sufficiency for our landscaped gardens. Stormwater is controlled by urban design practices on site before reaching local creeks and water bodies.
Additionally, the Campus utilises environmentally-friendly, low-volatile and low-emission furnishings including carpets, paints and furniture.
awards––––
Best in Class• Australian Business Awards
– employer of Choice (Blackmores Animal Health)
• Canstar Blue for most Satisfied Customers, multivitamins in Australia
• Brand Laureate for Nutraceutical man of the year – marcus Blackmore, in malaysia
• Brand Laureate for Best Brand in wellness – natural Health Solutions, in malaysia
• influential Brands Award for Top Brand, Health Supplement in Singapore
• readers Digest most trusted Brand for vitamins/health Supplements in Australia, malaysia, Singapore and New Zealand (Highly Commended)
• Superbrand of the year in Thailand and malaysia
Business, export, Product• Arthritis new Zealand
Business Development Award
• Australian Business Awards – winner for product excellence (Blackmores Animal Health)
• hong kong Australia Business Association Business excellence Award
• nSw export Award – health & Pharmaceutical Science (Finalist)
• nSw export Award – highly recommended Certificate
• nutraingredients Finished product of the year – immune (Finalist) for Blackmores kids vitamin C + zinc gummies
environmental/packaging• AusCham westpac
Australia China Business Award for Sustainability and Social Impact
• Australian packaging Design Awards
o gold for health and beautyo Silver for accessibilityo Bronze for innovation and
emerging technologies• Australian packaging
Covenant award for Sustainability in medium Pharmacy & Personal Care
• nSw Business Chamber – north eastern Sydney Business Award for excellence in Sustainability
• worldStar Award for Packaging excellence
Pharmacy & Beauty• Api pharmacist Advice
Store Support Award• Complementary medicines
Australia award for most Outstanding Contribution to the Industry
• Cosmo kiss Beauty Award in Thailand
• instyle Best Beauty Buys Award in Thailand
• national pharmacies Supplier Award for Best Retail Supplier (>$1m in purchases)
• priceline pinky Award for most Trusted general Wellbeing Brand
• watsons’ health, Wellness, Beauty Award for Bestselling vitamin C Product (Blackmores Bio C) in Thailand
22 23
Bl
ac
km
or
es
an
nu
al r
ep
or
t 2
01
5
Bl
ac
km
or
es
an
nu
al r
ep
or
t 2
01
5
For
per
sona
l use
onl
y

01 02
05
07
06
08
03 04
01CHRISTINE HOlGATEChief executive Officer & managing DirectorChristine has 30 years of international sales and marketing experience in highly regulated industries, including telecommunications, finance, media and healthcare. Christine was appointed to her current role as Chief executive Officer by the Board in November 2008. She has held numerous board and senior management positions, working in europe, Asia, the Americas and Australia. Christine’s prime responsibilities have been leading teams through significant change, growth and start-up. Christine has three postgraduate diplomas in management, marketing, and Purchasing and Supply; and a master’s Degree in Business Administration (mBA). Christine is also a Non-executive Director for ten network holdings Limited. Christine was awarded the 2011 (inaugural) International executive Study Scholarship by Chief executive Women and the Women’s Leadership Institute Australia, and was honoured with the Rotary Paul Harris Award in 2013.
02RICHARD HENFREYChief Operating OfficerRichard Henfrey has over 25 years of experience in strategic and business development roles in a wide range of blue chip, start up and strategy consulting businesses in europe, North America and Australia, including key leadership positions with Telstra. much of his career has focused on developing and implementing new businesses or change initiatives that create significant new value. richard joined Blackmores as Director of People and Strategy in 2009 and since 2011 he has been leading Blackmores’ Strategic Sourcing division. He was appointed Chief Operating Officer in 2014. richard is also the Board President of the industry association, Complementary medicines Australia. He leads a positive approach to engagement with regulators and governments for greater recognition of complementary medicines in the development of health policy and regulatory regime.
03DAVID FENlONmanaging Director, Australia & nZDavid brings over 20 years of retail experience and a deep understanding of both grocery and smaller retail customers to Blackmores. With an emphasis on business transformation and leadership, David combines his commercial acumen to set strong strategic foundations with his ability to attract, motivate and lead teams, to achieve exceptional operational results. David has held key leadership positions in Tesco in europe and Safeway in the Uk. here in Australia he led Red group, a chain of book and stationery stores. more recently David has worked with leadership teams from a diverse range of brands including Jenny Craig, ecco Shoes, metallicus and Review.
04NATHAN CHEONGmanaging Director, BioCeuticalsWith over 14 years’ experience in the complementary medicine industry, nathan first joined BioCeuticals in September 2012 as Director of Sales & marketing, moving into the managing Director role earlier this year. Prior to this, Nathan was general manager of Herbs of gold, a subsidiary of vita Life Science. nathan is a qualified naturopath and Herbalist, holding degrees in Health Science, Science and Social Work, and graduating with majors in Biochemistry and Psychology. He currently sits on Complementary medicines Australia’s Complaints Resolution Panel and Practitioner medicine Technical Committee. Nathan is a member of the Australian institute of Company Directors and Australian Institute of management.
05PETER OSBORNEmanaging Director, AsiaPeter is responsible for Blackmores’ Asia business including nine Asian subsidiary companies in taiwan, hong kong, Singapore, malaysia, Thailand, korea, and China; distribution partnerships in macau, Cambodia and vietnam; and overall strategy for Blackmores’ growth objectives in Asia. Prior to joining Blackmores, Peter was one of Australia’s most senior trade diplomats working with the Australian Trade Commission in China, taiwan, and hong kong. Peter also spent several years in Fiji as the trade & investment Director of the South pacific Forum Secretariat and served as the South pacific expert Adviser on trade development to the Un Conference on trade and Development and the Un Commission for Sustainable Development. peter has lived and worked in Asia for over 25 years and speaks mandarin-Chinese.
06CECIlE COOPERCompany Secretary & Director of Corporate AffairsCecile is an accountant and company secretary with over 30 years of commercial experience. She is responsible for Blackmores’ board administration, secretariat, governance, risk management, compliance and corporate communications initiatives. She has held a variety of senior positions at Blackmores including business manager for development, marketing and sales. her financial roles at Blackmores have included statutory and management accounting and taxation compliance in the Australian and overseas operations. She is a Chartered Secretary and a Certified practicing Accountant and holds a Bachelor of Business (Accounting) and a graduate Diploma of Applied Corporate governance with the governance Institute of Australia. She is a graduate of the Australian institute of Company Directors. In addition, Cecile is the Chair of Community Care (Northern Beaches) Limited and serves on the governance Institute of Australia’s Legislation Review Committee.
07AARON CANNINGChief Financial OfficerAaron joined Blackmores in December 2014 and brings with him a wealth of general management and financial leadership experience. He has worked in Asia, Australia, New Zealand, Uk and USA for a variety of ASx-listed and multinational organisations including goodman Fielder, westfield and Diageo plc. His most recent experience was with goodman Fielder as the managing Director of grocery Category; prior to this he was the managing Director Asia pacific and Finance Director Asia pacific.Aaron has a Bachelor of Commerce degree in marketing and management and a Postgraduate Honours degree in management (First Class) from Otago University in new Zealand. he is a qualified Accountant, Fellow of the Association of Chartered Certified Accountants, and a member of Australian institute of Company Directors.
08DR lESlEY BRAuNDirector, Blackmores instituteLesley is an Adjunct Associate Professor of Integrative medicine at the National Institute of Complementary medicine and an Adjunct Senior Research Fellow at the monash/Alfred Psychiatric Research Centre. She has also held positions at The Alfred Hospital as a Research Pharmacist and is a member of key industry groups including the Australian Therapeutic goods Advisory Council, the informal working party for complementary medicine regulation reform (TgA), the Advisory Committee for the Australasian Integrative medicine Association and on the executive for the complementary and integrative therapies group within COSA. Lesley co-authored the best-selling textbook ‘Herbs and natural Supplements – an evidence based guide’, is founding editor-in-chief of the journal ‘Advances in Integrative medicine’, and is a regular columnist for the Australian Journal of pharmacy. She regularly presents at national and international conferences about integrative medicine in addition to undertaking her own complementary medicine research projects.
executiveteam––––
24 25
Bl
ac
km
or
es
an
nu
al r
ep
or
t 2
01
5
Bl
ac
km
or
es
an
nu
al r
ep
or
t 2
01
5
For
per
sona
l use
onl
y

financialreport––––
5 year history
––––
27 Five Year History 28 Directors’Profiles31 Directors’ Report 35 Remuneration Report 46 Auditor’sIndependenceDeclaration47 Independent Auditor’s Report 49 Directors’Declaration50 ConsolidatedStatementofProfitorLossandOtherComprehensiveIncome51 ConsolidatedStatementofFinancialPosition52 ConsolidatedStatementofCashFlows53 ConsolidatedStatementofChangesinEquity54 NotestotheFinancialStatements89 AdditionalInformation90 CompanyInformation
27B
la
ck
mo
re
s a
nn
ua
l re
po
rt
20
15
26
Bl
ac
km
or
es
an
nu
al r
ep
or
t 2
01
5
$’000 2015 2014 2013 2012 2011
Sales1 471,615 346,760 326,603 260,832 234,423 earnings before interest, tax, depreciation and amortisation (eBitDA) 78,655 46,055 44,692 46,879 46,587 Depreciation and amortisation 6,391 6,266 5,989 4,922 4,529 earnings before interest and tax (eBIT) 72,264 39,789 38,703 41,957 42,058 Net interest expense 3,432 4,826 4,752 2,761 2,736 profit before tax 68,832 34,963 33,951 39,196 39,322 Income tax expense 22,276 9,534 8,975 11,390 12,017 profit for the year 46,556 25,429 24,976 27,806 27,305
Net debt 7,069 54,401 69,043 33,040 29,832 Shareholders’ equity 132,915 104,226 98,051 86,166 79,112 Total assets 293,407 236,594 231,477 174,771 153,130 Current assets 187,844 131,376 124,030 99,993 78,521 Current liabilities 114,998 58,040 45,035 42,024 33,207 Net tangible assets 90,809 65,185 58,860 79,629 74,108
net operating cash flows 71,127 37,491 22,014 20,846 21,635 Number of shares on issue (’000s) 17,224 17,113 16,972 16,780 16,744 earnings per share (epS) – basic (cents) 270.7 149.2 147.9 165.8 163.2 Ordinary dividends per share (cents) 203.0 127.0 127.0 127.0 124.0 Share price at 30 June $75.27 $27.20 $26.94 $26.25 $26.70 Net tangible assets per share $5.27 $3.81 $3.47 $4.75 $4.43 Return on shareholders’ equity2 35.0% 24.4% 25.5% 32.3% 34.5%Return on assets3 27.3% 17.0% 19.1% 25.6% 27.4%Dividend payout ratio 75.0% 85.1% 85.9% 76.6% 76.0%gearing ratio4 5.1% 34.3% 41.3% 27.7% 27.4%eBIT to sales 15.3% 11.5% 11.9% 16.1% 17.9%effective tax rate 32.4% 27.3% 26.4% 29.1% 30.6% Current assets to current liabilities (times) 1.63 2.25 2.75 2.38 2.36 Net interest cover (times) 21.1 8.2 8.1 15.2 15.4 gross interest cover (times) 18.8 7.7 7.9 14.3 14.5
%changeonprioryear Sales 36.0% 6.2% 25.2% 11.3% 9.1%eBitDA 70.8% 3.1% (4.7%) 0.6% 13.1%eBIT 81.6% 2.8% (7.8%) (0.2%) 13.5%profit for the year 83.1% 1.8% (10.2%) 1.8% 12.4%ePS 81.4% 0.9% (10.8%) 1.6% 11.2%Ordinary dividends per share 60.0% 0.0% 0.0% 2.4% 10.7%1. Represents revenue from the sale of goods and excludes other revenue items. 2. Calculated as net profit after tax divided by closing shareholders’ equity. 3. Calculated as eBIT divided by average total assets. 4. gearing ratio is calculated as net debt divided by the sum of net debt and shareholders’ equity.
For
per
sona
l use
onl
y

02 03
06 07
04 05
0101MARCuS C BlACkMORE AMnD, mAiCD, D UnivChairman of the Boardexecutive Directormr Blackmore has served on the Board since October 1973 and is the Chairman of the Company. he is also an honorary Doctor of Southern Cross University, a Director of the young endeavour youth Scheme, national Chair of the Defence reserves Support Council, an honorary trustee of the Committee for the economic Development of Australia (CeDA), an Alumnus of Harvard Business School, and an honorary Fellow of the Heart Research Institute.
02CHRISTINE HOlGATEChief executive Officer and managing Directorms Holgate was appointed to her current role by the Board in November 2008 and has over 30 years of international sales and marketing experience in highly regulated industries, including telecommunications, finance, media and healthcare. She has held numerous board and senior management positions, working in europe, Asia, the Americas and Australia. ms Holgate’s prime responsibilities have been leading teams through significant change, growth and start-up. ms Holgate has three post graduate diplomas in management, marketing, and Purchasing and Supply and a masters Degree in Business Administration (mBA). ms Holgate is a non-executive Director of ten Network Holdings Limited (since 2010). She was previously a Director of keyCorp Limited.
03STEPHEN CHAPMANBCOmm, mBA, CA, FAiCDDeputy Chairman, Chair of the Nominations Committee and Lead independent Directormr Chapman is an investment banker and joined the Board in September 1993. He is a founder and the executive Chairman of Baron Partners Limited, an Australian investment bank. He is an independent Chairman of e Trade Australia Limited and is an independent Director of AnZ Wealth group.
04BRENT W WAllACEBCOmm (mArketing), FAiCDChair of the Audit and Risk Committeeindependent Director mr Wallace joined the Board in October 2005. He is a co-founder and CeO of galileo kaleidoscope, a company known for its strategic marketing, brand and consumer research solutions. mr Wallace has over 30 years’ experience in marketing, advertising and brand development across a wide variety of consumer categories. He has held senior positions in London and Sydney advertising agencies and until 1996 was managing Director of Ogilvy & mather in Australia. mr Wallace is also a Board Director and governor of world wildlife Fund, the global environmental group.
05HElEN NASHBA (hOnS), gAiCDChair of the People and Remuneration Committeeindependent Director ms Nash joined the Board in October 2013. ms Nash has more than 17 years’ experience in brands and marketing, including seven years in fast moving consumer goods at Procter & gamble, followed by three years in publishing at IPC media. She has held a variety of roles at mcDonald’s Australia over a period of nine years and most recently held the position of Chief Operating Officer, overseeing restaurant operations, marketing, menu, insights and research and information technology. ms Nash is currently a Non-executive Director and the Chair of the Remuneration Committee of pacific Brands Limited and a non-executive Director of Southern Cross media group Limited.
06DAVID ANSEllBA (COmmUniCAtiOn), gAiCDindependent Directormr Ansell joined the Board in October 2013, following a highly successful career in consumer facing organisations in Australia, Singapore and the United States. He played a pivotal role in the start-up years of Foxtel and was CeO of advertising agency, Saatchi & Saatchi. He has led business units of mars Incorporated in Australia and the United States. mr Ansell has a strong Operating and Supply Chain skill set and a deep understanding of Consumer and Customer Strategy. mr Ansell is the Chairman and managing Director of JDe AU pty Ltd and a Director of Cycling Australia.
07JOHN ARMSTRONGB BUS, mBA, CpA, mAiCD independent Directormr Armstrong joined the Board in may 2015. He is currently the Chief Financial Officer of Seek Limited, an ASx 100 listed leading recruitment and education provider. He has over 20 years’ experience in various financial and commercial management roles and has significant oversight and involvement in Seek’s Asian operations and investments, including Directorships of Seek’s business in China, Zhaopin, and Seek Asia, which operates across South east Asia. mr Armstrong is a non-executive Director of ASx listed iProperty group Ltd.
directors’ profiles––––
28 29
Bl
ac
km
or
es
an
nu
al r
ep
or
t 2
01
5
Bl
ac
km
or
es
an
nu
al r
ep
or
t 2
01
5
For
per
sona
l use
onl
y

directors’report––––
31B
la
ck
mo
re
s a
nn
ua
l re
po
rt
20
15
30
Bl
AC
kM
OR
ES
AN
Nu
Al R
EP
OR
T 2
01
5
DIRECTORS’SHAREHOLDINGSthe following table sets out each Director’s relevant interest in all financial instruments issued by Blackmores as at the date of this report:
DIRECTORS FULLY PAID ORDINARY SHARES SHARE RIGHTS
David Ansell 1,000 -John Armstrong - -marcus Blackmore 4,268,815 -Stephen Chapman 27,528 -Christine Holgate 68,102 34,436Helen Nash 1,000 -Brent Wallace 13,701 -Total 4,380,146 34,436
SHARERIGHTSGRANTEDTODIRECTORSANDSENIOREXECUTIVES Selected Senior executives are invited annually by the Board to participate in the executive performance Share plan (epSp). Under this plan, eligible Senior executives are granted rights to acquire shares in Blackmores. Refer to the Remuneration Report on pages 35 to 45 for more details. During the year, the following rights to shares were granted:
2015 NUMBER1, 2
Executive Director Christine Holgate 34,436Senior Executives Lesley Braun 6,120Aaron Canning3 5,143Nathan Cheong 5,773Cecile Cooper 4,724David Fenlon 8,568Richard Henfrey 8,012Peter Osborne 6,528Total 79,304 1. nil shares vested in the 2015 Financial year.2. rights granted during the 2015 Financial year vest provided specific performance objectives and
hurdles are met over the three year period commencing 1 Jul 2014 to the year ending 30 Jun 2017.3. rights granted during the 2015 Financial year for Aaron Canning are for the period as a Senior
executive (4 Dec 2014 to 30 Jun 2015).
SHAREOPTIONSDuring and since the end of the financial year, no share options were in existence and no new share options were granted to Directors or Senior executives of Blackmores. REMUNERATIONOFDIRECTORSANDKEYMANAGEMENTPERSONNEL
information about remuneration of Directors and key management personnel is set out in the remuneration report of this Directors’ Report, on pages 35 to 45.
COMMITTEEMEMBERSHIPSAs at the date of this Report, the Company had an Audit and Risk Committee, a Nominations Committee and a People and Remuneration Committee. members of the Board acting on the Committees during the year were:
Audit and Risk: Brent Wallace, Chair1
David Ansell John Armstrong2
Stephen Chapman3
verilyn Fitzgerald4
Nominations: Stephen Chapman3 , Chair David Ansell John Armstrong2
marcus Blackmore verilyn Fitzgerald4
Christine Holgate Helen Nash Brent WallacePeople and Remuneration: Helen Nash, Chair5
marcus Blackmore Stephen Chapman3
verilyn Fitzgerald4
Brent Wallace1. Brent Wallace was appointed the Chair of the Committee on 28 Apr 2015.2. John Armstrong joined as a Director 5 may 2015.3. Stephen Chapman was on an unpaid leave of absence from 14 Apr 2015.4. verilyn Fitzgerald retired as a Director and the Chair of the Committee on 23 Oct 2014.5. Helen Nash was appointed the Chair of the Committee on 23 Oct 2014.
COMPANYSECRETARIESCecileCooper, BBus, Dip inv rel (AirA), gAiCD. ms Cooper joined Blackmores in 1991 as Finance manager. She has held a variety of positions and her experience includes enterprise resource planning system implementations, design of business reporting solutions and business management. ms Cooper is a Certified practising Accountant and Chartered Secretary.
AaronCanning, BCom(hons), FCCA, mAiCD. mr Canning joined Blackmores in 2014 as Chief Financial Officer. he has extensive management experience in Asia, new Zealand, Uk, USA and Australia from ASx listed and multinational organisations including goodman Fielder, westfield and Diageo plc. his most recent experience was with goodman Fielder as the managing Director – grocery Category. prior to this he was the managing Director – Asia pacific and Finance Director – Asia pacific. mr Canning is a Fellow of the Association of Chartered Certified Accountants and a member of the Australian institute of Company Directors.
PRINCIPALACTIVITIESThe principal activity of the Blackmores group in the course of the financial year was the development, sales and marketing of natural health products for humans and animals including vitamins, herbal and mineral nutritional supplements. The Blackmores group has operations in Australia, New Zealand and Asia.
RESULTSthe Financial report for the years ended 30 June 2015 and 30 June 2014 and the results herein have been prepared in accordance with Australian Accounting Standards.
the net profit after tax (npAt) attributable to the shareholders of the Blackmores group for the financial year was $46.6 million (2014: $25.4 million).
DIVIDENDS The amounts paid or declared by way of dividend since the start of the financial year were:
• a final dividend of 83 cents per share fully franked in respect of the year ended 30 June 2014, as detailed in the Directors’ report for that financial year, was paid on 3 October 2014;
directors’ reportFOr the FinAnCiAL yeAr enDeD 30 JUne 2015
For
per
sona
l use
onl
y

32 33
Bl
ac
km
or
es
an
nu
al r
ep
or
t 2
01
5
Bl
ac
km
or
es
an
nu
al r
ep
or
t 2
01
5
• an interim dividend of 68 cents per share fully franked in respect of the year ended 30 June 2015 was paid on 13 April 2015; and
• on 25 August 2015, Directors declared a final dividend for the year ended 30 June 2015 of 135 cents per share fully franked, payable on 22 September 2015 to shareholders registered on 8 September 2015.
This will bring total ordinary dividends to 203 cents per share fully franked (2014: 127 cents per share fully franked) for the full year.
CHANGESINSTATEOFAFFAIRSDuring the financial year there was no significant change in the state of affairs of the Blackmores group other than that referred to in the Consolidated Financial Statements or notes thereto and elsewhere in the Annual report of Blackmores for the year ended 30 June 2015.
REVIEWOFOPERATIONSANDFINANCIALRESULTSBlackmores has operations in Australia, New Zealand and Asia. Blackmores operations include product innovation and formulation, sourcing of the highest quality ingredients, quality programs to ensure compliance with standards of good manufacturing practice and the marketing, sales and distribution of products to customers and consumers.
Our operations are structured to service and deliver to multiple channels including pharmacy, mass merchandisers, grocery, health food stores, practitioners and online. Our Animal Health range is also sold to vets and wholesalers.
Activities across the group for the 2015 financial year were aligned to four key strategic priorities with some key highlights:
• Consumer Centricity – Significant increases in brand investment and in understanding the consumer in our core Australian market supported by improvements in e-commerce and digital platforms.
• AsiaGrowth – Support continued growth of the Blackmores Asia business with the establishment of an Asian based regional management and operating structure to enable more efficient decision making and improved operational efficiencies.
• ProductLeadership – A focus on continuing to cement Blackmores’ position as a clear leader in the area of research and development with increased investment in the Blackmores Institute, a program of product range innovations and the establishment of the maurice Blackmore Chair of Integrative medicine at Sydney University.
• OperationalEffectiveness– improved operational efficiencies were derived from investment in and with our supply chain partners, leveraging our Central Services business model and optimising our increased size into scale benefits.
the Blackmores group npAt for the financial year was $46.6 million (2014: $25.4 million) which represents an 83% increase compared to the prior year. Sales for the year were $471.6 million (2014: $346.8 million), an increase of 36% compared to the prior year.
Operating cash flow improved by 90% on the prior year as a result of a strong trading performance, continued focus on working capital improvements and an improved treasury capability. Basic earnings per share (ePS) increased from 149.2 cents per share to 270.7 cents per share, an increase of 81%.
Strong sales resulting in our 13th consecutive year of sales growth were attributable to double digit sales growth across all segments. This was led by the Australian business, new product launches and the continued growth of Blackmores in international markets. This growth was complemented by record sales performances across Asia, BioCeuticals, Blackmores New Zealand and Pure Animal Wellbeing. Sales in Asia are almost 18% of group sales and BioCeuticals represents 12% of group sales.
Australian invoiced sales were up 43% compared to the prior year. The business continued to build momentum throughout the year with encouraging performances across existing products and
strong take up of new products. The Australian business continued to benefit from increases in Chinese tourists and entrepreneurs shopping in Australia and Chinese Australian consumers purchasing for relatives and friends and shipping to China.
By combining the contribution from these consumers with our Asia-based revenues, the value of the region to our group sales is approximately $150 million for the year. This demonstrates the growing demand for our brand outside Australia and highlights the importance of our Asia growth strategy.
Increased sales to China have been supported by the Wholly Foreign-Owned enterprise (wFOe) established the prior year. The opening of free trade zones in 2014 created a substantial opportunity, especially as Blackmores was one of only a few companies in this category to secure a licence to directly trade within the zones.
We are encouraged by the Australian government’s commitment to improved trade relations within the Asian region which we believe will continue to support further growth.
Asia is a key region for Blackmores, providing an important platform to secure long-term profitable growth. this growth enables the group to better leverage capital investments and provides sources of alternative currency that are intended to provide a natural hedge against the cost of raw materials that are sourced from all over the world.
Blackmores Asia achieved record sales, with full year sales up 26% in Australian dollars and eBIT up 82% to $8.3 million, a strong result in the context of ongoing economic challenges in Thailand. excluding Thailand, total Asia sales were up 55%. Blackmores malaysia delivered 14% growth as the leading vitamin and supplements brand in that market with strong sales of new products and continued growth across existing channels.
The signing of an endorsement deal with Chinese tennis player Li Na in April as Blackmores’ ambassador was a key achievement in the year. time magazine listed Li na as one of the 100 most influential people in the world.
Other Asian markets, in particular korea, performed strongly, predominately in the Tv shopping channel, with new products developed specifically for this market in the weight management and joint care categories delivering in excess of 300% increase in sales performance.
BioCeuticals sales grew 18%, with strong growth in the practitioner-only range. This performance, combined with successful new product launches, positive sales mix performances and a close management of the cost base, delivered eBIT growth of 27% on the prior year.
Blackmores New Zealand and PAW reported as part of the ‘Other‘ segment had strong performances with sales growth of 13% and 32% respectively.
As a result of the increased demand across the group, maintaining stock on shelves to satisfy our consumers has been a challenge as have shortages in raw materials that meet our high quality standards
A number of initiatives, from investing in the company’s capacity programs through to putting in additional partnership arrangements with suppliers and customers, have been executed in the year.
Total expenses for the year were $400.3 million representing a 30% increase over the prior year. Total sales growth of 36% was the primary contributor with sales-related expenses of raw materials, rebates and freight up 34% to $237.7 million. The remaining expenses of $162.6 million included employee performance related incentives which were $10 million greater than the prior year. excluding the impact of incentives underlying expenses increased 18%, half the rate of sales growth. The group remained focused on controlling business expenses in the year whilst also taking the opportunity to invest in strategic and operational initiatives including the Warriewood facility supply chain expansion and the establishment of the Blackmores Institute in Asia.
directors’ reportFOr the FinAnCiAL yeAr enDeD 30 JUne 2015
Total income tax expense increased by 134% to $22.3 million reflecting the record profit performance at an effective tax rate of 32.4% (2014: 27.3%). The key drivers of the increased effective tax rate related to higher dividends from Thailand as we repatriated cash from that market, and initial start-up losses on the establishment of Blackmores International which were not recognised for tax purposes in the year.
FINANCIALPOSITIONOFTHEGROUPTotal current assets have increased by $56 million to $188 million, 43% up, largely reflecting the higher receivables due to stronger sales in the last quarter versus the prior financial year. inventory levels have remained flat at $39 million which, in the context of higher sales, demonstrates improved stock turn.
Current liabilities have increased from $58 million to $115 million, a $57 million increase, reflecting both the increased volumes of inventory purchases and improved payment terms with suppliers. the increase of $10 million in current tax liabilities largely reflects the income tax payable in Australia on higher earnings.
Non-current liabilities have decreased from $74 million to $45 million, a movement of $29 million largely due to a decrease in interest-bearing liabilities. Net debt has decreased from $54 million to $7 million, a decrease of 87%. This decrease is explained by an 90% increase in operational cash flow to $71 million, enabling the repayment of long-term debt, improved treasury capability and working capital position. This lower net debt resulted in improvements to the gearing Ratio at 5.1% (2014: 34.3%) and Net Interest Cover at 21.1 times (2014: 8.2 times).
equity has increased from $104 million to $133 million, a $29 million increase explained by the increase in group NPAT and Retained earnings, additional equity issued under the Dividend reinvestment plan (Drp) in October 2014 and foreign currency translation impacts on Reserves.
StrategicPlanandImperatives
Blackmores’ strategic imperatives are:
• Consumer Centricity – Continue to be consumer centric as we support our important Australian business and improve our connectivity to customers by expanding our digital presence
• AsiaGrowth – increase investment across the region and within key markets to deliver sustainable long term growth for the group
• ProductLeadership – Leverage the knowledge within the Blackmores Institute and BioCeuticals to drive product leadership and innovation and be recognised as the ‘Authoritative voice in Natural Health’
• OperationalEffectiveness – improve our operational effectiveness and leverage our size into scale in everything we do.
Australia is Blackmores’ core market and the retail environment remains highly competitive. The strategy is focused on ensuring profitable growth in the market through working with our customer partners, focusing on consumers and developing and executing a channel strategy underpinned by market research, analysis and proven consumer insights.
Asia provides the company with a strong platform for future growth underpinned by over 30 years of operation in the region. The diverse markets that make up the region require a dedicated focus and an intimate understanding of the nuances and similarities of each jurisdiction. The Asian consumer remains at the heart of everything the company does in the region. This philosophy combined with increased investment to build the Blackmores brand and develop product innovation from within the region; delivers continued success over the longer term.
Product leadership is and will continue to be at the forefront of activity for the group. The Blackmores Institute will strengthen the group’s recognition as the ‘Authoritative voice in Natural Health’ across the Asia pacific region. BioCeuticals working with the
Blackmores Institute, will continue to be a leader in innovation and knowledge acquisition in Australia with the Institute increasingly stretching its reach into Asia and beyond, to look to partner with leading organisations in education, advisory and research.
the Central Services group provides a scaleable and cost efficient platform to leverage as the business continues to grow. The use of specialist expertise and infrastructure designed to support the sales, supply chain, procurement and other commercial functions will continue to deliver improvements in the cost base and provide a solid foundation to support future growth.
The group remains acutely aware of the ever changing risk environment and increased governance requirements as the group continues to grow its scale and reach across Asia pacific. the business will continue to adopt conservative financial management practices to preserve shareholder value whilst looking for opportunities to invest for growth. The Board and the Audit and Risk Committee play a strong stewardship role in working with management to monitor, assess and address appropriate risks and opportunities as the business focuses on delivering on its strategic imperatives.
Blackmores places a strong emphasis on transparency, robust data, risk management and stakeholder engagement.
The Company is compliant with government environmental regulations and had no material environmental breaches or violations in the reporting period. Blackmores has implemented an environmental management System that will provide structure, transparency and robust data to support the information presented in our first public Sustainability report in Fy 16.
The group maintains strict environmental monitoring and management practises with a focus on key environmental issues and trends in waste, energy and packaging relative to financial performance and productivity.
Blackmores expects to deliver strong and sustainable results to shareholders by leveraging our trusted brand, staying true to the values and principles of the Company in maintaining our unrivalled quality and focusing on the needs of our consumers across Asia pacific.
SUBSEQUENTEVENTSThere has not been any matter or circumstance, other than that referred to in the Financial Statements or notes thereto, that has arisen since the end of the financial year, that has significantly affected, or may significantly affect, the operations of the Blackmores group, the results of those operations, or the state of affairs of the Blackmores group in future financial years.
CORPORATEGOVERNANCEIn recognising the need for the highest standards of corporate behaviour and accountability, the Board of Blackmores endorses the ASx Corporate governance Council’s Corporate governance Principles and Recommendations. The Company’s Corporate governance Statement is available on the Blackmores website at blackmores.com.au (go to ‘Investor Centre’, then click on ‘Corporate governance’).
INDEMNIFICATIONOFOFFICERSANDAUDITORSDuring the financial year, Blackmores paid a premium in respect of a contract insuring the Directors, the Company Secretary and all executive Officers of the Blackmores group against any liability incurred as such a Director, Company Secretary or executive Officer to the extent permitted by the Corporations Act 2001. The contract of insurance prohibits disclosure of the nature of the liability and the amount of the premium. Blackmores has not otherwise, during or since the end of the financial year, indemnified or agreed to indemnify an Officer or auditor of the Blackmores group against a liability incurred as such an Officer or auditor.
directors’ reportFOr the FinAnCiAL yeAr enDeD 30 JUne 2015
For
per
sona
l use
onl
y

34 35
Bl
ac
km
or
es
an
nu
al r
ep
or
t 2
01
5
Bl
ac
km
or
es
an
nu
al r
ep
or
t 2
01
5
directors’ report FOr the FinAnCiAL yeAr enDeD 30 JUne 2015
IntroductionfromtheChairoftheBoard’sPeopleandRemunerationCommittee
Dear Shareholder,
Below is a summary of the key decisions your Board has taken in relation to remuneration for the financial year 2015. Full details can be found in the Remuneration Report that follows.
The Blackmores Board is committed to a remuneration framework that closely aligns executive pay to the creation of shareholder value. group NPAT achievement against budget is the primary measure used to assess financial performance under the company’s short term incentive plan (Sti). given the exceptional financial performance of the group and delivery of key business objectives over the last year, the People and Remuneration Committee consider it highly appropriate that many of the senior management team have been awarded close to the maximum potential short term incentive payment. This clearly contrasts with the prior year when no long term incentives (LTI) were awarded and only one executive was awarded a partial short term incentive (STI).
no Lti awards were eligible to vest in the 2015 financial year for the current year LTI plan as a new plan came into effect which extended the performance period from one year to three years. The total remuneration for the financial year, the details of which is shown on page 42, includes an accounting expense for these unvested performance rights and has been calculated using the value of the maximum number of rights that could vest over the three year performance period.
no performance rights vested in the financial year for the previous LTI plan as a result of a failure to meet performance hurdles in the applicable financial years.
SUMMARYOFKEYCHANGESthe key changes to remuneration-related matters in 2014/2015 are as follows:
• Aaron Canning joined the Company as key management personnel in the role of Chief Financial Officer in December 2014 and replaced Chris Last who left the business in march 2015.
• A review of market practices and shareholder consultation resulted in changes to the Blackmores LTI to extend the performance period from one to three years.
grants to Senior executives during the financial year will not vest until 30 June 2017, following the achievement of performance hurdles.
• Any payment under the Company’s Sti to Senior executives was subject to an additional performance hurdle of year on year group NPAT growth.
• with a view to further align the interests of Senior executives and the long term interest of shareholders, the Board adopted a Clawback Policy. In the event that Blackmores becomes aware of any deliberate misstatement or manipulation of results in its financial statements for any of the immediately preceding three financial years, an assessment will be made to determine the impact on incentives awarded to a Senior executive. The Board may require a repayment or may withhold all or a part of an incentive award or forfeit unvested performance rights.
CHIEFEXECUTIVEOFFICERANDMANAGINGDIRECTORthe Chief executive Officer and managing Director received an increase in her fixed annual remuneration (FAr) of 2.2%, compared to the prior year. ms Holgate was awarded the maximum potential Sti (65% of FAr) of $448,564 in relation to F15. her total remuneration for the financial year was $1,539,287, as noted on page 42. This includes an accounting expense of $289,492 in relation to her unvested performance rights granted in the financial year. excluding these accounting charges for rights that have not vested during the year, ms holgate’s remuneration for the financial year was $1,249,795.
SENIOREXECUTIVESFIXEDANNUALREMUNERATIONINCREASES AND STI AWARDSSenior executive fixed annual remuneration increased effective 1 July 2014 based on business and individual performance and aligned to market remuneration levels. the average Senior executive fixed remuneration increase was 2.4%, compared to the prior year. The average Senior executive Sti awarded was 73.1% of FAr and 94.3% of the maximum potential incentive. No Senior executives received the maximum potential STI incentive.
NONEXECUTIVEDIRECTORCHANGESnon- executive Director fees increased by 2.4%, effective 1 July 2014.
One non-executive Director, verilyn Fitzgerald, retired during the financial year; and the Board welcomed John Armstrong, who was appointed as a non-executive Director during the year.
FUTURECHANGESTOREMUNERATIONPOLICIES• To enhance the transparency of the STI performance hurdle, the
Board has approved a change to the performance measure from NPAT achievement against budget to NPAT growth over prior year.
• to further align the interests of senior executives and shareholders, the STI will be increased for the coming year to a maximum potential incentive of 100% of FAr.
• the Board is very pleased with the performance of the Chief executive Officer in driving the business strategy and leading the Company through a period of change and growth. Based on this performance, the growing size of the Company and the growth in market capitalisation of Blackmores Limited, the Board will review the Chief executive Officer’s remuneration accordingly for the coming year.
• Subject to approval by shareholders at the 2015 Agm, the total Directors Fee pool will be increased from $700,000 to $1,000,000. this will allow sufficient flexibility to appoint additional non-executive Directors should the Board so decide given the current expansion of the Company and will also allow an increase to Directors Fees in the coming years in line with market growth and relevant benchmarks. While it is sought to increase the ceiling it does not imply that the full amount will be used.
The Board believes the 2015 Remuneration Report provides you with a thorough overview of our remuneration policies and practices and demonstrates the links between Company performance and remuneration outcomes. We will continue to evolve our policies and practices in line with business circumstances and our market environment whilst seeking ongoing shareholder feedback on the Company’s Remuneration framework.
Helen Nash Chair – people and remuneration Committee
REMUNERATIONREPORT
directors’ reportFOr the FinAnCiAL yeAr enDeD 30 JUne 2015
DIRECTORS’MEETINGSthe number of Directors’ meetings held (including meetings of Committees of Directors) during the financial year are as follows:
STATEMENTOFNON-AUDITSERVICESthe Directors are satisfied that the provision of non-audit services during the year by the auditor (or by another person or firm on the auditor’s behalf) is compatible with the general standard of independence for auditors imposed by the Corporations Act 2001. Details of amounts paid or payable to the auditor for non-audit services provided during the year by the auditor are outlined in note 12 to the Consolidated Financial Statements.
Directors have accepted a statement from the auditor that it is satisfied that the provision of these services did not breach the independence standards included in the Corporations Act 2001. Based on this statement from the auditor and having regard to the nature and fees involved in the provision of these non-audit services, the Directors are satisfied that the provision of non-audit services during the year by the auditor (or other person or firm on the auditor’s behalf) did not compromise the audit independence requirements of the Corporations Act 2001.
AUDITOR’SINDEPENDENTDECLARATIONA copy of the Auditor’s independence Declaration is set out on page 46 of this Annual Report.
ROUNDINGOFFAMOUNTSIn accordance with the Australian Securities and Investments Commission (ASiC) Class Order 98/0100, dated 10 July 1998, the amounts in the Directors’ report and the Financial report are rounded off to the nearest thousand dollars, unless otherwise indicated.
PEOPLE AND BOARD OF AUDIT & RISK NOMINATIONS REMUNERATION DIRECTORS COMMITTEE COMMITTEE COMMITTEE
DIRECTORS HELD1 ATTENDED HELD1 ATTENDED HELD1 ATTENDED HELD1 ATTENDED
David Ansell 7 6 4 4 2 2 - -John Armstrong 1 1 1 1 - - - -marcus Blackmore 7 7 - - 2 2 4 4Stephen Chapman3 5 5 3 3 2 2 3 3verilyn Fitzgerald 2 2 1 1 2 2 1 1Christine Holgate2 7 7 4 4 2 2 4 4Helen Nash 7 6 - - 2 2 4 4Brent Wallace 7 7 4 4 2 2 4 41. reflects the number of meetings held during the time that the Director held office during the year.2. Christine Holgate’s attendance at the Audit and Risk Committee and People and Remuneration Committee was as an invitee.3. Stephen Chapman was on an unpaid leave of absence from 14 Apr 2015.
For
per
sona
l use
onl
y

36 37
Bl
ac
km
or
es
an
nu
al r
ep
or
t 2
01
5
Bl
ac
km
or
es
an
nu
al r
ep
or
t 2
01
5
GovernanceIn this Report the following terms and phrases have the meanings indicated below:
Executive Directors – refers to the Chairman and Chief executive Officer.
Directors - executive Directors and non-executive Directors.
KeyManagement – includes all Directors as well as those Senior executives who have authority and responsibility for planning, directing and controlling the activities of the Blackmores group, directly or indirectly.
Granted – Assigned to, but not yet vested.
Vested – met performance criteria and available to be exercised, but not yet owned.
Exercised – Owned.
KEYMANAGEMENTPERSONNELthe following table lists all the current key management personnel (kmp) referred to in this report.
Non-ExecutiveDavid Ansell non-executive Director and member of the Audit and Risk Committee and Nominations Committee John Armstrong non-executive Director and member of the Audit and Risk Committee and Nominations Committee Stephen Chapman non-executive Director, Deputy Chairman, member of the Audit and Risk Committee, member of the People and Remuneration Committee and Chair of the Nominations Committee helen nash non-executive Director, Chair of the people and Remuneration Committee and member of the Nominations Committee Brent wallace non-executive Director, Chair of the Audit and Risk Committee, member of the People and Remuneration Committee and Nominations Committee Executive Directors marcus Blackmore Chairman of the Board, member of the People and Remuneration Committee and Nominations Committee Christine holgate Chief executive Officer and managing Director and member of the Nominations Committee Senior Executives Lesley Braun Director Blackmores institute Aaron Canning Chief Financial Officernathan Cheong managing Director BioCeuticals Cecile Cooper Company Secretary and Director of Corporate AffairsDavid Fenlon managing Director Australia and new Zealand richard henfrey Chief Operating Officer peter Osborne managing Director Asia
PEOPLEANDREMUNERATIONCOMMITTEEThe primary responsibility of the People and Remuneration Committee is to make recommendations to the Board on remuneration strategy and policy for kmp of Blackmores that are in the best interests of Blackmores and its shareholders. The composition and function of the People and Remuneration Committee is set out in the Committee’s charter which can be viewed or downloaded from the Company’s website at blackmores.com.au (go to ‘Investor Centre’, then click on ‘Corporate governance’). The charter is reviewed annually.
The People and Remuneration Committee comprises three non-executive Directors and the executive Chairman who have experience in both remuneration governance and the Blackmores business. The members are: • helen nash – Chair• marcus Blackmore• Stephen Chapman• Brent wallace
ADVISORSTOTHECOMMITTEEThe People and Remuneration Committee has established protocols for engaging and dealing with external advisors and this is included in the Committee’s charter. The Committee obtains specialist external advice about remuneration structure and levels. The advice is used to support its assessment of the market to ensure that Senior executives and non-executive Directors are being rewarded appropriately, given their responsibilities and experience. executive remuneration packages are also reviewed annually against suitable benchmarks to ensure that an appropriate balance between fixed and incentive pay is achieved.
The Committee did not use a remuneration consultant in the current financial year.
Non-ExecutiveDirectorRemunerationREMUNERATIONPOLICYANDSTRUCTURECompensation arrangements for non-executive Directors are determined by Blackmores after reviewing published remuneration surveys and market information. non-executive Directors receive fixed annual fees comprising a Board fee, Committee fee and Committee Chair fee as applicable. No incentive based payments are awarded to non-executive Directors.
Blackmores makes superannuation contributions on behalf of non- executive Directors in accordance with statutory obligations and each non-executive Director may sacrifice their fees in return for additional superannuation contributions paid by Blackmores. Retirement allowances were accrued until 1 October 2003 for non-executive Directors appointed prior to this date. no further retirement allowances have accrued to these individuals. Non- executive Directors appointed after 1 October 2003 do not receive a retirement allowance.
NON-EXECUTIVEDIRECTORS’FEESDirectors’ fees were increased in the 2015 financial by 2.4% effective 1 July 2014.
Directors’ fees were not increased in the 2014 financial year other than the increase to the superannuation guarantee levy of 0.25% per annum.
Directors’ fees paid in respect of the 2015 financial year include: • the base fee for each Director of $77,072 per annum; • an additional fee of $7,896 for each Committee membership; • an additional fee of $5,264 if appointed Chairman of the
Committee; and • superannuation in accordance with the superannuation
guarantee levy.
A non-executive Director, who is also Deputy Chairman, receives 150% of the relevant base fee. members of the Nominations Committee do not receive any additional fees.
For Directors appointed prior to 1 October 2003, a retirement allowance applies of $15,333 per annum, which accrues each year but is capped after nine years of service at $138,000.
Shareholders at a meeting held on 21 October 2010 determined the maximum total non-executive Directors’ fees payable, including committee fees, to be $700,000 per year, to be distributed as the Board determines.
The following table discloses the remuneration of the Non-executive Directors for the financial year ended 30 June 2015.
SHORT-TERM POST EMPLOYMENT EMPLOYMENT BENEFITS BENEFITS
FEES AND ALLOWANCES SUPERANNUATION TOTAL $ $ $
NON-EXECUTIVEDIRECTORS DavidAnsell1 2015 84,968 8,074 93,0422014 57,794 5,346 63,140 JohnArmstrong2 2015 14,052 1,335 15,3872014 - - -StephenChapman3 2015 106,737 10,140 116,8772014 131,701 12,182 143,883HelenNash4 2015 88,654 8,422 97,0762014 57,794 5,346 63,140 BrentWallace5 2015 93,859 8,917 102,7762014 90,851 8,404 99,255 FORMERNON-EXECUTIVEDIRECTOR VerilynFitzgerald6 2015 30,217 2,871 33,0882014 70,568 34,313 104,881Total 2015 418,487 39,759 458,2462014 408,708 65,591 474,299
1. David Ansell joined as a non-executive Director 22 Oct 2013.2. John Armstrong joined as a non-executive Director 5 may 2015.3. Stephen Chapman was on an unpaid leave of absence from 14 Apr 2015.4. helen nash joined as a non-executive Director 22 Oct 2013 and was appointed as the Chair of the
People and Remuneration Committee 23 Oct.5. Brent Wallace was appointed as the Chair of the Audit and Risk Committee 28 Apr 2015.6. verilyn Fitzgerald retired as a non-executive Director 23 Oct 2015. Shareholders approved a
retirement scheme by resolution in 1993 and v Fitzgerald was paid a retirement amount of $138,000 in accordance with this approved scheme. The amount was fully provided and disclosed in prior year’s financial statements.
7. there were no increases to the non-executive Directors Fees in the financial year 2014 other than the superannuation guarantee levy increase of 0.25% per annum.
8. 2014 financial year totals do not include remuneration for non-executive Directors who retired during Fy14.
Directors’ and Officers’ liability insurance has not been included in the figures above since the amounts involved are not material and it is not possible to determine an appropriate allocation basis.
Executive Director and Senior Executive RemunerationPolicyREMUNERATIONPOLICYBlackmores remunerates its people fairly and responsibly.
The People and Remuneration Committee has established a remuneration policy aimed at achieving the following objectives: • encourage a strong and long-term commitment to Blackmores;• attract and retain talented Senior executives and Directors; and• enhance Blackmores’ earnings and shareholder wealth.
Blackmores’ remuneration policy is transparent and linked to both the individual’s and group’s performance. These guidelines are underpinned by clearly defined objectives and measures, with each Senior executive assessed in line with the performance management program.
Fixed and performance-related remuneration provides executives with tangible incentives to meet Blackmores’ objectives and to share in the success and profitability of Blackmores in alignment with the interests of shareholders.
COMPONENTSOFEXECUTIVEDIRECTORANDSENIOREXECUTIVEREMUNERATIONThe executive remuneration framework consists of the following components:
Fixed Remuneration
Fixed remuneration reflects core performance requirements and expectations. It is targeted to be reasonable and fair, taking into account Senior executives’ responsibilities and experience compared with competitive market benchmarking against companies with relative size and scale of Blackmores’ operations. This component of remuneration includes superannuation.
Performance-basedRemuneration
• Short-term incentives (Sti) – comprise cash payments linked to clearly specified annual group targets and individual objectives and behaviours. This element of remuneration is considered to be an effective tool in promoting the interests of Blackmores and its shareholders. The STI scheme is designed around appropriate performance benchmarks based on Blackmores’ NPAT performance relative to budget and requires the achievement of year on year growth.
• profit Share – executive Directors and Senior executives participate in the same profit share plan as all permanent Blackmores staff.
• Long-term incentives (Lti) – the executive performance Share plan (ePSP) was approved at Blackmores’ Annual general meeting in October 2014. participation is open to executive Directors and Senior executives determined to be eligible by the Board. Under this plan, rights to acquire shares in Blackmores are granted annually to eligible Senior executives at no cost and vest provided specific performance hurdles are met. the Chairman’s incentive is a cash-based equivalent.
• Special long-term incentives (SLti) – From time to time the Board may offer ‘one-off’ SLtis to particular executive Directors and Senior executives in addition to the LTI as outlined above. There are currently no SLTIs in place.
LinktoStrategicObjectivesandPerformance
The following diagram illustrates how the performance-based components are structured to align with Blackmores’ strategic objectives. The performance-based remuneration section provides further details of the relationship between the incentive plans and performance.
directors’ report | REMUNERATIONREPORTFOr the FinAnCiAL yeAr enDeD 30 JUne 2015
directors’ report | REMUNERATIONREPORTFOr the FinAnCiAL yeAr enDeD 30 JUne 2015
For
per
sona
l use
onl
y

PERFORMANCE-BASEDREMUNERATIONperformance incentives – Actual performance 2015 Financial year
Short-termIncentive(STI)
Blackmores’ 2015 NPAT of $46.6 million represented an 83.1% increase.
the amount awarded to the key management personel for the 2015 STI was $2,245,759 (2014: $40,731). This award is included under the ‘Sti and profit Share’ column in the remuneration disclosures table on page 42.
Long-termIncentives(LTI)
No long term incentive (LTI) awards were eligible to vest in the 2015 financial year as a new Lti plan came into effect which included a three-year performance period for the Fy15 Lti plan.
no performance rights vested in the 2015 financial year for the old LTI plans as a result of a failure to meet performance hurdles in those years.
the total remuneration for the financial year, the details of which are shown on page 42, includes an accounting expense of $736,784 for these unvested performance rights. This amount has been calculated assuming the achievement of the maximum performance hurdle over the three-year performance period and represents one third of the total value of the unvested rights.
BLACKMORESEPSANDNPATPERFORMANCEIS ILLUSTRATEDINTHEFOLLOWINGGRAPH.
0 -20
5,000 -10
10,000 0
15,000 10
20,000 20
25,00030
30,00040
35,00050
40,00060
45,00070
50,00080
90
FY11 FY12 FY13 FY14 FY15
NPA
T (A
$000
)
net prOFit AFter tAxePS gROWTH
ePS
gRO
WTH
(% P
A)
38 39
Bl
ac
km
or
es
an
nu
al r
ep
or
t 2
01
5
Bl
ac
km
or
es
an
nu
al r
ep
or
t 2
01
5
REMUNERATIONMIX2015FINANCIALYEARthe following table shows the maximum at risk rewards as a percentage of fixed and total remuneration for the 2015 financial year.
RemunerationMix2015FinancialYear
Maximum Maximum Profit Maximum STI as a % of Share as a % of LTI as a % of Ratio at Risk/ At Risk as % Position Fixed Remuneration1 Fixed Remuneration Fixed Remuneration Fixed Remuneration1 of Total2
Chairman 65% 10% 60% 1.35 57%CeO 65% 10% 150% 2.25 69%Other kmp 78% 10% 60% 1.48 60%1. Fixed remuneration includes cash, non-monetary benefits and superannuation.2. total is the Aggregate reward (Fixed remuneration plus Sti plus profit Share plus Lti).
SHORT-TERMINCENTIVES(STI)–PERFORMANCECONDITIONSSpecific information relating to the actual annual performance awards is set out in the table on page 43.
directors’ report | REMUNERATIONREPORTFOr the FinAnCiAL yeAr enDeD 30 JUne 2015
directors’ report | REMUNERATIONREPORTFOr the FinAnCiAL yeAr enDeD 30 JUne 2015
What is the annual incentive and who is eligible to participate?
The STI plan provides eligible employees with a reward for annual performance against measured targets set at the beginning of the performance period. eligible employees include the executive Directors, Senior executives and other nominated employees.
What is the amount the eligible employee can earn?
Senior executivesChief executive Officer Chairman
When are performance conditions tested?
npAt is calculated by Blackmores at the end of the financial year, verified by Blackmores’ auditors and published in the group’s Financial Statements before any payment is made. this method was chosen to ensure transparency and consistency with disclosed information.
The person to whom a Senior executive reports assesses that individual’s performance by reviewing his or her individual objectives, key tasks and performance indicators and the extent to which they have been achieved. individual objectives are set at the start of each financial year and are formally reviewed every six months. the Board reviews performance assessments for key management personnel.
20%30% 0% individual objectives: Financial – (i.e. revenue, new product launches and other specific objectives) non-financial measures – (i.e. safety, employee engagement and other agreed objectives)
% of base remuneration% of target performance
What were the performance conditions for the 2015 financial year?
Senior executivesChief executive Officer Chairman measures
80%70% 100% group financial measures – group and Divisional npAt achievement against budget.
group NPAT achievement of growth over prior year.
0% 78%
0% 65%
0% 65%
Less than 95% 125% Sliding scale between these points
Why were these performance measures chosen?
npAt performance relative to budget is a well-recognised measure of financial performance and a key driver of shareholder returns. Using npAt as an incentive performance measure ensures that incentive payments are aligned with Blackmores’ business strategy and objectives.
The NPAT budget is approved on an annual basis by the Board and incentive targets are set by the Board at levels designed to reward superior performance.
Achievement of NPAT growth over prior year aligns remuneration outcomes with shareholder’s expectations.
Individual performance was selected as a secondary performance condition to ensure that Senior executives have clear objectives and performance indicators that are linked to Blackmores’ performance.
Senior executives have the ability to earn a personal multiplier on the achievement of individual objectives up to a further 20% of the maximum potential.
Blackmores’ policy is that STIs will only be awarded when Blackmores meets agreed performance hurdles. In addition, Senior executives are not awarded any STI in the instance of the lowest personal performance assessment.
NOTATRISKREMUNERATION
REMUNERATION COMPONENT DELIvERY PERFORMANCE MEASURE AT RISK-WEIGHT1 STRATEGIC OBjECTIvE
Fixed Remuneration2 Cash, super, benefits Job Description, Benchmarking Comparison
Staff to execute business plans
ProfitShare Cash based, (Up to $1,000 can be taken as shares)
Percentage allocation of group NPAT
Approx. 6% of Fixed
Reward achievement of annual earnings
ProfitShare Cash Percentage allocation of group NPAT if NPAT growth over prior financial achieved
Approx. 4% of Fixed
Reward achievement and creation of annual earnings growth
STI Cash paid annually after release of the audited results
GroupMeasure NPAT achievement against budget Divisional measure3 NPAT achievement against budget IndividualMeasure3 Financial – (e.g. revenue growth, operational expenditure management) non-financial (e.g. leadership, employee engagement, project delivery, safety)
STIatRisk(asa%ofFixed)Chairman 65%CeO 65%Other kmp 78%
Reward achievement and creation of annual earnings growth Reward achievement of specific division goals Reward the achievement of individual performance goals
LTI Rights to acquire sharesWhere regulations prohibit an equity based plan, a cash equivalent is awarded
Company Measure 3 year compounded ePS growth vesting occurs at the end of the 3 year performance periodIndividualCondition vesting of share rights is subject to a service condition
CeO 150%Chairman & Other kmp 60%
Reward creation of shareholder wealthexecutives aligned to shareholders
1. maximum Sti and Lti component expressed as a percentage of Fixed remuneration.2. Includes Superannuation guarantee payments.3. the group measure of npAt is the Sti Financial performance metric which applies to all Sti participants. individual measures also apply to all Sti participants however Divisional performance metrics only apply to
those participants employed in a Divisional role rather than a Corporate or Central Services role.
ATRISKREMUNERATION
For
per
sona
l use
onl
y

40 41
Bl
ac
km
or
es
an
nu
al r
ep
or
t 2
01
5
Bl
ac
km
or
es
an
nu
al r
ep
or
t 2
01
5
PROFITSHARE–PERFORMANCECONDITIONANDOPERATION LONG-TERMINCENTIVES(LTI)–PERFORMANCECONDITIONS(CONT.)
directors’ report | REMUNERATIONREPORTFOr the FinAnCiAL yeAr enDeD 30 JUne 2015
directors’ report | REMUNERATIONREPORTFOr the FinAnCiAL yeAr enDeD 30 JUne 2015
What is the annual incentive and who is eligible to participate?
Senior executives participate in a profit share plan, whereby up to 10% of the group npAt is allocated to all eligible permanent group staff on a pro-rata basis by reference to their base remuneration. the profit share plan is in addition to the STI award.
What is the amount the executive can earn?
The amount distributed is a percentage of group NPAT. As the amount is distributed on a pro-rata basis, the amount earned in any year depends on both the group NPAT achievement and the total number of employees and salaries in the calculation. The approximate maximum amount of base remuneration that can be earned is 10%.
What were the performance conditions for the 2015 financial year?
For the financial year a performance condition included in the Company’s Collective Agreement was 7.5% of the group NPAT allocated and an additional 2.5% allocated conditional based on the achievement of group npAt growth on the prior financial year.
Why were these performance measures chosen?
npAt is a well-recognised measure of financial performance and a key driver of shareholder returns. Using NPAT as an incentive performance measure ensures that incentive payments are aligned with Blackmores’ business strategy and objectives.
When are performance conditions tested?
profit share is paid twice a year based on Blackmores’ npAt calculation.
All employees, including Senior executives, may purchase up to $1,000 of Blackmores shares each year under the Staff Share Acquisition Plan with money that would have otherwise been received under the profit share plan.
Blackmores’ Share Trading Policy prohibits executives from entering into any transaction which operates to hedge the exposure of unvested shares received under any share incentive plan, unless prior approval is provided by the Board.
What is the annual incentive and who is eligible to participate?
eligible employees are invited annually by the Board to participate in the executive Performance Share Plan (epSp). Under this plan, eligible employees are granted rights to acquire shares in Blackmores.
eligible employees include the executive Directors, Senior executives and other nominated employees.
What was the performance condition for the 2015 financial year?
The performance condition is the three year ePS compounded growth. In determining the performance conditions for Blackmores’ LTI plan, the Board has recognised ePS growth to be the key driver of shareholder value, influencing both share price and the capacity to pay increased dividends.
growth in ePS is simple to calculate and basing the vesting of rights on ePS growth encourages Senior executives to improve Blackmores’ financial performance. As Senior executives increase their shareholding in Blackmores through awards received under the ePSP, their interests become more directly aligned with those of Blackmores’ other shareholders.
the performance period for measuring epS growth is three years (2015 to 2017 financial years).
What is the annual incentive and who is eligible to participate?
eligible employees are invited annually by the Board to participate in the executive Performance Share Plan (epSp). Under this plan, eligible employees are granted rights to acquire shares in Blackmores.
eligible employees include the executive Directors, Senior executives and other nominated employees.
How does the ePSP operate?
The value of rights granted to eligible employees is equivalent to a percentage of their base remuneration at the time of grant.
The number of rights granted equals the value of rights divided by:
• the weighted average price of Blackmores shares for the five day trading period commencing seven days after Blackmores’ results in respect of the prior financial year (year ended 30 June 2014) are announced to the ASx, less
• the amount of any final dividend per share declared as payable in respect of the prior financial year (year ended 30 June 2014).
rights are automatically exercised following vesting, audit clearance of the 2017 Financial Statements, Board approval and the first trading window. these Blackmores shares are issued to participants at zero cost.
The number of shares issued is identical to the number of rights exercised.
In the case of the Chairman, a cash equivalent is paid in lieu of shares. Where regulations prohibit an equity based plan, a cash equivalent is awarded.
When are performance conditions tested?
Compounded annual growth in epS is calculated at the end of the three year financial year and verified with reference to Blackmores’ audited Financial Statements prior to determining the number of rights that will vest. This method was chosen as it is an objective test that is easy to calculate and ensures transparency and consistency with public disclosures.
What happens if the eligible employee ceases employment during the performance period?
If an executive ceases employment during the three year performance period the rights lapse.
EmploymentContractsthe remuneration and other terms of employment are covered in employment contracts. no contract is for a fixed term.
TERMINATIONexecutive Directors’ and Senior executives’ contracts can be terminated by Blackmores or the Senior executive providing notice periods as shown in the following table.
Name notice periods / termination payment
Christine Holgate1 Six months notice (or payment in lieu) including redundancy.
may be terminated immediately for serious misconduct.
Senior
executives2
Three months notice (or payment in lieu).
may be terminated immediately for serious misconduct.
Redundancy Payments
1. For the purposes of calculating Christine holgate’s payment, a month of pay is based on her total remuneration package at the time, being base salary, superannuation contributions and other benefits as agreed from time to time.
2. For the purposes of calculating the amount payable for all other Senior executives, one week of pay is the average amount received by the individual as wages or salary over the four weeks of employment immediately preceding termination of employment.
years of continuous service
Up to one year
Between one and 10 years
10 years or more
notice periods / termination payments.
Two weeks pay.
Two weeks pay plus an additional three weeks of pay for each completed year of service.
29 weeks pay plus an additional three weeks of pay for each completed year of service following 10 years capped at a maximum of 52 weeks of pay.
0% 10% Sliding Scale 20% Sliding scale 60%
0% 25% Sliding scale 50% Sliding scale 150%
Less than 3.9% 3.9% 3.9% to 7.8% 7.8 7.8% to 17.9% 17.9%
What is the amount the eligible employee can earn?
Chairman and Senior executivesChief executive Officer
% of base remuneration% of target performance
LONG-TERMINCENTIVES(LTI)–PERFORMANCECONDITIONSSpecific information relating to the actual annual performance awards is set out in the table on page 43.
For
per
sona
l use
onl
y

42 43
Bl
ac
km
or
es
an
nu
al r
ep
or
t 2
01
5
Bl
ac
km
or
es
an
nu
al r
ep
or
t 2
01
5
directors’ report | REMUNERATIONREPORTFOr the FinAnCiAL yeAr enDeD 30 JUne 2015
directors’ report | REMUNERATIONREPORTFOr the FinAnCiAL yeAr enDeD 30 JUne 2015
RemunerationdisclosuresforExecutiveDirectorsandKeyManagementPersonnel
REMUNERATIONINRESPECTOFTHE2015FINANCIALYEARthe following table discloses the remuneration of the executive Directors and Senior executives of Blackmores for the financial year ended 30 June 2015.
OTHER POST- LONG-TERM SHARE- EMPLOYMENT EMPLOYMENT BASED SHORT-TERM EMPLOYMENT BENEFITS BENEFITS BENEFITS PAYMENTS % OF PERFORM- % OF NON-PER- % OF SALARY AND STI AND NON- SUPER- SHARES AND ANCE BASED FORMANCE BASED REMUNERATION FEES PROFIT SHARE1 MONETARY2 OTHER3 ANNUATION OTHER4 RIGHTS 5 TOTAL REMUNERATION REMUNERATION RIGHTS
$ $ $ $ $ $ $ $ % % %
Executive Directors MarcusBlackmore2015 353,891 284,395 - 33,890 18,255 6,502 63,754 760,687 45.8% 54.2% 8.4%2014 333,912 25,607 - 31,821 17,775 5,589 - 414,704 7.2% 92.8% -ChristineHolgate 2015 637,909 528,599 - 52,622 18,255 12,410 289,4921,539,287 53.1% 46.9% 18.8%2014 594,532 48,541 - 52,284 17,775 10,021 - 723,153 21.8% 78.2% 20.5%Senior Executives LesleyBraun6 2015 270,170 254,220 - 22,084 18,255 468 51,447 616,644 49.6% 50.4% 8.3%2014 105,291 8,391 - 8,981 8,360 - - 131,023 - - -AaronCanning7 2015 200,198 217,239 - 19,812 31,338 - 49,580 518,167 51.5% 48.5% 9.6%2014 - - - - - - - - - - -NathanCheong8 2015 254,076 147,655 - 22,635 7,947 712 48,535 481,560 40.7% 59.3% 10.1%2014 61,324 - - 5,012 4,101 1,085 - 71,522 - - -CecileCooper 2015 194,364 203,170 - 19,880 29,024 7,440 39,716 493,594 49.2% 50.8% 8.0%2014 201,302 15,385 492 21,226 17,774 19,475 - 275,654 5.4% 94.6% -DavidFenlon9 2015 387,255 370,351 - 32,539 18,441 859 72,026 881,471 50.2% 49.8% 8.2%2014 306,310 63,855 - 24,413 13,331 - - 407,909 - - -RichardHenfrey 2015 328,407 346,199 15,566 32,052 24,755 6,795 67,357 821,131 50.4% 49.6% 8.2%2014 298,844 26,482 29,348 32,426 23,525 6,155 - 416,780 12.6% 87.4% 5.8%PeterOsborne 2015 291,723 273,349 - 26,323 - - 54,877 646,272 50.8% 49.2% 8.5%2014 278,906 22,495 - 25,197 - - - 326,598 6.9% 93.1% -FormerKMP’sandSeniorExecutivesdisclosedundertheCorporationsAct2001 ChrisLast10 2015 234,742 13,944 - 7,346 13,691 1,068 - 270,791 5.1% 94.9% 0.0%2014 283,873 24,199 - 29,837 17,775 3,717 - 359,401 12.5% 87.5% 5.8% Total 2015 3,152,735 2,639,121 15,566 269,183 179,961 36,254 736,784 7,029,604 48.0% 52.0% 10.5%2014 2,464,294 234,955 29,840 231,197 120,416 46,042 - 3,126,744 11.9% 88.1% 5.0%
PERFORMANCERELATEDREMUNERATIONthe table below shows the details of the Sti cash bonuses awarded as remuneration to executive Directors and Senior executives that was paid for the financial year ended 30 June 2015.
STI
Included in Personal3 STI earned as a % % of maximum STI remuneration1 Multiplier of maximum STI award forfeited
$ % %
Executive Directors marcus Blackmore2 242,209 - 100 0Christine Holgate2 448,564 - 100 0Senior Executives3 Lesley Braun 220,017 115 92 8Aaron Canning 184,905 115 92 8Nathan Cheong 116,152 120 96 4Cecile Cooper 177,231 120 96 4David Fenlon 321,416 120 96 4Richard Henfrey 300,581 120 96 4Chris Last4 - - - 100Peter Osborne 234,684 115 92 81. the amounts included in remuneration for the financial year represent the amount earned in relation to the 2015 financial year. the Sti reward is based on the achievement of Company financial measures,
individual objectives and the satisfaction of service criteria.2. The Chairman’s and CeO’s award are paid according to the table on page 39.3. the maximum potential award was achieved in respect of Company financial measures. Senior executives have the ability to earn a personal multiplier on the achievement of individual objectives. the maximum
multiplier is 125%. 4. the amount forfeited was due to the service criteria not being met in relation to the 2015 financial year.
SHARE-BASEDPAYMENTSthe table below outlines the rights over ordinary shares in the Company that were granted as compensation to executive Directors and Senior executives during the 2015 financial year. the fair value of awards is calculated in accordance with AASB 2 Share-based payments.
END OF HOLDING NAME GRANT VESTING EXERCISE LOCK
NUMBER % OF VALUE OF NUMBER OF FAIR VALUE TOTAL FAIR SHARE MAXIMUM OF NUMBER RIGHTS NOT DATE NOTE RIGHTS PER RIGHT VALUE PRICE VALUE1 DATE RIGHTS2, 5 GRANTED VALUE3 DATE VESTED
Executive Director
Christine holgate 7/11/14 4 34,436 $25.22 $868,476 $32.22 $1,109,528 30/06/17 - - - 09/2017 $1,109,528
Senior Executives
Lesley Braun 7/11/14 4 6,120 $25.22 $154,346 $32.22 $197,186 30/06/17 - - - 09/2017 $197,186Aaron Canning 10/12/14 4 5,143 $28.92 $148,736 $32.65 $167,919 30/06/17 - - - 09/2017 $167,919nathan Cheong 7/11/14 4 5,773 $25.22 $145,595 $32.22 $186,006 30/06/17 - - - 09/2017 $186,006Cecile Cooper 7/11/14 4 4,724 $25.22 $119,139 $32.22 $152,207 30/06/17 - - - 09/2017 $152,207David Fenlon 7/11/14 4 8,568 $25.22 $216,085 $32.22 $276,061 30/06/17 - - - 09/2017 $276,061richard henfrey 7/11/14 4 8,012 $25.22 $202,063 $32.22 $258,147 30/06/17 - - - 09/2017 $258,147peter Osborne 7/11/14 4 6,528 $25.22 $164,636 $32.22 $210,332 30/06/17 - - - 09/2017 $210,332
1. Disclosure of maximum value is required under s300A of the Corporations Act 2001. the value disclosed represents the underlying value of shares at the time of grant multiplied by the number of rights granted to each individual. The minimum value of rights awarded is zero if performance conditions are not achieved.
2. the total value of rights granted in the year is the fair value of the rights calculated at the time of grant. this amount is allocated to remuneration over the vesting period (i.e. 1 Jul 2014 to 30 Jun 2017).3. the number of rights vested is equal to the number of rights exercised and the number of shares issued; vesting occurs on 30 Jun and shares are issued in Sep following audit clearance of the group’s results and
Board approval.4. value of rights at exercise is equal to the number of rights exercised multiplied by the share price at exercise date.5. there were nil shares that vested in the 2015 financial year.
1. Amounts included in the ‘Sti and profit Share’ column include amounts paid by way of profit share on 17 Dec 2014 and 24 Jun 2015.2. non-monetary benefits include motor vehicle benefits.3. Amounts disclosed as other short-term employment benefits relate to provisions for annual leave.4. Other amounts shown under other long-term employment benefits relate to provisions for long service leave.5. the Fy15 share-based payments relate to the Lti plan and represent the Fy15 portion of the fair value of rights granted in the year. vesting of the majority of rights remains subject to
performance and service conditions as outlined page 43. the amount awarded for the Fy14 plan was nil.6. Lesley Braun joined 3 Feb 2014.7. Aaron Canning joined 4 Dec 2014.8. Nathan Cheong was appointed as a Senior executive 1 Apr 2014.9. David Fenlon joined 19 Sep 2013.10. Chris Last ceased as a Senior executive 27 mar 2015.11. 2014 financial year totals do not include remuneration for Senior executives whose roles changed during the 2014 financial year and remained in senior leadership roles in the group.
Directors’ and officers’ liability insurance has not been included in the figures above since the amounts involved are not material and it is not possible to determine an appropriate allocation basis.F
or p
erso
nal u
se o
nly
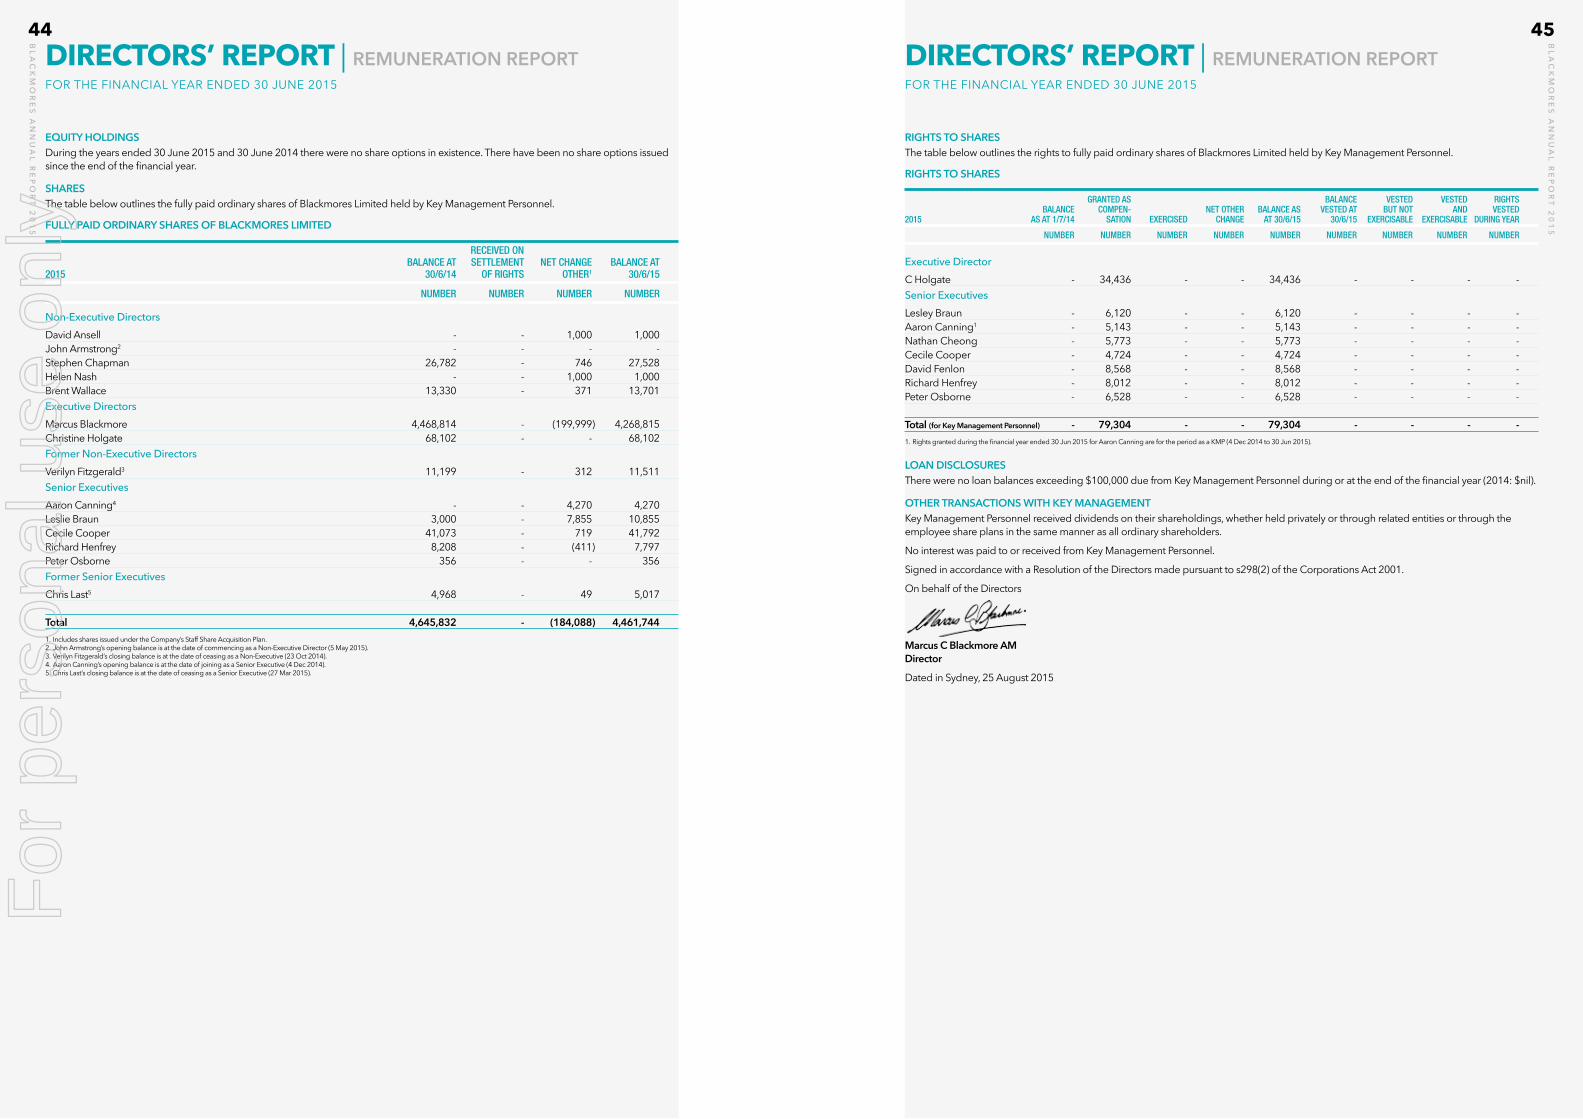
44 45
Bl
ac
km
or
es
an
nu
al r
ep
or
t 2
01
5
Bl
ac
km
or
es
an
nu
al r
ep
or
t 2
01
5
directors’ report | REMUNERATIONREPORTFOr the FinAnCiAL yeAr enDeD 30 JUne 2015
directors’ report | REMUNERATIONREPORTFOr the FinAnCiAL yeAr enDeD 30 JUne 2015
EQUITYHOLDINGSDuring the years ended 30 June 2015 and 30 June 2014 there were no share options in existence. there have been no share options issued since the end of the financial year.
SHARESthe table below outlines the fully paid ordinary shares of Blackmores Limited held by key management personnel.
FULLYPAIDORDINARYSHARESOFBLACKMORESLIMITED
RECEIvED ON BALANCE AT SETTLEMENT NET CHANGE BALANCE AT 2015 30/6/14 OF RIGHTS OTHER1 30/6/15
NUMBER NUMBER NUMBER NUMBER
Non-Executive Directors David Ansell - - 1,000 1,000 John Armstrong2 - - - - Stephen Chapman 26,782 - 746 27,528 Helen Nash - - 1,000 1,000 Brent Wallace 13,330 - 371 13,701 Executive Directors marcus Blackmore 4,468,814 - (199,999) 4,268,815 Christine Holgate 68,102 - - 68,102 Former Non-Executive Directors verilyn Fitzgerald3 11,199 - 312 11,511 Senior Executives Aaron Canning4 - - 4,270 4,270 Leslie Braun 3,000 - 7,855 10,855 Cecile Cooper 41,073 - 719 41,792 Richard Henfrey 8,208 - (411) 7,797 Peter Osborne 356 - - 356 Former Senior Executives Chris Last5 4,968 - 49 5,017 Total 4,645,832 - (184,088) 4,461,7441. Includes shares issued under the Company’s Staff Share Acquisition Plan.2. John Armstrong’s opening balance is at the date of commencing as a non-executive Director (5 may 2015).3. verilyn Fitzgerald’s closing balance is at the date of ceasing as a non-executive (23 Oct 2014).4. Aaron Canning’s opening balance is at the date of joining as a Senior executive (4 Dec 2014).5. Chris Last’s closing balance is at the date of ceasing as a Senior executive (27 mar 2015).
RIGHTSTOSHARESthe table below outlines the rights to fully paid ordinary shares of Blackmores Limited held by key management personnel.
RIGHTSTOSHARES
GRANTED AS BALANCE vESTED vESTED RIGHTS BALANCE COMPEN- NET OTHER BALANCE AS vESTED AT BUT NOT AND vESTED 2015 AS AT 1/7/14 SATION EXERCISED CHANGE AT 30/6/15 30/6/15 EXERCISABLE EXERCISABLE DURING YEAR
NUMBER NUMBER NUMBER NUMBER NUMBER NUMBER NUMBER NUMBER NUMBER
Executive DirectorC Holgate - 34,436 - - 34,436 - - - - Senior Executives Lesley Braun - 6,120 - - 6,120 - - - - Aaron Canning1 - 5,143 - - 5,143 - - - - Nathan Cheong - 5,773 - - 5,773 - - - - Cecile Cooper - 4,724 - - 4,724 - - - - David Fenlon - 8,568 - - 8,568 - - - - Richard Henfrey - 8,012 - - 8,012 - - - - Peter Osborne - 6,528 - - 6,528 - - - - Total(forKeyManagementPersonnel) - 79,304 - - 79,304 - - - -1. rights granted during the financial year ended 30 Jun 2015 for Aaron Canning are for the period as a kmp (4 Dec 2014 to 30 Jun 2015).
LOANDISCLOSURESthere were no loan balances exceeding $100,000 due from key management personnel during or at the end of the financial year (2014: $nil).
OTHERTRANSACTIONSWITHKEYMANAGEMENTkey management personnel received dividends on their shareholdings, whether held privately or through related entities or through the employee share plans in the same manner as all ordinary shareholders.
no interest was paid to or received from key management personnel.
Signed in accordance with a resolution of the Directors made pursuant to s298(2) of the Corporations Act 2001.
On behalf of the Directors
MarcusCBlackmoreAM Director
Dated in Sydney, 25 August 2015
For
per
sona
l use
onl
y

46 47
Bl
ac
km
or
es
an
nu
al r
ep
or
t 2
01
5
Bl
ac
km
or
es
an
nu
al r
ep
or
t 2
01
5
auditor’s independence declaration independent auditor’s reportF
or p
erso
nal u
se o
nly

48 49
Bl
ac
km
or
es
an
nu
al r
ep
or
t 2
01
5
Bl
ac
km
or
es
an
nu
al r
ep
or
t 2
01
5
independent auditor’s report directors’ declarationthe Directors declare that:
(a) in the Directors’ opinion, there are reasonable grounds to believe that the Company will be able to pay its debts as and when they become due and payable;
(b) in the Directors’ opinion, the attached Financial Statements are in compliance with international Financial reporting Standards, as stated in note 2 to the Financial Statements;
(c) in the Directors’ opinion, the attached Financial Statements and notes thereto are, in accordance with the Corporations Act 2001, including compliance with accounting standards and giving a true and fair view of the financial position and performance of the group; and
(d) the Directors have given the declarations required by s.295A of the Corporations Act 2001.
At the date of this declaration, the Company is within the class of companies affected by ASiC Class Order 98/1418. the nature of the deed of cross guarantee is such that each company which is party to the deed guarantees to each creditor payment in full of any debt in accordance with the deed of cross guarantee.
in the Directors’ opinion, there are reasonable grounds to believe that the Company, and the companies to which the ASiC Class Order applies, as detailed in note 31 to the Financial Statements will, as a group, be able to meet any obligations or liabilities to which they are, or may become, subject by virtue of the deed of cross guarantee.
Signed in accordance with a resolution of the Directors made pursuant to s.295(5) of the Corporations Act 2001.
On behalf of the Directors
MarcusCBlackmoreAM Director Dated in Sydney, 25 August 2015
For
per
sona
l use
onl
y

50 51
Bl
ac
km
or
es
an
nu
al r
ep
or
t 2
01
5
Bl
ac
km
or
es
an
nu
al r
ep
or
t 2
01
5
consolidated statement of profit or loss and other comprehensive income FOr the FinAnCiAL yeAr enDeD 30 JUne 2015
consolidated statement of financial positionAS At 30 JUne 2015
2015 2014 NOTES $’000 $’000
Sales 5 471,615 346,760 Revenue 471,615 346,760 Other income 6 908 7 Revenueandotherincome 472,523 346,767 Promotional and other rebates 83,285 59,302 Raw materials and consumables used 147,750 112,501 employee benefits expenses 7 94,353 70,156 Selling and marketing expenses 34,779 28,840 Depreciation and amortisation expenses 7 6,391 6,266 Operating lease rental expenses 7 3,519 3,163 Professional and consulting expenses 7,372 4,442 Repairs and maintenance expenses 3,275 2,869 Freight expenses 6,615 5,905 Bank charges 1,355 845 Other expenses 11,565 12,689 Totalexpenses 400,259 306,978 Earningsbeforeinterestandtax 72,264 39,789 Interest revenue 415 309 Interest expense 7 (3,847) (5,135)Net interest expense (3,432) (4,826)Profitbeforetax 68,832 34,963 Income tax expense 9 (22,276) (9,534)Profitfortheyear 46,556 25,429 Othercomprehensiveincome Itemsthatmaybereclassifiedsubsequentlytoprofitorloss exchange differences arising on translation of foreign controlled entities 24.3 4,158 (1,395)net (loss)/gain on hedging instruments entered into for cash flow hedges, net of tax 24.2 (400) 179 Other comprehensive income/(expense) for the year, net of tax 3,758 (1,216) Totalcomprehensiveincomefortheyear 50,314 24,213 EARNINGS PER SHARE – Basic earnings per share (cents) 26 270.7 149.2 – Diluted earnings per share (cents) 26 269.1 149.2 notes to the Consolidated Financial Statements are included on pages 54 to 88.
2015 2014 NOTES $’000 $’000
ASSETS
CuRRENT ASSETS Cash and bank balances 34.1 36,931 18,599 Receivables 13 107,076 70,567 Inventories 14 38,665 38,742 Other assets 5,172 3,468 Totalcurrentassets 187,844 131,376 NON-CuRRENT ASSETS Property, plant and equipment 15 60,735 63,613 Investment property 16 2,160 2,160 Other intangible assets 17 18,530 18,363 goodwill 18 16,863 16,863 Deferred tax assets 9.2 6,713 3,815 Other assets 562 404 Totalnon-currentassets 105,563 105,218 Totalassets 293,407 236,594 lIABIlITIES
CuRRENT lIABIlITIES Trade and other payables 19 94,908 49,153 Current tax liabilities 20 12,862 2,793 Provisions 22 6,284 5,471 Other liabilities 944 623 Totalcurrentliabilities 114,998 58,040 NON-CuRRENT lIABIlITIES Interest-bearing liabilities 21 44,000 73,000 Provisions 22 730 906 Deferred tax liabilities 9.2 202 - Other liabilities 562 422 Totalnon-currentliabilities 45,494 74,328 Totalliabilities 160,492 132,368 Net assets 132,915 104,226 EQuITY
CAPITAl AND RESERVES Issued capital 23 37,753 34,502 Reserves 24 8,063 3,227 Retained earnings 25 87,099 66,497 Totalequity 132,915 104,226 notes to the Consolidated Financial Statements are included on pages 54 to 88. F
or p
erso
nal u
se o
nly

52 53
Bl
ac
km
or
es
an
nu
al r
ep
or
t 2
01
5
Bl
ac
km
or
es
an
nu
al r
ep
or
t 2
01
5
consolidated statement of cash flowsFOr the FinAnCiAL yeAr enDeD 30 JUne 2015
consolidated statement of changes in eQuity FOr the FinAnCiAL yeAr enDeD 30 JUne 2015
2015 2014 NOTES $’000 $’000
CASH FlOWS FROM OPERATING ACTIVITIES Receipts from customers 480,780 371,223 Payments to suppliers and employees (390,989) (321,716)Cash generated from operations 89,791 49,507interest and other costs of finance paid (3,847) (5,135)Income taxes paid (14,817) (6,881)Netcashflowsfromoperatingactivities 34.3 71,127 37,491 CASH FlOWS FROM INVESTING ACTIVITIES Interest received 415 309 Payments for property, plant and equipment and other intangible assets (3,625) (4,658)Proceeds from disposal of property, plant and equipment 8 29 Dividends received 11 7 Netcashusedininvestingactivities (3,191) (4,313) CASH FlOWS FROM FINANCING ACTIVITIES Net repayment of borrowings (29,000) (14,000)Repayment of lease liability - (6)Dividends paid (22,703) (18,087)Netcashusedinfinancingactivities (51,703) (32,093) Net increase in cash and cash equivalents 16,233 1,085
Cash and cash equivalents at the beginning of the year 18,599 17,963 effects of exchange rate changes on the balance of cash held in foreign currencies 2,099 (449)Cashandcashequivalentsattheendoftheyear 34.1 36,931 18,599 notes to the Consolidated Financial Statements are included on pages 54 to 88.
Equity-Settled Foreign Employee Cash flow Currency Issued Benefits Hedging Translation Retained Capital Reserve Reserve Reserve Earnings Total
$’000 $’000 $’000 $’000 $’000 $’000
Balance as at 30 June 2013 30,996 5,806 (692) (720) 62,661 98,051 Dividends declared - - - - (21,593) (21,593) profit for the year - - - - 25,429 25,429
gain recognised on cash flow hedges - - 255 - - 255 income tax related to gain on cash flow hedges - - (76) - - (76)Foreign currency translation of controlled entities - - - (1,395) - (1,395)Other comprehensive income for the year, net of tax - - 179 (1,395) - (1,216) Totalcomprehensiveincomefortheyear - - 179 (1,395) 25,429 24,213 issue of shares under Dividend reinvestment plan 3,506 - - - - 3,506 Recognition of share-based payments - 49 - - - 49 Balanceasat30June2014 34,502 5,855 (513) (2,115) 66,497 104,226 Dividends declared - - - - (25,954) (25,954) profit for the year - - - - 46,556 46,556 Loss recognised on cash flow hedges - - (572) - - (572)income tax related to loss on cash flow hedges - - 172 - - 172Foreign currency translation of controlled entities - - - 4,158 - 4,158Other comprehensive income for the year, net of tax - - (400) 4,158 - 3,758 Totalcomprehensiveincomefortheyear - - (400) 4,158 46,556 50,314issue of shares under Dividend reinvestment plan 3,251 - - - - 3,251 Recognition of share-based payments - 1,078 - - - 1,078 Balanceasat30June2015 37,753 6,933 (913) 2,043 87,099 132,915notes to the Consolidated Financial Statements are included on pages 54 to 88.
For
per
sona
l use
onl
y

54 55
Bl
ac
km
or
es
an
nu
al r
ep
or
t 2
01
5
Bl
ac
km
or
es
an
nu
al r
ep
or
t 2
01
5
notesnotes to the financial statementsFOr the FinAnCiAL yeAr enDeD 30 JUne 2015
notes to the financial statementsFOr the FinAnCiAL yeAr enDeD 30 JUne 2015
1 general informationBlackmores Limited (the Company) is a public company listed on the Australian Securities exchange (trading under the symbol ‘BkL’), incorporated in Australia and operating in Australia, Asia and New Zealand.
Blackmores Limited’s registered office and its principal place of business is as follows:
20 Jubilee Avenue
Warriewood NSW 2102
Telephone +61 2 9910 5000
The group’s principal activity is the development, sales and marketing of health products for humans and animals including vitamins, herbal and mineral nutritional supplements.
2 significant accounting policies
2.1 reporting entityBlackmores Limited (the Company) is a company domiciled in Australia. the Consolidated Financial report (Financial report) of Blackmores as at and for the twelve months ended 30 June 2015 comprises Blackmores and its subsidiaries (the group).
the Consolidated Annual Financial report of the group as at and for the year ended 30 June 2014 is available upon request from the registered office of Blackmores at 20 Jubilee Avenue, warriewood, NSW 2102 or online at blackmores.com.au
2.2 statement of compliancethese Financial Statements are general purpose Financial Statements which have been prepared in accordance with the Corporations Act 2001, Accounting Standards and Interpretations and comply with other requirements of the law.
the Financial Statements comprise the Consolidated Financial Statements of the group. For the purposes of preparing the Consolidated Financial Statements, the Company is a for-profit entity.
Accounting Standards include Australian Accounting Standards. Compliance with Australian Accounting Standards ensures that the Financial Statements and notes of the Company and the group comply with international Financial reporting Standards (‘iFrS’).
the Financial Statements were authorised for issue by the Directors on 25 August 2015.
2.3 basis of preparationthe Consolidated Financial Statements have been prepared on the basis of historical cost, except for certain non-current assets and financial instruments that are measured at revalued amounts or fair values, as explained in the following accounting policies. Historical cost is generally based on the fair values of the consideration given in exchange for assets. All amounts are presented in Australian dollars, unless otherwise noted.
The accounting policies and methods of computation in the preparation of the Consolidated Financial Statements are consistent with those adopted and disclosed in the Consolidated Financial Statements for the year ended 30 June 2014, except for the recognition of a portion of research and development tax incentive as government grant revenue in accordance with AASB 120 Accounting for government grants and Disclosure of government Assistance.
The Company is a company of the kind referred to in ASIC Class Order 98/100, dated 10 July 1998, and in accordance with that Class Order amounts in the Financial Statements are rounded off to the nearest thousand dollars, unless otherwise indicated.
2.4 basis of consolidationthe Consolidated Financial Statements incorporate the Financial Statements of the Company and entities (including structured entities) controlled by the Company and its subsidiaries. Control is achieved when the Company:
• has power over the investee;
• is exposed, or has rights, to variable returns from its involvement with the investee; and
• has the ability to use its power to affect its returns.
The Company reassesses whether or not it controls an investee if facts and circumstances indicate that there are changes to one or more of the three elements of control listed above.
where necessary, adjustments are made to the Financial Statements of subsidiaries to bring their accounting policies into line with those used by other members of the group.
All intragroup assets and liabilities, equity, income, expenses and cash flows relating to transactions between members of the group are eliminated in full on consolidation.
2.5 cash and cash eQuivalents Cash is comprised of cash on hand and cash at bank. Cash equivalents are short-term, highly liquid investments that are readily convertible to known amounts of cash, which are subject to an insignificant risk of changes in value and have a maturity of three months or less at the date of acquisition. Bank overdrafts are shown within borrowings in current liabilities in the Consolidated Statement of Financial position.
2.6 financial instrumentsFinancial assets and financial liabilities are recognised when a group entity becomes a party to the contractual provisions of the instrument.
Financial assets and financial liabilities are initially measured at fair value. Transaction costs that are directly attributable to the acquisition or issue of financial assets and financial liabilities (other than financial assets and financial liabilities at fair value through profit or loss) are added to or deducted from the fair value of the financial assets or financial liabilities, as appropriate, on initial recognition. transaction costs directly attributable to the acquisition of financial assets or financial liabilities at fair value through profit or loss are recognised immediately in profit or loss.
2.6.1 Financial AssetsFinancial assets are classified into the following specified categories: financial assets at ‘fair value through profit or loss’ (FvtpL), ‘available-for-sale’ (AFS) financial assets and ‘loans and receivables’. the classification depends on the nature and purpose of the financial assets and is determined at the time of initial recognition. All regular way purchases or sales of financial assets are recognised and derecognised on a trade date basis. Regular way purchases or sales are purchases or sales of financial assets that require delivery of assets within the time frame established by regulation or convention in the marketplace.
2.6.1.1 Effective Interest MethodThe effective interest method is a method of calculating the amortised cost of a debt instrument and of allocating interest income over the relevant period. The effective interest rate is the rate that exactly discounts estimated future cash receipts (including all fees on points paid or received that form an integral part of the effective interest rate, transaction costs and other premiums or discounts) through the expected life of the debt instrument, or (where appropriate) a shorter period, to the net carrying amount on initial recognition.
Income is recognised on an effective interest basis for debt instruments other than those financial assets classified as at FvtpL.
For
per
sona
l use
onl
y

56 57
Bl
ac
km
or
es
an
nu
al r
ep
or
t 2
01
5
Bl
ac
km
or
es
an
nu
al r
ep
or
t 2
01
5
notes to the financial statementsFOr the FinAnCiAL yeAr enDeD 30 JUne 2015
notes to the financial statementsFOr the FinAnCiAL yeAr enDeD 30 JUne 2015
2 significant accounting policies (cont.) 2 significant accounting policies (cont.)
2.6.1.2 Financial Assets at FVTPl Financial assets are classified as at FvtpL when the financial asset is either held for trading or it is designated as at FvtpL.
A financial asset is classified as held for trading if:
• it has been acquired principally for the purpose of selling it in the near term; or
• on initial recognition it is part of a portfolio of identified financial instruments that the group manages together and has a recent actual pattern of short-term profit-taking; or
• it is a derivative that is not designated and effective as a hedging instrument.
A financial asset other than a financial asset held for trading may be designated as at FvtpL upon initial recognition if:
• such designation eliminates or significantly reduces a measurement or recognition inconsistency that would otherwise arise; or
• the financial asset forms part of a group of financial assets or financial liabilities or both, which is managed and its performance is evaluated on a fair value basis, in accordance with the group’s documented risk management or investment strategy, and information about the grouping is provided internally on that basis; or
• it forms part of a contract containing one or more embedded derivatives, and AASB 139 ‘Financial instruments: recognition and measurement’ permits the entire combined contract (asset or liability) to be designated as at FvtpL.
Financial assets at FvtpL are stated at fair value, with any gains or losses arising on remeasurement recognised in profit or loss. the net gain or loss recognised in profit or loss incorporates any dividend or interest earned on the financial asset and is included in the ‘other gains and losses’ line item in the statement of comprehensive income. Fair value is determined in the manner described in note 35.
2.6.1.4 loans and Receivables trade receivables, loans and other receivables that have fixed or determinable payments that are not quoted in an active market are classified as ‘loans and receivables’. Loans and receivables are measured at amortised cost using the effective interest method less impairment. Interest income is recognised by applying the effective interest rate, except for short-term receivables when the recognition of interest would be immaterial.
2.6.2 Financial liabilities and Equity Instruments
2.6.2.1 ClassificationasDebtorEquityDebt and equity instruments are classified as either liabilities or as equity in accordance with the substance of the contractual arrangement.
2.6.2.2 Equity InstrumentsAn equity instrument is any contract that evidences a residual interest in the assets of an entity after deducting all of its liabilities. equity instruments issued by the group are recorded at the proceeds received, net of direct issue costs.
2.6.2.3 Financial liabilitiesFinancial liabilities are classified as either financial liabilities ‘at FvtpL’ or ‘other financial liabilities’.
2.6.2.4 Financial liabilities at FVTPlFinancial liabilities are classified as at FvtpL when the financial liability is either held for trading or it is designated as at FvtpL.
A financial liability is classified as held for trading if:
• it has been acquired principally for the purpose of repurchasing it in the near term; or
• on initial recognition it is part of a portfolio of identified financial instruments that the group manages together and has a recent actual pattern of short-term profit-taking; or
• it is a derivative that is not designated and effective as a hedging instrument.
A financial liability other than a financial liability held for trading may be designated as at FvtpL upon initial recognition if:
• such designation eliminates or significantly reduces a measurement or recognition inconsistency that would otherwise arise; or
• the financial liability forms part of a group of financial assets or financial liabilities or both, which is managed and its performance is evaluated on a fair value basis, in accordance with the group’s documented risk management or investment strategy, and information about the grouping is provided internally on that basis; or
• it forms part of a contract containing one or more embedded derivatives, and AASB 139 ‘Financial instruments: recognition and measurement’ permits the entire combined contract (asset or liability) to be designated as at FvtpL.
Financial liabilities at FvtpL are stated at fair value, with any gains or losses arising on remeasurement recognised in profit or loss. the net gain or loss recognised in profit or loss incorporates any interest paid on the financial liability and is included in the ‘other income’ line item in the Consolidated Statement of profit or Loss and Other Comprehensive income. Fair value is determined in the manner described in note 35.
2.6.2.5 Other Financial liabilitiesOther financial liabilities, including borrowings, are initially measured at fair value, net of transaction costs.
Other financial liabilities are subsequently measured at amortised cost using the effective interest method, with interest expense recognised on an effective yield basis.
The effective interest method is a method of calculating the amortised cost of a financial liability and of allocating interest expense over the relevant period. The effective interest rate is the rate that exactly discounts estimated future cash payments through the expected life of the financial liability, or (where appropriate) a shorter period, to the net carrying amount on initial recognition.
2.6.3 Derivative Financial Instrumentsthe group enters into a variety of derivative financial instruments to manage its exposure to interest rate and foreign exchange rate risk, including forward foreign exchange contracts and interest rate swaps. Further details of derivative financial instruments are disclosed in note 35 to the Consolidated Financial Statements.
Derivatives are initially recognised at fair value on the date a derivative contract is entered into and are subsequently remeasured to their fair value at each reporting date. The resulting gain or loss is recognised in profit or loss immediately unless the derivative is designated and effective as a hedging instrument, in which event, the timing of the recognition in profit or loss depends on the nature of the hedge relationship.
2.6.3.1 Hedge Accounting The group designates certain hedging instruments, which include derivatives and non-derivatives in respect of foreign currency risk, as either fair value hedges, cash flow hedges or hedges of net
investments in foreign operations. Hedges of foreign exchange risk on firm commitments are accounted for as cash flow hedges.
At the inception of the hedge relationship the entity documents the relationship between the hedging instrument and the hedged item, along with its risk management objectives and its strategy for undertaking various hedge transactions. Furthermore, at the inception of the hedge and on an ongoing basis, the group documents whether the hedging instrument is highly effective in offsetting changes in fair values or cash flows of the hedged item attributable to the hedged risk.
Note 35 sets out details of the fair values of the derivative instruments used for hedging purposes. movements in the hedge reserve in equity are also detailed in the Consolidated Statement of Changes in equity.
2.6.3.2 Cash Flow Hedges The effective portion of changes in the fair value of derivatives that are designated and qualify as cash flow hedges is recognised in other comprehensive income and accumulated under the heading of cash flow hedging reserve. the gain or loss relating to the ineffective portion is recognised immediately in profit or loss, and is included in the ‘other gains and losses’ line item.
Amounts previously recognised in other comprehensive income and accumulated in equity are reclassified to profit or loss in the periods when the hedged item is recognised in profit or loss, in the same line of the Consolidated Statement of profit or Loss and Other Comprehensive Income as the recognised hedged item. However, when the hedged forecast transaction results in the recognition of a non-financial asset or a non-financial liability, the gains and losses previously recognised in other comprehensive income and accumulated in equity are transferred from equity and included in the initial measurement of the cost of the non-financial asset or non-financial liability.
Hedge accounting is discontinued when the group revokes the hedging relationship, when the hedging instrument expires or is sold, terminated, or exercised, or when it no longer qualifies for hedge accounting. Any gain or loss recognised in other comprehensive income and accumulated in equity at that time remains in equity and is recognised when the forecast transaction is ultimately recognised in profit or loss. when a forecast transaction is no longer expected to occur, the gain or loss accumulated in equity is recognised immediately in profit or loss.
2.7 inventoriesInventories are stated at the lower of cost and net realisable value. Costs, including an appropriate portion of fixed and variable overhead expenses, are assigned to inventory on hand by the method most appropriate to each particular class of inventory, with the majority being valued on a first-in-first-out basis. net realisable value represents the estimated selling price less all estimated costs of completion and costs necessary to make the sale.
2.8 property, plant and eQuipmentProperty, and associated land, in the course of construction for production or administrative purposes, is carried at cost, less any recognised impairment loss. Cost includes professional fees and, for qualifying assets, borrowing costs capitalised in accordance with the group’s accounting policy. Depreciation of these assets, on the same basis as other property assets, commences when the assets are ready for their intended use.
Plant and equipment and leasehold improvements are measured at cost less accumulated depreciation and impairment. Construction in progress is stated at cost. Cost includes expenditure that is directly attributable to the acquisition or construction of the item.
Depreciation is provided on property, plant and equipment,
including freehold buildings but excluding land. Depreciation is calculated on a straight-line basis so as to write off the net cost of each asset over its expected useful life to its estimated residual value. Leasehold improvements are depreciated over the period of the lease or estimated useful life, whichever is the shorter, using the straight-line method. The estimated useful lives, residual values and depreciation method are reviewed at the end of each annual reporting period, with the effect of any changes recognised on a prospective basis.
An item of property, plant and equipment is derecognised upon disposal or when no future economic benefits are expected to arise from the continued use of the asset. Any gain or loss arising on the disposal or retirement of an item of property, plant and equipment is determined as the difference between the sales proceeds and the carrying amount of the asset and is recognised in profit or loss.
Freehold land is not depreciated. the following estimated useful lives are used in the calculation of depreciation:
• Buildings 25-40 years• Leasehold improvements 3-13 years• plant and equipment 3-20 years
• motor vehicles 4-5 years
2.9 impairment of non-current assetsAt the end of each reporting period, the group reviews the carrying amounts of its tangible and intangible assets to determine whether there is any indication that those assets have suffered an impairment loss. If any such indication exists, the recoverable amount of the asset is estimated in order to determine the extent of the impairment loss (if any). Where it is not possible to estimate the recoverable amount of an individual asset, the group estimates the recoverable amount of the cash-generating unit to which the asset belongs. Where a reasonable and consistent basis of allocation can be identified, corporate assets are also allocated to individual cash-generating units, or otherwise they are allocated to the smallest group of cash-generating units for which a reasonable and consistent allocation basis can be identified.
Recoverable amount is the higher of fair value less costs to sell and value in use. in assessing value in use, the estimated future cash flows are discounted to their present value using a pre-tax discount rate that reflects current market assessments of the time value of money and the risks specific to the asset for which the estimates of future cash flows have not been adjusted.
If the recoverable amount of an asset (or cash-generating unit) is estimated to be less than its carrying amount, the carrying amount of the asset (cash-generating unit) is reduced to its recoverable amount. An impairment loss is recognised immediately in profit or loss.
Where an impairment loss subsequently reverses, the carrying amount of the asset (other than goodwill) (or cash generating unit) is increased to the revised estimate of its recoverable amount, but so that the increased carrying amount does not exceed the carrying amount that would have been determined had no impairment loss been recognised for the asset (or cash-generating unit) in prior years. A reversal of an impairment loss is recognised immediately in profit or loss.
2.10 borrowing costsBorrowing costs directly attributable to the acquisition, construction or production of qualifying assets, which are assets that necessarily take a substantial period of time to get ready for their intended use or sale, are added to the cost of those assets, until such time as the assets are substantially ready for their intended use or sale.
investment income earned on the temporary investment of specific borrowings pending their expenditure on qualifying assets is deducted from the borrowing costs eligible for capitalisation.
For
per
sona
l use
onl
y

58 59
Bl
ac
km
or
es
an
nu
al r
ep
or
t 2
01
5
Bl
ac
km
or
es
an
nu
al r
ep
or
t 2
01
5
notes to the financial statementsFOr the FinAnCiAL yeAr enDeD 30 JUne 2015
notes to the financial statementsFOr the FinAnCiAL yeAr enDeD 30 JUne 2015
2 significant accounting policies (cont.) 2.16 share-based paymentsequity-settled share-based payments to employees and others providing similar services are measured at the fair value of the equity instrument at the grant date. Fair value is measured by use of a binomial model. The expected life used in the model has been adjusted, based on management’s best estimate, for the effects of non-transferability, exercise restrictions and behavioural considerations.
The fair value determined at the grant date of the equity-settled share-based payments is expensed on a straight-line basis over the vesting and holding lock periods, based on the group’s estimate of equity instruments that will eventually vest with a corresponding increase in equity. At the end of each reporting period, the group revises its estimate of the number of equity instruments expected to vest. The impact of the revision of the original estimates, if any, is recognised in profit or loss over the remaining vesting period, with corresponding adjustment to the equity-settled employee benefits reserve.
For cash-settled share-based payments, a liability is recognised for the goods or services acquired, measured initially at the fair value of the liability. At the end of each reporting period until the liability is settled, and at the date of settlement, the fair value of the liability is remeasured, with any changes in fair value recognised in profit or loss for the year.
2.17 goods and service taxRevenues, expenses and assets are recognised net of the amount of goods and services tax (gST), except:
• where the amount of gSt incurred is not recoverable from the taxation authority, it is recognised as part of the cost of acquisition of an asset or as part of an item of expense; or
• for receivables and payables which are recognised inclusive of gST.
The net amount of gST recoverable from, or payable to, the taxation authority is included as part of receivables or payables.
Cash flows are included in the Consolidated Statement of Cash Flows on a gross basis. the gSt component of cash flows arising from investing and financing activities which is recoverable from, or payable to, the taxation authority is classified within operating cash flows.
2.18 taxationIncome tax expense represents the sum of the tax currently payable and the movement in deferred tax.
2.18.1 Current Taxthe tax currently payable is based on taxable profit for the year. taxable profit differs from profit for the year as reported in the Consolidated Statement of profit or Loss and Other Comprehensive Income because of items of income or expense that is taxable or deductible in other years and items that are never taxable or deductible. The group’s liability for current tax is calculated using tax rates that have been enacted or substantively enacted by the end of the reporting period.
2.18.2 Deferred TaxDeferred tax is recognised on temporary differences between the carrying amounts of assets and liabilities in the Consolidated Financial Statements and the corresponding tax bases used in the computation of taxable profit. Deferred tax liabilities are generally recognised for all taxable temporary differences. Deferred tax assets are generally recognised for all deductible temporary differences to the extent that it is probable that taxable profits will be available against which those deductible temporary differences can be
utilised. Such deferred tax assets and liabilities are not recognised if the temporary difference arises from goodwill or from the initial recognition (other than in a business combination) of other assets and liabilities in a transaction that affects neither the taxable profit nor the accounting profit.
Deferred tax liabilities are recognised for taxable temporary differences associated with investments in subsidiaries and associates, and interests in joint ventures, except where the group is able to control the reversal of the temporary difference and it is probable that the temporary difference will not reverse in the foreseeable future. Deferred tax assets arising from deductible temporary differences associated with such investments and interests are only recognised to the extent that it is probable that there will be sufficient taxable profits against which to utilise the benefits of the temporary differences and they are expected to reverse in the foreseeable future.
The carrying amount of deferred tax assets is reviewed at the end of each reporting period and reduced to the extent that it is no longer probable that sufficient taxable profits will be available to allow all or part of the asset to be recovered.
Deferred tax assets and liabilities are measured at the tax rates that are expected to apply in the period in which the liability is settled or the asset realised, based on tax rates (and tax laws) that have been enacted or substantively enacted by the end of the reporting period. the measurement of deferred tax liabilities and assets reflects the tax consequences that would follow from the manner in which the group expects, at the end of the reporting period, to recover or settle the carrying amount of its assets and liabilities.
Deferred tax assets and liabilities are offset when there is a legally enforceable right to set off current tax assets against current tax liabilities and when they relate to income taxes levied by the same taxation authority and the group intends to settle its current tax assets and liabilities on a net basis.
2.18.3 Current and Deferred Tax for the Year Current and deferred tax are recognised in profit or loss, except when they relate to items that are recognised in other comprehensive income or directly in equity, in which case the current and deferred tax are also recognised in other comprehensive income or directly in equity, respectively. Where current tax or deferred tax arises from the initial accounting for a business combination, the tax effect is included in the accounting for the business combination.
2.19 investment property investment property, which is property held to earn rentals and/or for capital appreciation is measured initially at its cost, including transaction costs. Subsequent to initial recognition, investment property will continue to be measured on a cost basis. Investment property will be depreciated where applicable.
Depreciation is provided on investment property, including freehold buildings but excluding land. Depreciation is calculated on a straight-line basis so as to write off the net cost of each asset over its expected useful life to its estimated residual value. The estimated useful lives, residual values and depreciation method are reviewed at the end of each annual reporting period, with the effect of any changes recognised on a prospective basis.
An investment property is derecognised upon disposal or when the investment property is permanently withdrawn from use and no future economic benefits are expected from the disposal. Any gain or loss arising on derecognition of the property (calculated as the difference between the net disposal proceeds and the carrying amount of the asset) is included in profit or loss in the period in which the property is derecognised.
2 significant accounting policies (cont.)
All other borrowing costs are recognised in profit or loss in the period in which they are incurred.
2.11 leasingLeases are classified as finance leases whenever the terms of the lease transfer substantially all the risks and rewards of ownership to the lessee. All other leases are classified as operating leases.
2.11.1 The Group as lesseeOperating lease payments are recognised as an expense on a straight-line basis over the lease term, except where another systematic basis is more representative of the time pattern in which economic benefits from the leased asset are consumed. Contingent rentals arising under operating leases are recognised as an expense in the period in which they are incurred.
2.12 provisionsProvisions are recognised when the group has a present obligation (legal or constructive) as a result of a past event, it is probable that the group will be required to settle the obligation, and a reliable estimate can be made of the amount of the obligation.
The amount recognised as a provision is the best estimate of the consideration required to settle the present obligation at the end of the reporting period, taking into account the risks and uncertainties surrounding the obligation. Where a provision is measured using the cash flows estimated to settle the present obligation, its carrying amount is the present value of those cash flows (where the effect of the time value of money is material).
when some or all of the economic benefits required to settle a provision are expected to be recovered from a third party, the receivable is recognised as an asset if it is virtually certain that reimbursement will be received and the amount of the receivable can be measured reliably.
2.12.1 Onerous ContractsPresent obligations arising under onerous contracts are recognised and measured as provisions. An onerous contract is considered to exist where the group has a contract under which the unavoidable cost of meeting the obligations under the contract exceeds the economic benefits estimated to be received from the contract.
2.13 employee benefitsA liability is recognised for benefits accruing to employees in respect of wages and salaries, annual leave and long service leave when it is probable that settlement will be required and they are capable of being measured reliably.
Liabilities recognised in respect of short-term employee benefits are measured at their nominal values using the remuneration rate expected to apply at the time of settlement.
Liabilities recognised in respect of long-term employee benefits are measured as the present value of the estimated future cash outflows to be made by the group in respect of services provided by employees up to reporting date.
2.14 revenue recognitionRevenue is measured at the fair value of the consideration received or receivable. Revenue is reduced for estimated customer returns.
2.14.1 Sale of GoodsRevenue from the sale of goods is recognised when all the following conditions are satisfied:
• the group has transferred to the buyer the significant risks and rewards of ownership of the goods;
• the group retains neither continuing managerial involvement
to the degree usually associated with ownership nor effective control over the goods sold;
• the amount of the revenue can be measured reliably;
• it is probable that the economic benefits associated with the transaction will flow to the group; and
• the costs incurred or expected to be incurred in respect of the transaction can be measured reliably.
Specifically, revenue from the sale of goods is recognised when goods are delivered and legal title is passed.
2.14.2 Dividend and Interest IncomeDividend income from investments is recognised when the group’s right to receive payment has been established (provided that it is probable that the economic benefits will flow to the group and the amount of income can be measured reliably).
interest income from a financial asset is recognised when it is probable that the economic benefits will flow to the group and the amount of revenue can be measured reliably. Interest income is accrued on a time basis, by reference to the principal outstanding and at the effective interest rate applicable, which is the rate that exactly discounts estimated future cash receipts through the expected life of the financial asset to that asset’s net carrying amount on initial recognition.
2.14.3 Government Grantsgovernment grants are not recognised until there is reasonable assurance that the group will comply with the conditions attaching to them and that the grants will be received. government grants are recognised in profit or loss on a systematic basis over the periods in which the group recognises as expenses the related costs for which the grants are intended to compensate.
2.15 foreign currencies
2.15.1 Individual Controlled Entitiesthe individual Financial Statements of each group entity are presented in the currency of the primary economic environment in which the entity operates (its functional currency). For the purpose of the Consolidated Financial Statements, the financial results and financial position of each group entity are expressed in Australian Dollars (‘$’), which is the functional currency of the Company, and the presentation currency for the Consolidated Financial Statements.
2.15.2 Foreign Currency Transactionsin preparing the Financial Statements of the individual entities, transactions in currencies other than the entity’s functional currency (foreign currencies) are recognised at the rates of exchange prevailing on the dates of the transactions. At the end of each reporting period, monetary items denominated in foreign currencies are retranslated at the rates prevailing at that date. Non-monetary items carried at fair value that are denominated in foreign currencies are retranslated at the rates prevailing on the date when the fair value was determined. Non-monetary items that are measured in terms of historical cost in a foreign currency are not retranslated.
2.15.3 Foreign OperationsFor the purpose of presenting Consolidated Financial Statements, the assets and liabilities of the group’s foreign operations are translated at exchange rates prevailing at the end of the reporting period. Income and expense items are translated at the average exchange rates for the period, unless exchange rates fluctuate significantly, in which case the exchange rates at the dates of the transactions are used. exchange differences arising, if any, are recognised in other comprehensive income and accumulated in equity (attributed to non-controlling interests as appropriate).
For
per
sona
l use
onl
y

60 61
Bl
ac
km
or
es
an
nu
al r
ep
or
t 2
01
5
Bl
ac
km
or
es
an
nu
al r
ep
or
t 2
01
5
2 significant accounting policies (cont.) 3 application of new and revised accounting standards2.20 intangible assets
2.20.1 Intangible Assets Acquired Separately intangible assets with finite lives acquired separately are carried at cost less accumulated amortisation and accumulated impairment losses. Amortisation is recognised on a straight-line basis over their estimated useful lives. The estimated useful life and amortisation method are reviewed at the end of each reporting period, with the effect of any changes in estimate being accounted for on a prospective basis. intangible assets with indefinite useful lives that are acquired separately are carried at cost less accumulated impairment losses.
2.20.2 Internally-generated Intangible Assets
2.20.2.1 Research and Development Expenditure expenditure on research activities is recognised as an expense in the period in which it is incurred.
An internally-generated intangible asset arising from development (or from the development phase of an internal project) is recognised if, and only if, all of the following have been demonstrated:
• the technical feasibility of completing the intangible asset so that it will be available for use or sale;
• the intention to complete the intangible asset and use or sell it;
• the ability to use or sell the intangible asset;
• how the intangible asset will generate probable future economic benefits;
• the availability of adequate technical, financial and other resources to complete the development and to use or sell the intangible asset; and
• the ability to measure reliably the expenditure attributable to the intangible asset during its development.
Subsequent to initial recognition, internally-generated intangible assets are reported at cost less accumulated amortisation and accumulated impairment losses, on the same basis as intangible assets that are acquired separately.
Brand names recognised by the Company have an indefinite useful life and are not amortised. each period, the useful life of this asset is reviewed to determine whether events and circumstances continue to support an indefinite useful life assessment for the asset. Such assets are tested for impairment in accordance with the policy stated in note 2.9.
2.20.2.2 Website Development Expenditure Website development expenditure is recognised as an intangible asset to the extent that the above recognition criteria is met and the website will generate probable future economic benefits. Otherwise, it is expensed as incurred.
2.20.3 Intangible Assets Acquired in a Business Combination Intangible assets acquired in a business combination and recognised separately from goodwill are initially recognised at their fair value at the acquisition date (which is regarded as their cost).
Subsequent to initial recognition, intangible assets acquired in a business combination are reported at cost less accumulated amortisation and accumulated impairment losses, on the same basis as intangible assets that are acquired separately.
2.20.4 Derecognition of Intangible Assets An intangible asset is derecognised on disposal, or when no future economic benefits are expected from use or disposal. gains or losses arising from derecognition of an intangible asset, measured as
the difference between the net disposal proceeds and the carrying amount of the asset are recognised in profit or loss when the asset is derecognised.
2.21 business combinations Acquisitions of businesses are accounted for using the acquisition method. The consideration transferred in a business combination is measured at fair value which is calculated as the sum of the acquisition-date fair values of assets transferred by the group, liabilities incurred by the group to the former owners of the acquiree and the equity instruments issued by the group in exchange for control of the acquiree. Acquisition-related costs are recognised in profit or loss as incurred.
goodwill is measured as the excess of the sum of the consideration transferred over the net of the acquisition-date amounts of the identifiable assets acquired and the liabilities assumed. if, after reassessment, the net of the acquisition-date amounts of the identifiable assets acquired and liabilities assumed exceeds the sum of the consideration transferred, the amount of any non-controlling interests in the acquiree and the fair value of the acquirer’s previously held interest in the acquiree (if any), the excess is recognised immediately in profit or loss as a bargain purchase gain.
Where the consideration transferred by the group in a business combination includes assets or liabilities resulting from a contingent consideration arrangement, the contingent consideration is measured at its acquisition-date fair value, with corresponding adjustments against goodwill. measurement period adjustments are adjustments that arise from additional information obtained during the ‘measurement period’ (which cannot exceed one year from the acquisition date) about facts and circumstances that existed at the acquisition date.
The subsequent accounting for changes in the fair value of contingent consideration that do not qualify as measurement period adjustments depends on how the contingent consideration is classified. Contingent consideration that is classified as equity is not remeasured at subsequent reporting dates and its subsequent settlement is accounted for within equity. Contingent consideration that is classified as an asset or liability is remeasured at subsequent reporting dates in accordance with AASB 139, or AASB 137 ‘Provisions, Contingent Liabilities and Contingent Assets’, as appropriate, with the corresponding gain or loss being recognised in profit or loss.
2.22 goodwillgoodwill arising on an acquisition of a business is carried at cost as established at the date of the acquisition of the business (see note 2.21 above) less accumulated impairment losses, if any.
For the purposes of impairment testing, goodwill is allocated to each of the group’s cash-generating units (or groups of cash-generating units) that is expected to benefit from the synergies of the combination.
A cash-generating unit to which goodwill has been allocated is tested for impairment annually, or more frequently when there is indication that the unit may be impaired. If the recoverable amount of the cash-generating unit is less than its carrying amount, the impairment loss is allocated first to reduce the carrying amount of any goodwill allocated to the unit and then to the other assets of the unit pro rata based on the carrying amount of each asset in the unit.
3.1 standards and interpretations affecting amounts reported in the current period (and/or prior periods)
Standardsaffectingpresentationanddisclosure
there are no new and/or revised Standards and interpretations adopted in these Financial Statements affecting presentation or disclosure.
StandardsandInterpretationsaffectingthereportedresultsorfinancialposition
there are no new and revised Standards and interpretations adopted in these Financial Statements affecting the reported results or financial position.
3.2 standards and interpretations adopted with no effect on the financial statementsthe following new and revised Standards and interpretations have been adopted in these Financial Statements. their adoption has not had any significant impact on the amounts reported in these Financial Statements but may affect the accounting for future transactions or arrangements.
Standard/Interpretation
AASB 2012-3 ‘Amendments to Australian Accounting Standards – Offsetting Financial Assets and Financial Liabilities’
AASB 2013-3 ‘Amendments to AASB 136 – recoverable Amount Disclosures for non-Financial Assets’
AASB 2013-4 ‘Amendments to Australian Accounting Standards – novation of Derivatives and Continuation of hedge Accounting’
AASB 2014-1 ‘Amendments to Australian Accounting Standards’ (part A: Annual improvements 2010–2012 and 2011–2013 Cycles)
Interpretation 21 ‘Levies’
AASB 1031 ‘materiality’, AASB 2013-9 ‘Amendments to Australian Accounting Standards’ – Conceptual Framework, materiality and Financial instruments’ (part B: materiality), AASB 2014-1 ‘Amendments to Australian Accounting Standards’ (part C: materiality)
notes to the financial statementsFOr the FinAnCiAL yeAr enDeD 30 JUne 2015
notes to the financial statementsFOr the FinAnCiAL yeAr enDeD 30 JUne 2015
Standard/Interpretation Effectiveforannualperiodsbeginningonorafter
Expectedtobeinitiallyappliedinthefinancialyearending
AASB 9 ‘Financial instruments’ and the relevant amending standards 1 January 2018 30 June 2019
AASB 15 ‘Revenue from Contracts with Customers’ and AASB 2014-5 ‘Amendments to Australian Accounting Standards arising from AASB 15’
1 January 2018 30 June 2019
AASB 2014-3 ‘Amendments to Australian Accounting Standards – Accounting for Acquisitions of interests in Joint Operations’
1 January 2016 30 June 2017
AASB 2014-4 ‘Amendments to Australian Accounting Standards – Clarification of Acceptable methods of Depreciation and Amortisation’
1 January 2016 30 June 2017
AASB 2014-9 ‘Amendments to Australian Accounting Standards – equity method in Separate Financial Statements’
1 January 2016 30 June 2017
AASB 2014-10 ‘Amendments to Australian Accounting Standards – Sale or Contribution of Assets between an investor and its Associate or Joint venture’
1 January 2016 30 June 2017
AASB 2015-1 ‘Amendments to Australian Accounting Standards – Annual improvements to Australian Accounting Standards 2012-2014 Cycle’
1 January 2016 30 June 2017
AASB 2015-2 ‘Amendments to Australian Accounting Standards – Disclosure initiative: Amendments to AASB 101’
1 January 2016 30 June 2017
AASB 2015-3 ‘Amendments to Australian Accounting Standards arising from the Withdrawal of AASB 1031 materiality’
1 January 2016 30 June 2017
3.3 standards and interpretations in issue, not yet adoptedAt the date of authorisation of the Financial Statements, a number of Standards and interpretations were on issue but not yet effective. in the Directors’ opinion, the following Standards on issue but not yet effective are most likely to impact the amounts reported by the group in future financial periods:
For
per
sona
l use
onl
y

62 63
Bl
ac
km
or
es
an
nu
al r
ep
or
t 2
01
5
Bl
ac
km
or
es
an
nu
al r
ep
or
t 2
01
5
3 application of new and revised accounting standards (cont.)
notes to the financial statementsFOr the FinAnCiAL yeAr enDeD 30 JUne 2015
AASB 9 introduces new requirements for the classification and measurement of financial assets, hedge accounting and impairment of financial assets. the Directors do not anticipate that the application of AASB 9 will have a material impact on the financial results of the group.
AASB 15 Revenue from Contracts with Customers outlines a single comprehensive model for entities to use in accounting for revenue from contracts with customers, which will supersede current revenue recognition guidance included in AASB 118 Revenue, AASB 111 Construction Contracts and related Interpretations. The key principle of this standard is that an entity will recognise revenue when it transfers promised goods or services to customers for an amount that reflects its expected consideration. the Standard introduces more prescriptive and detailed guidance than was included in AASB 118, AASB 111 and the related interpretations. the Directors are assessing the impact of the application of AASB 15.
4 critical accounting Judgements and key sources of estimation uncertainty
In the application of the accounting policies, which are described in note 2, management is required to make judgements, estimates and assumptions about the carrying amounts of assets and liabilities that are not readily apparent from other sources. The estimates and associated assumptions are based on historical experience and other factors that are considered to be relevant. Actual results may differ from these estimates.
The estimates and underlying assumptions are reviewed on an ongoing basis. Revisions to accounting estimates are recognised in the period in which the estimate is revised if the revision affects only that period or in the period of the revision and future periods if the revision affects both current and future periods.
4.1 inventoryinventories are stated at the lower of cost and net realisable value. the Directors assess slow moving or obsolete inventory on a regular basis and a provision is raised to write down inventory to net realisable value as described in note 2.7.
4.2 impairment of goodwill Determining whether goodwill is impaired requires an estimation of the value in use of the cash generating unit to which goodwill has been allocated. the value in use calculation requires the directors to estimate the future cash flows expected to arise from the cash-generating unit and a suitable discount rate in order to calculate present value.
the carrying amount of goodwill at 30 June 2015 was $16,863 thousand (30 June 2014: $16,863 thousand).
4.3 impairment of non-current assetsthe Directors considered the recoverability of the group’s non-current assets, including property, plant and equipment and other intangible assets. Based on the group’s performance, there are no indicators of impairment for non-current assets.
4.4 useful lives of property plant eQuipmentAs described in note 2.8, the group reviews the useful lives of property, plant and equipment at the end of each financial year. No changes were made during the current year.
notes to the financial statementsFOr the FinAnCiAL yeAr enDeD 30 JUne 2015
5 revenue
2015 2014 $’000 $’000
Revenue from continuing operations consisted of the following: Revenue from sale of goods 471,615 346,760
6 other income
Dividends received 11 7 government grant1 897 - 908 7 1. in the current financial year, the group applied AASB 120 Accounting for government grants and disclosure of government assistance in relation to the research
and development tax incentive received by the group. prior year disclosures have not been restated as the impact on the Financial report is not material.
7 profit for the year
profit for the year has been arrived at after charging: Interest expense: Interest on bank loans 1,965 2,504 Net settlement of interest rate swap 389 638 Bank margin activation and undrawn facility fees 1,493 1,993 Total interest expense 3,847 5,135 Depreciation of non-current assets 5,954 5,760 Amortisation of non-current assets 437 506 Total depreciation and amortisation expense 6,391 6,266 Operating lease minimum lease payments 3,519 3,163 Research and development costs expensed as incurred 8,972 9,162 employee benefits expense
post-employment benefits: Defined contribution plans 4,850 4,120 Share-based payments: equity-settled share-based payments 1,078 49 Other employee benefits 88,425 65,987 94,353 70,156 Provision for inventory obsolescence 2,734 2,890 net foreign exchange (gains)/losses (835) 192 Loss on disposal of non-current assets 14 6
3.3 standards and interpretations in issue, not yet adopted (cont.)
For
per
sona
l use
onl
y

64 65
Bl
ac
km
or
es
an
nu
al r
ep
or
t 2
01
5
Bl
ac
km
or
es
an
nu
al r
ep
or
t 2
01
5
notes to the financial statementsFOr the FinAnCiAL yeAr enDeD 30 JUne 2015
notes to the financial statementsFOr the FinAnCiAL yeAr enDeD 30 JUne 2015
8 segment informationinformation reported to the group’s Chief Operating Decision maker for the purposes of resource allocation and assessment of segment performance is largely focused on geographical regions. Our larger Asian markets - Thailand and malaysia, are presented as separate segments with the remainder of the Asian markets aggregated as the ‘Other Asia’ segment. The group’s reportable segments under AASB 8 are therefore as follows:
Australia BioCeuticals Thailand malaysia Other Asia Other Corporate Costs
the principal activity of each segment is the development and/or marketing of health products including vitamins, herbal and mineral nutritional supplements.
The accounting policies of the reportable segments are the same as the group’s accounting policies.
segment revenues The following is an analysis of the group’s revenue from continuing operations by reportable segment.
2015 2014 $’000 $’000
Australia1 317,423 221,485 BioCeuticals 55,531 47,153 Thailand 29,102 31,291 malaysia 23,030 20,290 Other Asia2 31,819 15,057 Other3 15,483 13,069 eliminations (773) (1,585)TotalSegmentRevenue4 471,615 346,760
The group had two customers who contributed more than 10% of the group’s revenue in the year. Included in external sales of the Australian segment of $317,423 thousand (2014: $221,485 thousand) are sales of $123,507 thousand (2014: $72,898 thousand) and $45,566 thousand (2014: $37,425 thousand) which arose from sales to the group’s two largest customers. 1. Australia segment revenue for the year ended 30 June 2015 includes the benefit of sales made to Australian customers which we believe are ultimately intended for Asian markets. 2. Other Asia comprises the markets of Singapore, hong kong, taiwan, korea, China, kazakhstan and Cambodia. 3. Other comprises the New Zealand and the PAW businesses. 4. excludes interest revenue and other income.
segment results The following is an analysis of the group’s eBIT results from continuing operations by reportable segment.
2015 2014 $’000 $’000
Australia 64,272 34,097 BioCeuticals 8,672 6,809 Thailand 6,281 8,626 malaysia 3,336 2,743 Other Asia (1,291) (6,790) Other (282) (1,279) Corporate Costs (8,724) (4,417) Earningsbeforeinterestandtax 72,264 39,789
Segment profit represents eBit earned by each segment. this is the measure reported to the Chief Operation Decision maker for the purposes of resource allocation and assessment of segment performance.
9 income taxes
9.1 income tax recognised in profit or loss
2015 2014 $’000 $’000
Current tax: Current tax expense in respect of the current year 25,021 10,620 Adjustments recognised in the current year in relation to the current tax of prior years (221) (878) Deferredtax: Deferred tax benefit relating to the origination and reversal of temporary differences (2,842) (749) Adjustments recognised in the current year in relation to the deferred tax of prior years 318 541Total income tax expense recognised in the current year relating to continuing operations 22,276 9,534 the prima facie income tax expense on pre-tax accounting profit reconciles to the income tax expense in the Consolidated Financial Statements as follows: Profitbeforetax 68,832 34,963 Incometaxexpensecalculatedat30% 20,650 10,489 effect of expenses that are not deductible in determining taxable profit 364 104 effect of tax concessions (321) (916) effect of withholding tax on intercompany dividend 1,323 292 effect of tax losses recognised (164) (21) effect of tax losses not recognised 1,100 193 Rate differential on overseas operations (773) - Other items - (270) 22,179 9,871 Over provision of income tax in previous year 97 (337) Incometaxexpenserecognisedinprofitorloss 22,276 9,534
The tax rate used for the 2015 and 2014 reconciliations above is the corporate tax rate of 30% payable by Australian corporate entities on taxable profits under Australian tax law.
For
per
sona
l use
onl
y

66 67
Bl
ac
km
or
es
an
nu
al r
ep
or
t 2
01
5
Bl
ac
km
or
es
an
nu
al r
ep
or
t 2
01
5
notes to the financial statementsFOr the FinAnCiAL yeAr enDeD 30 JUne 2015
notes to the financial statementsFOr the FinAnCiAL yeAr enDeD 30 JUne 2015
9 income taxes (cont.)
9.2 deferred tax balances Deferred tax assets arise from the following:
RECOGNISED RECOGNISED IN OTHER OPENING IN PROFIT COMPREHENSIvE CLOSING BALANCE OR LOSS INCOME BALANCE
$’000 $’000 $’000 $’000
Temporary differences 2015 Property, plant and equipment 47 (57) - (10)Prepayments and other (143) 29 - (114)Provisions 2,369 2,210 - 4,579Accruals 235 1,798 - 2,033Cash flow hedges 221 - 172 393Website development 65 (7) - 58Foreign currency monetary items (90) (385) - (475)Capitalised expenses 509 (477) - 32Tax losses recognised 138 (126) - 12Other 464 (461) - 3 3,815 2,524 172 6,511 presented in the Consolidated Statement of Financial position as follows: Deferred tax asset 6,713 Deferred tax liability (202) 6,511 Temporary differences 2014 Property, plant and equipment (129) 176 - 47 Prepayments and other (181) 38 - (143)Provisions 2,945 (576) - 2,369 Accruals 130 105 - 235 Cash flow hedges 297 - (76) 221 Website development 78 (13) - 65 Foreign currency monetary items (128) 38 - (90)Capitalised expenses 255 254 - 509 Tax losses recognised 246 (108) - 138 Other 170 294 - 464 3,683 208 (76) 3,815 presented in the Consolidated Statement of Financial position as follows: Deferred tax asset 3,815 Deferred tax liability - 3,815
unrecognised deferred tax assets
2015 2014 $’000 $’000
The following deferred tax assets have not been brought to account as assets: Tax losses - capital (no expiry date) 1,230 1,230 Tax losses - revenue (expiry: 2015) 1 1 Tax losses - revenue (expiry: 2017) 1 67 Tax losses - revenue (expiry: 2018) 34 34 Tax losses - revenue (expiry: 2019) 102 57 Tax losses - revenue (expiry: 2020) 444 102 Tax losses - revenue (expiry: 2021) 144 124
10 key management personnel compensation the aggregate compensation made to key management personnel of the group and the Company is set out below:
2015 2014 $’000 $’000
Short-term employee benefits 6,495,092 4,177,547 post-employment benefits 219,720 244,635 Other long-term benefits 36,254 65,122 Share-based payments 736,784 - 7,487,850 4,487,304
the compensation of each member of the key management personnel of the group and a discussion of the compensation policies of the Company are detailed in the Directors’ report and remuneration report which accompany these Consolidated Financial Statements.
11 share-based payments Executive and Employee Share Option Plan The executive Performance Share Plan was approved at Blackmores’ Annual general meeting in October 2014. Participation is open to Senior executives determined to be eligible by the Board. Under this plan, rights to acquire shares in the Company are granted annually to eligible Senior executives at no cost and vest provided specific performance hurdles are met.
the fair value of rights granted is calculated in accordance with AASB 2 ‘Share-based payments’. Under the Company executive performance Share plan, during the year the Company granted entitlements to an allocation of ordinary shares provided specific performance objectives and hurdles are met over the three year period commencing 1 July 2014 to the year ending 30 June 2017. if the performance and employment vesting conditions are met, the minimum number of rights that could be vested under the entitlement is 19,553 ( 2014: 19,211) and the maximum number of rights that could be vested is 117,326 (2014: 76,841). Several grant dates applied to these rights; as a result the following fair values applied to the number of rights listed below.
The following share-based payment arrangements were in existence during the current and prior reporting periods:
SHARE RIGHTS SERIES NUMBER GRANT EXPIRY EXERCISE FAIR vALUE AT OF RIGHTS DATE DATE PRICE GRANT DATE
GRANTS IN THE 2015 YEAR $
granted 7 november 2014 111,387 7 nov 2014 30 June 2017 n/A 25.22 granted 10 December 2014 5,143 10 Dec 2014 30 June 2017 n/A 28.92granted 20 April 2015 796 20 Apr 2015 30 June 2017 n/A 52.44
GRANTS IN THE 2014 YEAR $
granted 19 november 2013 75,014 19 nov 2013 30 June 2014 n/A 19.27 granted 3 march 2014 1,827 3 mar 2014 30 June 2014 n/A 22.87
The following reconciles the share-based arrangements outstanding at the beginning and end of the year:
2015 2014
WEIGHTED WEIGHTED AvERAGE AvERAGE NUMBER EXERCISE NUMBER EXERCISE OF RIGHTS PRICE OF RIGHTS PRICE
Balance at the beginning of the year - - - - granted during the year 117,326 - 76,841 -Forfeited during the year - - (76,841) -exercised during the year - N/A - n/Aexpired during the year - - - - Balance at the end of the year 117,326 - - -
exercisable at the end of the year - - - -
The allocation is based on a percentage of the Senior executive’s and Senior manager’s base remuneration and the allocation varies depending on the actual ePS growth delivered for the relevant year as follows:
Share rights are vested as at 30 June 2015 and shares are subsequently issued in September following audit clearance of the group’s result and Board approval. the issue price for share rights granted in the 2015 financial year will be determined in September 2015.
For
per
sona
l use
onl
y

68 69
Bl
ac
km
or
es
an
nu
al r
ep
or
t 2
01
5
Bl
ac
km
or
es
an
nu
al r
ep
or
t 2
01
5
notes to the financial statementsFOr the FinAnCiAL yeAr enDeD 30 JUne 2015
notes to the financial statementsFOr the FinAnCiAL yeAr enDeD 30 JUne 2015
12 remuneration of auditor
2015 2014 $’000 $’000
Auditor of the Parent Entity Auditing or reviewing the Financial Statements 280,160 279,201 Taxation services 110,000 - Other non-audit services1 45,500 14,100 435,660 293,301 Network Firm of the Parent Company Auditor Auditing the Financial Statements 224,884 130,826 Taxation services 88,813 70,430 313,697 201,256 the auditor of Blackmores Limited is Deloitte touche tohmatsu.
1. Other non-audit services is comprised of fees in relation to the provision of accounting advice and consulting fees.
13 trade and other receivables
2015 2014 $’000 $’000
Current Current trade and other receivables1 107,355 71,329 Allowance for doubtful debts (169) (688) Allowance for claims (927) (800) 106,259 69,841 goods and services tax (gST) recoverable 615 723 Other receivables 202 3 107,076 70,567 1. The average credit period on sale of goods is 60 days from the end of the month of invoice. No interest is charged on trade receivables and the group does not hold any collateral over these balances. Trade
receivables consist of a large number of customers spread across several retail channels and geographic regions.
At 30 June 2015, the group had 3 customers (2014: 5 customers) each comprising amounts greater than 5% of the total trade receivables. These customers owed the group more than $52,000 thousand (2014: $44,000 thousand) each and accounted for approximately 49% (2014: 65%) of all receivables owing.
2015 2014 $’000 $’000
Ageing of Past Due But Not Impaired 0 - 30 days past due date 17,912 9,849 31 - 60 days past due date 827 717 61 - 90 days past due date 651 166 > 90 days past due date 710 900 Total 20,100 11,632
An allowance has been made for estimated irrecoverable trade receivable amounts arising from the past sale of goods, determined by reference to past default experience. In determining the recoverability of a trade receivable, the group considers any change in the credit quality of the trade receivable from the date credit was initially granted up to the reporting date. The group manages credit risk with regular review of the balances outstanding and restrictive action is taken where necessary.
11 share-based payments (cont.) 2015
RATE OF EPS GROWTH PERCENTAGE OF PARTICIPANT’S BASE REMUNERATION
OTHER SENIOR CHIEF EXECUTIvE SENIOR COMPANY OFFICER EXECUTIvES MANAGEMENT
3.90% 25.0 10.0 5.0 3.9% to 7.8% prorata between 25.0 to 50.0 10.0 to 20.0 5.0 to 10.07.80% 50.0 20.0 10.0 7.8% to 17.9% prorata between 50.0 to 150.0 20.0 to 60.0 10.0 to 30.017.90% 150.0 60.0 30.0 greater than 17.9% 150.0 60.0 30.0
2014
RATE OF EPS GROWTH PERCENTAGE OF PARTICIPANT’S BASE REMUNERATION
OTHER SENIOR CHIEF EXECUTIvE SENIOR COMPANY OFFICER EXECUTIvES MANAGEMENT
greater than 4% but less than or equal to 5% 25.0 10.0 2.5 greater than 5% but less than or equal to 6% 31.3 12.5 3.1 greater than 6% but less than or equal to 7% 37.5 15.0 3.8 greater than 7% but less than or equal to 8% 43.8 17.5 4.4 greater than 8% but less than or equal to 9% 50.0 20.0 5.0 greater than 9% but less than or equal to 10% 56.3 22.5 5.6 greater than 10% but less than or equal to 11% 62.5 25.0 6.3 greater than 11% but less than or equal to 12% 68.8 27.5 6.9 greater than 12% but less than or equal to 13% 75.0 30.0 7.5 greater than 13% but less than or equal to 14% 81.3 32.5 8.1 greater than 14% but less than or equal to 15% 87.5 35.0 8.8 greater than 15% but less than or equal to 16% 93.8 37.5 9.4 greater than 16% 100.0 40.0 10.0
share-based conditions The number of shares to be issued to a Senior executive is determined by dividing the percentage amount of base remuneration calculated in accordance with the above by:
• the weighted average price of the shares for the five day trading period commencing seven days after Blackmores’ results in respect of the prior financial year are announced to the ASx, less
• the amount of any final dividend per share declared as payable for the prior financial year.
staff share acquisition plan The group has established a Staff Share Acquisition Plan. The plan is open to all employees including Senior executives and enables them to purchase up to $1,000 of Blackmores shares tax free (subject to taxable income thresholds) each year with money that would have otherwise been paid as profit share. 1,640 shares were issued during the year ended 30 June 2015 (2014: 1,703 shares). in July 2015, 776 shares (2014: 1,555 shares) will be issued to employees, including Senior executives, for profit share entitlement that would otherwise have been paid in cash during the year ended 30 June 2015.
options plan At 1 July 2014 and at 1 July 2013 there were no share options outstanding, none were issued during the years ended 30 June 2015 (2014: nil) and as at 30 June 2015 (2014: nil) there were no unexercised share options.
the compensation of each member of the key management personnel of the group and a discussion of the compensation policies of the Company are detailed in the remuneration report which accompanies these Consolidated Financial Statements. F
or p
erso
nal u
se o
nly

70 71
Bl
ac
km
or
es
an
nu
al r
ep
or
t 2
01
5
Bl
ac
km
or
es
an
nu
al r
ep
or
t 2
01
5
notes to the financial statementsFOr the FinAnCiAL yeAr enDeD 30 JUne 2015
notes to the financial statementsFOr the FinAnCiAL yeAr enDeD 30 JUne 2015
13 trade and other receivables (cont.)
2015 2014 $’000 $’000
Ageing of Impaired Trade Receivables 0 - 30 days - 12 31 - 60 days 49 64 61 - 90 days 9 53 > 90 days 111 559 Total 169 688
Included in the allowance for doubtful debts are individually impaired trade receivables with a balance of $77 thousand (2014: $556 thousand). the group does not hold any collateral over these balances. the Directors believe that there is no further credit provision required in excess of the allowance for doubtful debts.
Movement in the Allowance for Doubtful Debts Balance at the beginning of the year 688 820Amounts written off as uncollectable (506) (137)(Decrease)/increase in provision (13) 5Balance at the end of the year 169 688
14 inventories Ingredients 1,806 1,458 Raw materials 10,420 17,034 Finished goods 26,439 20,250 38,665 38,742
The cost of inventories recognised as an expense during the period in respect of continuing operations was approximately $161,473 thousand (2014: $123,446 thousand).
This included $2,734 thousand (2014: $2,890 thousand) in respect of provisions to write down inventory to net realisable value. The provision at balance date to cover inventory write down is $2,949 thousand (2014: $3,070 thousand).
15 property, plant and eQuipment
2015 2014 $’000 $’000
Cost 99,935 96,976 Accumulated depreciation (39,200) (33,363) 60,735 63,613 Carrying amounts of: Freehold land 12,848 12,848 Buildings 31,054 31,985 Leasehold improvements 350 316 Plant and equipment 15,049 17,985 motor vehicles 157 116 Capital work in progress 1,277 363 60,735 63,613
15 property, plant and eQuipment (cont.)
LEASEHOLD CAPITAL FREEHOLD IMPROvE- PLANT AND MOTOR WORK IN LAND BUILDINGS MENTS EQUIPMENT vEHICLES PROGRESS TOTAL $’000 $’000 $’000 $’000 $’000 $’000 $’000
Cost Balanceat30June2013 12,848 36,983 727 41,783 331 865 93,537Additions - - 16 3,372 23 331 3,742 Category transfers - - - 833 - (833) - Disposals - - - (197) (63) - (260)Other - - - - - - - Net foreign currency exchange differences arising on translation of financial statements of foreign operations - - (8) (37) 2 - (43)Balanceat30June2014 12,848 36,983 735 45,754 293 363 96,976Additions - - 78 1,585 85 1,277 3,025 Category transfers - - - 363 - (363) -Disposals - - - (214) (64) - (278)Net foreign currency exchange differences arising on translation of financial statements of foreign operations - - 13 199 - - 212 Balanceat30June2015 12,848 36,983 826 47,687 314 1,277 99,935 Accumulated Depreciation Balanceat30June2013 - (4,067) (352) (23,253) (184) -(27,856)Disposals - - - 182 44 - 226 Depreciation expense - (931) (75) (4,725) (29) - (5,760)Net foreign currency exchange differences arising on translation of financial statements of foreign operations - - 8 27 (8) - 27 Balanceat30June2014 - (4,998) (419) (27,769) (177) -(33,363)Disposals - - - 201 55 - 256 Depreciation expense - (931) (74) (4,914) (35) - (5,954)Net foreign currency exchange differences arising on translation of financial statements of foreign operations - - 17 (156) - - (139)Balanceat30June2015 - (5,929) (476) (32,638) (157) -(39,200) Net Book Value As at 30 June 2014 12,848 31,985 316 17,985 116 363 63,613 As at 30 June 2015 12,848 31,054 350 15,049 157 1,277 60,735
No impairment losses have been recognised in the current year (2014: $nil).
For
per
sona
l use
onl
y

72 73
Bl
ac
km
or
es
an
nu
al r
ep
or
t 2
01
5
Bl
ac
km
or
es
an
nu
al r
ep
or
t 2
01
5
notes to the financial statementsFOr the FinAnCiAL yeAr enDeD 30 JUne 2015
notes to the financial statementsFOr the FinAnCiAL yeAr enDeD 30 JUne 2015
16 investment property
2015 2014 $’000 $’000
Cost of investment property 2,160 2,160
At cost Balance at beginning of year 2,160 2,160 Balance at end of year 2,160 2,160
investment property in the form of a plot of land at 15 Jubilee Avenue, warriewood, nSw 2102 was acquired during the financial year ended 30 June 2010.
In line with the group’s accounting policy on investment property, this property has been measured at cost. The cost of the purchased investment property comprises its purchase price and any directly attributable expenditure. Directly attributable expenditure includes professional fees for legal services, property transfer taxes and other transaction costs. As the property in question is freehold land, no depreciation is recognised in relation to it.
this investment property is tested for impairment annually. to date no impairment losses have been recognised and the Directors remain confident that the carrying amount of the investment property will be recovered in full.
17 other intangible assets
2015 2014 $’000 $’000
Cost 20,858 20,258 Accumulated amortisation and impairment (2,328) (1,895) 18,530 18,363
CAPITALISED REGISTRA- TRADE- FORMULA- ROYALTY WEBSITE TIONS1 MARKS1 TIONS1 STREAM BRANDS1 PATENTS TOTAL $’000 $’000 $’000 $’000 $’000 $’000 $’000 $’000
CostBalanceat30June2013 1,950 797 288 272 450 15,313 260 19,330Additions - 96 - - - - - 96 Additions from internal development 130 - - - - - - 130 Assets obtained through business combination - - - - - - 712 712 effect of foreign currency exchange differences (10) - - - - - - (10)Balanceat30June2014 2,070 893 288 272 450 15,313 972 20,258Additions - - - - - - - - Additions from internal development 600 - - - - - - 600 effect of foreign currency exchange differences - - - - - - - - Balanceat30June2015 2,670 893 288 272 450 15,313 972 20,858Accumulated Amortisation Balanceat30June2013 (1,264) - - - (98) - (35) (1,397)Amortisation expense (354) - - - (90) - (62) (506)effect of foreign currency exchange differences 8 - - - - - - 8 Balanceat30June2014 (1,610) - - - (188) - (97) (1,895)Amortisation expense (334) - - - (90) - (13) (437)effect of foreign currency exchange differences 4 - - - - - - 4 Balanceat30June2015 (1,940) - - - (278) - (110) (2,328) Net Book Value As at 30 June 2014 460 893 288 272 262 15,313 875 18,363 As at 30 June 2015 730 893 288 272 172 15,313 862 18,530 1. these assets are not amortised as the Directors believe that Brands, Formulations, trademarks and registrations do not have a limited useful life. instead, they are tested for impairment annually, or more frequently
if events or changes in circumstances indicate that they might be impaired.
17 other intangible assets (cont.)The following useful lives are used in the calculation of amortisation expense: Capitalised website development 3 years Patents 20 yearsRoyalty stream 5 years
the amortisation expense has been included in the line item ‘depreciation and amortisation expenses’ in the Consolidated Statement of profit or Loss and Other Comprehensive Income.
18 goodwill
2015 2014 $’000 $’000
Cost Balance at beginning of the year 16,863 17,575 Patent recognised during the year - (712)Balance at end of the year 16,863 16,863
18.1 allocation of goodwill and intangible assets with indefinite lives to cash-generating units
goodwill has been allocated as follows for impairment testing purposes to the following cash-generating units:
Pure Animal Wellbeing 658 658 BioCeuticals 16,205 16,205 16,863 16,863intangible assets with indefinite lives have been allocated as follows for impairment testing purposes to the following cash-generating units:
Pure Animal Wellbeing 1,189 1,189 BioCeuticals 15,481 15,481 16,670 16,670
pure animal wellbeing the recoverable amount of this cash-generating unit is determined based on a value in use calculation. those calculations use cash flow projections based on the five-year plan approved by management the basis of which is the Board approved budget; and also use a terminal value calculation.
Cash flow projections are based on estimated growth in eBit (net of tax) and estimated working capital changes. the cash flows beyond that five-year period have been extrapolated using a steady 2% per annum growth rate which is the projected long-term inflation rate. the Directors believe that any reasonably possible change in the key assumptions on which recoverable amount is based would not cause the aggregate carrying amount to exceed the aggregate recoverable amount of the cash-generating unit.
bioceuticals the recoverable amount of this cash-generating unit is determined based on a value in use calculation. those calculations use cash flow projections based on the five-year plan approved by management the basis of which is the Board approved budget; and also use a terminal value calculation.
Cash flow projections are based on estimated growth in in eBit (net of tax) and estimated working capital changes. the cash flows beyond that five-year period have been extrapolated using a steady 2% per annum growth rate which is the projected long-term inflation rate. the Directors believe that any reasonably possible change in the key assumptions on which recoverable amount is based would not cause the aggregate carrying amount to exceed the aggregate recoverable amount of the cash-generating unit.
The key assumptions used in the value in use calculations for Pure Animal Wellbeing and BioCeuticals cash-generating units are as follows
Budgeted sales growth Budgeted sales growth is expected to be in line with sales growth in the category Budgeted margins Budgeted margins are expected to remain consistent Discount rate the discount rate used for pure Animal wellbeing is 11% and BioCeuticals is 10%
19 trade and other payables
2015 2014 $’000 $’000
Trade payables1 52,835 25,928 goods and services tax (gST) payable 2,940 1,866 Other creditors and accruals 39,133 21,359 94,908 49,153 1. the average credit period on purchases is 30 days from the end of the month of invoice. the group has financial risk management policies in place to ensure all payables are paid within the credit time-frame.
For
per
sona
l use
onl
y

74 75
Bl
ac
km
or
es
an
nu
al r
ep
or
t 2
01
5
Bl
ac
km
or
es
an
nu
al r
ep
or
t 2
01
5
notes to the financial statementsFOr the FinAnCiAL yeAr enDeD 30 JUne 2015
notes to the financial statementsFOr the FinAnCiAL yeAr enDeD 30 JUne 2015
20 current tax liabilities 2015 2014 $’000 $’000
Income tax payable 12,815 2,793 Withholding tax payable 47 - 12,862 2,793
21 interest bearing liabilities
2015 2014 $’000 $’000
Non-current Secured - at amortised cost: Bank bills1,2 44,000 73,000 Summary of borrowing arrangements: 1. Secured by registered mortgage debentures and a floating charge over certain assets of the group. 2. in accordance with the security arrangements of liabilities, as disclosed in this note to the Consolidated Financial Statements, effectively all assets of the parent entity have been pledged as security.
The group signed a new banking facility agreement with a multi-bank, unsecured, common terms deed structure on 7 August 2015.
22 provisions
2015 2014 $’000 $’000
Current employee benefits1 6,136 5,178 Directors’ retirement benefits2 148 293 6,284 5,471 Non-current employee benefits1 730 906 reconciliation
DIRECTORS’ RETIREMENT BENEFITS
$’000
Balance at 30 June 2014 293 Additional provisions recognised - Reductions arising from payments made (145)Balanceat30June2015 148 Current 148 Non-current - 148 1. the provision for employee benefits represents annual leave and vested long service leave entitlements accrued. 2. the provision for Directors’ retirement benefits represents amounts set aside as Directors’ retirement allowances in accordance with a resolution passed by shareholders at the 4 november 1993 Annual general
meeting. Directors appointed prior to 1 October 2003 receive a retirement allowance of $15,333 per annum that is capped after nine years’ service at $138,000.
23 issued capital
2015 2014 $’000 $’000
17,224,284 fully paid ordinary shares (2014: 17,113,392) 37,753 34,502
2015 2014 2015 ISSUED 2014 ISSUED NUMBER CAPITAL NUMBER CAPITAL
’000 $’000 ’000 $’000
Fully Paid Ordinary Shares Balance at beginning of financial year 17,113 34,502 16,972 30,996 Issue of shares under executive and employee share plans (notes 11, 33.3) 2 - 2 - issue of shares under Dividend reinvestment plan 109 3,251 139 3,506 Balance at end of financial year 17,224 37,753 17,113 34,502
Fully paid ordinary shares carry one vote per share and carry a right to dividends.
Employee Share Plans Further details of the group’s executive and employee share plans are contained in note 11 to the Consolidated Financial Statements.
24 reserves
2015 2014 $’000 $’000
equity-settled employee benefits reserve 6,933 5,855 Cash flow hedging reserve (913) (513)Foreign currency translation reserve 2,043 (2,115) 8,063 3,227
24.1 eQuity-settled employee benefits reserve the equity-settled employee benefits reserve arises on the grant of share rights to executives and employees under various share plans. Further information about share-based payments to executives and employees is in note 11 to the Consolidated Financial Statements.
Balance at beginning of year 5,855 5,806 Recognition of share-based payments (net of tax) 1,078 49 Balance at end of year 6,933 5,855
24.2 cash flow hedging reserve the hedge reserve represents hedging gains and losses recognised on the effective portion of cash flow hedges. the cumulative deferred gain or loss on the hedge is recognised in profit or loss when the hedged transaction impacts the profit or loss, or is included as a basis adjustment to the non-financial hedged item, consistent with the applicable accounting policy.
Balance at beginning of year (513) (692)net (loss)/gain on revaluation (net of tax) (400) 179 Balance at end of year (913) (513)
24.3 foreign currency translation reserve exchange differences relating to foreign currency monetary items forming part of the net investment in a foreign operation and the translation of foreign controlled entities are brought to account by entries made directly to the foreign currency translation reserve, as described in note 2.15 to the Consolidated Financial Statements.
Balance at beginning of year (2,115) (720)exchange differences arising on translating the foreign controlled entities 4,158 (1,395)Balance at end of year 2,043 (2,115)
For
per
sona
l use
onl
y
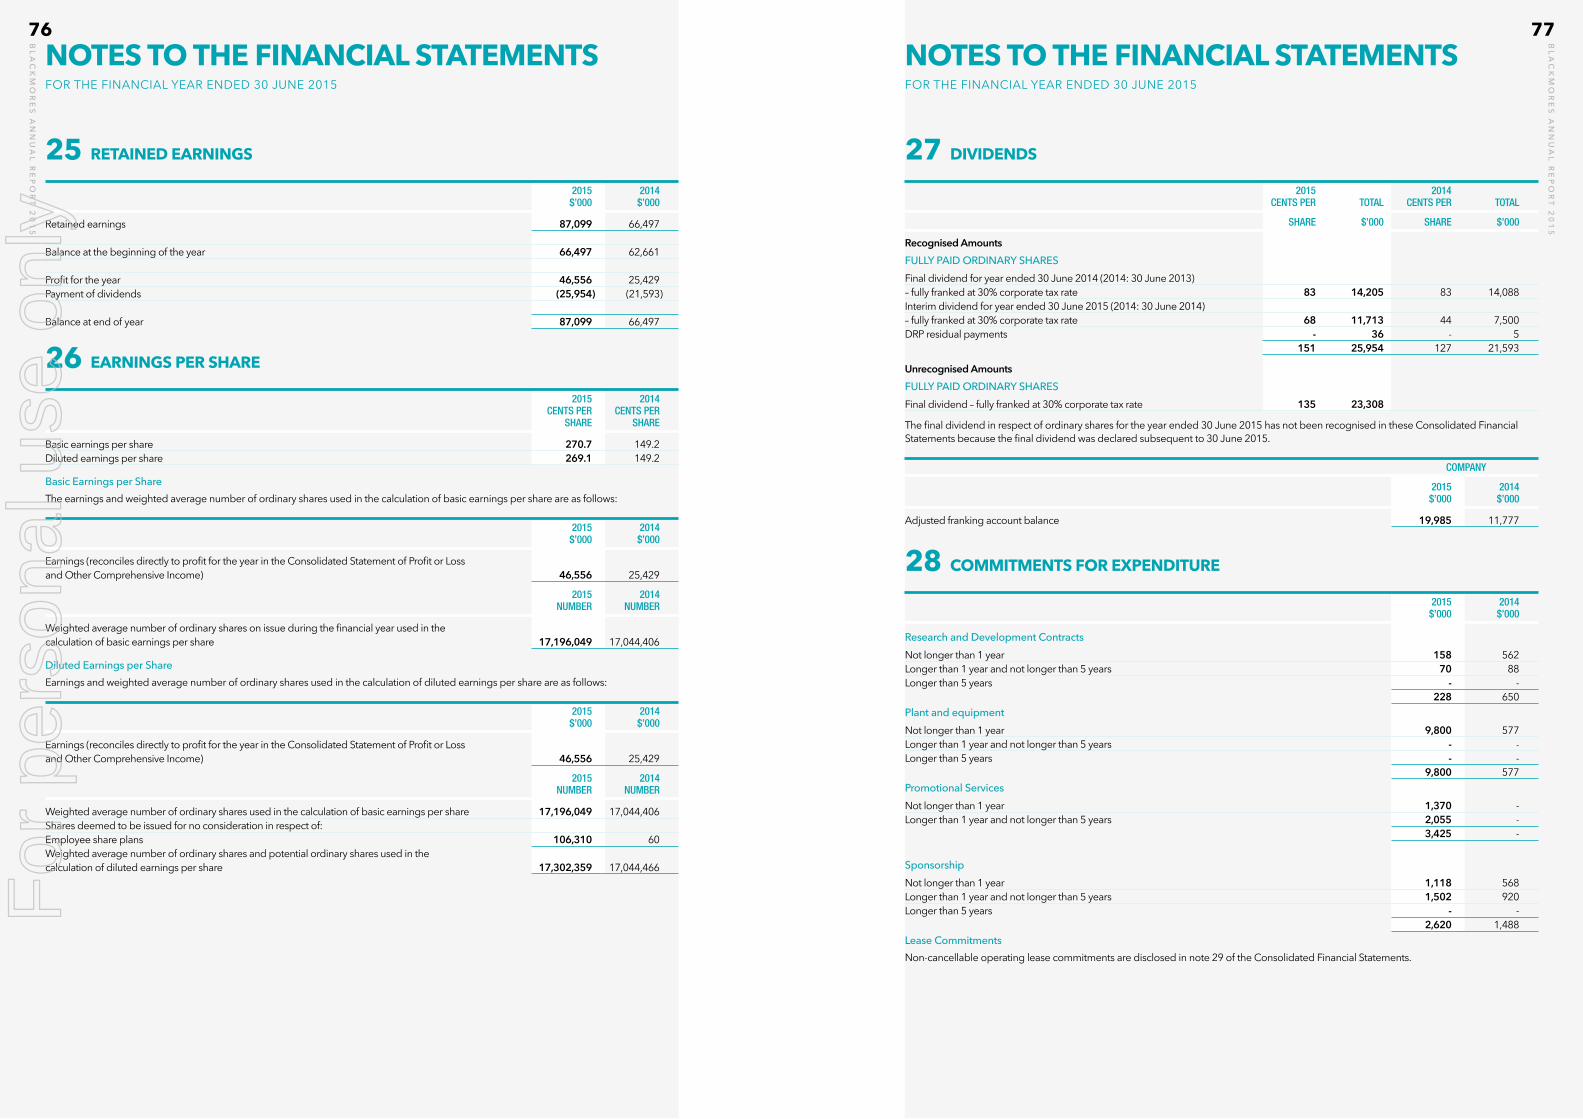
76 77
Bl
ac
km
or
es
an
nu
al r
ep
or
t 2
01
5
Bl
ac
km
or
es
an
nu
al r
ep
or
t 2
01
5
notes to the financial statementsFOr the FinAnCiAL yeAr enDeD 30 JUne 2015
notes to the financial statementsFOr the FinAnCiAL yeAr enDeD 30 JUne 2015
25 retained earnings
2015 2014 $’000 $’000
Retained earnings 87,099 66,497 Balance at the beginning of the year 66,497 62,661 profit for the year 46,556 25,429 Payment of dividends (25,954) (21,593) Balance at end of year 87,099 66,497
26 earnings per share
2015 2014 CENTS PER CENTS PER SHARE SHARE
Basic earnings per share 270.7 149.2Diluted earnings per share 269.1 149.2
Basic Earnings per Share The earnings and weighted average number of ordinary shares used in the calculation of basic earnings per share are as follows:
2015 2014 $’000 $’000
earnings (reconciles directly to profit for the year in the Consolidated Statement of profit or Loss and Other Comprehensive Income) 46,556 25,429
2015 2014 NUMBER NUMBER
weighted average number of ordinary shares on issue during the financial year used in the calculation of basic earnings per share 17,196,049 17,044,406
Diluted Earnings per Share earnings and weighted average number of ordinary shares used in the calculation of diluted earnings per share are as follows:
2015 2014 $’000 $’000
earnings (reconciles directly to profit for the year in the Consolidated Statement of profit or Loss and Other Comprehensive Income) 46,556 25,429
2015 2014 NUMBER NUMBER
Weighted average number of ordinary shares used in the calculation of basic earnings per share 17,196,049 17,044,406Shares deemed to be issued for no consideration in respect of: employee share plans 106,310 60Weighted average number of ordinary shares and potential ordinary shares used in the calculation of diluted earnings per share 17,302,359 17,044,466
27 dividends
2015 2014 CENTS PER TOTAL CENTS PER TOTAL
SHARE $’000 SHARE $’000
RecognisedAmountsFullY PAID ORDINARY SHARES Final dividend for year ended 30 June 2014 (2014: 30 June 2013) – fully franked at 30% corporate tax rate 83 14,205 83 14,088 interim dividend for year ended 30 June 2015 (2014: 30 June 2014) – fully franked at 30% corporate tax rate 68 11,713 44 7,500 Drp residual payments - 36 - 5 151 25,954 127 21,593
UnrecognisedAmounts FullY PAID ORDINARY SHARES Final dividend – fully franked at 30% corporate tax rate 135 23,308
the final dividend in respect of ordinary shares for the year ended 30 June 2015 has not been recognised in these Consolidated Financial Statements because the final dividend was declared subsequent to 30 June 2015.
COMPANY
2015 2014 $’000 $’000
Adjusted franking account balance 19,985 11,777
28 commitments for expenditure
2015 2014 $’000 $’000
Research and Development Contracts Not longer than 1 year 158 562 Longer than 1 year and not longer than 5 years 70 88 Longer than 5 years - - 228 650 Plant and equipment Not longer than 1 year 9,800 577 Longer than 1 year and not longer than 5 years - - Longer than 5 years - - 9,800 577 Promotional Services Not longer than 1 year 1,370 - Longer than 1 year and not longer than 5 years 2,055 - 3,425 -
Sponsorship Not longer than 1 year 1,118 568 Longer than 1 year and not longer than 5 years 1,502 920 Longer than 5 years - - 2,620 1,488 lease Commitments non-cancellable operating lease commitments are disclosed in note 29 of the Consolidated Financial Statements.
For
per
sona
l use
onl
y

78 79
Bl
ac
km
or
es
an
nu
al r
ep
or
t 2
01
5
Bl
ac
km
or
es
an
nu
al r
ep
or
t 2
01
5
notes to the financial statementsFOr the FinAnCiAL yeAr enDeD 30 JUne 2015
notes to the financial statementsFOr the FinAnCiAL yeAr enDeD 30 JUne 2015
29 operating leases
leasing Arrangements Operating leases relate to business premises and the group’s motor vehicle fleet with lease terms of between three and six years. All operating lease contracts contain market review clauses in the event that the group exercises its option to renew. The group does not have an option to purchase the leased asset at the expiry of the lease period.
Non-cancellable Operating lease Payments
2015 2014 $’000 $’000
Not later than 1 year 2,269 2,203 Later than 1 year and not later than 5 years 2,543 3,724 Later than 5 years - 65 4,812 5,992
No liabilities have been recognised in respect of non-cancellable operating leases.
30 contingent liabilities the Directors do not believe there are any contingent liabilities as at 30 June 2015 (2014: nil).
31 subsidiaries
OWNERSHIP INTEREST COUNTRY OF 2015 2014 NAME OF ENTITY INCORPORATION % % PRINCIPAL ACTIvITY
Blackmores Nominees Pty Limited1 Australia 100 100 management of employee share plans pat health Limited hong kong 100 100 marketing of natural health products Blackmores Beijing Co., Limited China 100 100 marketing of natural health products Blackmores (Shanghai) Trading Co. Limited China 100 - marketing of natural health products Blackmores (Taiwan) Limited Taiwan 100 100 marketing of natural health products Pure Animal Wellbeing Pty Limited Australia 100 100 Holder of intellectual property for Animal health Division Blackmores (New Zealand) Limited New Zealand 100 100 marketing of natural health products Blackmores (Singapore) Pte. Limited Singapore 100 100 marketing of natural health products Blackmores (malaysia) Sdn Bhd malaysia 100 100 marketing of natural health products Blackmores Holdings Limited Thailand 100 100 Holding Company Blackmores Limited Thailand 100 100 marketing of natural health products Blackmores korea Limited korea 100 100 marketing of natural health products Blackmores international pte. Limited Singapore 100 100 regional head office Fit-BioCeuticals Limited1 Australia 100 100 marketing of natural health products Fit-BioCeuticals (nZ) Limited new Zealand 100 100 marketing of natural health products pharmaFoods pty Ltd1 Australia 100 100 marketing of natural health products Fit-BioCeuticals Limited United kingdom 100 100 marketing of natural health products Fit-BioCeuticals (hk) Limited hong kong 100 100 marketing of natural health products hall Drug technologies pty Ltd1 Australia 100 100 marketing of natural health products 1. these wholly owned subsidiaries have entered into a deed of cross guarantee with Blackmores Limited pursuant to ASiC class order 98/1418 and are relieved from the requirement to prepare and lodge an
audited financial report.
Companies incorporated outside Australia carry on business in the country of incorporation. All overseas entities have been audited by overseas firms of Deloitte touche tohmatsu, except the overseas entities owned by Fit-BioCeuticals Limited.
Economic Dependency the group is not significantly dependent upon any other entity.
31 subsidiaries (cont.)31.1 financial support the Consolidated Statement of profit or Loss and Other Comprehensive income and Consolidated Statement of Financial position of the entities party to the deed of cross guarantee are:
Consolidated Statement of Profit or Loss and Other Comprehensive Income 2015 2014 $’000 $’000
Sales 409,721 304,062 Revenue 409,721 304,062 Other income 18,267 4,857 Revenueandotherincome 427,988 308,919 Promotional and other rebates 65,877 46,983 Raw materials and consumables used 144,692 114,121 employee benefits expense 79,918 60,920 Selling and marketing expenses 24,119 21,538 Depreciation and amortisation expenses 6,156 6,007 Operating lease rental expenses 2,721 2,640 Professional and consulting expenses 5,440 3,769 Repairs and maintenance expenses 3,176 2,807 Freight expenses 5,992 5,780 Bank charges 1,316 824 Other expenses 13,661 12,748 Totalexpenses 353,068 278,137 Earningsbeforeinterestandtax 74,920 30,782 Interest revenue 297 288 Interest expense (3,914) (5,130) Net interest expense (3,617) (4,842) Profitbeforetax 71,303 25,940 Income tax expense (17,767) (6,462) Profitfortheyear 53,536 19,478
Othercomprehensiveincome Itemsthatmaybereclassifiedsubsequentlytoprofitorloss net (loss)/gain on hedging instruments entered into for cash flow hedges, net of tax (400) 179 Other comprehensive (expense)/income for the year, net of tax (400) 179 Totalcomprehensiveincomefortheyear 53,136 19,657
For
per
sona
l use
onl
y

80 81
Bl
ac
km
or
es
an
nu
al r
ep
or
t 2
01
5
Bl
ac
km
or
es
an
nu
al r
ep
or
t 2
01
5
notes to the financial statementsFOr the FinAnCiAL yeAr enDeD 30 JUne 2015
notes to the financial statementsFOr the FinAnCiAL yeAr enDeD 30 JUne 2015
31 subsidiaries (cont.)
31.1 financial support (cont.)
2015 2014 Consolidated Statement of Financial Position $’000 $’000
ASSETS
CuRRENT ASSETS Cash and bank balances 15,957 6,385 Receivables 101,273 65,937 Inventories 29,902 31,141 Other assets 3,582 3,056 Totalcurrentassets 150,714 106,519 NON-CuRRENT ASSETS Property, plant and equipment 60,030 63,170 Investment property 2,160 2,160 Other intangible assets 17,429 18,498 goodwill 16,863 16,863 Deferred tax assets 6,550 3,509 Other financial assets 5,584 5,584 Totalnon-currentassets 108,616 109,784 Totalassets 259,330 216,303 lIABIlITIES
CuRRENT lIABIlITIES Trade and other payables 80,060 52,902 Current tax payable 11,629 1,874 Other financial liabilities 1,348 508 Provisions 5,942 6,989 Other 3,751 92 Totalcurrentliabilities 102,730 62,365 NON-CuRRENT lIABIlITIES Interest-bearing liabilities 44,000 73,000 Provisions 1,274 906 Other financial liabilities 109 245 Other 226 177 Totalnon-currentliabilities 45,609 74,328 Totalliabilities 148,339 136,693 Net assets 110,991 79,610
EQuITY
CAPITAl AND RESERVES Issued capital 37,753 34,502 Reserves 5,813 5,265Retained earnings 67,425 39,843Totalequity 110,991 76,610
32 Joint ventures The group has the following interest in joint ventures:
in the financial year ended 30 June 2011 the group entered into a long-term joint venture arrangement with an established supplier of internet-based personalised health clubs and related services. the joint venture arrangement finished at 30 June 2014.
the following amounts are included in the group’s Financial Statements in relation to the joint venture.
2015 2014 $’000 $’000
Expenses - 238
33 related party and key management personnel disclosures 33.1 eQuity interests in related parties
EQuITY INTERESTS IN SuBSIDIARIES Details of the percentage of ordinary shares held in controlled entities are disclosed in note 31 to the Consolidated Financial Statements.
33.2 loan disclosures there were no loan balances exceeding $100,000 due from key management personnel during or at the end of the financial year (2014: nil).
33.3 other transactions with key management personnel key management personnel received dividends on their shareholdings, whether held privately or through related entities or through the employee share plans in the same manner as all ordinary shareholders.
no interest was paid to or received from key management personnel.
33.4 related party transactions The immediate parent and ultimate controlling party of the group is Blackmores Limited (incorporated in Australia).
Balances and transactions between the Company and its subsidiaries, which are related parties of the Company, have been eliminated on consolidation and are not disclosed in this note. Details of transactions between the group and other related parties are disclosed below.
TRADING TRANSACTIONS During the year, group entities did not enter into any trading transactions with related parties that are not members of the group (2014: $nil).
OTHER RElATED PARTY TRANSACTIONS During the financial year ended 30 June 2015, the following transactions occurred between the group and its other related parties:
• galileo kaleidoscope pty Ltd, a company of which Brent wallace is a Director, performed certain consulting services for the Company for which fees of $259,246 (2014: $374,714) were charged.
BAlANCES WITH RElATED PARTIES no balances outstanding at the end of the financial year with related parties that are not members of the group (2014: $nil).
For
per
sona
l use
onl
y

82 83
Bl
ac
km
or
es
an
nu
al r
ep
or
t 2
01
5
Bl
ac
km
or
es
an
nu
al r
ep
or
t 2
01
5
notes to the financial statementsFOr the FinAnCiAL yeAr enDeD 30 JUne 2015
notes to the financial statementsFOr the FinAnCiAL yeAr enDeD 30 JUne 2015
34 notes to the consolidated statement of cash flows 34.1 reconciliation of cash and cash eQuivalents For the purposes of the Consolidated Statement of Cash Flows, cash and cash equivalents includes cash on hand and in banks and investments in money market instruments, net of outstanding bank overdrafts. Cash and cash equivalents at the end of the financial year as shown in the Consolidated Statement of Cash Flows is reconciled to the related items in the Consolidated Statement of Financial position as follows:
2015 2014 $’000 $’000
Cash and bank balances 36,931 18,599 Cash and cash equivalents 36,931 18,599 34.2 financing facilities Secured bank overdraft facility, reviewed annually and payable at call: • amount used - - • amount unused 5,000 5,000 5,000 5,000 Secured bank bill acceptance facility, reviewed annually: • amount used 44,000 73,000 • amount unused 69,000 40,000 113,000 113,000
the group has access to financing facilities at reporting date as indicated above. The group expects to meet its other obligations from operating cash flows and proceeds of maturing financial assets.
34.3 reconciliation of profit for the year to net cash flows from operating activities
2015 2014 $’000 $’000
profit for the year 46,556 25,429 Loss on disposal of non-current assets 14 6 interest revenue disclosed as investing cash flow (415) (309)Dividend income disclosed as investing cash flow (11) (7)Depreciation and amortisation of non-current assets 6,391 6,266 Revaluation of investments (26) (27)Share-based payments 1,078 49 Other (295) 39 Increase in current tax liability 9,057 2,861 Increase in deferred tax balances (2,668) (132)Decrease in deferred tax balances related to hedge reserve in equity 172 (76) movements in working capital: • Current receivables (34,055) (7,468)• Current inventories 6,459 953 • Other debtors and prepayments (1,714) (1,226)• Current trade payables 39,943 10,670 • provisions 641 463 Netcashflowsfromoperatingactivities 71,127 37,491
34.4 non-cash transactions During the current year, the group entered into the following non-cash investing and financing activity which is not reflected in the Consolidated Statement of Cash Flows:
During the year 109,252 (2014: 139,620) shares were issued under the Dividend reinvestment plan. Dividends settled in shares rather than cash during the year totalled $3,251 thousand (2014: $3,506 thousand).
The group acquired $60 thousand (2014: $22 thousand) of equipment under a technology fund made available by the group’s telecommunications provider under the provisions of a new contract negotiated during the financial year.
35 financial instruments 35.1 capital management The group manages its capital to ensure that entities in the group will be able to continue as a going concern while maximising the return to stakeholders through optimisation of the debt and equity balance. The group’s overall strategy remains unchanged from 2014.
The capital structure of the group consists of net debt (borrowings as disclosed in note 21 offset by cash and cash equivalents as disclosed in note 34) and equity of the group (comprising issued capital, reserves and retained earnings as disclosed in notes 23, 24 and 25 respectively).
The group operates globally, primarily through the Company and subsidiary companies established in the markets in which the group trades. None of the entities within the group are subject to externally imposed capital requirements.
Operating cash flows are used to maintain and expand the group’s production and distribution assets, as well as make the routine outflows of tax, dividends and repayment of maturing debt. The group’s policy is to borrow centrally, using a variety of capital market issues and borrowing facilities, to meet anticipated funding requirements.
The group’s Audit and Risk Committee reviews the capital structure of the group on a semi-annual basis. Based upon recommendations of the Committee, the group will balance its overall capital structure through the payment of dividends, new share issues and share buy-backs as well as the issue of new debt or redemption of existing debt with third parties and, if appropriate, related parties.
GEARING RATIO The gearing ratio at the end of the year was as follows:
2015 2014 $’000 $’000
Debt1 44,000 73,000 Cash and bank balances (36,931) (18,599)Net debt 7,069 54,401 equity2 132,915 104,226 Net debt to (net debt plus equity) ratio 5.1% 34.3%1. Debt is defined as long and short-term borrowings, as detailed in note 21. 2. equity includes all capital and reserves that are managed as capital.
CATEGORIES OF FINANCIAl INSTRuMENTS
Financial Assets Cash and bank balances 36,931 18,599 Loans and receivables 107,076 70,567 Other financial assets 391 318 144,398 89,484 Financial liabilities Derivative instruments in designated hedge accounting relationships 424 753 Loans and payables 133,907 122,153 134,331 122,906
35.2 financial risk management obJectives the group’s Corporate treasury function provides services to the business, coordinates access to domestic and international financial markets and monitors and manages the financial risks relating to the operations of the group.
the group seeks to minimise the effects of currency risk and interest rate risk by using derivative financial instruments to hedge these risk exposures. the use of financial derivatives is governed by the group’s policies approved by the Board of Directors, which provide written principles on foreign exchange risk, interest rate risk and the use of financial derivatives. Compliance with policies and exposure limits is reviewed internally on a continuous basis. the group does not enter into or trade financial instruments, including derivative financial instruments, for speculative purposes.
35.3 significant accounting policies Details of the significant accounting policies and methods adopted, including the criteria for recognition, the basis of measurement and the basis on which revenues and expenses are recognised, in respect of each class of financial asset and financial liability, are disclosed in note 2.6 to the Consolidated Financial Statements.
For
per
sona
l use
onl
y

84 85
Bl
ac
km
or
es
an
nu
al r
ep
or
t 2
01
5
Bl
ac
km
or
es
an
nu
al r
ep
or
t 2
01
5
notes to the financial statementsFOr the FinAnCiAL yeAr enDeD 30 JUne 2015
notes to the financial statementsFOr the FinAnCiAL yeAr enDeD 30 JUne 2015
35 financial instruments (cont.)35.4 foreign currency risk management the group undertakes transactions denominated in foreign currencies; consequently exposures to exchange rate fluctuations arise. exchange rate exposures are managed within approved policy parameters utilising forward exchange contracts.
the group is mainly exposed to new Zealand Dollar (nZD), United States Dollar (USD), and Canadian Dollar (CAD).
the Australian Dollar carrying amount of the group’s foreign currency denominated monetary assets and monetary liabilities at the end of the reporting period are as follows:
LIABILITIES ASSETS
2015 2014 2015 2014 $’000 $’000 $’000 $’000
United States Dollar (USD) 4,759 2,772 1,158 278 new Zealand Dollar (nZD) 7,678 4,096 19 330 euro (eUr) 79 217 - - Canadian Dollar (CAD) (226) 124 - - Swiss Franc (ChF) (13) 10 - -
FOREIGN CuRRENCY SENSITIVITY ANAlYSIS the following table details the group’s sensitivity to a 10% increase and decrease in the Australian Dollar against the relevant foreign currencies. 10% is the sensitivity rate used when reporting foreign currency risk internally to key management personnel and represents management’s assessment of the possible change in foreign exchange rates. The sensitivity analysis includes only outstanding foreign currency denominated monetary items and adjusts their translation at the period end for a 10% change in foreign currency rates. A positive number below indicates an increase in profit or equity where the Australian dollar strengthens 10% against the relevant currency. For a 10% weakening of the Australian dollar against the relevant currency, there would be a comparable impact on the profit or equity, and the balances below would be negative.
PROFIT/ (LOSS)
10% INCREASE 10% DECREASE
2015 2014 2015 2014 $’000 $’000 $’000 $’000
USD impact 327 227 (400) (277) nZD impact 694 342 (851) (418) eUr impact 7 20 (9) (24) CAD impact 21 11 (25) (14) ChF impact (1) 1 1 (1)
This is mainly attributable to the exposure outstanding on foreign currency payables in the group at the end of the reporting period.
EQUITY
10% INCREASE 10% DECREASE
2015 2014 2015 2014 $’000 $’000 $’000 $’000
USD impact - (85) - 89 nZD impact (2,273) (157) 819 235 CAD impact - (24) - 37
From time to time during the year, the group entered into nZD, USD and CAD forward exchange contracts in order to reduce foreign currency risk.
OPTION CONTRACTS the group did not utilise any option contracts during the year, so there were no open contracts at 30 June 2015 (2014: $nil).
FORWARD FOREIGN EXCHANGE CONTRACTS the group utilised forward foreign exchange contracts during the year. At 30 June 2015 there were open contracts of nZD 19,400 thousand, USD 3,100 thousand and CAD 500 thousand (2014: nZD 2,400 thousand, USD 800 thousand and CAD 300 thousand). these contracts are a partial hedge for upcoming raw material purchases.
35 financial instruments (cont.)35.5 interest rate risk management “the group is exposed to interest rate risk as it borrows funds on a floating interest rate basis. the risk is managed by the group by the use of interest rate swap contracts.
The following table sets out the group’s exposure to interest rate risk.
2015 2014 $’000 $’000
Financial liabilities Borrowings (44,000) (73,000)Finance Lease - - Interest rate swap1 44,000 59,000 Net exposure - (14,000)1. Represents the notional amount of the interest rate swaps.
The following table details the notional amounts and remaining terms of interest rate swap contracts outstanding as at reporting date:
AvERAGE CONTRACTED FIXED INTEREST RATE NOTIONAL PRINCIPAL AMOUNT FAIR vALUE
2015 2014 2015 2014 2015 2014 OUTSTANDING FIXED FOR FLOATING CONTRACTS % % $’000 $’000 $’000 $’000
Less than 1 year 3.28 4.52 39,000 15,000 (173) (508)1 to 2 years 5.61 3.24 5,000 24,000 (250) (169)2 to 5 years - 3.91 - 20,000 - (76)> 5 years - - - - - - 3.54 3.79 44,000 59,000 (423) (753)
the interest rate swaps settle on a quarterly basis. the floating rate on the interest rate swaps is the Australian bank bill swap bid rate. All interest rate swap contracts are designated as cash flow hedges.
the group will settle the difference between fixed and floating interest on a net basis.
All other financial assets and liabilities (in the current and prior financial years) are non-interest bearing.
INTEREST RATE SENSITIVITY ANAlYSIS The sensitivity analyses below have been determined based on the exposure to interest rates for both derivative and non-derivative instruments at the reporting date and the stipulated change taking place at the beginning of the financial year and held constant throughout the year. A 50 basis point increase or decrease is used when reporting interest rate risk internally to key management personnel and represents management’s assessment of the possible change in interest rates.
For the year ended 30 June 2015, if interest rates had been 50 basis points higher or lower and all other variables were held constant, the group’s net profit would decrease by $342 thousand (2014: $457 thousand) or increase by $342 thousand (2014: $457 thousand) respectively as a result of changes in the interest rates applicable to commercial bank bills.
For the year ended 30 June 2015, if interest rates had been 50 basis points higher or lower and all other variables were held constant, the group’s other equity reserves would increase by $92 thousand or decrease by $132 thousand respectively (2014: increase by $316 thousand or decrease by $418 thousand respectively) mainly as a result of the changes in the fair value of the interest rate swap.
There has been no change to the manner in which the group manages and measures the risk from the previous year.
INTEREST RATE SWAP CONTRACTS Under interest rate swap contracts, the group agrees to exchange the difference between fixed and floating rate interest amounts calculated on agreed notional principal amounts. Such contracts enable the group to mitigate the risk of changing interest rates on the fair value of variable rate debt. the fair value of interest rate swaps at the end of the reporting period is determined by discounting the future cash flows using the curves at the end of the reporting period and the credit risk inherent in the contract and is disclosed below. The average interest rate is based on the outstanding balances at the end of the financial year.
the group did not enter into any new interest rate swaps during the 2015 financial year.
For
per
sona
l use
onl
y

86 87
Bl
ac
km
or
es
an
nu
al r
ep
or
t 2
01
5
Bl
ac
km
or
es
an
nu
al r
ep
or
t 2
01
5
notes to the financial statementsFOr the FinAnCiAL yeAr enDeD 30 JUne 2015
notes to the financial statementsFOr the FinAnCiAL yeAr enDeD 30 JUne 2015
35 financial instruments (cont.)35.6 credit risk management Credit risk refers to the risk that a counterparty will default on its contractual obligations resulting in financial loss to the group. the group has adopted a policy of only dealing with creditworthy counterparties. The group only transacts with entities that have a positive credit history. The information used to determine creditworthiness is supplied by independent rating agencies where available and, if not available, the group uses publicly available financial information, trade references and their own trading record to rate their major customers.
Ongoing credit evaluation is performed on the financial condition of accounts receivable and, where appropriate, credit guarantee insurance cover is purchased. The quality of trade receivables has been discussed in note 13.
the credit risk on liquid funds and derivative financial instruments is limited because the counterparties are banks with sound credit ratings assigned by international credit-rating agencies.
the carrying amount of financial assets recorded in the Consolidated Financial Statements, net of any allowances for losses, represents the group’s maximum exposure to credit risk.
There has been no change to the group’s exposure to credit risk or the manner in which it manages and measures the risk from the previous year.
35.7 liQuidity risk management Ultimate responsibility for liquidity risk management rests with the Board of Directors, which has established an appropriate liquidity risk management framework for the management of the group’s short-, medium- and long-term funding and liquidity management requirements. The group manages liquidity risk by maintaining adequate reserves and banking facilities and through the continual monitoring of forecast and actual cash flows.
lIQuIDITY AND INTEREST RISk TABlES the following tables detail the group’s remaining contractual maturity for its non-derivative financial liabilities with agreed repayment periods. the tables have been drawn up based on the undiscounted cash flows of financial liabilities based on the earliest date on which the group can be required to pay. the tables include both interest and principal cash flows.
WEIGHTED AvERAGE 3 MONTHS EFFECTIvE INTEREST <1 MONTH 1-3 MONTHS TO 1 YEAR 1-5 YEARS 5 YEARS TOTAL RATE % $’000 $’000 $’000 $’000 $’000 $’000
2015 Trade and other payables 0.00 - 94,908 - - - 94,908Borrowings 3.54 - - - 44,000 - 44,000 - 94,908 - 44,000 - 138,908 2014 Trade and other payables 0.00 - 49,153 - - - 49,153 Borrowings 3.58 - - - 73,000 - 73,000 - 49,153 - 73,000 - 122,153
There has been no change to the group’s exposure to liquidity risks or the manner in which it manages and measures the risk from the previous year.
the following table details the group’s liquidity analysis for its derivative financial instruments. the table has been drawn up based on the undiscounted net cash inflows/(outflows) on the derivative instrument that settle on a net basis and the undiscounted gross inflows/(outflows) on those derivatives that require gross settlement. when the amount payable or receivable is not fixed, the amount disclosed has been determined by reference to the projected interest rates as illustrated by the yield curves existing at the reporting date.
3 MONTHS <1 MONTH 1-3 MONTHS TO 1 YEAR 1-5 YEARS 5 YEARS TOTAL $’000 $’000 $’000 $’000 $’000 $’000
2015 Net settled: Interest rate swaps (89) - (257) (84) - (430) (89) - (257) (84) - (430)2014 Net settled: Interest rate swaps (157) - (342) (305) - (804) (157) - (342) (305) - (804)
35 financial instruments (cont.)35.8 fair value of financial instruments the Directors consider that the carrying amounts of financial assets and financial liabilities recognised at amortised cost in the Consolidated Financial Statements approximate their fair values.
VAluATION TECHNIQuES AND ASSuMPTIONS APPlIED FOR THE PuRPOSE OF MEASuRING FAIR VAluE the fair values of financial assets and financial liabilities are determined as follows:
• the fair value of financial assets and financial liabilities with standard terms and conditions and traded on active liquid markets are determined with reference to quoted market prices;
• the fair value of derivative instruments are calculated using quoted prices. where such prices are not available, a discounted cash flow analysis is performed using the applicable yield curve for the duration of the instruments for non-optional derivatives and option pricing models for optional derivatives; and
• the fair value of other financial assets and financial liabilities (excluding derivative instruments) are determined in accordance with generally accepted pricing models based on discounted cash flow analysis using prices from observable current market transactions.
FAIR VAluE MEASuREMENTS RECOGNISED IN THE CONSOlIDATED STATEMENT OF FINANCIAl POSITION the following table provides an analysis of financial instruments that are measured subsequent to initial recognition at fair value, grouped into Levels 1 to 3 based on the degree to which the fair value is observable.
• Level 1 fair value measurements are those derived from quoted prices (unadjusted) in active markets for identical assets or liabilities.
• Level 2 fair value measurements are those derived from inputs other than quoted prices included within Level 1 that are observable for the asset or liability, either directly (i.e. as prices) or indirectly (i.e. derived from prices).
• Level 3 fair value measurements are those derived from valuation techniques that include inputs for the asset or liability that are not based on observable market data (unobservable inputs). Unquoted equities are valued by reference to recent share trading activity.
2015 LEvEL 1 LEvEL 2 LEvEL 3 TOTAL $’000 $’000 $’000 $’000
Financial Assets at FVTPl: Derivative financial assets - - - - non-derivative financial assets held for trading - - - - Available-for-sale Financial Assets: Unquoted equities - - 391 - Asset-backed securities reclassified from fair value through profit or loss - - - - Total - - 391 - Financial liabilities at FVTPl: Derivative financial liabilities - 423 - 423Total - 423 - 423
2014 LEvEL 1 LEvEL 2 LEvEL 3 TOTAL $’000 $’000 $’000 $’000
Financial Assets at FVTPl: Derivative financial assets - - - - non-derivative financial assets held for trading - - - - Available-for-sale Financial Assets: Unquoted equities - - 318 318 Asset-backed securities reclassified from fair value through profit or loss - - - - Total - - 318 318 Financial liabilities at FVTPl: Derivative financial liabilities - 753 - 753 Total - 753 - 753 There were no transfers between Levels 1 and 2.
DERIVATIVES interest rate swaps are measured at present value of future cash flows estimated and discounted based upon the applicable yield curves derived from quoted interest rates.
For
per
sona
l use
onl
y

88 89
Bl
ac
km
or
es
an
nu
al r
ep
or
t 2
01
5
Bl
ac
km
or
es
an
nu
al r
ep
or
t 2
01
5
notes to the financial statementsFOr the FinAnCiAL yeAr enDeD 30 JUne 2015
36 assets pledged as security in accordance with the security arrangements of liabilities, as disclosed in note 21 to the Consolidated Financial Statements, all assets of the Parent entity have been pledged as security. The holder of the security does not have the right to sell or repledge the assets.
37 parent entity information the accounting policies of the parent entity, which have been applied in determining the financial information shown below, are the same as those applied in the Consolidated Financial Statements. refer to note 2 for a summary of the significant accounting policies relating to the group.
2015 2014 $’000 $’000
FINANCIAl POSITION Assets Current asset 127,561 94,106 Non-current assets 114,822 115,224 Total assets 242,383 209,330
liabilities Current liabilities 138,209 67,211
Non-current liabilities 1,041 74,141 Total liabilities 139,250 141,352 Equity Issued capital 37,753 34,502 Retained earnings 59,493 28,134 Reserves 5,887 5,342Total equity 103,133 67,978
FINANCIAl PERFORMANCE profit for the year 57,313 13,861 Other comprehensive income (400) 179 Total comprehensive income 56,913 14,040
GuARANTEES ENTERED INTO BY THE PARENT ENTITY IN RElATION TO THE DEBTS OF ITS SuBSIDIARIES The Company has provided Letters of Support in relation to Pat Health Ltd and Blackmores (Taiwan) Ltd, both wholly owned subsidiaries of the group.
the directors have a reasonable expectation that the Company will have sufficient financial accommodation to enable payment of the subsidiaries’ debts as and when they fall due for a period of at least 12 months from the date of signing the local Financial Statements of the above mentioned entities.
CONTINGENT lIABIlITIES the Directors do not believe there are any contingent liabilities as at 30 June 2015 (2014: nil).
COMMITMENTS FOR THE ACQuISITION OF PROPERTY, PlANT AND EQuIPMENT BY THE PARENT ENTITY Plant and equipment
Not longer than 1 year 9,800 577 Longer than 1 year and not longer than 5 years - - Longer than 5 years - - 9,800 577
38 events after the reporting period FINAl DIVIDEND the Directors declared a fully franked final dividend of 135 cents per share on 25 August 2015 as described in note 27. NEW BANkING FACIlITY The group signed a new banking facility agreement on 7 August 2015, as described in note 21.
Other than the matters disclosed in this note, there has not been any matter or circumstance that has arisen since the end of the financial year that has significantly affected, or may significantly affect, the group’s operations, the result of those operations or the group’s state of affairs in future financial years.
39 approval of financial statements the Consolidated Financial Statements were approved by the Board of Directors and authorised for issue on 25 August 2015.
numbers of holders of eQuity securities as at 27 July 2015: ordinary share capital 17,225,060 fully paid ordinary shares are held by 7,831 shareholders.
All issued ordinary shares carry one vote per share, and are entitled to participate in dividends.
There are no options in existence.
There are no restricted securities.
There is no current on-market buy-back.
distribution of holders of eQuity securities
SPREAD OF HOLDINGS NO. OF ORDINARY SHAREHOLDERS
1 - 1,000 5,774 1,001 - 5,000 1,790 5,001 - 10,000 155 10,001 - 100,000 94 100,001 and over 18 Total 7,831 Holdings less than a marketable parcel 130
substantial shareholders
FULLY PAID ORDINARY SHAREHOLDERS NUMBER PERCENTAGE
marcus C Blackmore 4,341,542 25.21
twenty largest holders of Quoted eQuity securities as at 27 July 2015
FULLY PAID ORDINARY SHAREHOLDERS NUMBER PERCENTAGE
mr m C Blackmore 3,321,401 19.28 Citicorp Nominees Pty Limited 1,388,037 8.06 Dietary products (Aust pty Ltd) 601,270 3.49 National Nominees Limited 428,056 2.49 milton Corporation Limited 378,014 2.19 Jp morgan nominees Australia Limited 322,252 1.87 Blackmore Foundation pty Limited 278,200 1.62 HSBC Custody Nominees 235,294 1.37 mrs e m Whellan 191,934 1.11 ms J A tait 177,213 1.03 RBC Investor Services Australia nominees p/L 161,980 0.94 Blackmore Superannuation Fund 148,210 0.86 Superlife Trustee Nominees Ltd 116,150 0.67 mr R Shepherd 115,000 0.67 Rathvale Pty Limited 103,205 0.60 gowing Bros Limited 101,798 0.59 hSBC Custody nominees (Australia) A/C 2 101,425 0.59 mrs P g Wright 100,279 0.58 Brispot Nominees Pty Ltd 98,656 0.57 BNP Paribas Nominees Pty Ltd 93,430 0.54 Total 8,461,804 49.13
additional information
For
per
sona
l use
onl
y

DeS
ign
| x
An
Der
Cre
Ativ
e.C
Om
.AU
90
Bl
ac
km
or
es
an
nu
al r
ep
or
t 2
01
5
company secretaryThe Company Secretaries are Cecile Cooper and Aaron Canning.
principal place of business20 Jubilee Avenue Warriewood NSW 2102 Telephone +61 2 9910 5000
Registered Office20 Jubilee Avenue Warriewood NSW 2102 Telephone +61 2 9910 5000
share registryComputershare Investor Services Pty Limited Level 3, 60 Carrington Street Sydney NSW 2000 (gPO Box 7045 Sydney NSW 1115) Telephone +61 2 8234 5000 Facsimile +61 2 8234 5050
securities exchange listingBlackmores Limited’s ordinary shares are quoted by the Australian Securities exchange Limited, listing code BkL.
direct payment to shareholders’ bank accounts Dividends may be paid directly to bank, building society or credit union accounts in Australia. These payments are electronically credited on the dividend date and confirmed by mail. the Company encourages you to participate in this arrangement, so please contact our share registry.
change of addressShareholders who have changed address should advise our share registry in writing.
tax file numberthere may be benefit to shareholders in lodging their tax file number with the share registry.
shareholder discount planShareholders can buy products for personal use at 30 per cent off the recommended retail price. All shareholders have been given details of the plan, but please contact the Company Secretary on +61 2 9910 5137 if you would like more information.
corporate governance principlesThe Corporate governance Principles adopted by the Board are available on our website at blackmores.com.au (go to ‘Investors’, then click on ‘Corporate governance’) or contact the Company Secretary.
annual report mailingShareholders who do not want the annual report or who are receiving more than one copy should advise the share registrar in writing. These shareholders will continue to receive all other shareholder information.
The annual report is available on our website at blackmores.com.au (go to ‘Investors’, then click on ‘Annual Reports’).
to consolidate shareholdingsShareholders who want to consolidate their separate shareholdings into one account should advise the share registrar in writing.
investor informationSecurities analysts and institutional investors seeking information about the Company should, in the first instance, contact Dee hanley, Investor Relations manager, on +61 2 9910 5162 or Aaron Canning, Chief Financial Officer on +61 2 9910 5106.
company informationBoardofDirectors
Directors who are Executives of the Group:marcus C Blackmore (Chairman of Directors) Christine holgate (Chief executive Officer)
Directors who are not Executives of the Group:David Ansell Stephen Chapman John Armstrong Helen Nash Brent Wallace
auditorDeloitte touche tohmatsu
solicitorDavid Lemon
blackmores onlineBlackmores has a popular website containing information on a more natural approach to health and the Company in general. The address is blackmores.com.au
company information
For
per
sona
l use
onl
y

Blackmores Limited Australia’s Leading Natural Health Company
ACN 009 713 437
20 Jubilee Avenue Warriewood NSW 2102, Australia
Tel: +61 2 9910 5000 Fax: +61 2 9910 5555
blackmores.com.au
For
per
sona
l use
onl
y