forex daily report
TRANSCRIPT
RESEARCH TEAM
DAILY TECHNICAL REPORT
30 August 2016
DISCLAIMER & DISCLOSURESPlease read the disclaimer and the disclosures which can be found at the end of this report

Page 2 | 14
EUR / USD
Edging lower.
• EUR/USD keeps on pushing lower after the break of the uptrend channel. Key resistance is given at 1.1352 (23/08/2016 high) then 1.1428 (23/06/2016 high). Hourly support at 1.1245 (24/05/2016 low) has been broken. The road is wide-open for further decline. • In the longer term, the technical structure favours a very long-term bearish bias as long as resistance at 1.1714 (24/08/2015 high) holds. The pair is trading in range since the start of 2015. Strong support is given at 1.0458 (16/03/2015 low). However, the current technical structure since last December implies a gradual increase.
Yann Quelenn ¦ Market Strategist e-mail: [email protected]
30 August 2016DAILY TECHNICAL REPORT

Page 3 | 14
GBP / USD
Weakening.
• GBP/USD is still trading above 1.3000. Hourly resistance can be found at 1.3279 (26/08/2016 high) and 1.3372 (03/08/2016 high). Hourly support can be found at 1.3024 (19/08/2016 low). Expected to show continued weakness. • The long-term technical pattern is even more negative since the Brexit vote has paved the way for further decline. Long-term support given at 1.0520 (01/03/85) represents a decent target. Long-term resistance is given at 1.5018 (24/06/2015) and would indicate a long-term reversal in the negative trend. Yet, it is very unlikely at the moment.
30 August 2016DAILY TECHNICAL REPORT
Yann Quelenn ¦ Market Strategist e-mail: [email protected]

Page 4 | 14
USD / JPY
Consolidating.
• USD/JPY is approaching hourly resistance given at 102.83 (02/08/2016 high). Strong support is given at 99.02 (24/06/2016 low). Expected further consolidation. • We favour a long-term bearish bias. Support is now given at 96.57 (10/08/2013 low). A gradual rise towards the major resistance at 135.15 (01/02/2002 high) seems absolutely unlikely. Expected to decline further support at 93.79 (13/06/2013 low).
30 August 2016DAILY TECHNICAL REPORT
Yann Quelenn ¦ Market Strategist e-mail: [email protected]

Page 5 | 14
USD / CHF
Trading around 200-DMA.
• USD/CHF is pushing higher. The road is still wide-open for further strengthening. Hourly resistance lies at 0.9956 (30/05/2016 high). Hourly support can be found at 0.9522 (23/06/2016 low). Expected to show further bullish move. • In the long-term, the pair is still trading in range since 2011 despite some turmoil when the SNB unpegged the CHF. Key support can be found 0.8986 (30/01/2015 low). The technical structure favours nonetheless a long term bullish bias since the unpeg in January 2015.
30 August 2016DAILY TECHNICAL REPORT
Yann Quelenn ¦ Market Strategist e-mail: [email protected]

Page 6 | 14
USD / CAD
Continued increase.
• USD/CAD has also broken resistance at 1.3025 (26/08/2016 high) which confirms deeper buying interests towards. Support can be found at 1.2832 (26/08/2016 low) and 1.2764 (18/08/2016 low). • In the longer term, the pair is still trading below its 200-day moving average. Strong resistance is given at 1.4690 (22/01/2016 high). Long-term support can be found at 1.2461 (16/03/2015 low). The pair is likely in a consolidation phase within a new long-term decline.
30 August 2016DAILY TECHNICAL REPORT
30 August 2016DAILY TECHNICAL REPORT
Yann Quelenn ¦ Market Strategist e-mail: [email protected]

Page 7 | 14
AUD / USD
Heading lower.
• AUD/USD lies still within a downtrend channel. Hourly support can be found at 0.7525 (29/08/2016 low). Key resistance can be found at 0.7756 (10/08/2016 high). The bullish breakout was a false bullish signal and we favour further weakness. • In the long-term, we are waiting for further signs that the current downtrend is ending. Key supports stand at 0.6009 (31/10/2008 low) . A break of the key resistance at 0.8295 (15/01/2015 high) is needed to invalidate our long-term bearish view.
30 August 2016DAILY TECHNICAL REPORT
Yann Quelenn ¦ Market Strategist e-mail: [email protected]

Page 8 | 14
EUR / CHF
Consolidating after breaking resistance at 1.0945.
• EUR/CHF is consolidating after breaking resistance at 1.0945 (12/07/2016 low). A significant support lies at 1.0794 (06/07/2016 low). Selling pressures are certainly very important at this level. Expected to further decline. • In the longer term, the technical structure remains positive. Resistance can be found at 1.1200 (04/02/2015 high). Yet,the ECB's QE programme is likely to cause persistent selling pressures on the euro, which should weigh on EUR/CHF. Supports can be found at 1.0184 (28/01/2015 low) and 1.0082 (27/01/2015 low).
30 August 2016DAILY TECHNICAL REPORT
Yann Quelenn ¦ Market Strategist e-mail: [email protected]

Page 9 | 14
EUR / JPY
One-month high.
• EUR/JPY is still strengthening after breaking hourly resistance at 114.23 (21/08/2016 high). A key support is located at 110.83 (06/07/2016 low). Closest support lies at 112.32 (05/08/2016 low). Buying pressures seem relatively significant at this point. • In the longer term, the technical structure validates a medium-term succession of lower highs and lower lows. As a result, the resistance at 149.78 (08/12/2014 high) has likely marked the end of the rise that started in July 2012. The road is now wide open towards strong support at 94.12 (24/07/2012 low).
30 August 2016DAILY TECHNICAL REPORT
Yann Quelenn ¦ Market Strategist e-mail: [email protected]

Page 10 | 14
EUR / GBP
Low volatility.
• EUR/GBP is back below 0.8600. The short-term technical structure remains positive. Hourly resistance is given at 0.8724 (16/08/2016 high) and hourly support is located at 0.8518 (10/08/2016 low). • In the long-term, the pair is currently recovering from recent lows in 2015. The technical structure suggests a growing upside momentum. The pair is trading far above from its 200 DMA. Strong resistance can be found at 0.8815 (25/02/2013 high).
30 August 2016DAILY TECHNICAL REPORT
Yann Quelenn ¦ Market Strategist e-mail: [email protected]
Page 11 | 14
GOLD (in USD)
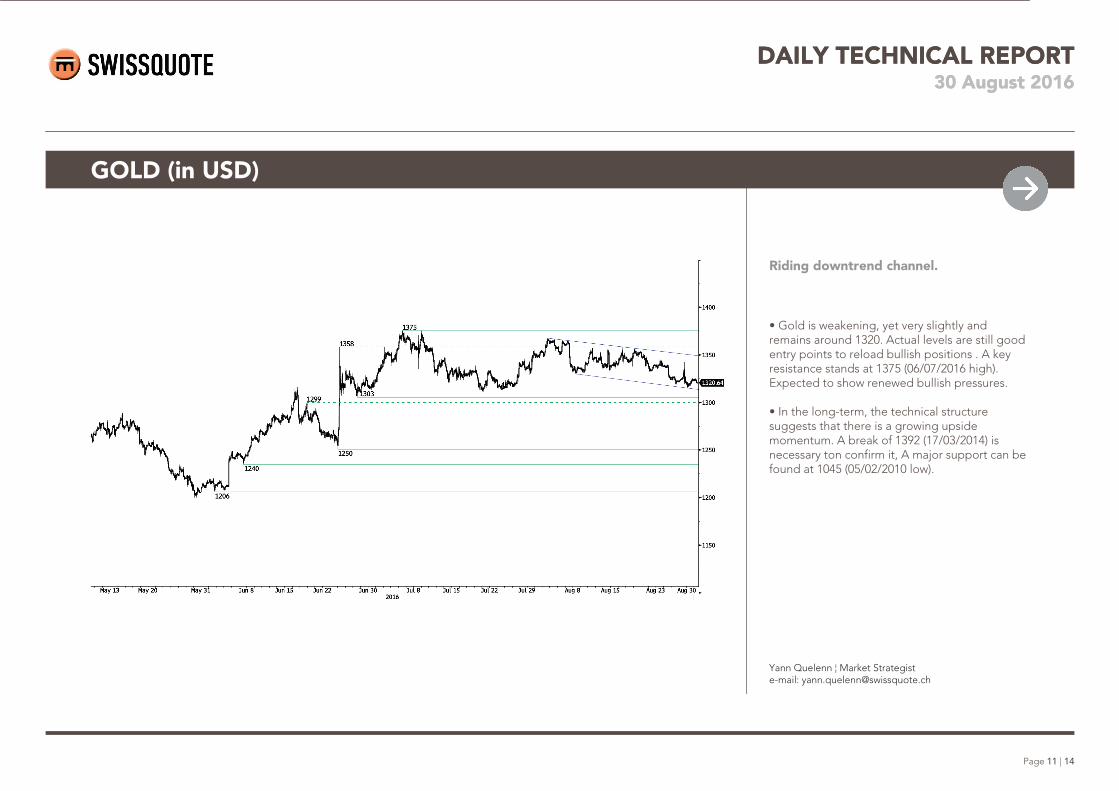
Riding downtrend channel.
• Gold is weakening, yet very slightly and remains around 1320. Actual levels are still good entry points to reload bullish positions . A key resistance stands at 1375 (06/07/2016 high). Expected to show renewed bullish pressures. • In the long-term, the technical structure suggests that there is a growing upside momentum. A break of 1392 (17/03/2014) is necessary ton confirm it, A major support can be found at 1045 (05/02/2010 low).
30 August 2016DAILY TECHNICAL REPORT
30 August 2016DAILY TECHNICAL REPORT
Yann Quelenn ¦ Market Strategist e-mail: [email protected]

Page 12 | 14
SILVER (in USD)
Ready for a new leg higher.
• Silver is now pushing back higher. Hourly support given at 18.19 (30/06/2016 low). Hourly resistance can now be found at 19.12 (23/08/2016 high). Strong resistance is given at 21.13 (04/07/2016 high). Expected to show further continued weakness. • In the long-term, the metal is now in an increasing uptrend. Resistance is located at 25.11 (28/08/2013 high). Strong support can be found at 11.75 (20/04/2009).
30 August 2016DAILY TECHNICAL REPORT
Yann Quelenn ¦ Market Strategist e-mail: [email protected]

Page 13 | 14
Crude Oil (in USD)
Direction-less.
• Crude oil's bullish momentum has ended as the pair is way into a range-bound pattern. Hourly resistance can be found at 48.75 (19/08/2016 high). A break of hourly support given at 45.84 (17/08/2016 low) would confirm a deeper bearish move. Time to reload bearish position. • In the long-term, crude oil is now recovering from its sharp decline and the signs of recovery are now strong. Strong support lies at 24.82 (13/11/2002) while strong resistance at 50.96 (09/10/2015 high) has been broken. Crude oil is holding way above its 200-Day Moving Average. Expected to reach 60 before year-end.
30 August 2016DAILY TECHNICAL REPORT
Yann Quelenn ¦ Market Strategist e-mail: [email protected]

Page 14 | 14
DISCLAIMER
30 August 2016DAILY TECHNICAL REPORT
This report is for distribution only under such circumstances as may be permitted by applicable law. Nothing in this report constitutes a representation that any investment strategy or recommendation contained herein is suitable or appropriate to a recipient’s individual circumstances or otherwise constitutes a personal recommendation. It is published solely for information purposes, it does not constitute an advertisement and is not to be construed as a solicitation or an offer to buy or sell any securities or related financial instruments in any jurisdiction. No representation or warranty, either express or implied, is provided in relation to the accuracy, completeness or reliability of the information contained herein, except with respect to information concerning Swissquote Bank, its subsidiaries and affiliates, nor is it intended to be a complete statement or summary of the securities, markets or developments referred to in the report. Swissquote Bank does not undertake that investors will obtain profits, nor will it share with investors any investment profits nor accept any liability for any investment losses. Investments involve risks and investors should exercise prudence in making their investment decisions. The report should not be regarded by recipients as a substitute for the exercise of their own judgment. Any opinions expressed in this report are for information purpose only and are subject to change without notice and may differ or be contrary to opinions expressed by other business areas or groups of Swissquote Bank as a result of using different assumptions and criteria. Swissquote Bank shall not be bound or liable for any transaction, result, gain or loss, based on this report, in whole or in part. Research will initiate, update and cease coverage solely at the discretion of Swissquote Bank Strategy Desk. The analysis contained herein is based on numerous assumptions. Different assumptions could result in materially different results. The analyst(s) responsible for the preparation of this report may interact with trading desk personnel, sales personnel and other constituencies for the purpose of gathering, synthesizing and interpreting market information. Swissquote Bank is under no obligation toupdate or keep current the information contained herein and not liable for any result, gain or loss, based on this information, in whole or in part. Swissquote Bank specifically prohibits the redistribution of this material in whole or in part without the written permission of Swissquote Bank and Swissquote Bank accepts no liability whatsoever for the actions of third parties in this respect. © Swissquote Bank 2014. All rights reserved.
While every effort has been made to ensure that the data quoted and used for the research behind this document is reliable, there is no guarantee that it is correct, and Swissquote Bank and its subsidiaries can accept no liability whatsoever in respect of any errors or omissions, or regarding the accuracy, completeness or reliability of the information contained herein. This document does not constitute a recommendation to sell and/or buy any financial products and is not to be considered as a solicitation and/or an offer to enter into any transaction. This document is a piece of economic research and is not intended to constitute investment advice, nor to solicit dealing in securities or in any other kind of investments. Although every investment involves some degree of risk, the risk of loss trading off-exchange forex contracts can be substantial. Therefore if you are considering trading in this market, you should be aware of the risks associated with this product so you can make an informed decision prior to investing. The material presented here is not to be construed as trading advice or strategy. Swissquote Bank makes a strong effort to use reliable, expansive information, but we make no representation that it is accurate or complete. In addition, we have no obligation to notify you when opinions or data in this material change. Any prices stated in this report are for information purposes only and do not represent valuations for individual securities or other instruments.