fourth quarter 2015 earnings conference call presentation · 2/3/2016 fourth quarter 2015 earnings...
TRANSCRIPT

2/3/2016
Fourth Quarter 2015 Earnings Conference Call Presentation
February 3, 2016
Forward‐Looking Statements
2
This presentation contains forward-looking statements within the meaning of federal securities laws regarding MPLX LP ("MPLX"), Marathon Petroleum Corporation ("MPC"), and MarkWest Energy Partners, L.P. ("MarkWest"). These forward-looking statements relate to, among other things, expectations, estimates and projections concerning the business and operations of MPLX, MPC, and MarkWest. You can identify forward-looking statements by words such as "anticipate," "believe," "estimate," "expect," "forecast", "goal," "guidance," "imply," "objective," "opportunity,” "outlook," "plan," "project," "prospective," "position," "potential," "pursue," "seek," "target," "could," "may," "should," "would," "will" or other similar expressions that convey the uncertainty of future events or outcomes. Such forward-looking statements are not guarantees of future performance and are subject to risks, uncertainties and other factors, some of which are beyond the companies' control and are difficult to predict. In addition to other factors described herein that could cause MPLX's actual results to differ materially from those implied in these forward-looking statements, negative capital market conditions, including a persistence or increase of the current yield on common units, which is higher than historical yields, could adversely affect MPLX's ability to meet its distribution growth guidance. Factors that could cause MPLX's or MarkWest's actual results to differ materially from those implied in the forward-looking statements include: risk that the synergies from the MPLX/MarkWest merger transaction may not be fully realized or may take longer to realize than expected; disruption from the MPLX/MarkWest merger transaction making it more difficult to maintain relationships with customers, employees or suppliers; risks relating to any unforeseen liabilities of MarkWest; the adequacy of MPLX's capital resources and liquidity, including, but not limited to, availability of sufficient cash flow to pay MPLX’s distributions, and the ability to successfully execute both companies' business plans and growth strategies; the timing and extent of changes in commodity prices and demand for crude oil, refined products, feedstocks or other hydrocarbon-based products; volatility in and/or degradation of market and industry conditions; completion of midstream infrastructure by competitors; disruptions due to equipment interruption or failure, including electrical shortages and power grid failures; the suspension, reduction or termination of MPC's obligations under MPLX's commercial agreements; modifications to earnings and distribution growth objectives; the level of support from MPC, including dropdowns, alternative financing arrangements, taking equity units, and other methods of sponsor support, as a result of the capital allocation needs of the enterprise as a whole and its ability to provide support on commercially reasonable terms; federal and state environmental, economic, health and safety, energy and other policies and regulations; changes to MPLX's capital budget; other risk factors inherent to MPLX or MarkWest's industry; and the factors set forth under the heading "Risk Factors" in MPLX's Annual Report on Form 10-K for the year ended Dec. 31, 2014, filed with the SEC; and the factors set forth under the heading "Risk Factors" in MarkWest's Annual Report on Form 10-K for the year ended Dec. 31, 2014, and Quarterly Report on Form 10-Q for the quarter ended Sept. 30, 2015, filed with the SEC (former ticker symbol: MWE).
Forward‐Looking Statements (cont’d)
3
These risks, as well as other risks associated with MPLX, MarkWest and the merger transaction, are also more fully discussed in the joint proxy statement and prospectus included in the registration statement on Form S-4 filed by MPLX and declared effective by the SEC on Oct. 29, 2015, as supplemented. Factors that could cause MPC's actual results to differ materially from those implied in the forward-looking statements include: risks described above relating to MPLX, MarkWest and the MPLX/MarkWest merger transaction; changes to the expected construction costs and timing of pipeline projects; continued/further volatility in and/or degradation of market and industry conditions; the availability and pricing of crude oil and other feedstocks; slower growth in domestic and Canadian crude supply; the effects of the lifting of the U.S. crude oil export ban; completion of pipeline capacity to areas outside the U.S. Midwest; consumer demand for refined products; transportation logistics; the reliability of processing units and other equipment; MPC's ability to successfully implement growth opportunities; modifications to MPLX earnings and distribution growth objectives; federal and state environmental, economic, health and safety, energy and other policies and regulations; including the cost of compliance with the Renewable Fuel Standard; MPC’s ability to successfully integrate the acquired Hess retail operations and achieve the strategic and other expected objectives relating to the acquisition; changes to MPC’s capital budget; other risk factors inherent to MPC’s industry; and the factors set forth under the heading "Risk Factors" in MPC's Annual Report on Form 10-K for the year ended Dec. 31, 2014, filed with Securities and Exchange Commission (SEC). In addition, the forward-looking statements included herein could be affected by general domestic and international economic and political conditions. Unpredictable or unknown factors not discussed here, in MPLX's Form 10-K, in MPC's Form 10-K, or in MarkWest's Form 10-K and Form 10-Qs could also have material adverse effects on forward-looking statements. Copies of MPLX's Form 10-K are available on the SEC website, MPLX's website at http://ir.mplx.com or by contacting MPLX's Investor Relations office. Copies of MPC's Form 10-K are available on the SEC website, MPC's website at http://ir.marathonpetroleum.com or by contacting MPC's Investor Relations office. Copies of MarkWest's Form 10-K and Form 10-Qs are available on the SEC website (former ticker symbol: MWE), MarkWest's website at http://investor.markwest.com or by contacting MPLX's Investor Relations office.
Non-GAAP Financial Measures Adjusted EBITDA and distributable cash flow are non-GAAP financial measures provided in this presentation. Adjusted EBITDA and distributable cash flow reconciliations to the nearest GAAP financial measure are included in the Appendix to this presentation. Adjusted EBITDA and distributable cash flow are not defined by GAAP and should not be considered in isolation or as an alternative to net income attributable to MPLX or other financial measures prepared in accordance with GAAP.
Highlights
Completed strategic combination with MarkWest on Dec. 4, 2015 Reported fourth quarter adjusted EBITDA of $286 million and distributable cash
flow of $227 million with a strong coverage ratio of 1.20x Declared distribution of $0.50 per common unit for the fourth-quarter 2015,
representing in a 29 percent increase in 2015 Continued decline in commodity prices have resulted in a challenging valuation
and higher yield environment for MLPs Revised 2016 distribution growth forecast to 12 - 15 percent MPC offered to contribute its marine assets to the partnership, at a supportive
valuation, anticipated to be funded entirely with MPLX equity issued to MPC
4
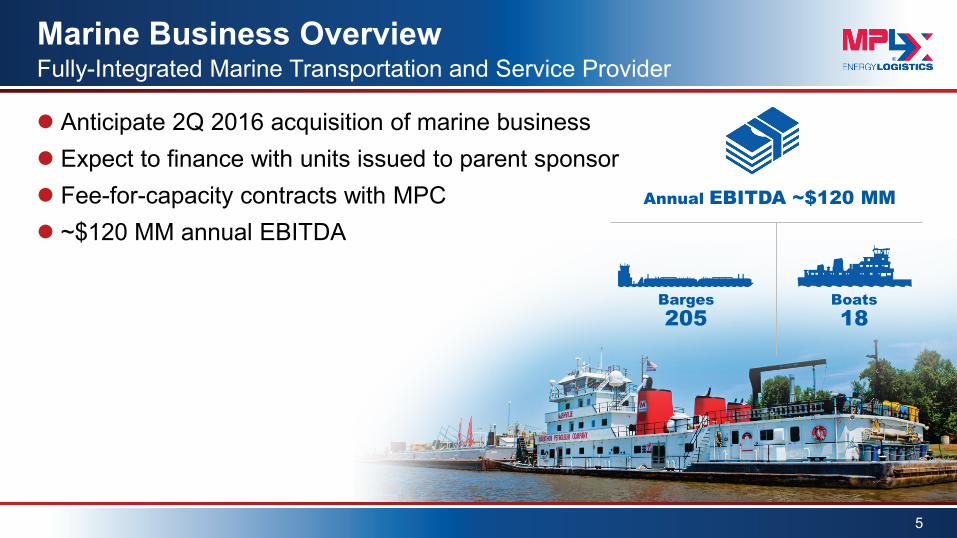
Marine Business Overview
5
Fully-Integrated Marine Transportation and Service Provider
Anticipate 2Q 2016 acquisition of marine business Expect to finance with units issued to parent sponsor Fee-for-capacity contracts with MPC ~$120 MM annual EBITDA
Annual EBITDA ~$120 MM
Barges 205
Boats 18
Logistics & Storage
6
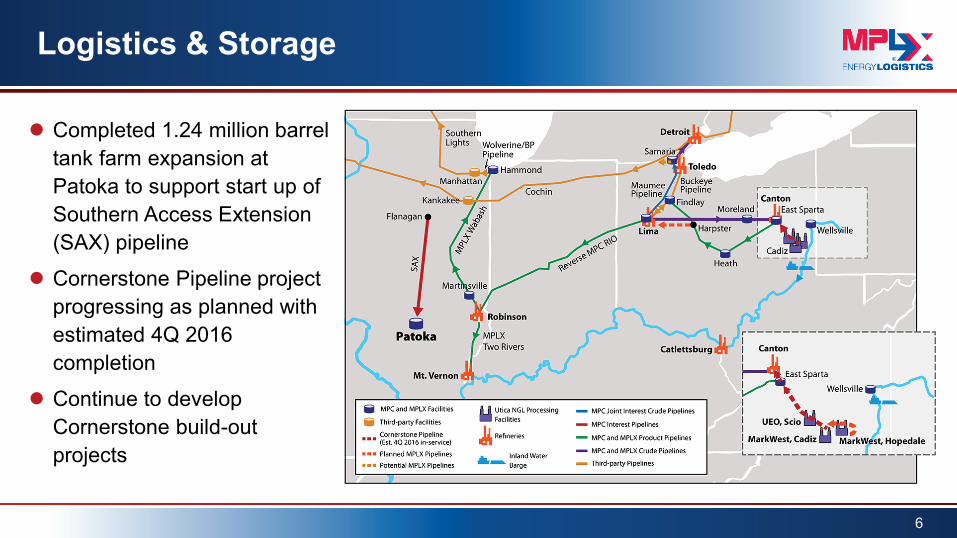
Completed 1.24 million barrel tank farm expansion at Patoka to support start up of Southern Access Extension (SAX) pipeline
Cornerstone Pipeline project progressing as planned with estimated 4Q 2016 completion
Continue to develop Cornerstone build-out projects
Gathering & Processing
7
Marcellus & Utica Processing
Area 4Q15 Average
Capacity (MMcf/d)(a)
4Q15 Average Volume (MMcf/d)
4Q15 Utilization
(%)
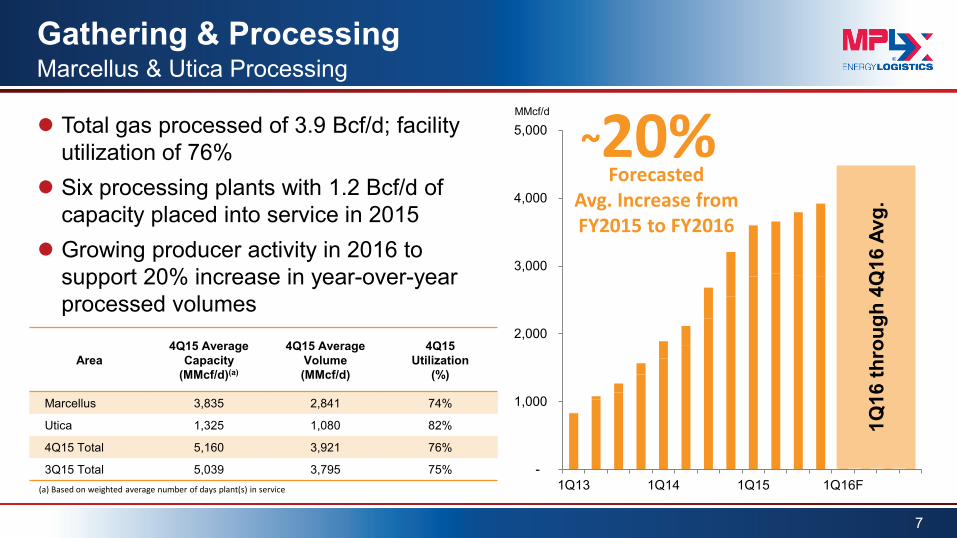
Marcellus 3,835 2,841 74%
Utica 1,325 1,080 82%
4Q15 Total 5,160 3,921 76%
3Q15 Total 5,039 3,795 75% -
1,000
2,000
3,000
4,000
5,000
1Q13 1Q14 1Q15 1Q16F
MMcf/d
Forecasted Avg. Increase from FY2015 to FY2016
~20%
Total gas processed of 3.9 Bcf/d; facility utilization of 76%
Six processing plants with 1.2 Bcf/d of capacity placed into service in 2015
Growing producer activity in 2016 to support 20% increase in year-over-year processed volumes
(a) Based on weighted average number of days plant(s) in service
1Q16
thro
ugh
4Q16
Avg
.
Gathering & Processing
8
Marcellus & Utica Fractionation
Area
4Q15 Average Capacity
(MBbl/d)(a)
4Q15 Average Volume (MBbl/d)
4Q15 Utilization
(%)
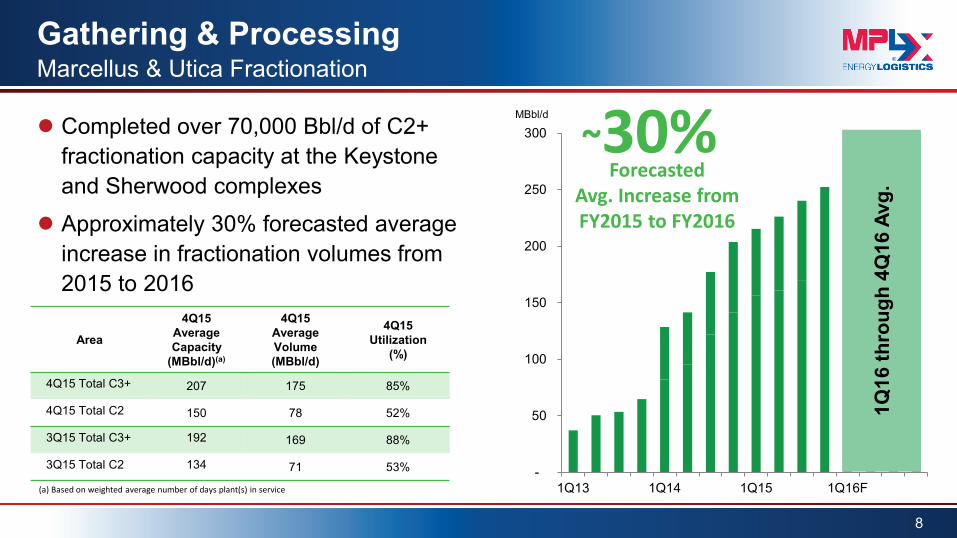
4Q15 Total C3+ 207 175 85%
4Q15 Total C2 150 78 52%
3Q15 Total C3+ 192 169 88%
3Q15 Total C2 134 71 53% -
50
100
150
200
250
300
1Q13 1Q14 1Q15 1Q16F
MBbl/d
Forecasted Avg. Increase from FY2015 to FY2016
~30%
Completed over 70,000 Bbl/d of C2+ fractionation capacity at the Keystone and Sherwood complexes
Approximately 30% forecasted average increase in fractionation volumes from 2015 to 2016
(a) Based on weighted average number of days plant(s) in service
1Q16
thro
ugh
4Q16
Avg
.
-
200
400
600
800
1,000
1,200
1,400
1Q13 1Q14 1Q15 1Q16F
MMcf/d
Gathering & Processing
9
Southwest Processing
Area
4Q15 Average Capacity
(MMcf/d)(a)
4Q15 Average Volume (MMcf/d)
4Q15 Utilization
(%)
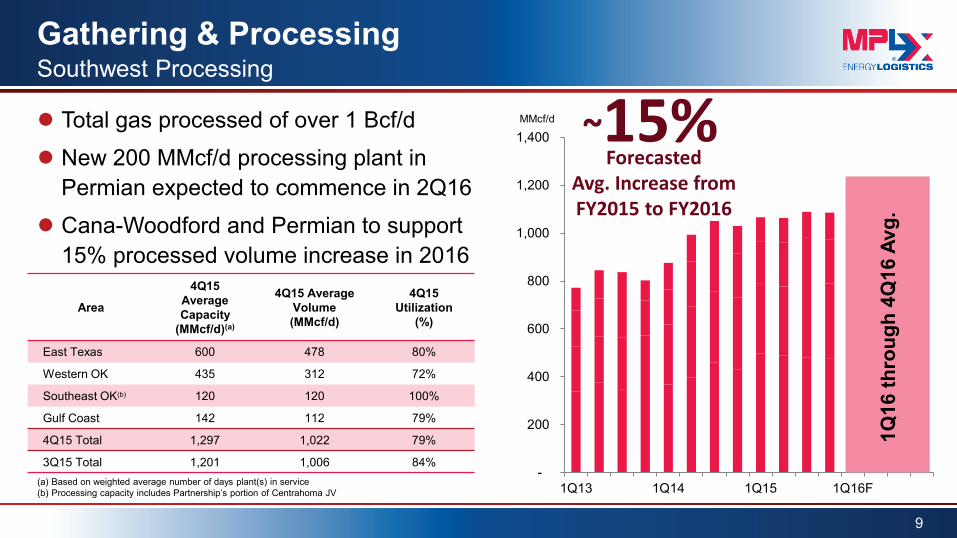
East Texas 600 478 80%
Western OK 435 312 72%
Southeast OK(b) 120 120 100%
Gulf Coast 142 112 79%
4Q15 Total 1,297 1,022 79%
3Q15 Total 1,201 1,006 84%
Total gas processed of over 1 Bcf/d
New 200 MMcf/d processing plant in Permian expected to commence in 2Q16
Cana-Woodford and Permian to support 15% processed volume increase in 2016
~15% Forecasted
Avg. Increase from FY2015 to FY2016
(a) Based on weighted average number of days plant(s) in service (b) Processing capacity includes Partnership’s portion of Centrahoma JV
1Q16
thro
ugh
4Q16
Avg
.
Capital Investment
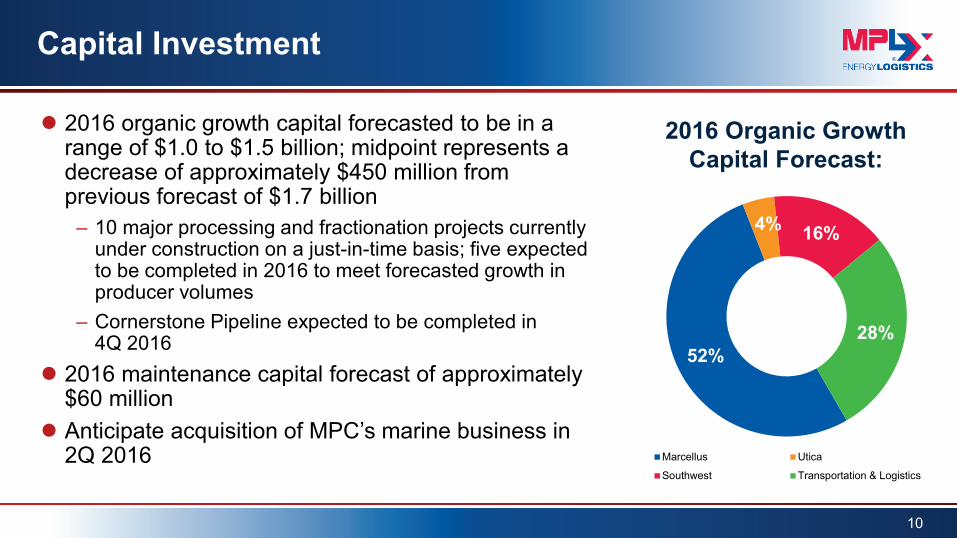
2016 organic growth capital forecasted to be in a range of $1.0 to $1.5 billion; midpoint represents a decrease of approximately $450 million from previous forecast of $1.7 billion
– 10 major processing and fractionation projects currently under construction on a just-in-time basis; five expected to be completed in 2016 to meet forecasted growth in producer volumes
– Cornerstone Pipeline expected to be completed in 4Q 2016
2016 maintenance capital forecast of approximately $60 million
Anticipate acquisition of MPC’s marine business in 2Q 2016
10
2016 Organic Growth Capital Forecast:
52%
4% 16%
28%
Marcellus Utica
Southwest Transportation & Logistics
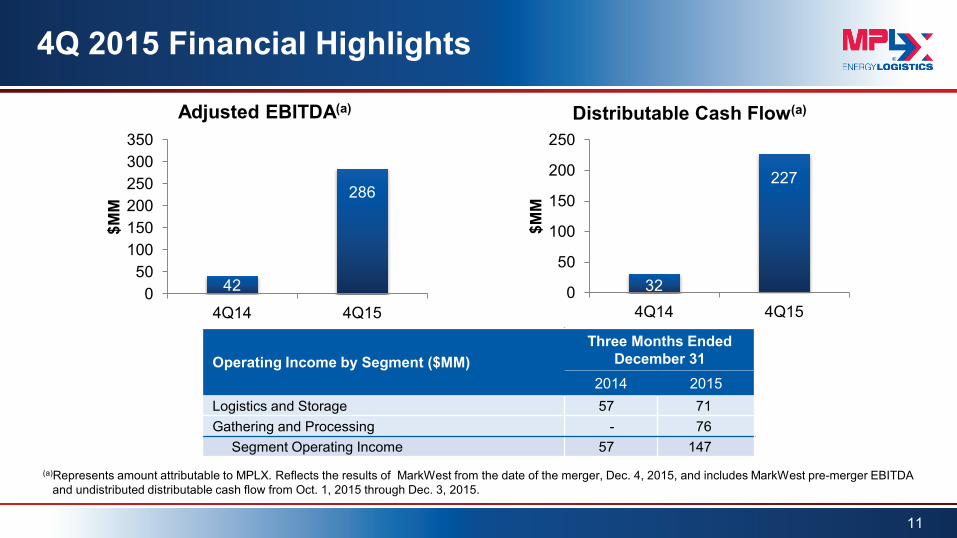
42
286
050
100150200250300350
4Q14 4Q15
$MM
Adjusted EBITDA(a)
4Q 2015 Financial Highlights
11
(a)Represents amount attributable to MPLX. Reflects the results of MarkWest from the date of the merger, Dec. 4, 2015, and includes MarkWest pre-merger EBITDA and undistributed distributable cash flow from Oct. 1, 2015 through Dec. 3, 2015.
32
227
0
50
100
150
200
250
4Q14 4Q15
$MM
Distributable Cash Flow(a)
Operating Income by Segment ($MM) Three Months Ended
December 31 2014 2015
Logistics and Storage 57 71 Gathering and Processing - 76 Segment Operating Income 57 147
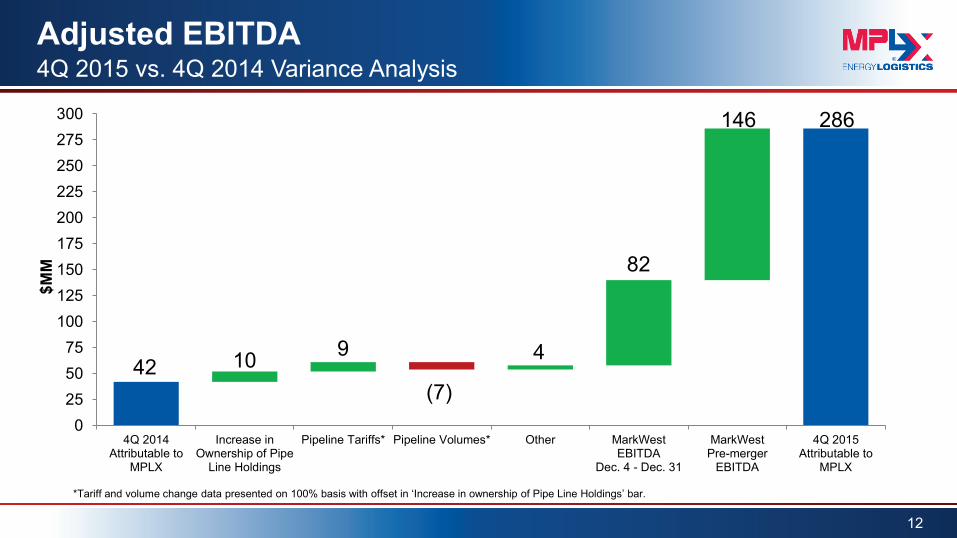
Adjusted EBITDA
12
4Q 2015 vs. 4Q 2014 Variance Analysis
42 10 9
(7)
4
82
146 286
0255075
100125150175200225250275300
4Q 2014Attributable to
MPLX
Increase inOwnership of Pipe
Line Holdings
Pipeline Tariffs* Pipeline Volumes* Other MarkWestEBITDA
Dec. 4 - Dec. 31
MarkWestPre-merger
EBITDA
4Q 2015Attributable to
MPLX
$MM
*Tariff and volume change data presented on 100% basis with offset in ‘Increase in ownership of Pipe Line Holdings’ bar.
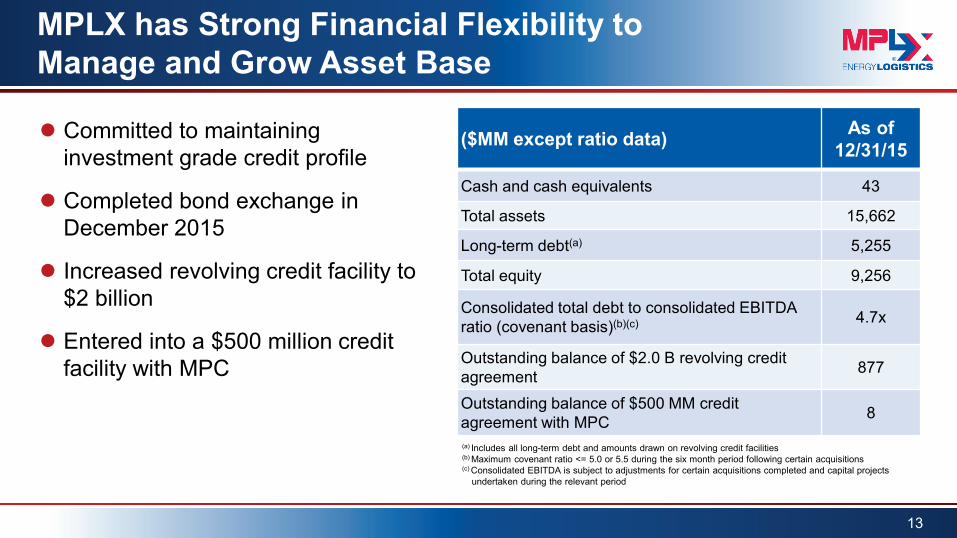
MPLX has Strong Financial Flexibility to Manage and Grow Asset Base
Committed to maintaining investment grade credit profile
Completed bond exchange in December 2015
Increased revolving credit facility to $2 billion
Entered into a $500 million credit facility with MPC
13
($MM except ratio data) As of 12/31/15
Cash and cash equivalents 43
Total assets 15,662
Long-term debt(a) 5,255
Total equity 9,256
Consolidated total debt to consolidated EBITDA ratio (covenant basis)(b)(c) 4.7x
Outstanding balance of $2.0 B revolving credit agreement 877
Outstanding balance of $500 MM credit agreement with MPC 8
(a) Includes all long-term debt and amounts drawn on revolving credit facilities (b) Maximum covenant ratio <= 5.0 or 5.5 during the six month period following certain acquisitions (c) Consolidated EBITDA is subject to adjustments for certain acquisitions completed and capital projects undertaken during the relevant period
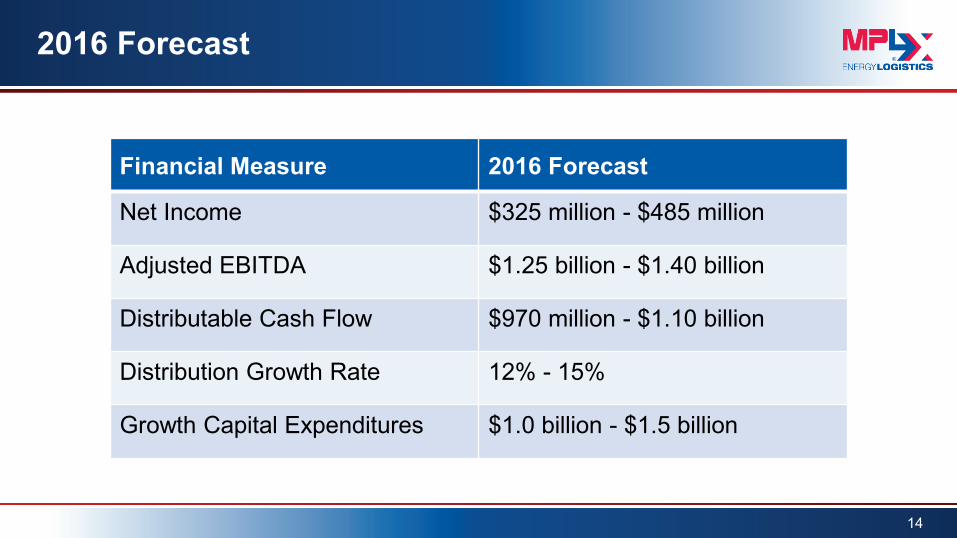
2016 Forecast
14
$X,X
XX-$
X,XX
X
$XXX
-$XX
X
Financial Measure 2016 Forecast
Net Income $325 million - $485 million
Adjusted EBITDA $1.25 billion - $1.40 billion
Distributable Cash Flow $970 million - $1.10 billion
Distribution Growth Rate 12% - 15%
Growth Capital Expenditures $1.0 billion - $1.5 billion
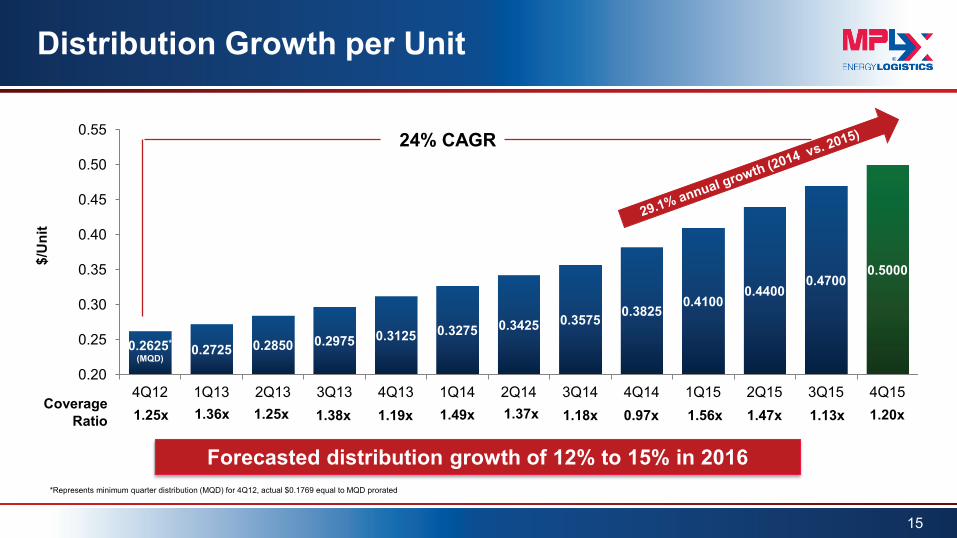
0.2625* (MQD)
0.2725 0.2850 0.2975 0.3125 0.3275 0.3425 0.3575 0.3825 0.4100
0.4400 0.4700
0.5000
0.20
0.25
0.30
0.35
0.40
0.45
0.50
0.55
4Q12 1Q13 2Q13 3Q13 4Q13 1Q14 2Q14 3Q14 4Q14 1Q15 2Q15 3Q15 4Q15
$/U
nit
1.49x 1.37x 1.56x 1.47x 1.20x
Distribution Growth per Unit
*Represents minimum quarter distribution (MQD) for 4Q12, actual $0.1769 equal to MQD prorated
Coverage Ratio 1.36x 1.25x 1.25x 1.38x 1.19x
24% CAGR
0.97x 1.18x
15
1.13x
Forecasted distribution growth of 12% to 15% in 2016

16
Appendix
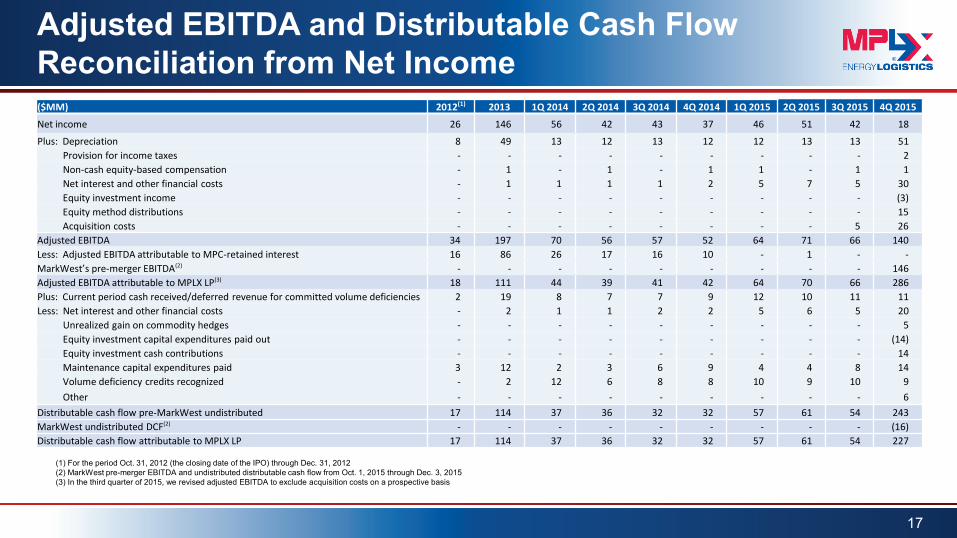
Adjusted EBITDA and Distributable Cash Flow Reconciliation from Net Income
17
(1) For the period Oct. 31, 2012 (the closing date of the IPO) through Dec. 31, 2012 (2) MarkWest pre-merger EBITDA and undistributed distributable cash flow from Oct. 1, 2015 through Dec. 3, 2015 (3) In the third quarter of 2015, we revised adjusted EBITDA to exclude acquisition costs on a prospective basis
($MM) 2012(1) 2013 1Q 2014 2Q 2014 3Q 2014 4Q 2014 1Q 2015 2Q 2015 3Q 2015 4Q 2015
Net income 26 146 56 42 43 37 46 51 42 18
Plus: Depreciation 8 49 13 12 13 12 12 13 13 51 Provision for income taxes - - - - - - - - - 2 Non-cash equity-based compensation - 1 - 1 - 1 1 - 1 1 Net interest and other financial costs - 1 1 1 1 2 5 7 5 30 Equity investment income - - - - - - - - - (3) Equity method distributions - - - - - - - - - 15 Acquisition costs - - - - - - - - 5 26 Adjusted EBITDA 34 197 70 56 57 52 64 71 66 140 Less: Adjusted EBITDA attributable to MPC-retained interest 16 86 26 17 16 10 - 1 - - MarkWest’s pre-merger EBITDA(2) - - - - - - - - - 146 Adjusted EBITDA attributable to MPLX LP(3) 18 111 44 39 41 42 64 70 66 286 Plus: Current period cash received/deferred revenue for committed volume deficiencies 2 19 8 7 7 9 12 10 11 11 Less: Net interest and other financial costs - 2 1 1 2 2 5 6 5 20 Unrealized gain on commodity hedges - - - - - - - - - 5 Equity investment capital expenditures paid out - - - - - - - - - (14) Equity investment cash contributions - - - - - - - - - 14 Maintenance capital expenditures paid 3 12 2 3 6 9 4 4 8 14 Volume deficiency credits recognized - 2 12 6 8 8 10 9 10 9 Other - - - - - - - - - 6 Distributable cash flow pre-MarkWest undistributed 17 114 37 36 32 32 57 61 54 243 MarkWest undistributed DCF(2) - - - - - - - - - (16) Distributable cash flow attributable to MPLX LP 17 114 37 36 32 32 57 61 54 227
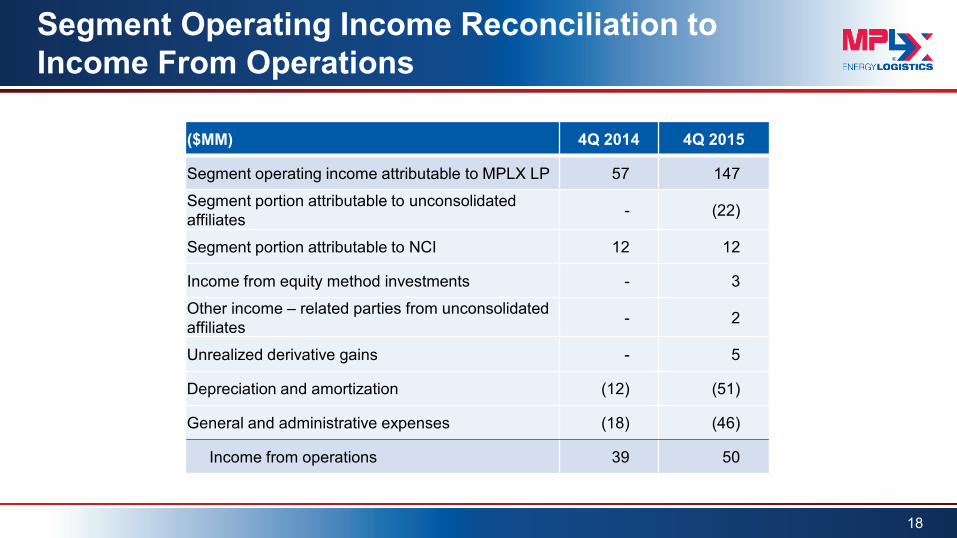
Segment Operating Income Reconciliation to Income From Operations
18
($MM) 4Q 2014 4Q 2015
Segment operating income attributable to MPLX LP 57 147 Segment portion attributable to unconsolidated affiliates - (22)
Segment portion attributable to NCI 12 12
Income from equity method investments - 3
Other income – related parties from unconsolidated affiliates - 2
Unrealized derivative gains - 5
Depreciation and amortization (12) (51)
General and administrative expenses (18) (46)
Income from operations 39 50
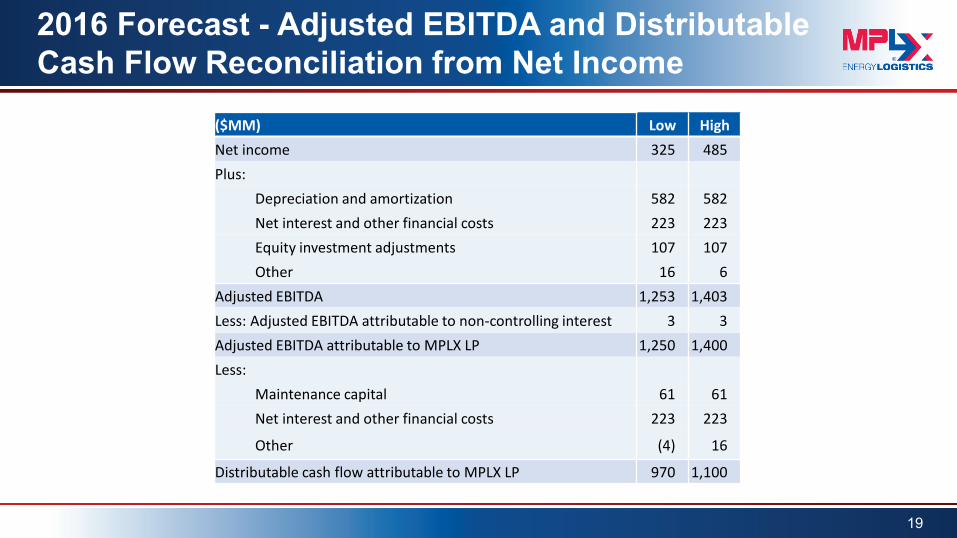
2016 Forecast - Adjusted EBITDA and Distributable Cash Flow Reconciliation from Net Income
19
($MM) Low High Net income 325 485 Plus: Depreciation and amortization 582 582 Net interest and other financial costs 223 223 Equity investment adjustments 107 107 Other 16 6 Adjusted EBITDA 1,253 1,403 Less: Adjusted EBITDA attributable to non-controlling interest 3 3 Adjusted EBITDA attributable to MPLX LP 1,250 1,400 Less: Maintenance capital 61 61 Net interest and other financial costs 223 223
Other (4) 16
Distributable cash flow attributable to MPLX LP 970 1,100
Doddridge
Marshall
Wetzel
Harrison
Noble
Butler
Washington
WEST VIRGINIA
PENNSYLVANIA
OHIO
Washington
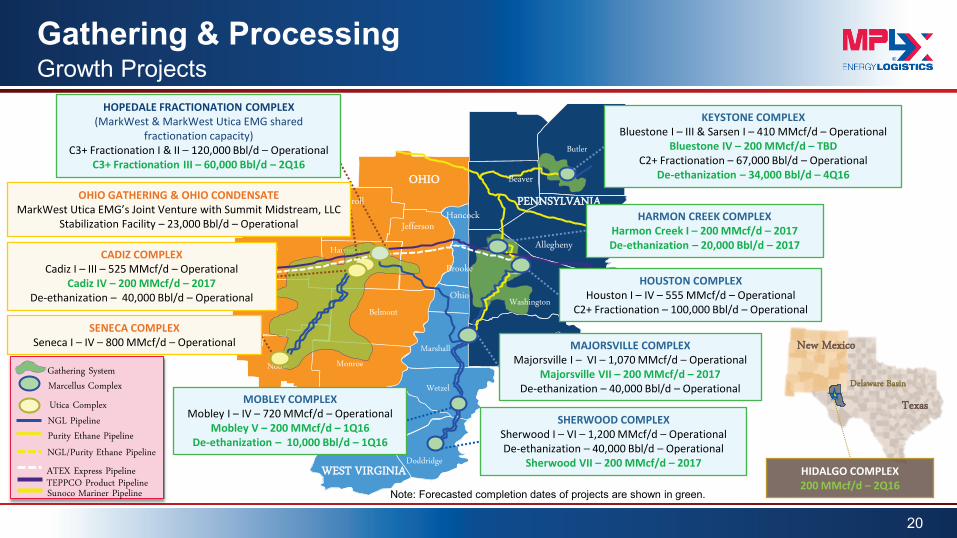
Gathering & Processing
20
Growth Projects
Utica Complex
ATEX Express Pipeline
Purity Ethane Pipeline NGL Pipeline
NGL/Purity Ethane Pipeline
Sunoco Mariner Pipeline
Marcellus Complex Gathering System
TEPPCO Product Pipeline
Belmont
Monroe
Jefferson
Carroll
Tuscarawas
Beaver
Allegheny
Brooke
Hancock
Ohio
Greene
KEYSTONE COMPLEX Bluestone I – III & Sarsen I – 410 MMcf/d – Operational
Bluestone IV – 200 MMcf/d – TBD C2+ Fractionation – 67,000 Bbl/d – Operational
De-ethanization – 34,000 Bbl/d – 4Q16
HARMON CREEK COMPLEX Harmon Creek I – 200 MMcf/d – 2017 De-ethanization – 20,000 Bbl/d – 2017
HOUSTON COMPLEX Houston I – IV – 555 MMcf/d – Operational
C2+ Fractionation – 100,000 Bbl/d – Operational
MAJORSVILLE COMPLEX Majorsville I – VI – 1,070 MMcf/d – Operational
Majorsville VII – 200 MMcf/d – 2017 De-ethanization – 40,000 Bbl/d – Operational
MOBLEY COMPLEX Mobley I – IV – 720 MMcf/d – Operational
Mobley V – 200 MMcf/d – 1Q16 De-ethanization – 10,000 Bbl/d – 1Q16
SHERWOOD COMPLEX Sherwood I – VI – 1,200 MMcf/d – Operational De-ethanization – 40,000 Bbl/d – Operational
Sherwood VII – 200 MMcf/d – 2017
HOPEDALE FRACTIONATION COMPLEX (MarkWest & MarkWest Utica EMG shared
fractionation capacity) C3+ Fractionation I & II – 120,000 Bbl/d – Operational
C3+ Fractionation III – 60,000 Bbl/d – 2Q16
CADIZ COMPLEX Cadiz I – III – 525 MMcf/d – Operational
Cadiz IV – 200 MMcf/d – 2017 De-ethanization – 40,000 Bbl/d – Operational
SENECA COMPLEX Seneca I – IV – 800 MMcf/d – Operational
OHIO GATHERING & OHIO CONDENSATE MarkWest Utica EMG’s Joint Venture with Summit Midstream, LLC
Stabilization Facility – 23,000 Bbl/d – Operational
HIDALGO COMPLEX 200 MMcf/d – 2Q16
Texas
New Mexico
Delaware Basin
Note: Forecasted completion dates of projects are shown in green.

21