fourth quarter and full year 2020 earnings presentation
TRANSCRIPT

Fourth Quarter and Full Year 2020
Earnings Presentation
March 11, 2021

2
Cautionary Statements
Forward-Looking Statements
In addition to historical information, this press release contains forward-looking statements within the meaning of Section 27A of the Securities Act of 1933, as
amended, Section 21E of the Securities Exchange Act of 1934, as amended and the Private Securities Litigation Reform Act of 1995. Forward-looking statements,
written, oral or otherwise made, represent the Company’s expectation or belief concerning future events. Without limiting the foregoing, the words “believes,”
“expects,” “may,” “will,” “should,” “seeks,” “intends,” “plans,” “strives,” “goal,” “estimates,” “forecasts,” “projects” or “anticipates” or the negative of these terms and
similar expressions are intended to identify forward-looking statements. Forward-looking statements may include, among others, statements relating to: our future
financial position and results of operations, business strategy, budgets, projected costs and plans and objectives of management for future operations such as the
expected run-rate savings from lease renegotiations, our believe that we will emerge from the pandemic with a stronger platform, the rate of recovery of our
business and dining room re-openings, our expectation that our strategic initiatives will build momentum, the expected sequential improvement in top-line growth
during 2021 and our expectation that majority of our operating earnings and Adjusted EBITDA will come during the second half of 2021, By nature, forward-looking
statements involve risks and uncertainties that could cause actual results to differ materially from those projected or implied by the forward-looking statement, due
to reasons including, but not limited to, risks related to the COVID-19 outbreak; compliance with our Credit Agreement covenants, competition; general economic
conditions; our ability to successfully implement our business strategy; the success of our initiatives to increase sales and traffic; changes in commodity, energy
and other costs; our ability to attract and retain management and employees; consumer reaction to industry-related public health issues and perceptions of food
safety; our ability to manage our growth; reputational and brand issues; price and availability of commodities; consumer confidence and spending patterns; and
weather conditions. In addition, there may be other factors of which we are presently unaware or that we currently deem immaterial that could cause our actual
results to be materially different from the results referenced in the forward-looking statements. All forward-looking statements contained in this press release are
qualified in their entirety by this cautionary statement. Although we believe that our plans, intentions and expectations are reasonable, we may not achieve our
plans, intentions or expectations. Forward-looking statements are based on current expectations and assumptions and currently available data and are neither
predictions nor guarantees of future events or performance. You should not place undue reliance on forward-looking statements, which speak only as of the date
hereof. See “Risk Factors” and “Cautionary Statement on Forward-Looking Statements” included in our most recent annual report on Form 10-K and other risk
factors described from time to time in subsequent quarterly reports on Form 10-Q or other subsequent filings, all of which are available on our website at
www.potbelly.com. The Company undertakes no obligation to publicly update or revise any forward-looking statement as a result of new information, future events
or otherwise, except as otherwise required by law.
Note Regarding Non-GAAP Measures
This presentation includes financial measures, including adjusted EBITDA, adjusted net income, and shop-level profit margin, that are derived on the basis of
methodologies other than generally accepted accounting principles (“GAAP”). We offer these measures to assist the users of our financial statements in assessing
our financial performance under GAAP, but these measures are non-GAAP measures and investors should not rely on these measures as a substitute for any
GAAP measure. In addition, our non-GAAP financial measures may be different from non-GAAP measures used by other companies, limiting their usefulness for
comparison purposes. Reconciliations of these measures to the GAAP measures we consider most comparable are included in the Financial Appendix.

3
2020 Review: Overcame Challenges, Repositioned Platform
✓Team showed resiliency, persistence, dedication and creativity in navigating 2020
✓Right team, strategy and balance sheet to support faster, more profitable growth
Protected
Cash/Capital
Built Stronger
FoundationDeveloped New
Strategic Plan
Rebuilt
Leadership Team
Aggressively
Control Cost
Pivoted to
Off-Premise
Prioritized
SafetyLeveraged Digital
Investments
$
2020 Results
Revenue: $291.3 Op. Income (Loss): ($71.1)
or (24.4%)**
Adj. EBITDA*: ($32.7)
or (11.2%)**
SSS: (24.7%)
($s in millions)
* See Appendix to this presentation for GAAP to Non-GAAP reconciliations
** As % of total revenue

4
Where We Stand Today: Strategic Successes
▪ Grew Perks membership
and Perks-related sales
▪ Executing against new Five-
Pillar Strategy focused on
'Traffic-Driven Profitability'
▪ Numerous initiatives across
all five pillars currently in
various phases of testing
and/or execution
Traffic-Driven
Profitability
Strategic
Plan
Fortified
Balance
Sheet to
Drive Future
Growth
▪ Completed $16 million
private placement in early
2021
▪ Amended credit facility to
create additional flexibility in
early 2021
▪ Supports last steps of the
pandemic-related recovery
including outstanding
deferred expenses
▪ Provides growth capital
to support new strategic
initiatives
Proactive, deliberate actions to drive profitable growth
Solid
Recovery
Momentum
thru 2020
▪ Exited 2020 with sequential
improvement in SSS over 7
of the last 8 months
▪ Back half 2020 weekly cash
burn reduced to $440k/week
▪ Leveraged suburban
locations, and saw positive
comps at drive-thus and
digital channels
▪ Reopened nearly all closed
non-CBD locations and
expanded hours of operation
to pre-COVID levels
Strong
Foundation
for more
Profitable
Potbelly
▪ Strengthened shop base with
28 permanent shop closures
and 321 leases renegotiated
to date
▪ Completed restructuring to
reduce $3.5 million in annual
corporate expenses
▪ New CEO, CFO, COO, CLO,
and 2 new Board members

5
2021: Recovery, Momentum, then Growth
Business Environment
Potbelly Focus
1H’21 2H’21
▪ Virus wanes
▪ Vaccinations expand/progress
▪ Weather improves
▪ Restrictions slowly lifted and return to work
slowly improves
▪ Continued testing, development and
implementation of multiple traffic-focused
strategic initiatives
▪ Finish building team and talent
▪ Preserving cash and driving operating
efficiencies paramount
▪ Vaccinations scale, moving to herd immunity
▪ Accelerated reduction of restrictions or
eliminated altogether
▪ Consumer dining patterns approach more
historical patterns with significantly fewer
restaurants to choose from
▪ Scale achieved on several Traffic-Driven
Profitability strategic initiatives
▪ Senior Leadership & field teams at full
strength
▪ Shop-type gaps still present, but overall unit-
level economics strengthen significantly
▪ Ability to leverage 90% company-owned
shop portfolio

6
Volume Trend Summary and SSS Improvement
Average Weekly Sales by Shop and SSS Comps
-45%
-40%
-35%
-30%
-25%
-20%
-15%
-10%
-5%
0%
$5,000
$7,000
$9,000
$11,000
$13,000
$15,000
$17,000
$19,000
SS
S
AV
ER
AG
E W
EE
KLY
SA
LE
S (
AW
S)
AWS SSS
COVID-19
Resurgence
Temporary
Impact
First Half Feb
sees
Countrywide
Weather Impacts
2021 YTD → 2020
* Mar 2021 includes period 3 data through March 7, 2021

7
Q4 2020 Q3 2020
Revenue $74.9 $72.7
Same Store Sales (SSS) (19.7%) (21.0%)
GAAP Net Income (Loss) ($16.4) ($13.4)
Adjusted Net Income (Loss)* ($13.7) ($10.0)
Adjusted EBITDA* ($6.9) ($7.3)
G&A/Sales 9.2% 13.5%
COGS/Sales 28.5% 28.7%
Labor/Sales 36.5% 35.8%
Other Operating Expenses/Sales 17.7% 16.8%
Q4 2020 Performance Review: Q/Q
($s in millions)
* See Appendix to this presentation for GAAP to Non-GAAP reconciliations

8
FY 2020 FY 2019
Revenue $291.3 $409.7
Same Store Sales (SSS) (24.7%) (3.0%)
GAAP Net Income (Loss) ($65.4) ($24.0)
Adjusted Net Income (Loss)* ($46.3) $2.8
Adjusted EBITDA* ($32.7) $25.5
G&A/Sales 12.0% 10.9%
COGS/Sales 28.4% 26.6%
Labor/Sales 36.4% 31.6%
Other Operating Expenses/Sales 17.0% 12.3%
Liquidity Position** $44.6 $58.6
FY 2020 Performance Review: Y/Y
($s in millions)
* See Appendix to this presentation for GAAP to Non-GAAP reconciliations** Liquidity Position is defined as cash on hand and availability under the revolving credit facility
9
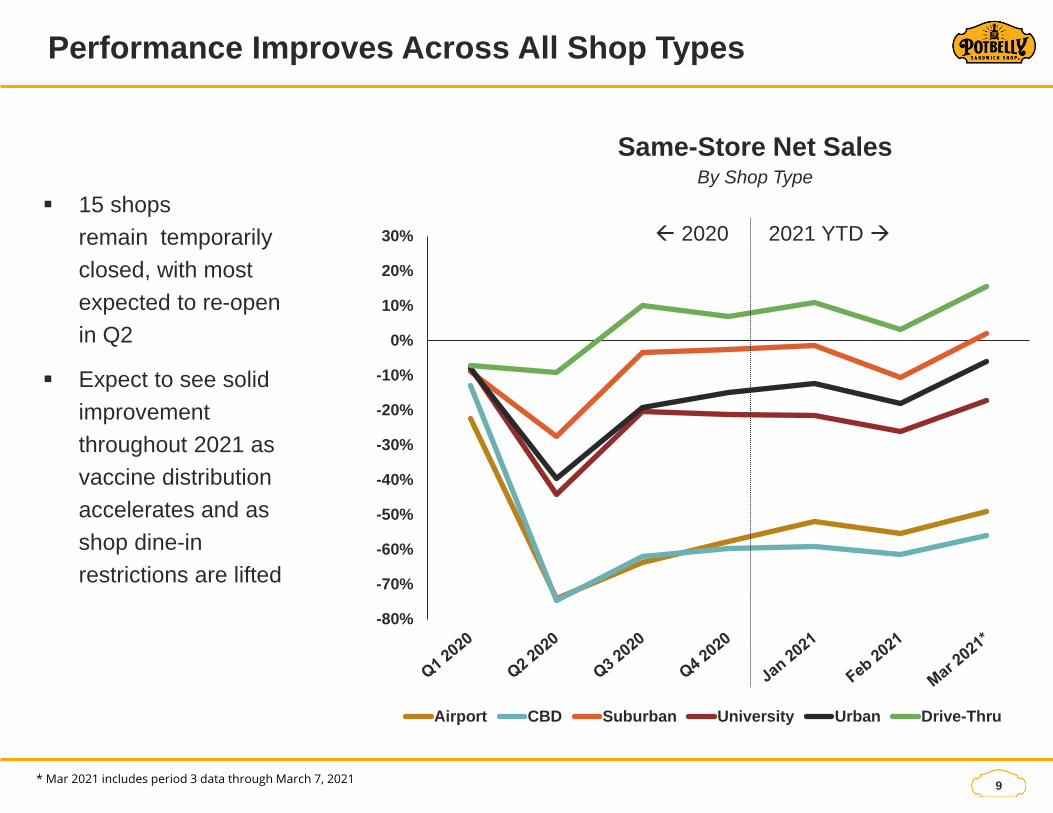
Performance Improves Across All Shop Types
Same-Store Net Sales By Shop Type
▪ 15 shops
remain temporarily
closed, with most
expected to re-open
in Q2
▪ Expect to see solid
improvement
throughout 2021 as
vaccine distribution
accelerates and as
shop dine-in
restrictions are lifted
-80%
-70%
-60%
-50%
-40%
-30%
-20%
-10%
0%
10%
20%
30%
Airport CBD Suburban University Urban Drive-Thru
2021 YTD → 2020
* Mar 2021 includes period 3 data through March 7, 2021

10
Blending In-Shop and Digital Trends
Percentage of Revenue by Service Mode
Catering
Delivery
69%
11%
6%
15%
Q1 2020
In-Shop² Drive ThruCatering Digital³
(1) YTD 2021 includes all 2021 revenues through March 7(2) In-Shop includes all revenue for in-shop and take out services(3) Digital includes all revenue for delivery and pick up services through mobile ordering
47%
4%
10%
39%
YTD 2021¹

11
2021 Outlook: 1H Recovery, 2H Acceleration
Strategic initiatives and economic recovery expected to support sequential
quarterly improvement in performance and return to positive cash flow and
enterprise profitability in second half of 2021
1H’21 2021
▪ Consumer mobility trends expected to
improve as COVID-19 infections
reduce and vaccinations increase
▪ 1H’21 expected to track slightly above
2H’20, with recovery accelerating mid-year
▪ Enter year with roughly $11-12 million in
deferred cash expenses that will be paid
throughout 2021, but weighted to 1H’21
▪ Project shop-level profitability for 1H’21
▪ Expect sequential improvement in top-line
results throughout each quarter of fiscal
2021
▪ Planning 3-5 franchise openings and no
new corporate openings/closures at this
time
▪ Will generate the majority of operating
earnings and Adjusted EBITDA during
2H’21
▪ Expect to deliver both shop-level and
enterprise-level profitability, as well as
positive cash flow, in 2H’21

12
Brand Position
Potbelly is the
sandwich shop
with the craveable
quality and good
vibes of a first-
class dive.

13
Executing Against New Strategy
Potbelly is the sandwich shop with the craveable quality and good vibes of a first-class dive.
Strategic Focus: Traffic-Driven Profitability
Craveable
Quality
Food
at a Great
Value
People
Creating
Good
Vibes
Customer
Experiences
that Drive
Traffic
Growth
Digitally-
Driven
Awareness,
Connection
& Traffic
Franchise
Focused
Development

14
Traffic-Driven Profitability: Multiple Strategic Initiatives
✓ Simplified
menu and
pricing
✓ Sandwich size
& fill test
✓ Increased
value
✓ Modern labor
model
✓ Reduce labor
costs
✓ Optimize
incentive pay
opportunities
✓ Improved
customer
experience
and speed
✓ Off premise
operations
enhancements
✓ Local Shop
Marketing
(LSM)
✓ Tech stack
investments
✓ Grow Perks
members &
frequency
✓ Utilize digital &
social media
✓ Improve shop-
level margins
✓ Develop new
refreshed
shop image
✓ Set foundation
for franchisee
growth
Focused investments in low-risk, high-return areas that will help us drive traffic,
reward loyal customer following and further develop franchise pipeline
Craveable FoodPeople & Good
Vibes
Franchise
Development
Digital
Connections
Experiences &
Traffic

15
APPENDIX:
GAAP to Non-GAAP Reconciliations

16
Q4 2020 FY 2020
Net Loss ($16.4) ($65.4)
Disposals, Impairment & Closures $2.7 $12.3
CEO Transition Costs - $0.8
Proxy Costs - $1.0
Restructuring Costs $1.7 $1.7
Income Tax Adjustments ($1.7) $3.3
Adjusted Net Loss ($13.7) ($46.3)
Q4 & FY 2020 Performance Review: Adjusted Net Income
($s in millions)

17
Q4 2020 FY 2020
Net Loss ($16.4) ($65.4)
Depreciation Expense $4.7 $19.8
Interest Expense $0.3 $1.1
Income Tax Expense (Benefit) $0.05 ($6.5)
EBITDA ($11.3) ($51.0)
Disposals, Impairment & Closures $2.7 $12.3
Stock Compensation $0.03 $2.5
CEO Transition Costs - $0.8
Proxy Costs - $1.0
Restructuring Costs $1.7 $1.7
Adjusted EBITDA ($6.9) ($32.7)
Q4 & FY 2020 Performance Review: Adjusted EBITDA
($s in millions)
18
Use of Non-GAAP Measures
Note Regarding Non-GAAP Measures
We prepare our financial statements in accordance with Generally Accepted Accounting Principles (“GAAP”). Within this press release, we make reference to EBITDA, adjusted
EBITDA, adjusted diluted EPS, adjusted net loss, shop-level profit, and shop-level profit margin, which are non-GAAP financial measures. The Company includes these non-GAAP
financial measures because management believes they are useful to investors in that they provide for greater transparency with respect to supplemental information used by
management in its financial and operational decision making.
Management uses adjusted EBITDA, adjusted net income and adjusted diluted EPS to evaluate the Company’s performance and in order to have comparable financial results to
analyze changes in our underlying business from quarter to quarter. Adjusted EBITDA, adjusted net income and adjusted diluted EPS exclude the impact of certain non-cash
charges and other special items that affect the comparability of results in past quarters. Management uses shop-level profit and shop-level profit margin as key metrics to evaluate
the profitability of incremental sales at our shops, to evaluate our shop performance across periods and to evaluate our shop financial performance against our competitors.
Accordingly, the Company believes the presentation of these non-GAAP financial measures, when used in conjunction with GAAP financial measures, is a useful financial analysis
tool that can assist investors in assessing the Company’s operating performance and underlying prospects. This analysis should not be considered in isolation or as a substitute for
analysis of our results as reported under GAAP. This analysis, as well as the other information in this press release, should be read in conjunction with the Company’s financial
statements and footnotes contained in the documents that the Company files with the U.S. Securities and Exchange Commission. The non-GAAP financial measures used by the
Company in this press release may be different from the methods used by other companies. For more information on the non-GAAP financial measures, please refer to the table,
“Reconciliation of Non-GAAP Financial Measures to GAAP Financial Measures.”
Definitions
The following definitions apply to these terms as used throughout this presentation:
• Revenues – represents net company-operated sandwich shop sales and our franchise operations. Net company-operated shop sales consist of food and beverage
sales, net of promotional allowances and employee meals. Franchise royalties and fees consist of an initial franchise fee, a franchise development agreement fee
and royalty income from the franchisee.
• Company-operated comparable store sales – represents the change in year-over-year sales for the comparable company-operated store base open for 15 months
or longer.
• EBITDA – represents income before depreciation and amortization expense, interest expense and the provision for income taxes.
• Adjusted EBITDA – represents income before depreciation and amortization expense, interest expense and the provision for income taxes, adjusted to eliminate the
impact of other items, including certain non-cash as well as other items that we do not consider representative of our ongoing operating performance.
• Shop-level profit – represents income (loss) from operations less franchise royalties and fees, general and administrative expenses, depreciation expense, pre-
opening costs, restructuring costs and impairment, loss on the disposal of property and equipment and shop closures.
• Shop-level profit margin – represents shop-level profit expressed as a percentage of net company-operated sandwich shop sales.

19
Investor Relations Contacts:
Lisa Fortuna or Ryan Coleman
Alpha IR Group
312-445-2870