franklin brown sudden clark barranca 2-dimensional ... · b. july 2013 – fbsc hspf design storm...
TRANSCRIPT

Franklin – Brown – Sudden – Clark Barranca
2-Dimensional Floodplain Analysis
Prepared for:
VENTURA COUNTY WATERSHED PROTECTION DISTRICT
ADVANCE PLANNING SECTION
PLANNING AND REGULATORY DIVISION
800 South Victoria Avenue
Ventura, CA 93009-1600
Prepared by:
KASRAIE CONSULTING
201 Burnett Avenue
Ventura, CA 93003
www.KasraieConsulting.com
RIADA ENGINEERING, INC.
102 County Road 2315
Nutrioso, AZ 85932
www.Flo-2d.com
June 30, 2014

_____________________________________________________________________________________
Franklin-Brown-Sudden-Clark Page 1 Technical Study Report 2-Dimensional Floodplain Analysis June 30, 2014
Table of Contents 1. EXECUTIVE SUMMARY .................................................................................................................................................... 7
2. PROJECT OVERVIEW AND OBJECTIVES ................................................................................................................. 14
3. BACKGROUND INFORMATION & DATA ................................................................................................................. 16
b. Horizontal & Vertical Datum .............................................................................................................................. 17
c. Record Drawings ..................................................................................................................................................... 17
d. Storm Drain System Atlas / Hydraulic Structures..................................................................................... 17
e. Manning’s Roughness Factors ........................................................................................................................... 19
f. Composite Topography & Surface ................................................................................................................... 22
g. Field Visits, Photos, Videos.................................................................................................................................. 23
h. Summary of Related Studies ............................................................................................................................... 23
4. HYDROLOGY ...................................................................................................................................................................... 27
a. December 2009 – Santa Clara River HSPF Model ...................................................................................... 27
b. July 2013 – FBSC HSPF Design Storm Modeling Final Report .............................................................. 29
c. December 2013 FBSC HSPF Design Storm Modeling Final Addendum 1 ........................................ 31
5. ONE-DIMENSIONAL HYDRAULIC ANALYSIS ....................................................................................................... 38
a. HEC-RAS Model Background .............................................................................................................................. 38
b. HEC-RAS Model Development ........................................................................................................................... 39
c. SWMM Model Integration .................................................................................................................................... 40
d. SWMM Model Background .................................................................................................................................. 40
e. SWMM Model Development ............................................................................................................................... 41
f. Hydraulic Structure Rating Curve Development ....................................................................................... 44
6. TWO-DIMENSIONAL MODEL DEVELOPMENT .................................................................................................... 46
a. Introduction .............................................................................................................................................................. 46
b. FLO-2D Model Description .................................................................................................................................. 46
c. Development of the FBSC FLO-2D 25 foot Grid Model ............................................................................ 47
7. TWO-DIMENSIONAL STUDY RESULTS & DISCUSSION .................................................................................... 52
a. Hydrograph Comparison ..................................................................................................................................... 52
b. Bridge/Culvert Capacity Summary .................................................................................................................. 54
c. Commingling Flows ................................................................................................................................................ 56
d. Wason Barranca ...................................................................................................................................................... 57
i. Wason Barranca Reach 1 – U/S of Foothill Road ....................................................................................... 57

_____________________________________________________________________________________
Franklin-Brown-Sudden-Clark Page 2 Technical Study Report 2-Dimensional Floodplain Analysis June 30, 2014
ii. Wason Barranca Reach 2 – D/S of Foothill Road to Telegraph Road ............................................... 58
iii. Wason Barranca Reach 3 – D/S of Telegraph Road to Freeway 126 .............................................. 59
iv. Wason Barranca Reach 4 – D/S of Freeway 126 to Franklin Barranca .......................................... 60
e. Franklin Barranca ................................................................................................................................................... 61
i. Franklin Barranca Reach 1 – U/S and Parallel to Foothill Road .......................................................... 61
ii. Franklin Barranca Reach 2 – D/S of Foothill Road to Telegraph Road ............................................ 62
iii. Franklin Barranca Reach 3 – D/S of Telegraph Road to Freeway 126 ........................................... 63
iv. Franklin Barranca Reach 4 – D/S of Freeway 126 to Railroad Tracks ........................................... 65
v. Franklin Barranca Reach 5 – D/S of Railroad Tracks to Santa Clara River .................................... 66
f. PWA Saticoy Operation Yard .............................................................................................................................. 67
g. Brown Barranca ....................................................................................................................................................... 68
i. Brown Barranca Reach 1 – U/S of Foothill Road ........................................................................................ 68
ii. Brown Barranca Reach 2 – D/S of Foothill Road to Telegraph Road ............................................... 69
iii. Brown Barranca Reach 3 – D/S of Telegraph Road to Blackburn Road ......................................... 70
iv. Brown Barranca Reach 4 – D/S of Blackburn Road to Freeway 126............................................... 71
v. Brown Barranca Reach 5 – D/S of Freeway 126 to Telephone Road ............................................... 72
vi. Brown Barranca Reach 6 – D/S of Telephone Road to Railroad Tracks ........................................ 74
vii. Brown Barranca Reach 7 – D/S of Railroad Tracks to Santa Clara River ..................................... 75
h. Saticoy Drain ............................................................................................................................................................. 76
i. Saticoy Drain Reach 1 – Freeway 126 to Darling Road ........................................................................... 76
ii. Saticoy Drain Reach 2 – D/S of Darling Road to Brown Barranca ..................................................... 77
i. Sudden Barranca ..................................................................................................................................................... 78
i. Sudden Barranca Reach 1 – U/S and parallel to Foothill Road ............................................................ 78
ii. Sudden Barranca Reach 2 – D/S of Foothill Road to Telegraph Road .............................................. 80
iii. Sudden Barranca Reach 3 – D/S of Telegraph Road to Freeway 126 ............................................. 81
iv. Sudden Barranca Reach 4 – D/S of Freeway 126 to Telephone Road ............................................ 82
v. Sudden Barranca Reach 5 – D/S of Telephone Road to Railroad Tracks ........................................ 83
vi. Sudden Barranca Reach 6 – D/S of Railroad Tracks to Santa Clara River ..................................... 84
j. Clark Barranca .......................................................................................................................................................... 85
i. Clark Barranca Reach 1 – U/S to Foothill Road .......................................................................................... 85
ii. Clark Barranca Reach 2 – D/S of Foothill Road to Telegraph Road .................................................. 86
iii. Clark Barranca Reach 3 – D/S of Telegraph Road to Freeway 126 .................................................. 87
iv. Clark Barranca Reach 4 – D/S of Freeway 126 to Telephone Road ................................................. 89

_____________________________________________________________________________________
Franklin-Brown-Sudden-Clark Page 3 Technical Study Report 2-Dimensional Floodplain Analysis June 30, 2014
v. Clark Barranca Reach 5 – D/S of Telephone Road to Railroad Tracks ............................................. 90
vi. Clark Barranca Reach 6 – D/S of Railroad Tracks to Santa Clara River ......................................... 91
8. FLOOD DAMAGE ASSESSMENT AND STATISTICS ............................................................................................. 92
a. Introduction .................................................................................................................................................................. 92
b. Generalized Flood Damage Methodology ......................................................................................................... 92
c. Evaluation ....................................................................................................................................................................... 92
d. Statistics ....................................................................................................................................................................... 102

_____________________________________________________________________________________
Franklin-Brown-Sudden-Clark Page 4 Technical Study Report 2-Dimensional Floodplain Analysis June 30, 2014
List of Large Scale Exhibits
Exhibit 1 Flood Inundation Map Legend
Exhibit 2 Flood Inundation Map – 5-Year Storm
Exhibit 3 Flood Inundation Map – 10-Year Storm
Exhibit 4 Flood Inundation Map – 25-Year Storm
Exhibit 5 Flood Inundation Map – 50-Year Storm
Exhibit 6 Flood Inundation Map – 100-Year Storm
Exhibit 7 Flood Inundation Map – 500-Year Storm
Exhibit 8 Drainage System Atlas Map
Exhibit 9 Land Use and Land Cover Map

_____________________________________________________________________________________
Franklin-Brown-Sudden-Clark Page 5 Technical Study Report 2-Dimensional Floodplain Analysis June 30, 2014
List of Figures
Figure 1 5-Year Flood Hazard Map………………………………………………………………... 8 Figure 2 10-Year Flood Hazard Map…………………………………………………………….... 9 Figure 3 25-Year Flood Hazard Map……………………………………………………………… 10 Figure 4 50-Year Flood Hazard Map……………………………………………………………… 11 Figure 5 100-Year Flood Hazard Map……………………………………………………………. 12 Figure 6 500-Year Flood Hazard Map……………………………………………………………. 13 Figure 7 Location Map………………………………………………………………………………….. 14 Figure 8 Land Use and Manning’s Factors……………………………………………………… 20 Figure 9 Developments Built Since April 2005……………………………………………….. 22 Figure 10 Example of Incorrect Model Assumption………………………………………….. 24 Figure 11 Saticoy Watersheds and HSPF 2009 Boundaries………………………………. 28 Figure 12 Revised HSPF Subareas ………………………………………………………………….. 30 Figure 13 FLO-2D Subareas……………………………………………………………………………. 33 Figure 14 FLO-2D Subarea Land Use (U=Urban, A=Ag or Undeveloped)……………. 34 Figure 15 HSPF Areas and Additional FLO-2D Subareas…………………………………… 35 Figure 16 HEC-RAS Bank-to-Bank Model Schematic…………………………………………. 38 Figure 17 EPA SWMM Model Schematic…………………………………………………………… 42 Figure 18 EPA SWMM Storm Drain Profile……………………………………………………….. 43 Figure 19 Hydraulic Structure Locations………………………………………………………….. 45 Figure 20 Elevation Point Data………………………………………………………………………… 48 Figure 21 Missing Bridge Point Elevation Example…………………………………………… 49 Figure 22 Storm Hydrograph Comparison……………………………………………………….. 51 Figure 23 100-year Event Damage Overlay Example………………………………………… 94

_____________________________________________________________________________________
Franklin-Brown-Sudden-Clark Page 6 Technical Study Report 2-Dimensional Floodplain Analysis June 30, 2014
List of Tables
Table 1 2D Computational Domain Roughness Factors and Froude Numbers…. 19 Table 2 1D Channel System Roughness Factors and Froude Numbers……………. 21 Table 3 Design Storm Ratios………………………………………………………………………… 31 Table 4 HSPF and FLO-2D Comparison Table………………………………………………… 36 Table 5 Hydrology Comparison Table…………………………………………………………… 37 Table 6 Hydrograph Comparison………………………………………………………………….. 53 Table 7 Bridge Location and Over-topping Threshold……………………………………. 55 Table 8 Studywide Flood Damage Costs for Depths Greater Than 6-inches……… 94 Table 9 Brown Barranca Flood Damage Costs for Depths Greater Than 6”………. 95 Table 10 Clark Barranca Flood Damage Costs for Depths Greater Than 6”………… 96 Table 11 Franklin Barranca Flood Damage Costs for Depths Greater Than 6”…… 96 Table 12 Mammoth St.-54” RCP Flood Damage Costs for Depths Grtr. Than 6”….. 97 Table 13 Montgomery Ave. Flood Damage Costs for Depths Greater Than 6”……. 97 Table 14 Saticoy Yard Flood Damage Costs for Depths Greater Than 6”……………. 98 Table 15 Saticoy Ave. Drain Flood Damage Costs for Depths Greater Than 6”…… 98 Table 16 Saticoy Drain Flood Damage Costs for Depths Greater Than 6”………….. 99 Table 17 Sudden Barranca Flood Damage Costs for Depths Greater Than 6”……. 99 Table 18 Wason Barranca Flood Damage Costs for Depths Greater Than 6”……… 100 Table 19 City of Ventura Area Flood Damage Costs for Depths Greater Than 6”... 101 Table 20 Unincorporated County Flood Damage for Depths Greater Than 6”……. 101 Table 21 FEMA Effective Fldpln. - Structures & Parcels Flood Insurance………….. 102 Table 22 FLO-2D 100-Year Event - Structures and Parcels Flood Insurance……… 103
_____________________________________________________________________________________
Franklin-Brown-Sudden-Clark Page 7 Technical Study Report 2-Dimensional Floodplain Analysis June 30, 2014
1. EXECUTIVE SUMMARY A planning-level unsteady 2-dimensional (2D) floodplain analysis has been completed for the watersheds of Franklin, Brown, Sudden and Clark (FBSC) Barrancas and their major tributaries located in East Ventura and the adjacent Unincorporated Ventura County area. These four major watersheds all drain to Santa Clara River and have a total drainage area of approximately 13 square miles. Many reaches of these streams are known to have inadequate flow capacities to carry 100-year flood flows and therefore pose potential flood risks to property owners and residents in the both urban and agricultural areas. In addition, the Ventura County Saticoy Operations Yard (SOY), a critical flood control, transportation and fleet operational facility during emergencies, is located within the lower section of the watersheds. The detailed limit of study for the FBSC project and its tributaries is from approximately the intersection of Kimball Road and Foothill Road in the northwest to Wason Barranca and Foothill Road at the northeast and the Santa Clara River to the south. Due to flow conveyance inadequacies in the local and regional drainage facilities, the study has found that over 2800 parcels may be subjected to flooding during a 100-year storm event, 1250 of which may require flood insurance in the future. The potential flood damages to residential, commercial, and agricultural properties are estimated to be $96M. Two thirds of the above flood damages are expected within the City, with the remainder within the Unincorporated County areas. The annualized flood damage within the study area is estimated to be $8.7M. The community of Saticoy is found to be especially vulnerable during a major storm event as commingling flows from several streams and channels will contribute to flooding within the area. Wells Road and the Los Angeles Avenue will be inundated for many hours during major storm events with varying degree of flooding. Access in and out of the Saticoy Operation Yard will be hampered as a result. The operations yard will experience some inundation as well, and the flood waters may enter parts of the GSA building(s). The PWA building is found to be dry during the 100-year storm event. The 5, 10, 25, 50, 100 and 500-year storm events have been analyzed to accurately assess potential floodplain conditions during catastrophic events, in addition to more commonly occurring storm events. Detailed mathematical models, inundation maps, base map information, and other supporting data are provided in electronic format. The following are simplified flood hazard maps for the above storm frequencies. Please see Technical Appendix for all detailed data and information.

_____________________________________________________________________________________
Franklin-Brown-Sudden-Clark Page 8 Technical Study Report 2-Dimensional Floodplain Analysis June 30, 2014
Figure 1 5-Year Flood Hazard Map

_____________________________________________________________________________________
Franklin-Brown-Sudden-Clark Page 9 Technical Study Report 2-Dimensional Floodplain Analysis June 30, 2014
Figure 2 10-Year Flood Hazard Map

_____________________________________________________________________________________
Franklin-Brown-Sudden-Clark Page 10 Technical Study Report 2-Dimensional Floodplain Analysis June 30, 2014
Figure 3 25-Year Flood Hazard Map

_____________________________________________________________________________________
Franklin-Brown-Sudden-Clark Page 11 Technical Study Report 2-Dimensional Floodplain Analysis June 30, 2014
Figure 4 50-Year Flood Hazard Map

_____________________________________________________________________________________
Franklin-Brown-Sudden-Clark Page 12 Technical Study Report 2-Dimensional Floodplain Analysis June 30, 2014
Figure 5 100-Year Flood Hazard Map

_____________________________________________________________________________________
Franklin-Brown-Sudden-Clark Page 13 Technical Study Report 2-Dimensional Floodplain Analysis June 30, 2014
Figure 6 500-Year Flood Hazard Map

_____________________________________________________________________________________
Franklin-Brown-Sudden-Clark Page 14 Technical Study Report 2-Dimensional Floodplain Analysis June 30, 2014
2. PROJECT OVERVIEW AND OBJECTIVES
A planning-level 2-dimensional (2D) flood routing study has been completed for the FBSC
Barrancas and their main tributaries within the study area shown on the location map
below.
The objectives of the project are as follows:
1. Identify access and operational issues at Saticoy Operations Yard during flood
emergencies
2. Determine existing drainage deficiencies
3. Develop an integrated modeling tool to assess potential solutions
Figure 7 Location Map
Total Watershed Area = 13 sq. mi. Total Computational Domain Area = 10 sq. mi.
Saticoy Operation Yard

_____________________________________________________________________________________
Franklin-Brown-Sudden-Clark Page 15 Technical Study Report 2-Dimensional Floodplain Analysis June 30, 2014
The total watershed area for the project is approximately 13 sq. mi. The total FLO-2D
computational domain area is approximately 10 sq. mi.
This project area has a number of coalescing alluvial fan and watershed features, and flows
from the various watersheds combine to form a larger flood area. Unconfined flooding of
this nature requires a two-dimensional flood routing model for accurate flood hazard
mapping. This analysis was completed using FLO-2D, EPA SWMM and HEC-RAS software
programs.
FLO-2D was selected by VCWPD for application to this project because it can simulate
urban flood detail such as buildings, embankments, walls, and infiltration, along with
unconfined overflow. In addition, street and channel flow can be simulated and hydraulic
structures can be modeled for water surface control. Additionally, FLO-2D is able to
compute the channel floodplain flow exchange on a grid element basis, which is critical for
the small channels on the floodplain surface. Numerous inflow hydrographs have been
created from approved VCWPD hydrology and placed accordingly in key, strategic locations
within the study area to most accurately mimic actual storm event flow and distribution.
This 2-dimensional floodplain analysis may be expanded and used as a foundation for a
30% Pre-Design Report in the future, and it can also be used as a part of technical and
scientific documentation in support of a Letter of Map Revision (LOMR) for the local
Communities at a later date.
For the purpose of this planning-level effort, walls such as sound walls along the freeway,
or perimeter walls around subdivisions were not included in the model. The rainfall and
infiltration feature of FLO-2D was also not utilized in the model.

_____________________________________________________________________________________
Franklin-Brown-Sudden-Clark Page 16 Technical Study Report 2-Dimensional Floodplain Analysis June 30, 2014
3. BACKGROUND INFORMATION & DATA
The following sections provide background information and data that were researched,
utilized and/or created as part of this effort.
a. Basemap
Numerous GIS basemap layers were utilized for this project, such as Parcels, Street
Centerline, City Boundaries, Ventura County Watershed Protection District
(VCWPD) Right-of-Way, VCWPD Facility centerlines, City of Ventura Storm Drain
System Atlas, City of Ventura Building Rooflines, City of Ventura General Plan Land
Use, County of Ventura Unincorporated Land Use, FEMA Effective DFIRM Floodplain
Boundaries and Base Flood Elevations (BFE). 2005 and 2013 aerial photography
were also utilized for this project. City of Ventura Building Rooflines depicts the
rooflines of all structures present on the 2013 aerial photo. Roofline polygons were
reviewed, updated, and then: integrated into the Manning’s Roughness Factor layer
(described below), incorporated into the flood damage calculations, and utilized for
flood hazard visualization purposes.
In addition to the above GIS basemap layers, the Operations and Maintenance
(O&M) Division of VCWPD provided their Facility Inventory shapefiles, photos, and
Closed Circuit Television Videos (CCTV) of their channels. This information was
used to verify dimensions, material and other characteristics of the study channels
and structures.

_____________________________________________________________________________________
Franklin-Brown-Sudden-Clark Page 17 Technical Study Report 2-Dimensional Floodplain Analysis June 30, 2014
b. Horizontal & Vertical Datum
The current floodplain study is performed in the following datum:
Horizontal Datum: 1983 North American Datum State Plane Coordinates Zone V
Feet (NAD83)
Vertical Datum: 1988 North American Vertical Datum Feet (NAVD88)
The 2005 LiDAR and channel design topography were prepared utilizing the
NAVD88 vertical datum. In contrast, the majority of construction records and as-
built drawings within the study area were prepared using the National Geodetic
Vertical Datum of 1929 (NGVD29) vertical datum. These data sets were converted to
NAVD by adding +2.46 feet.
NAVD88 Elevations = NGVD29 Elevations + 2.46 feet
c. Record Drawings
More than 300 storm drain Record Drawings were researched and obtained from
the following entities for the study area:
Caltrans
City of Ventura
County of Ventura
Ventura County Watershed Protection District
Many of these plans have also been geo-referenced, allowing them to be loaded into
GIS in real coordinates. The scanned and cataloged drawings plans are included
with this report and are available in the Technical Appendix.
d. Storm Drain System Atlas / Hydraulic Structures
A composite Drainage System Atlas (Atlas) GIS Geodatabase was created for the
study area of interest. Please see Exhibit 8. This Atlas consists of polyline features
and their attributes from the most recent City of Ventura Storm Drain Atlas

_____________________________________________________________________________________
Franklin-Brown-Sudden-Clark Page 18 Technical Study Report 2-Dimensional Floodplain Analysis June 30, 2014
Geodatabase, the VCWPD facilities centerlines, the County of Ventura
Unincorporated area Storm Drain Atlas Geodatabase and the VCWPD O&M Facility
Inventory Shapefile. This information consists of storm drain system main lines,
laterals, catch basins/inlets, open channels, box conduits, culverts, etc. The line
work geometry from these various sources and their attribute tables were merged
to make one comprehensive Atlas containing the various storm drains from
different agencies/sources.
The composite Atlas was then evaluated for any missing line work or facility
attributes (size, slope, material, etc). If missing, this information was added from the
appropriate source including City, County, and Caltrans record drawing. If the
necessary drawings were not available in GIS format they were geo-referenced and
the storm drain alignment was captured by digitizing their centerlines from the
rectified drawings. Attributes were also captured from these same drawings. Storm
drain attributes were used to calculate the full flow capacity of all storm drains 18”
or greater. This full flow capacity information can be found in the field “Capacities”
for each individual storm drain segment in the Feature Class. Detailed information
is included in the Technical Appendix.

_____________________________________________________________________________________
Franklin-Brown-Sudden-Clark Page 19 Technical Study Report 2-Dimensional Floodplain Analysis June 30, 2014
e. Manning’s Roughness Factors The following table and figure contain the initial N-values used for the hydraulic
analyses. A GIS polygon layer of Manning’s roughness factors was created using a
combination of the existing parcel basemap with land use designation, the City of
Ventura General Plan Land Use, and available aerial photos. Some minor deviations
from the recommended N-values were made during the computational phase of the
project, which is explained later on in the report. VCWPD staff were consulted and
agreed with the recommended roughness factors utilized for the study. The ranges
of values are based on established engineering values in addition to FLO-2D
documentation. Please see Exhibit 9 Land Use and Land Cover Map for detailed
area-wide map. Figure 8 below presents a snapshot of the larger area map. Table 1
presents the initial Manning’s Factors and Froude Numbers used in the 2D model.
Table 1 Overland Flow Manning's Roughness Factors and Limiting Froude Numbers - 2D Hydraulic Analysis
Description Manning's
N-value
Froude
Number
Agricultural General 0.050 0.50
Agricultural Orchards 0.080 0.60
Agricultural Strawberries 0.080 0.60
Commercial 0.045 0.90
Industrial 0.055 0.90
Neighborhood High Density 0.080 0.85
Neighborhood Medium Density 0.075 0.80
Neighborhood Low Density 0.070 0.70
Open Space 0.050 0.90
Public / Institutional 0.045 0.90
Parks & Open Space 0.065 0.75
Riverine 0.050 0.70
Right of Way 0.035 0.95
Specific Plan 0.050 0.90
Arterial and Collector roads 0.030 0.95
Arterial and Collector roads 0.030 1.25
Building Structure footprints 0.085 0.70
Table 2 below presents the range of Manning’s Factors used in the various 1D and 2D
elements of the study: HEC-RAS, EPA SWMM, and FLO-2D (1D channels and 2D overland
_____________________________________________________________________________________
Franklin-Brown-Sudden-Clark Page 20 Technical Study Report 2-Dimensional Floodplain Analysis June 30, 2014
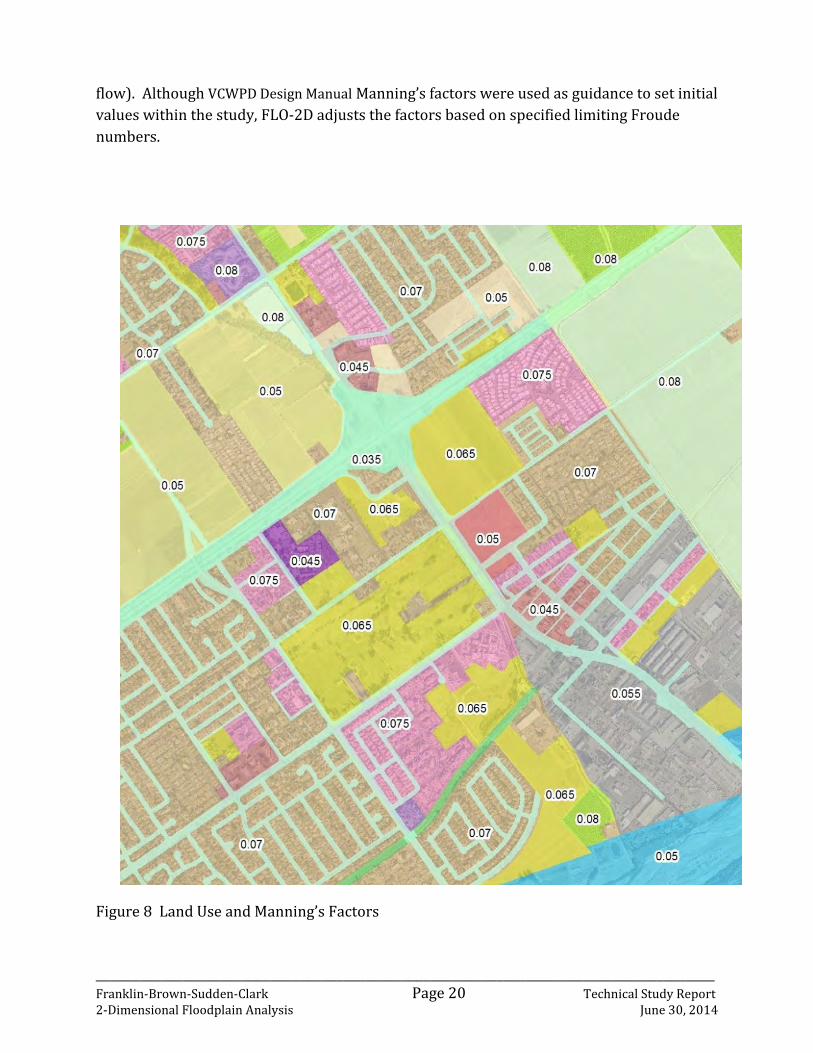
flow). Although VCWPD Design Manual Manning’s factors were used as guidance to set initial
values within the study, FLO-2D adjusts the factors based on specified limiting Froude
numbers.
Figure 8 Land Use and Manning’s Factors

_____________________________________________________________________________________
Franklin-Brown-Sudden-Clark Page 21 Technical Study Report 2-Dimensional Floodplain Analysis June 30, 2014
Table 2 Manning's Roughness Factors for Channel Hydraulics
The initial Manning’s roughness factors or ranges of n-values recommended for this project
in the above Tables 1 and 2 were gathered from several similar projects. VCWPD design
manual, HEC-RAS application manual, District’s South Branch Arroyo Conejo 2-dimensional
model study (2011), Jepson Wash floodplain study (2011), FLO-2D manual or its
developer’s guidelines were all used to prepare these tables. Ultimately, the developers
used n-values that were deemed appropriate for FLO-2D modeling purposes, and to ensure
model stability and volume conservation.
Facility Type Model Range Initial Values
Concrete Open Channels (rectangular or trapezoidal)
2D Model 0.015-0.025 0.020
Earthen or Engineered channels 2D Model 0.030-0.050 0.035
Natural Irregular Sections Heavy Vegetation 2D Model 0.070 0.070
Natural Irregular Sections light Vegetation 2D Model 0.050 0.050
Natural Irregular Sections grass weeds 2D Model 0.035 0.035
Rock Rip Rap 2D Model 0.030-0.045 0.040
Rock Rip Rap 1D Model 0.030-0.045 0.035
Corrugated Metal Pipes 1D Model 0.027 0.027
Concrete Box Conduits or Open Channels 1D Model 0.015 0.015
Concrete Pipes 1D Model 0.012 0.012

_____________________________________________________________________________________
Franklin-Brown-Sudden-Clark Page 22 Technical Study Report 2-Dimensional Floodplain Analysis June 30, 2014
f. Composite Topography & Surface There are two data sources of topography available for this project: the FEMA-
compliant Bare Earth Light Detection and Ranging (LIDAR) point cloud acquired by
VCWPD representing existing ground conditions dated March 2005, and Rough and
Fine Grading Record Plans for areas developed since March 2005. A careful
investigation of the 2005 Aerial Imagery compared with the current 2013 Aerial
Imagery revealed 7 larger scale developments, ranging in size from 6 to almost 40
acres in size, have been constructed within the study area. The grading plans for
these 7 developments (see figure below) were geo-referenced and key elevation
contours and spot elevations were captured in GIS reflecting the current topography
of the area.
Updated elevation information was then integrated into the bare earth LiDAR data
to produce a continuous 3-dimensional surface for the entire computational area.
Resulting products include a single composite topographic survey in both
Triangulated Irregular Network (TIN) and GRID formats that reflect the current
(2013) topography.
This information is available in the Technical Appendix.
Figure 9 Developments Built Since April 2005

_____________________________________________________________________________________
Franklin-Brown-Sudden-Clark Page 23 Technical Study Report 2-Dimensional Floodplain Analysis June 30, 2014
g. Field Visits, Photos, Videos
Several field visits were made within the study limits, with VCWPD staff present. All
of the field visits were documented with video clips in addition to still photos of
critical structures or important points of interest. These field trips and resulting
videos were used for facility verification and assisted in the hydraulic modeling of
these facilities. The videos and photos are organized by date of the field trip and the
geographic location in the Technical Appendix.
h. Summary of Related Studies
The following studies were used and referenced as part of this FBSC 2-dimensional
floodplain study. This information can be found in the Technical Appendix.
i. HDR - Brown Barranca Pre-Design Report – December 2005
The purpose of this report was to summarize the results on improving the
capacity of Brown Barranca and to recommend a cost-effective plan for
implementation that fits within identified right-of-way, land use constraints,
engineering design criteria and environmental concerns.
HEC-RAS models created for this study were reviewed in detail and used as
general guidance, when applicable, in evaluating the flooding patterns of Brown
Barranca and in the creation of the FBSC HEC-RAS models. Important model
notes include:
Modeled peak flows (including flow assumed to the leave Brown) were
between 18 and 47 percent lower than those calculated as part of
VCWPD’s July 2013 FBSC – HSPF Final Report (See Table 4).
Potential spillovers from Franklin and Wason Barranca breakouts were
not considered.
Single cross-sections were utilized to represent the entire floodplain.
Lateral structures and separate out of bank flowpaths were not explicitly
included in the model. This results in potential erroneous hydraulic
model results (See Figure 10 below).
The rating curve shown utilized for Telegraph Road at station 9181 starts
at an elevation over eighty feet below the cross-section’s invert.

_____________________________________________________________________________________
Franklin-Brown-Sudden-Clark Page 24 Technical Study Report 2-Dimensional Floodplain Analysis June 30, 2014
The study area of this report encompassed Brown Barranca from Foothill Road
to the Santa Clara River.
Figure 10 Example of Incorrect Model Assumption

_____________________________________________________________________________________
Franklin-Brown-Sudden-Clark Page 25 Technical Study Report 2-Dimensional Floodplain Analysis June 30, 2014
ii. ACOE - Santa Clara River Watershed Feasibility Study – Without Project
Conditions Overflow Analysis – October 2012
This report presents the results of an assessment of the without project
hydraulic conditions within the Santa Clara River watershed. It documents the
hydraulic features of the mainline Santa Clara River and its major and minor
tributaries.
Hydraulic models for the study reaches, flood hazard areas, hydraulic structures
and other reach characteristics were presented in this report. The HEC-RAS
models and assumptions were reviewed in detail and used as guidance, when
applicable, in creating the FBSC HEC-RAS models. Important model notes
include:
Modeled peak flows for the ACOE study were compared to those
generated as part VCWPD’s July 2013 FBSC – HSPF Final Report (See
Table 4) ACOE flows along:
o Brown were 2-20% lower,
o Franklin were 0-22% lower (the larger differences were upstream
of Freeway 126),
o Clark were 23% higher, and
o Sudden were 35% higher
Includes numerous lateral structures and reaches used to model
estimated overflow areas.
Rough flow patterns are in general visually similar to this two
dimensional study with the exceptions of:
o Clark Barranca between Freeway 126 and Telephone Road.
o Sudden Barranca between Telegraph Road and Freeway 126.
Underground storm drains along Clark and Sudden are modeled as a
single culvert.
HEC-RAS does not include Wason Barranca. But it does include potential
overflow from Ellsworth Barranca along Freeway 126.
The study area of this report includes the entire Santa Clara River and some
tributaries including parts of the FBSC Barrancas.
iii. VCWPD - Santa Clara River – Franklin-Wason-Brown-Clark-Sudden Watersheds
HSPF Design Storm Modeling – Final Report – November 2013
This report documents the work done by VCWPD using the calibrated Santa
Clara HSPF Model. The model was used to provide the design storm peaks and

_____________________________________________________________________________________
Franklin-Brown-Sudden-Clark Page 26 Technical Study Report 2-Dimensional Floodplain Analysis June 30, 2014
hydrographs for the FBSC 2-dimensional hydraulic modeling and floodplain
mapping project.
For this study, the subarea boundaries were modified based on the 2005 LiDAR
topography, City of Ventura drainage system and requested locations of local
runoff hydrographs for use in the FBSC model. Design storm ratios based on
stream gage data were provided to convert the HSPF 100-yr peak flows to other
storm recurrence levels. Routed storm hydrographs at the downstream end of
each subarea reach were provided in spreadsheet format, as well as un-routed
local runoff hydrographs for each subarea. Additional details are found in the
Hydrology Section below.
iv. VCWPD - Santa Clara River – Franklin-Wason-Brown-Clark-Sudden Watersheds
– HSPF Design Storm Modeling – Final Addendum I – December 2013
This report documents the work done by Kasraie Consulting for VCWPD in
adapting the design hydrology from the above report for the FBSC study.
Kasraie Consulting prepared numerous additional hydrographs based on the
regional model results for use in the FLO-2D model. The additional hydrographs
were required to minimize the effects of using a hydrograph-based hydrology
approach to approximate the spatial distribution of runoff that occurs in a design
storm. Further details are found in the Hydrology Section below.

_____________________________________________________________________________________
Franklin-Brown-Sudden-Clark Page 27 Technical Study Report 2-Dimensional Floodplain Analysis June 30, 2014
4. HYDROLOGY
a. December 2009 – Santa Clara River HSPF Model
The calibrated Santa Clara River HSPF Model (Aqua Terra 2009) was used to
provide the design storm peaks and hydrographs for use in the hydraulic modeling
of the study reaches.
The Santa Clara River and its tributaries drain the largest watershed in Ventura
County with an area of approximately 1,600 sq. mi. The watersheds within the FBSC
2013 study area comprise about 13 sq. mi. of the total area. Upstream portions of
the study watersheds are undeveloped, with downstream portions consisting
primarily of agricultural and residential developed land uses.
The primary components of this HSPF model in the vicinity of the FBSC study area
are as follows:
Watershed boundaries were based on the District’s forecast model
boundaries as shown in Figure 11. In some cases the boundaries intersected
urban drainage areas and systems, indicating the boundaries may have been
drawn before the present day development conditions.
The rain for the Saticoy area was specified by assigning one of the District’s
rain gages to the subareas, consistent with the approach used in the rest of
the HSPF model. For the study area, the data from Saticoy gage 175 was
used. This gage was located at a County Fire Station at the downstream end
of the study area until it was relocated to the District’s Saticoy Operations
Yard (SOY) in the summer of 2008. Since 1976, this gage has provided short
duration rain data that can be used for continuous modeling and frequency
analyses.

_____________________________________________________________________________________
Franklin-Brown-Sudden-Clark Page 28 Technical Study Report 2-Dimensional Floodplain Analysis June 30, 2014
Figure 11 Saticoy Watersheds and HSPF 2009 Boundaries
The land uses in the model are grouped into eight main categories,
forest/woods, shrubland, open space/parks, agricultural land, low, medium
and high density residences, and industrial/commercial. The eight land uses
were calculated based on GIS coverages showing land uses as of 2005.
Each pervious and impervious land group is assigned an overland flow length
and average slope based on GIS analysis of the different land uses. The
overland flow lengths for these subareas generally range from 100-400 ft
and slopes range from 0.01 to 0.14 ft/ft.
Infiltration and watershed storage parameters for each pervious and
impervious group was assigned based on the average soil type found in each
land use. These multiple parameters control the runoff and infiltration of

_____________________________________________________________________________________
Franklin-Brown-Sudden-Clark Page 29 Technical Study Report 2-Dimensional Floodplain Analysis June 30, 2014
rain for the upper and lower soil zones, the interflow zone and percolation to
deep groundwater.
Evaporation in the model is simulated based on time series developed from
pan evaporation data.
Each subarea is provided with a reach represented in the model with stage-
storage-discharge parameters. The model uses modified Puls routing to
simulate the effects of channel storage on the local inflow. The HSPF
conceptual model of flow assumes that all local runoff due to the input
rainfall hyetograph is applied to the upper end of a subarea reach and is
routed in the channel down to the next subarea.
b. July 2013 – FBSC HSPF Design Storm Modeling Final Report
Santa Clara River – Franklin–Wason–Brown–Clark–Sudden Watersheds The July 2013 FBSC – HSPF Final Report documents the work done by VCWPD to
update the calibrated Santa Clara HSPF Model (Aqua Terra 2009). The larger model
was adjusted within the FBSC study area to provide the design storm peaks and
hydrographs for two-dimensional hydraulic modeling and floodplain mapping of the
Saticoy area tributaries of the Santa Clara River.
All watersheds and sub watersheds within the FBSC 2013 study area, consisting of
approximately 10.8 square miles were analyzed in detail. Subarea boundaries were
modified based on 2005 LiDAR topo data, the City of Ventura drainage system and
requested locations of local runoff hydrographs for use in the hydraulic model. The
FTABLES used in the HSPF model to route the subarea runoff in the channel reaches
were also revised to include urban storage effects.
Existing drainage facility locations and information were collected from as-built
construction plans and put into the City’s GIS. This information consisted of storm
drain system main lines, laterals, catch basins and inlets, open channels, box
conduits, culverts, detention basins, etc. which are privately and/or publicly owned
and maintained by the City, VCWPD, Caltrans and other entities.
The hydrologic analysis performed for this study is based on the calibrated Santa
Clara River HSPF Model (Aqua Terra 2009). Preparation, calibration and validation
of this model are described in detail in the 2009 report, and summarized above,
including the meteorological components of the model and the subarea
discretization.
The following steps were taken to update the 2009 HSPF model:

_____________________________________________________________________________________
Franklin-Brown-Sudden-Clark Page 30 Technical Study Report 2-Dimensional Floodplain Analysis June 30, 2014
2005 LiDAR topographic data was used to revise subarea boundaries. The
boundaries were further adjusted to be consistent with the City of Ventura
local drainage networks and Freeway 126 drainage system.
Revised boundaries were used to recalculate the land uses in each subarea.
Subareas shown in Figure 12 were subdivided to provide local runoff data at
the locations requested by VCWPD’s Advanced Planning Section.
Stage-storage-discharge data for each reach were developed using Manning’s
equation to provide the required Ftables for each channel reach.
The HSPF UCI file was modified to export the peak flows and hydrographs for
each subarea. This file was also revised to export the un-routed local runoff
peaks and hydrographs from each subarea for Kasraie Consulting to use at
intermediate locations in the FBSC hydraulic model.
Figure 12– Revised HSPF Subareas

_____________________________________________________________________________________
Franklin-Brown-Sudden-Clark Page 31 Technical Study Report 2-Dimensional Floodplain Analysis June 30, 2014
In comparing the revised model results to the original 2009 model results, generally
the peak to area ratios from this 2013 model are higher for the largely undeveloped
watersheds. Two exceptions are the Upper Franklin and Upper Sudden subareas,
which have lower peak to area ratios than the unmodified model. For the more
developed watersheds within Clark and Sudden Barrancas, the current ratios are
lower, primarily due to urban storage effects included in the routing routine input.
Since this modified model has more accurate subarea boundaries based on the 2005
LiDAR topography and Ventura City storm drain network, and uses a consistent
approach to routing with the calculated FTABLE data, the current results are
considered to be better for design storm modeling.
The FBSC hydraulic analysis required discharges for the 10-, 25-, 50-, 100-, 200- and
500-year storms. The results of flow frequency analyses of Ventura County stream
gages were used to develop design storm ratios to convert the Q100 results from the
HSPF modeling to other recurrence intervals of interest. Ratios from developed and
undeveloped watersheds used to develop the design storm ratios are shown in
Table 3.
Table 3 Design Storm Ratios
Storm 5-Yr 10-Yr 25-Yr 50-Yr 100-Yr 500-Yr
Undeveloped
Design Storm
Ratio
0.144 0.262 0.484 0.711 1.000 1.952
Developed Design Storm
Ratio
0.330 0.464 0.660 0.822 1.000 1.502
The July 2013 FBSC – HSPF Final Report and supporting documents can be found in
the Technical Appendix.
c. December 2013 FBSC HSPF Design Storm Modeling Final Addendum 1
Santa Clara River – Franklin–Wason–Brown–Clark–Sudden Watersheds
VCWPD’s December 2013 FBSC – HSPF Final Addendum documents the work
completed by Kasraie Consulting for VCWPD in adapting the design hydrology for
the Saticoy area watersheds of Franklin, Brown, Wason, Clark, and Sudden
Barrancas. Design storm peaks and hydrographs were used for the two-
_____________________________________________________________________________________
Franklin-Brown-Sudden-Clark Page 32 Technical Study Report 2-Dimensional Floodplain Analysis June 30, 2014
dimensional floodplain model of the watershed. This design hydrology was
originally based on the calibrated Santa Clara HSPF Model (Aqua Terra 2009). The
main report (July 2013 FBSC – HSPF Final Report) presented results for the
regional-scale subareas included in the HSPF model.
FLO-2D is a combined hydrologic and hydraulic model capable of generating runoff
from rainfall inputs that are introduced as a distributed rainfall grid with each grid
element having a unique design rainfall amount, intensity and other associated
infiltration parameters. However, this functionality was not used due to
uncertainties in design rainfall amounts and lack of available flow gage data within
the local subareas necessary for a proper review and comparative analyses inside
the direct FBSC project area. In an effort to maintain consistency with the larger,
calibrated Santa Clara River model, the regional model hydrographs were
distributed across the more detailed sub-areas for use in the FLO-2D model. The
distributed hydrographs were required to minimize the effects of using a point
source hydrology approach by better approximating the spatial distribution of
runoff that occurs in a design storm.
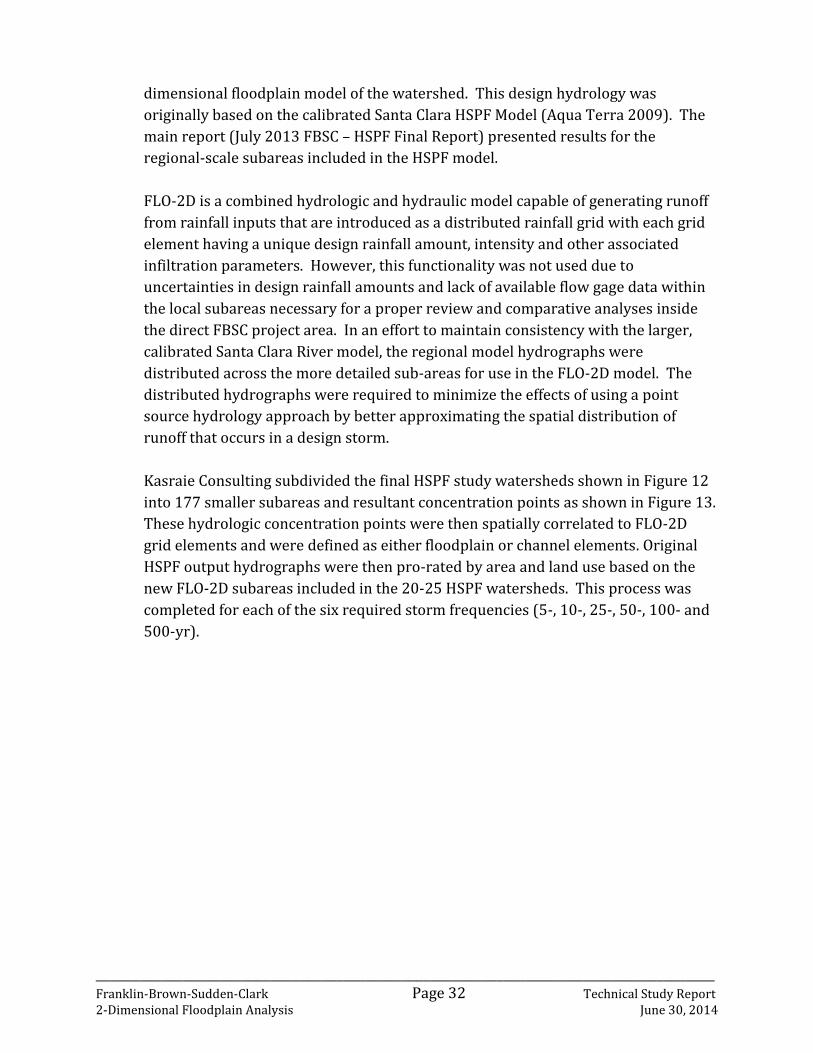
Kasraie Consulting subdivided the final HSPF study watersheds shown in Figure 12
into 177 smaller subareas and resultant concentration points as shown in Figure 13.
These hydrologic concentration points were then spatially correlated to FLO-2D
grid elements and were defined as either floodplain or channel elements. Original
HSPF output hydrographs were then pro-rated by area and land use based on the
new FLO-2D subareas included in the 20-25 HSPF watersheds. This process was
completed for each of the six required storm frequencies (5-, 10-, 25-, 50-, 100- and
500-yr).

_____________________________________________________________________________________
Franklin-Brown-Sudden-Clark Page 33 Technical Study Report 2-Dimensional Floodplain Analysis June 30, 2014
Figure 13 FLO-2D Subareas
Figure 14 shows the general land uses assigned to the FLO-2D subareas for pro-
ration purposes. These land uses were used to determine if design storm ratios
from undeveloped or mixed use/developed watersheds were applied to the pro-
rated HSPF hydrographs in order to obtain the hydrology for storm frequencies
other than the 100-yr. Average design storm ratios presented in the main report
(VCWPD, 2013) were utilized and are included in Table 3.

_____________________________________________________________________________________
Franklin-Brown-Sudden-Clark Page 34 Technical Study Report 2-Dimensional Floodplain Analysis June 30, 2014
Figure 14 FLO-2D Subarea Land Use (U=Urban, A=Ag or Undeveloped)
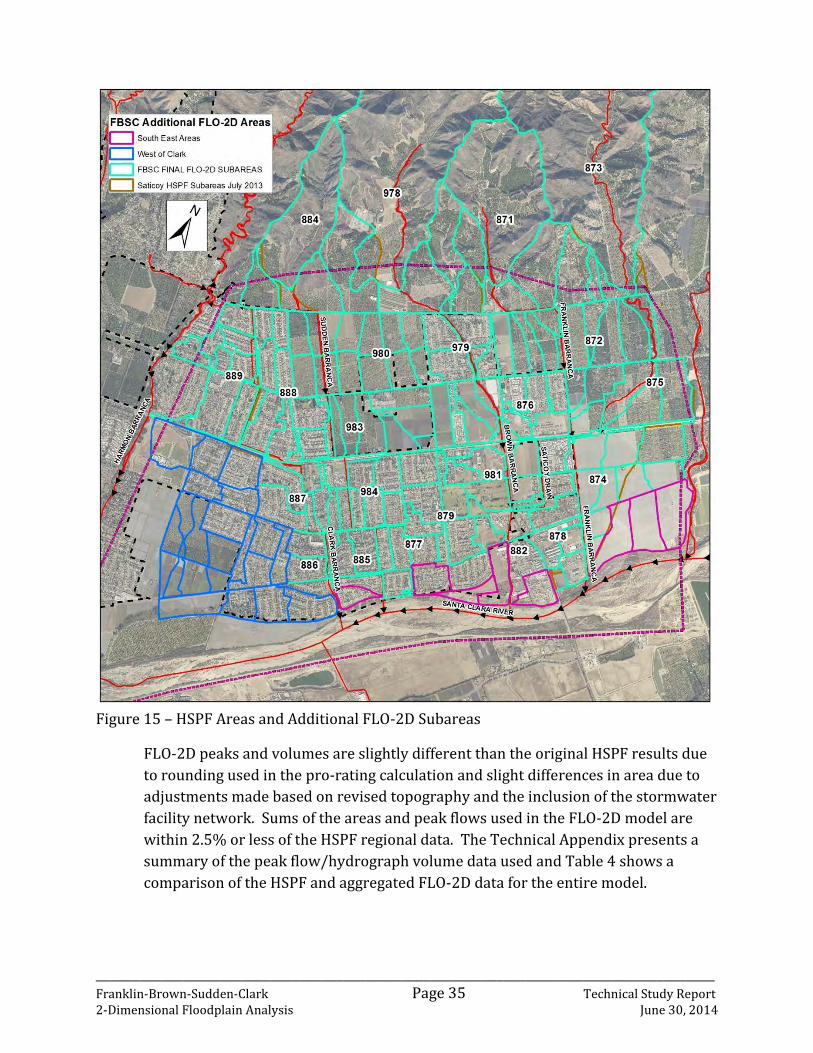
The FLO-2D computational domain included several additional areas of direct local
drainage to the Santa Clara River. Runoff in these adjacent areas does not
contribute to flows within the main FBSC channels, therefore inflow hydrographs
for these locations were not provided by the County. These additional areas are
shown in Figure 15. Hydrographs from HSPF subareas 874, 884, and 885 were pro-
rated based on size to represent local runoff in these locations.
_____________________________________________________________________________________
Franklin-Brown-Sudden-Clark Page 35 Technical Study Report 2-Dimensional Floodplain Analysis June 30, 2014
Figure 15 – HSPF Areas and Additional FLO-2D Subareas
FLO-2D peaks and volumes are slightly different than the original HSPF results due
to rounding used in the pro-rating calculation and slight differences in area due to
adjustments made based on revised topography and the inclusion of the stormwater
facility network. Sums of the areas and peak flows used in the FLO-2D model are
within 2.5% or less of the HSPF regional data. The Technical Appendix presents a
summary of the peak flow/hydrograph volume data used and Table 4 shows a
comparison of the HSPF and aggregated FLO-2D data for the entire model.

_____________________________________________________________________________________
Franklin-Brown-Sudden-Clark Page 36 Technical Study Report 2-Dimensional Floodplain Analysis June 30, 2014
The District reviewed the results and concluded that the FLO-2D hydrographs
described in this report were consistent with the regional HSPF results and are
suitable for the FBSC FLO-2D modeling effort.
Table 4 – 100-Year HSPF and Aggregated FLO-2D Data Comparison Table

_____________________________________________________________________________________
Franklin-Brown-Sudden-Clark Page 37 Technical Study Report 2-Dimensional Floodplain Analysis June 30, 2014
Table 5 below shows a comparison of the HSPF Q100 flows used in the study
compared to the Q100 flows used in previous studies within the project area. The
2010 FEMA flows are published in the January 20, 2010 FEMA Flood Insurance
Study (FIS). The 2005 HDR peak flows were used in the December 2005 HDR –
Brown Barranca Pre-Design Report, while the 2012 COE peak flows shown are from
the October 2012 Army Corp of Engineers – Santa Clara River Watershed Feasibility
Study – Without Project Conditions Overflow Analysis
2013 2010 2005 2012
Table 5 Hydrology Comparison Table

_____________________________________________________________________________________
Franklin-Brown-Sudden-Clark Page 38 Technical Study Report 2-Dimensional Floodplain Analysis June 30, 2014
5. ONE-DIMENSIONAL HYDRAULIC ANALYSIS
Numerous 1-dimensional hydraulic models were prepared as a precursor to the FLO-2D
model analysis. The main 1D models utilized for this project consist of HEC-RAS, EPA
SWMM, and to a lesser degree, the Federal Highway Administration’s HY8 Culvert Design
software, and WSPG.
a. HEC-RAS Model Background
Bank to bank (refers to the elevations at which flood flows leave the channel and would
instead be considered surface flow) hydraulic characteristics for open channels within the
study area were generated using the US Army Corps of Engineers Hydraulic Engineering
Center’s River Analysis System (HEC-RAS) version 4.1.0 software package. Geometry data
for the study area was derived from varying sources. ESRI’s ArcMap, Spatial Analyst, 3D
Analyst Geographical Information Systems (GIS) software and Hydrologic Engineering
Center’s Geo-RAS extension for ArcMap were used to evaluate each data source as well as
create the base geometry used within HEC-RAS. Final geometry and structure rating curves
resulting from the 1-D Hydraulic Analysis were used by the channel routing routine in FLO-
2D.
Figure 16 HEC-RAS Bank-to-Bank Model Schematic

_____________________________________________________________________________________
Franklin-Brown-Sudden-Clark Page 39 Technical Study Report 2-Dimensional Floodplain Analysis June 30, 2014
b. HEC-RAS Model Development
HEC-RAS models were developed for the main conveyance channels within FBSC as
shown in Figure 16.
Open channels within the study area vary and include natural, engineered earthen,
and concrete lined. For the improved portions, existing geo-referenced as-
builts/record drawings or field measurements were used to create breaklines
representing the channel. These breaklines were then incorporated into the bare
earth LiDAR to create a composite surface used to extract cross-section geometry.
Initially, cross-sections were taken at two hundred foot intervals perpendicular to
the direction of flow. Additional sections were added at the upstream and
downstream sides of each crossing as well as at locations shown on the as-
builts/record drawings where changes in slope or shape of the channel occurred.
Structure geometry was generated from available as-builts/record drawings,
VCWPD O&M Facility Inventory, field measurements recorded as part of this study,
and previously completed hydraulic models.
All Manning’s n-values were assigned to channels and overbank areas consistent
with the VCWPD Design Manual. Channel values range from 0.015 for concrete,
0.030-0.035 for improved earthen, and 0.04-0.08 for areas where vegetation exists
depending on growth density. Similarly floodplain n-values vary between 0.02 for
roads to 0.08 for orchards and other densely vegetated areas.
Downstream boundary conditions for each model were set to normal depth based
on the general slope between the last several cross-sections. Many of the improved
facilities were designed to flow under super-critical conditions to improve
efficiency; therefore the hydraulic analysis was evaluated using a mixed flow
regime. As a result upstream boundary conditions were set to critical depth.
Cross-section geometry was exported from HEC-RAS to FLO-2D CHAN.DAT input
files. In some instances, where applicable, channels having simplified shapes were
defined directly as standard trapezoids or rectangles.

_____________________________________________________________________________________
Franklin-Brown-Sudden-Clark Page 40 Technical Study Report 2-Dimensional Floodplain Analysis June 30, 2014
c. SWMM Model Integration
Initially, the plan was to build an EPA SWMM model of the major underground
conduits and to integrate the information with FLO-2D. However, due to
programming and developmental challenges, the integration of the two models has
taken longer than expected. In discussing the issue with VCWPD in late December
2013 and early January 2014, it was decided that instead the standard hydraulic
structure tables and internal culverts will be used in order to complete the project in
a timely manner. Using hydraulic results from the various HEC-RAS, SWMM, HY8,
WSPG models, and record drawings, hydraulic structure tables were prepared and
the underground conduits have been incorporated into the FLO-2D model. The
inundation and flood hazard maps, statistics, and flood damage assessment
presented in this report are all based on the conventional FLO-2D model.
However, the FLO-2D Software company is committed to completing the SWMM-
FLO2D integration on this project.
Once that work is completed, an Addendum Report to this report will be prepared.
The addendum will present the results of that analysis and it will assess the
difference in model results.
The remainder of this chapter discusses the EPA SWMM modeling and its future
integration with FLO-2D.
d. SWMM Model Background
Lower portions of the FBSC watersheds are developed and contain numerous
underground storm drains. Clark and Sudden Barrancas flow below the surface for
over 5000 feet each. To accurately represent these reaches as well as their main
inflows, an EPA Storm Water Management Model (SWMM) was created to analyze
the hydraulics of underground storm drains 42” in diameter/height and larger
within the study area.
FLO-2D is a volume conservation flood routing model that internally calculates all
the surface water hydrology and hydraulics including the flood routing in channels,
streets and unconfined overland flow. To simulate the exchange of surface flow with
underground storm drain systems, FLO-2D was integrated with EPA SWMM Version
5.022.

_____________________________________________________________________________________
Franklin-Brown-Sudden-Clark Page 41 Technical Study Report 2-Dimensional Floodplain Analysis June 30, 2014
Both models run simultaneously with FLO-2D being the host model. FLO-2D
calculates all hydrologic and hydraulic surface water flood routing while SWMM
only solves the conduit hydraulics and flow routing in a given storm drain network.
The FLO-2D model computes the storm drain inflow discharge based on the
predicted grid element headwater depth and on the inlet geometry. Inlets and
outlets function identically based on pressure head in the storm drain system
compared to water surface elevation. Water can flow in either direction based on
the pressure head differential when dynamic wave routing is applied. This
discharge is then exchanged with the SWMM model to compute the storm drain
system pipe discharge and the potential return flow to the surface through
downstream manholes, outlets and storm drains.
e. SWMM Model Development
PCSWMM 2013 Professional Version 5.4.1528 program was used to create, edit and
debug the EPA SWMM model. It is a powerful interface that works with numerous
GIS data formats and provides the user tools for streamlining model development,
optimization and analysis.
Initial model data development was completed within ArcGIS 10.2 to ensure all of
the storm drain line work was correctly captured with proper attributes for import.
Storm drain features (inlets/outlets, main lines, laterals, open channels, and
culverts) and attributes (pipe geometry, slope, material) from the most recent City
of Ventura Storm Drain Atlas Geodatabase, VCWPD facilities centerlines, County of
Ventura Unincorporated Area Storm Drain Atlas Geodatabase and VCWPD O&M
Facility Inventory Shapefile were merged into a single composite Storm Drain
System Atlas (Atlas) GIS Geodatabase. The composite geodatabase was reviewed for
consistency. Missing linework and/or attributes necessary for the SWMM model
were researched and added based on available record drawings. Additional data
fields were added to incorporate existing storm drain attributes into SWMM format
(such as converting pipe type listed as text in the geodatabase to an integer value
utilized by SWMM). Storm drains 42” and greater were imported as conduits into
PCSWMM through its GIS import routine. See Figure 17 – EPA SWMM Model
Schematic.

_____________________________________________________________________________________
Franklin-Brown-Sudden-Clark Page 42 Technical Study Report 2-Dimensional Floodplain Analysis June 30, 2014
Figure 17 – EPA SWMM Model Schematic
Endpoints from each storm drain were then generated within ArcGIS, duplicates
removed (locations where two or more pipes/channels have coincident end points),
and then imported into PCSWMM as junctions. Junctions can be modeled in SWMM
to represent inlets, manholes, and locations along pipes and open channels where
change in slope or shape occurs. Invert elevations for junctions are based on the
lowest incoming pipe/channel elevation. Rim elevations were initially set based on
a) LiDAR elevations for pipes or b) the invert plus largest depth along channels.
Surcharge elevation (if the hydraulic grade line (HGL) exceeds this level flow leaves
the storm drain system) for each of the junctions were set based on their function. It
was assumed that the HGL would need to exceed the rim elevation by 0.5 feet before
a bolted street manhole would pop off due to pressurization, thus losing water from
the storm drain system. Manholes or other internal connections that do not have the
ability to transfer flow to the surface were assigned an artificially high surcharge
elevation.

_____________________________________________________________________________________
Franklin-Brown-Sudden-Clark Page 43 Technical Study Report 2-Dimensional Floodplain Analysis June 30, 2014
Catchbasins and their laterals leading to the main system were not explicitly
modeled within SWMM, as the main purpose of creating the model is to create the
main skeleton for input and integration with FLO-2D. Instead, they are defined
directly in the FLO-2D SWMMFLO.DAT file. This process is discussed within the
FLO-2D section of the report as well as in the Technical Appendix in more detail.
Figure 18 – EPA SWMM Storm Drain Profile
To ensure the SWMM model was set-up correctly for use in FLO-2D, the 10-year
storm was run through the storm drain system (it was assumed the entire
hydrograph at each entry point makes it into the system). No errors, significant
warnings, or numerical instabilities were found.

_____________________________________________________________________________________
Franklin-Brown-Sudden-Clark Page 44 Technical Study Report 2-Dimensional Floodplain Analysis June 30, 2014
f. Hydraulic Structure Rating Curve Development
Ninety (90) Hydraulic structure rating tables (depth vs. flow relationships) were
developed outside FLO-2D, and entered into the model in HYSTRUC.DAT file.
Rating curves for major bridges, weirs, culverts, and drop structures along the main
open channels (defined in FLO2D as channel to channel structures, or floodplain to
channels) were developed using HEC-RAS and Microsoft Excel. Flood profiles were
generated for varying peak flows ranging from 10-3300 cfs. Water surface profiles
incorporate backwater effects, however they do not account for the actual
upstream/downstream channel capacity and ensuing outflow from the banks at
higher peaks. Instead HEC-RAS artificially raises cross-section endpoints resulting
in inflated elevations. However, since the final channel and structure hydraulics are
being completed within FLO-2D, this omission is irrelevant. When the channel
elevations reach the bank elevations in FLO-2D (which are the same as those in the
HEC-RAS model), flow and volume are exchanged with floodplain elements and the
upper portions of the rating curve are not utilized.
For culverts under road/channel embankments (defined in FLO-2D as floodplain to
floodplain structures) and some entrances to underground storm drains from open
channels, the Federal Freeway Administration (FHWA) HY8 culvert package was
used assuming no tailwater.
For certain City storm drains, a cluster of catch basin inlets were accounted for in
the FLO-2D inlet file ,SWMMFLO.DAT, by assuming a maximum flood depth of 12-
24” in the street/intersection that would deliver the design flow that the storm
drain was designed for (as shown on the as-built). For example, to account for an
underground 42” RCP with a design flow of 90 cfs, a virtual inlet/hydraulic structure
table was put into the FLO-2D model inlet file with a depth vs. flow relationship such
that the maximum flow was achieved at 9” of flood depth in the street or more.
The following is a typical table:
Figure 19 illustrates locations where rating curves were generated.

_____________________________________________________________________________________
Franklin-Brown-Sudden-Clark Page 45 Technical Study Report 2-Dimensional Floodplain Analysis June 30, 2014
Figure 19 Hydraulic Structure Locations
Due to mathematical instability and surging, a few of the hydraulic structure tables
were replaced with FLO-2D’s internal culvert processing routine in order to
approximate the underground flow separation.

_____________________________________________________________________________________
Franklin-Brown-Sudden-Clark Page 46 Technical Study Report 2-Dimensional Floodplain Analysis June 30, 2014
6. TWO-DIMENSIONAL MODEL DEVELOPMENT
a. Introduction
To enhance the resolution and accuracy of the predicted flooding generated by
previous 1-Dimensional flood studies, a detailed 2-Dimensional floodplain analysis
model is prepared using the FEMA-approved FLO-2D software. The PRO version of
the software was used for this study due to the complexity and magnitude of the
model. The FBSC model computational domain (coverage of 25 ft grids) yielded
approximately 482,000 grid elements with a computational area of 10.8 square
miles. The development and results of the FBSC FLO-2D model is discussed in the
next two chapters. The computer model was optimized to minimize the final
simulation run-time, ensure that there is no channel and floodplain numerical
surging and maintain volume conservation. No model calibration was done, as no
observed data from recent flooding was available. The FLO-2D model was required
as part of the contract. The complete model input and results are included in the
Technical Appendix.
b. FLO-2D Model Description
FLO-2D is a 2-Dimensional dynamic flood routing model that simulates channel
flow, unconfined overland flow and street flow. It can simulate a flood over complex
topography and roughness while reporting on volume conservation; the key to
accurate flood distribution. The model uses the full dynamic wave momentum
equation and a centered finite difference solution scheme with eight potential flow
directions to predict the progression of a flood hydrograph over a system of square
grid elements. FLO-2D is a tool for delineating flood hazards, and floodplain zoning
or designing flood mitigation measures.
Channel flow is simulated one-dimensionally with the channel geometry
represented by cross section station and elevation data. As a 1-D channel model,
secondary currents, super-elevation in bends and vertical and lateral velocity
distribution are assumed to be negligible. In this project, prismatic rectangular,
trapezoidal, and irregular cross sections were used to represent various engineered
or natural channel geometries. FLO-2D can simulate the transition between
subcritical and supercritical flow regimes because the full dynamic wave
momentum equation is used for flood routing. Channel overbank flow is computed
when the channel capacity is exceeded. An interface routine calculates the channel

_____________________________________________________________________________________
Franklin-Brown-Sudden-Clark Page 47 Technical Study Report 2-Dimensional Floodplain Analysis June 30, 2014
to floodplain discharge exchange including return flow to the channel. Once the
flow overtops the channel, it will disperse to other overland grid elements based on
topography, roughness and obstructions.
The model can accommodate urban features such as buildings, street flows and
hydraulic structures. It can also compute the channel floodplain flow exchange on a
grid element basis, which is critical for the channels in the FBSC drainage system.
Buildings are depicted by assigning a loss of storage factor to a grid element and by
assigning a flow width reduction factor along the boundaries of the grid element.
Street flow for the FBSC model was simulated with reduced roughness because the
grid elements were sufficiently small to define the interior topography of the streets.
Bridges and culverts and other hydraulic structures were simulated using discharge
rating tables as a function of flow depth. These are the major features in the FBSC
model that will be discussed in this report.
c. Development of the FBSC FLO-2D 25 foot Grid Model
i. DTM data base
A digital terrain model (DTM) from the 2005 LiDAR bare earth elevation data
was created. Please see image below.
The elevation data used in the 25 ft grid model was compiled from 41 LiDAR
tiles consisting of 35 million points. The original DTM data provided by VCWPD
represents bare earth data and was pre-filtered to remove buildings, large
bridges and trees in compliance with FEMA specifications for LiDAR.
_____________________________________________________________________________________
Franklin-Brown-Sudden-Clark Page 48 Technical Study Report 2-Dimensional Floodplain Analysis June 30, 2014
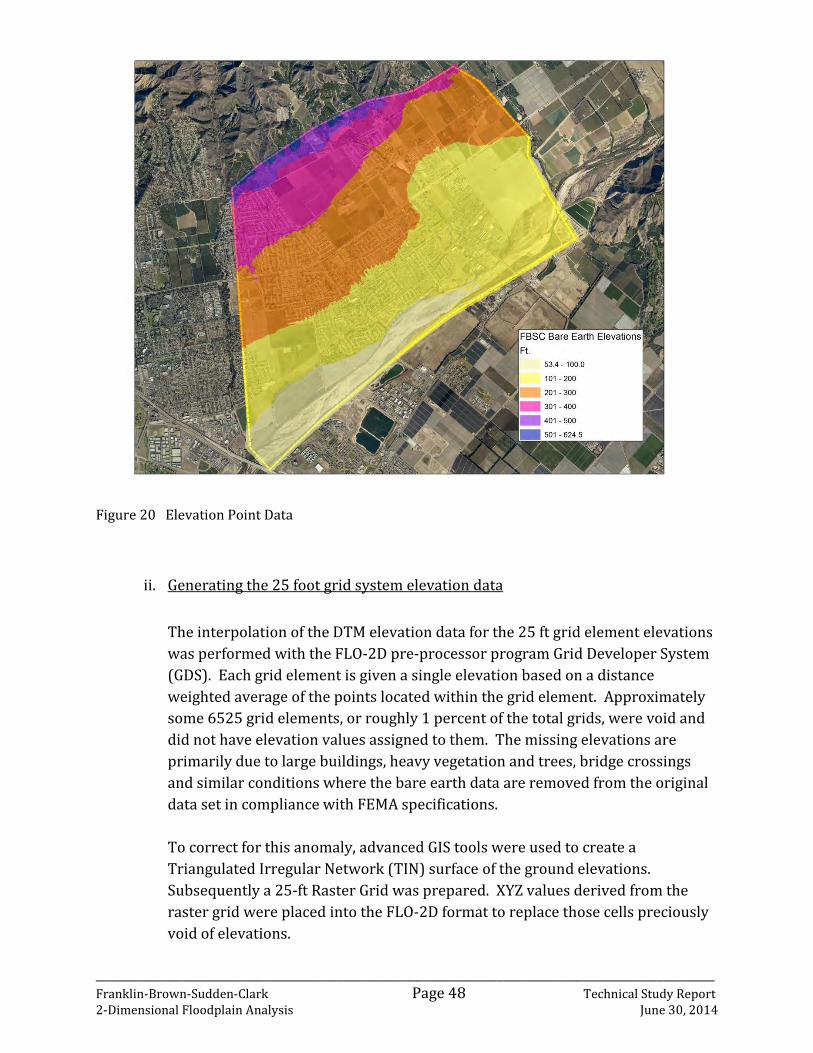
Figure 20 Elevation Point Data
ii. Generating the 25 foot grid system elevation data
The interpolation of the DTM elevation data for the 25 ft grid element elevations
was performed with the FLO-2D pre-processor program Grid Developer System
(GDS). Each grid element is given a single elevation based on a distance
weighted average of the points located within the grid element. Approximately
some 6525 grid elements, or roughly 1 percent of the total grids, were void and
did not have elevation values assigned to them. The missing elevations are
primarily due to large buildings, heavy vegetation and trees, bridge crossings
and similar conditions where the bare earth data are removed from the original
data set in compliance with FEMA specifications.
To correct for this anomaly, advanced GIS tools were used to create a
Triangulated Irregular Network (TIN) surface of the ground elevations.
Subsequently a 25-ft Raster Grid was prepared. XYZ values derived from the
raster grid were placed into the FLO-2D format to replace those cells preciously
void of elevations.

_____________________________________________________________________________________
Franklin-Brown-Sudden-Clark Page 49 Technical Study Report 2-Dimensional Floodplain Analysis June 30, 2014
The grid elements that coincided with buildings were given an interpolated
elevation based on contiguous grid element elevations. A sample of data was
checked to verify that elevation data within the building footprint is an accurate
representation of the ground data surrounding the buildings.
The LiDAR elevation data
for a few bridges and
overpasses was also filtered
out. The following image
shows an example of
missing elevation points
across a bridge. The
missing grid element
elevation data was
interpolated by the GDS
based on an average of
contiguous grid element
elevations. In all cases, the
elevation data associated
with bridges and overpasses
accurately reflects the
correct ground elevation.
Figure 21 Missing Bridge Point Elevation Example
iii. New Land Development Projects
Since the LiDAR point cloud was acquired by VCWPD representing existing
ground conditions dated March 2005, several small and large land development
projects have been constructed. Changes in grading and topography as a result
of these land development projects affect the direction and depth of runoff and
flood waters. Consequently, in these cases, the FLO-2D grid elevations were
adjusted to approximate today’s topographic condition by reviewing the Rough
and Fine Grading Record Plans for areas developed since March 2005.
A careful investigation of the 2005 Aerial Imagery compared with the current
2013 Aerial Imagery revealed 7 larger scale developments, ranging from 6 to
almost 40 acres in size, have been constructed within the study area, including
the Saticoy Maintenance Yard. Please see Figure 9.

_____________________________________________________________________________________
Franklin-Brown-Sudden-Clark Page 50 Technical Study Report 2-Dimensional Floodplain Analysis June 30, 2014
The grading plans for these 7 developments were geo-referenced and key
elevation contours and/or spot elevations were captured in GIS reflecting the
current topography of the area.
This updated elevation information was then integrated into the bare earth
LiDAR data to produce a continuous 3-dimensional surface for the entire
computational area as a single composite topographic survey in TIN and GRID
formats reflecting the current (2013) topography. This revised topography was
then translated into FLO-2D grid format and replaced the old (2005) ground
elevations for some 6600 grid elements.

_____________________________________________________________________________________
Franklin-Brown-Sudden-Clark Page 51 Technical Study Report 2-Dimensional Floodplain Analysis June 30, 2014
iv. Model Computation Time
The inflow hydrographs prepared for the project are based on 24 hours of rainfall,
but calculated out to four days. For FLO-2D modeling purposes, it was decided to
run the model for the first 48 hours of the hydrographs, as the last two days is the
recession limb of the hydrograph as it draws down to low flow.
Figure 22 below shows a comparison between the Santa Clara River 100-year
hydrograph with a peak flow of 226,000 cfs and the cumulative FBSC 100-year
hydrograph of 10,000 cfs. The FBSC cumulative hydrograph represents the 4 peak
flows for the Franklin, Brown, Sudden and Clark Barranca’s simply added together
for presentation purposes. There is a 7.5 hour lag time between the peaks of the
FBSC streams and the peak on the Santa Clara River. Although the District provided
Kasraie Consulting the full 96-hour storm hydrograph for Santa Clara River, they
suggested that a 30-hour simulation time would be appropriate for the FLO-2D
model to run. Flow in Santa Clara River returns to the original baseflow of
approximately 50,000 cfs at 48 hours. Although the local FBSC tributaries will peak
earlier than the Santa Clara River, the main influence affecting the boundary
condition at their confluence is the 100-year and 500-year flows within the Santa
Clara River. At VCWPD’s suggestion, the final models were simulated for 30 hours.
Figure 22 Storm Hydrograph Comparison
DAY 4
7.5 Hour LAG
SCR 100yr Peak 226,000 cfs
FBSC 100yr Peak 10,000 cfs
DAY 1 DAY 2 DAY 3

_____________________________________________________________________________________
Franklin-Brown-Sudden-Clark Page 52 Technical Study Report 2-Dimensional Floodplain Analysis June 30, 2014
7. TWO-DIMENSIONAL STUDY RESULTS & DISCUSSION
Due to the sophistication and complexity of 2D floodplain models and the enormity of the
model output and results, it is sometimes difficult to know if the model is working correctly
or if the results make scientific sense. Therefore, it is important to compare the results of
the 2D models with other tools such as HEC-RAS, and to check channel or culvert flows
against the record drawings, or other studies if available. The results of the current models
are analyzed and summarized as follows:
a. Hydrograph Comparison
b. Bridge/Culvert Capacity Summary
c. Commingling Flows
d. Reach by Reach Analysis – Wason Barranca
e. Reach by Reach Analysis – Franklin Barranca
f. Reach by Reach Analysis – PWA Saticoy Operations Yard
g. Reach by Reach Analysis – Brown Barranca
h. Reach by Reach Analysis – Saticoy Drain
i. Reach by Reach Analysis – Sudden Barranca
j. Reach by Reach Analysis – Clark Barranca
a. Hydrograph Comparison
Table 6 is a compilation of the 30-hour hydrograph peak flows and volumes from the FLO-
2D model and a comparison with the HSPF model.
The HSPF model “routed” flows represent a theoretical projected flow at a given
concentration point based on certain assumptions for stream routing, flood storage, and
channel/bridge capacity, constriction, obstructions, etc. Whereas the FLO-2D flows
represent the results of a detailed unconfined flood routing analysis over the entire study
area, taking into account the physical characteristics of the stream network and overbank
areas such as streets, buildings, embankments and other features.
The table summarizes the peak flows and volumes at 19 locations along the main FBSC
jurisdictional facilities where a “routed” hydrograph was available from the HSPF model. A
ratio of the FLO-2D/HSPF values is also presented for comparison purposes.
In places where the FLO-2D “channel element” and HSPF flows match, a 1.0 ratio indicates
that the flow is found to be contained in the channel with no break out flows upstream;
Brown Barranca upstream of Telegraph Road is an example of such location. A wide
deviation from a 1.0 ratio indicates wide spread flooding, and the presence of overbank
flooding in addition to main channel flow. Brown Barranca at Freeway 126 is an example
of such condition, with a 0.5 ratio.

_____________________________________________________________________________________
Franklin-Brown-Sudden-Clark Page 53 Technical Study Report 2-Dimensional Floodplain Analysis June 30, 2014
Table 6 Hydrograph Comparison (30-hour)
APS DescriptionFranklin Main @
Foothil
Franklin Main @
Fwy126
Wason Main @
Foothill
Wason Main @
Franklin Confl.
Franklin Main @
SCR
Location Upper Franklin Middle Franklin Upper Wason Middle WasonLower Franklin-
Wason
Cum Area ac 540 977 1665 1864 3041
Q100 Peak cfs 1020 1650 2220 2270 3930
VOLUME ACFT 218 432 619 717 1248
Location RCH871 RCH872 RCH873 RCH875 RCH874
Q100 Peak cfs 673 889 918 1569 2229
VOLUME ACFT 147 266 522 693 1088
GRID ELEMENT 32147 96264 1270 87548 229789
FLOW 0.7 0.5 0.4 0.7 0.6
VOLUME 0.7 0.6 0.8 1.0 0.9
APS DescriptionBrown Main @
Foothill
Brown Main @
Telegraph
Brown Main @
Fwy 126
Brown Main @
Telephone
Brown Main @
SCR
Location Upper BrownBrown Below
Foothill
Brown Above Fwy
126
Brown Above
Telephone
Lower Brown
Barranca
Cum Area ac 1006 1152 1850 2034 2383
Q100 Peak cfs 1590 1750 2720 2950 3330
VOLUME ACFT 397 474 815 905 1085
Location RCH978 RCH979 RCH980 RCH981 RCH882
Q100 Peak cfs 1569 1699 1518 1369 1383
VOLUME ACFT 410 451 649 678 870
GRID ELEMENT 60379 94732 149289 212851 312634
FLOW 1.0 1.0 0.6 0.5 0.4
VOLUME 1.0 1.0 0.8 0.7 0.8
APS DescriptionSaticoy Drain @
Brown Confl.
Sudden Main @
Foothill
Sudden Main @
Fwy 126
Sudden Main @
Telephone
Sudden Main @
SCR
LocationSaticoy Drain at
TelephoneUpper Sudden
Sudden Below
Foothill
Sudden Below
Fwy 126Lower Sudden
Cum Area ac 259 232 412 578 687
Q100 Peak cfs 295 372 650 801 892
VOLUME ACFT 130 83 173 260 318
Location RCH876 RCH884 RCH983 RCH984 RCH885
Q100 Peak cfs 303 243 405 531 717
VOLUME ACFT 156 62 151 194 258
GRID ELEMENT 156524 117989 289710 321415 365578
FLOW 1.0 0.7 0.6 0.7 0.8
VOLUME 1.2 0.8 0.9 0.7 0.8
APS DescriptionClark Main @ Fwy
126
Clark Main @ Fwy
126
Clark Main @
TelephoneClark Main @ SCR
Location Upper Clark WestPlus Upper Clark
East
Clark Below Fwy
126Lower Clark
Cum Area ac 233 542 717 811
Q100 Peak cfs 424 894 1090 1180
VOLUME ACFT 125 287 381 431
Location RCH889 RCH888 RCH887 RCH886
Q100 Peak cfs 155 539 927 944
VOLUME ACFT 48 164 364 370
GRID ELEMENT 298486 287345 384631 391055
FLOW 0.4 0.6 0.9 0.8
VOLUME 0.4 0.6 1.0 0.9
CLARK
HSPF ROUTED
HYDROGRAPHS
FLO-2D MODEL
CHANNEL
HYDROGRAPHS
RATIOS (FLO-
2D/HSPF)
FLO-2D MODEL
CHANNEL
HYDROGRAPHS
RATIOS (FLO-
2D/HSPF)
SATICOY DRN -
SUDDEN
HSPF ROUTED
HYDROGRAPHS
FLO-2D MODEL
CHANNEL
HYDROGRAPHS
RATIOS (FLO-
2D/HSPF)
HSPF ROUTED
HYDROGRAPHS
WASON -
FRANKLIN
HSPF ROUTED
HYDROGRAPHS
FLO-2D MODEL
CHANNEL
HYDROGRAPHS
RATIOS (FLO-
2D/HSPF)
BROWN

_____________________________________________________________________________________
Franklin-Brown-Sudden-Clark Page 54 Technical Study Report 2-Dimensional Floodplain Analysis June 30, 2014
b. Bridge/Culvert Capacity Summary
In order to have an understanding about the reasonableness of a flood hazard model, it is
helpful to look at bridges or culverts. These structures sometimes constrict the flow and
they do not necessarily carry the entire 100-year peak flow. Knowing an approximate flow
capacity for these facilities and a simple comparison with the projected flows helps the
community or regulatory officials to understand the flood risks that exist throughout the
study area.
Table 7 shows the HSPF reach information and the projected flows at key
bridge/culvert/channel locations for all studied frequencies (5 – 500-year) in addition to
the estimated threshold capacity, frequency and source of the information.
It should be pointed out that the over-topping threshold flow shown in the table is the flow
rate at which the bridge/culvert/channel begin to over-top their banks. This number is
NOT the bridge design capacity, and no design adequacy or deficiency is inferred. Bridge or
channel design capacity and freeboard requirements need to comply with VCWPD’s design
requirements under open channel flow condition. Whereas, the over-topping threshold
flow is for a submerged inlet/outlet condition.
This approximate flow rate and the corresponding storm frequency are shown as a simple
way of knowing the degree at which a culvert or bridge crossing is capable of carrying the
100-year flow. This is for reference only.

_____________________________________________________________________________________
Franklin-Brown-Sudden-Clark Page 55 Technical Study Report 2-Dimensional Floodplain Analysis June 30, 2014
Table 7 Bridge Location and Over-topping Threshold

_____________________________________________________________________________________
Franklin-Brown-Sudden-Clark Page 56 Technical Study Report 2-Dimensional Floodplain Analysis June 30, 2014
c. Commingling Flows
A 2-dimensional flood hazard analysis is comprehensive by nature, as it takes all the
sources of flooding into account at the same time, as if it is raining equally everywhere in
the watershed. This results in coalescing flows from several streams contributing to form a
larger floodplain.
A case in point is the community of Saticoy where overbank flood flows from Saticoy Drain
will combine with flows from Franklin Barranca and Brown Barranca in addition to the
rain that will fall over the area. The four sources of flood waters will commingle to form a
larger floodplain area affecting the existing homes and businesses, as well as Wells Road
and LA Avenue.
In order to assess the flooding impact from the various individual sources in the future, the
District can use the existing FLO-2D models and separate out the watersheds by limiting
the inflow hydrographs to a single watershed at a time, and rerunning the model. This
single-watershed run will show the depth and extent of flooding from a given channel or
stream, and it will further clarify the special flood hazard areas associated with a single
channel.

_____________________________________________________________________________________
Franklin-Brown-Sudden-Clark Page 57 Technical Study Report 2-Dimensional Floodplain Analysis June 30, 2014
d. Wason Barranca
i. Wason Barranca Reach 1 – U/S of Foothill Road
Upstream of Foothill Road, the natural channel is heavily vegetated with depths varying
from approximately 10’-12’. The watershed above this location consists of both natural
open space and agriculture. At Foothill Road, the 7’W X 5’H concrete arch culvert has a
capacity of 675 cfs based on the HEC-RAS analysis (Sta. 86+10). The projected HSPF
Q10 at the culvert is 592 cfs, while the HSPF Q100 is 2220 cfs. This culvert has limited
capacity (amount of flow before road overtopping begins) with a storm frequency of
approximately the 15 year event.
The modeled Q100 in FLO-2D
at the structure is 925 cfs, while
the modeled Q100 in HEC-RAS
at the structure is 1192 cfs,
which includes 703 cfs through
the culvert plus 488 cfs flow
over the top of the culvert. In
the storm events greater than
15-year, overflows will overtop
Foothill Road to the east and re-
enter the natural Wason
channel just downstream of
Foothill Road.

_____________________________________________________________________________________
Franklin-Brown-Sudden-Clark Page 58 Technical Study Report 2-Dimensional Floodplain Analysis June 30, 2014
ii. Wason Barranca Reach 2 – D/S of Foothill Road to Telegraph Road
Downstream of Foothill Road, the meandering natural channel varies in depth from
approximately 14’ to 16’. As it moves through the surrounding agricultural area, all
frequency flows are contained in the channel. At Telegraph Road, the 10’W X 9’H arch
culvert has a capacity of approximately 1400 cfs from the HEC-RAS bank to bank model
and a capacity frequency of 35 years. The projected 100 year flow from HSPF at
Telegraph Road is 2257 cfs. Flows in excess of the 35 year event will overtop Telegraph
Road on both the east and west sides of the culvert crossing, with the majority traveling
over the road on the east side eventually flowing along the north side of Freeway 126
back to the main Wason Barranca channel.
A small amount of water will also flow to the east towards Ellsworth Barranca.
This very shallow surface flow eventually exits the FLO-2D grid modeling area. Due to
the small volume of water traveling toward Ellsworth Barranca and the complexities of
changing the FLO-2D computational grid, it was decided not to enlarge the model
domain to include this additional area.

_____________________________________________________________________________________
Franklin-Brown-Sudden-Clark Page 59 Technical Study Report 2-Dimensional Floodplain Analysis June 30, 2014
iii. Wason Barranca Reach 3 – D/S of Telegraph Road to Freeway 126
Downstream of Telegraph Road, the channel transitions to a trapezoidal earthen
channel with depths ranging from 6’ to 12’ and base widths ranging from 14’ to 18’.
The land use surrounding the channel through this reach is agricultural, mainly orchard
and citrus trees. For all frequency storms, some surface flow from the surrounding
orchard area will be entering the channel from the north side. The remaining surface
flow will travel through the agricultural area in a southwesterly direction ponding in
the northeast corner of Freeway 126 and Franklin Barranca. There is a private farm
crossing across the Wason channel approximately 1300’ upstream from Freeway 126,
which consists of a 17’W X 8’H clear-span bridge. At Freeway 126 the projected Q100
from HSPF is 2270 cfs, while the capacity of the Double 10’W X 8’H RCB underneath
Freeway 126 has a capacity of 1300 cfs from the HEC-RAS analysis. The FLO-2D model
shows the culvert under Freeway 126 as having capacity to carry approximately 1600
cfs.
Therefore the estimated
capacity frequency for this
culvert ranges from a 35 to
50 year event. Flows in
excess of the culvert capacity
will join the existing surface
water traveling in a
southwest direction, along
the freeway and ponding in
the northeast corner of
Freeway 126 and Franklin
Barranca.

_____________________________________________________________________________________
Franklin-Brown-Sudden-Clark Page 60 Technical Study Report 2-Dimensional Floodplain Analysis June 30, 2014
iv. Wason Barranca Reach 4 – D/S of Freeway 126 to Franklin Barranca
Wason Barranca from downstream of Freeway 126 to its confluence with Franklin
Barranca is primarily a 10’W X 6’H concrete trapezoidal channel with RCC transition
sections at the upstream and downstream end. The design Q from the VCWPD record
drawing for this reach is 800 cfs. (see Y-2-238 below)
The estimated Q10 from HSPF
for this reach is 606 cfs and the
Q100 is 2270 cfs. Flows in
excess of channel capacity will
overtop and travel in a westerly
direction toward Franklin
Barranca and also to the south
through the farm area.

_____________________________________________________________________________________
Franklin-Brown-Sudden-Clark Page 61 Technical Study Report 2-Dimensional Floodplain Analysis June 30, 2014
e. Franklin Barranca
i. Franklin Barranca Reach 1 – U/S and Parallel to Foothill Road
This reach consists of a natural earthen channel flowing in a southeasterly direction
toward Foothill Road. At Foothill Road, the channel turns toward the northeast and the
earthen road side ditch runs parallel along the north side of the road. There are three
private drive way crossings along this reach. The trapezoidal earthen ditch has a top
width of 20’ – 30’ and depths ranging from 7’-8’. The ditch itself is shown to carry
between a 25-year and 40-year flow of up to 625 cfs. Excess flows will overtop the
channel before the culvert crossing at Foothill Road and continue as surface flow
through the agricultural area to the south. The combination of the small drop structure
upstream and the 8’W X 7’H RCB crossing Foothill Road have a combined capacity of
ranging from 400 cfs from the FLO-2D model up to 550 cfs based on the HEC-RAS
analysis. This is equivalent to a 20 - 30-year flow. The projected HSPF Q10 at this
location is 279 cfs and Q100 is 1020 cfs.
The modeled Q100 in FLO-2D at
the structure is 393 cfs, while the
modeled Q100 in HEC-RAS at the
structure is 447 cfs. Flows in
excess of the capacity will overtop
Foothill Road, join other surface
flow from the east and continue on
a path parallel to the existing
Franklin channel on its east side.

_____________________________________________________________________________________
Franklin-Brown-Sudden-Clark Page 62 Technical Study Report 2-Dimensional Floodplain Analysis June 30, 2014
ii. Franklin Barranca Reach 2 – D/S of Foothill Road to Telegraph Road
At the upstream end of this reach, water in excess of the capacity of the Foothill Road
culvert in addition to water coming from the east along Foothill Road will overtop and
inundate the area immediately downstream. The FLO-2D results for this reach show a
bottleneck in Franklin Barranca just downstream of Foothill Road with flows running
thru the orchard on the eastside of Franklin Barranca. The channel from Foothill Road
to Telegraph Road is an earthen trapezoidal channel with portions of rock rip rap banks
on both sides. Channel base width ranges from 8’ - 12’ and depth’s range from 6’ to 14’.
The channel through this agricultural reach is characterized by four drop structures
varying in height from 3.5’ to more than 8.5’. Overbank flows from upstream continue
through the orchard area toward Telegraph Road. The projected HSPF Q10 at
Telegraph Road is 372 cfs and the Q100 is 1335 cfs. The 12’W X 7’H RCB culvert under
Telegraph Road has a capacity of 1200 cfs, which is equivalent to the 75-year flow,
based on the HEC-RAS analysis. Theoretically, if the projected Q100 reached this point,
the water on the east side will continue with the other contributing surface flow in a
southeasterly direction parallel to the channel in addition to water overtopping
Telegraph Road on the west side. However, due to the culvert and channel deficiency
upstream at Foothill Road the total flow within the channel itself is less than the HSPF
projected Q’s with additional water in the east overbank area, continuing southeasterly
through the agricultural area.
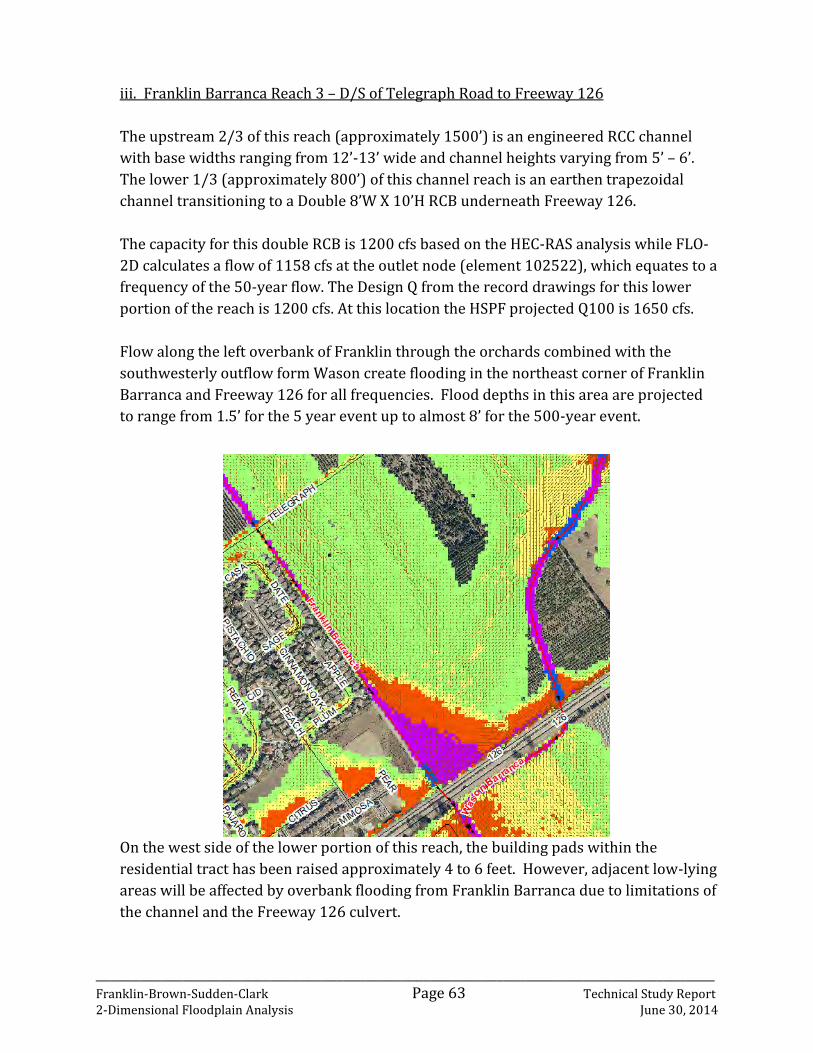
_____________________________________________________________________________________
Franklin-Brown-Sudden-Clark Page 63 Technical Study Report 2-Dimensional Floodplain Analysis June 30, 2014
iii. Franklin Barranca Reach 3 – D/S of Telegraph Road to Freeway 126
The upstream 2/3 of this reach (approximately 1500’) is an engineered RCC channel
with base widths ranging from 12’-13’ wide and channel heights varying from 5’ – 6’.
The lower 1/3 (approximately 800’) of this channel reach is an earthen trapezoidal
channel transitioning to a Double 8’W X 10’H RCB underneath Freeway 126.
The capacity for this double RCB is 1200 cfs based on the HEC-RAS analysis while FLO-
2D calculates a flow of 1158 cfs at the outlet node (element 102522), which equates to a
frequency of the 50-year flow. The Design Q from the record drawings for this lower
portion of the reach is 1200 cfs. At this location the HSPF projected Q100 is 1650 cfs.
Flow along the left overbank of Franklin through the orchards combined with the
southwesterly outflow form Wason create flooding in the northeast corner of Franklin
Barranca and Freeway 126 for all frequencies. Flood depths in this area are projected
to range from 1.5’ for the 5 year event up to almost 8’ for the 500-year event.
On the west side of the lower portion of this reach, the building pads within the
residential tract has been raised approximately 4 to 6 feet. However, adjacent low-lying
areas will be affected by overbank flooding from Franklin Barranca due to limitations of
the channel and the Freeway 126 culvert.

_____________________________________________________________________________________
Franklin-Brown-Sudden-Clark Page 64 Technical Study Report 2-Dimensional Floodplain Analysis June 30, 2014
Although the left and right banks of the channel upstream of Freeway 126 are
manmade, they were not intended to function as levees and were not modeled as such.
The channel flow in the lower end of the reach (upstream of the ponding area an
Freeway 126) is approximately one half of the projected 100-year HSPF peak. Flooding
is being exchanged between both the channel and overbank areas, submerging both
banks.

_____________________________________________________________________________________
Franklin-Brown-Sudden-Clark Page 65 Technical Study Report 2-Dimensional Floodplain Analysis June 30, 2014
iv. Franklin Barranca Reach 4 – D/S of Freeway 126 to Railroad Tracks
The channel through this reach includes the confluence of Wason Barranca on the
upstream end. After the confluence, the trapezoidal channel averages a base width 14’
and height of 5’ with side slopes of 1.5:1. The record drawing design Q for the channel
after the confluence is 1500 cfs, while the projected HSPF Q100 for this upstream
section is 3810 cfs. Currently, the channel downstream of the Franklin-Wason Barranca
confluence has an estimated 15-year capacity based on the HSPF model, even though it
was originally designed for a Q50 in 1965.
Flow overtops the channel due to its limited capacity. Excess water joins surface flow
from the surrounding agricultural area to the east, while inundating the mobile home
park adjacent to the channel and other areas of Saticoy to the west for all events greater
than a 15-year storm.
Upstream of the 25’W X 5’H RCB under Darling Road, a portion of the flooding from the
mobile home park returns to the main channel. As the channel continues toward the
railroad track crossing, it has capacity for a 25-year storm event. Some overtopping on
the west bank of the channel just upstream of the railroad tracks will occur.
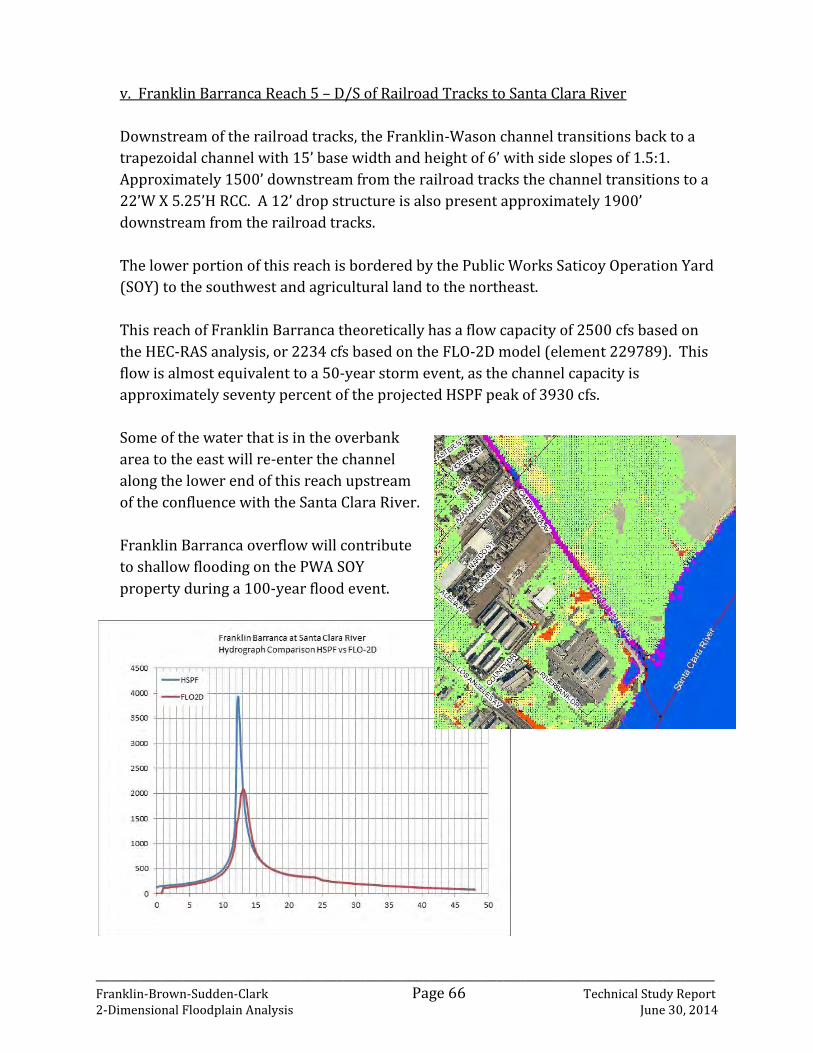
_____________________________________________________________________________________
Franklin-Brown-Sudden-Clark Page 66 Technical Study Report 2-Dimensional Floodplain Analysis June 30, 2014
v. Franklin Barranca Reach 5 – D/S of Railroad Tracks to Santa Clara River
Downstream of the railroad tracks, the Franklin-Wason channel transitions back to a
trapezoidal channel with 15’ base width and height of 6’ with side slopes of 1.5:1.
Approximately 1500’ downstream from the railroad tracks the channel transitions to a
22’W X 5.25’H RCC. A 12’ drop structure is also present approximately 1900’
downstream from the railroad tracks.
The lower portion of this reach is bordered by the Public Works Saticoy Operation Yard
(SOY) to the southwest and agricultural land to the northeast.
This reach of Franklin Barranca theoretically has a flow capacity of 2500 cfs based on
the HEC-RAS analysis, or 2234 cfs based on the FLO-2D model (element 229789). This
flow is almost equivalent to a 50-year storm event, as the channel capacity is
approximately seventy percent of the projected HSPF peak of 3930 cfs.
Some of the water that is in the overbank
area to the east will re-enter the channel
along the lower end of this reach upstream
of the confluence with the Santa Clara River.
Franklin Barranca overflow will contribute
to shallow flooding on the PWA SOY
property during a 100-year flood event.
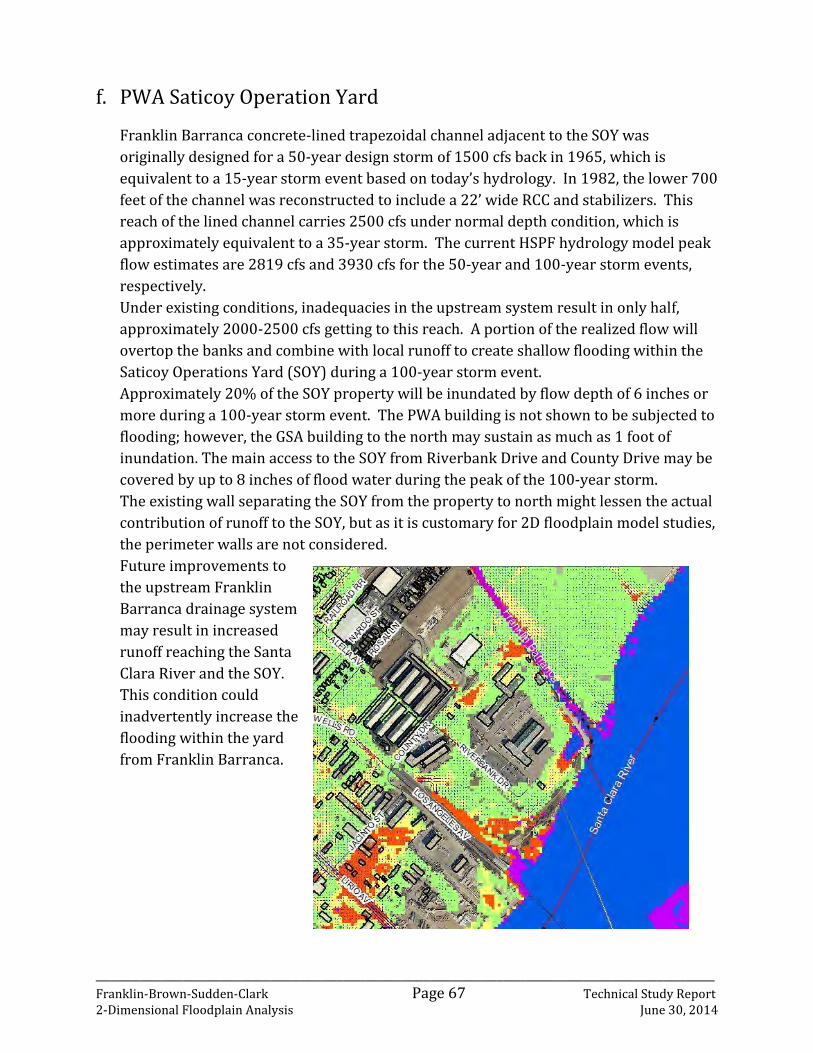
_____________________________________________________________________________________
Franklin-Brown-Sudden-Clark Page 67 Technical Study Report 2-Dimensional Floodplain Analysis June 30, 2014
f. PWA Saticoy Operation Yard
Franklin Barranca concrete-lined trapezoidal channel adjacent to the SOY was
originally designed for a 50-year design storm of 1500 cfs back in 1965, which is
equivalent to a 15-year storm event based on today’s hydrology. In 1982, the lower 700
feet of the channel was reconstructed to include a 22’ wide RCC and stabilizers. This
reach of the lined channel carries 2500 cfs under normal depth condition, which is
approximately equivalent to a 35-year storm. The current HSPF hydrology model peak
flow estimates are 2819 cfs and 3930 cfs for the 50-year and 100-year storm events,
respectively.
Under existing conditions, inadequacies in the upstream system result in only half,
approximately 2000-2500 cfs getting to this reach. A portion of the realized flow will
overtop the banks and combine with local runoff to create shallow flooding within the
Saticoy Operations Yard (SOY) during a 100-year storm event.
Approximately 20% of the SOY property will be inundated by flow depth of 6 inches or
more during a 100-year storm event. The PWA building is not shown to be subjected to
flooding; however, the GSA building to the north may sustain as much as 1 foot of
inundation. The main access to the SOY from Riverbank Drive and County Drive may be
covered by up to 8 inches of flood water during the peak of the 100-year storm.
The existing wall separating the SOY from the property to north might lessen the actual
contribution of runoff to the SOY, but as it is customary for 2D floodplain model studies,
the perimeter walls are not considered.
Future improvements to
the upstream Franklin
Barranca drainage system
may result in increased
runoff reaching the Santa
Clara River and the SOY.
This condition could
inadvertently increase the
flooding within the yard
from Franklin Barranca.

_____________________________________________________________________________________
Franklin-Brown-Sudden-Clark Page 68 Technical Study Report 2-Dimensional Floodplain Analysis June 30, 2014
g. Brown Barranca
i. Brown Barranca Reach 1 – U/S of Foothill Road
The deep natural channel through this reach is heavily vegetated and contains a private
farm crossing approximately 1200’ upstream of Foothill, in addition to large semi-circle
shaped stabilizer structure approximately 300’ upstream of Foothill Road. Both the
stabilizer and farm crossing were included in the FLO-2D model as hydraulic structures.
The channel depth varies from 20’ to over 30’ within this reach. Due to the depth of the
upstream channel, flows up to and including the 100-year event are contained within
the channel upstream of the culvert. At Foothill Road, the 10’W X 8.5’H arch culvert is
currently 80% full of sediment. For this project, this culvert was modeled as being
100% open. Ventura County Transportation Department Operations and Maintenance
Division informed the District that this culvert is scheduled to be cleaned out in the
Summer of 2014. With the culvert completely open, the estimated capacity from HEC-
RAS analysis is 2200 cfs, which is equivalent to the 200-year event.
Under current conditions, the culvert will
carry approximately 450 cfs, equivalent
to the Q10 flow. The modeled Q100 in
FLO-2D at the structure is 1424 cfs, while
the modeled Q100 in HEC-RAS at the
structure is 1590 cfs.

_____________________________________________________________________________________
Franklin-Brown-Sudden-Clark Page 69 Technical Study Report 2-Dimensional Floodplain Analysis June 30, 2014
ii. Brown Barranca Reach 2 – D/S of Foothill Road to Telegraph Road
Downstream of Foothill Road the deep natural channel contains all of the flows up to
and including the projected 100-year flow of 1750 cfs. For the 500-year flow, the
potential for a small amount of channel overtopping may occur on the south side of the
channel just downstream of Foothill Road. The upstream portion of the channel also is
affected by overland flow coming from Foothill Road to the northeast. This main path
of this overland flow from Foothill Road is in a southeasterly direction on Amador
Avenue and Galvin Circle with water reentering the channel at the terminus of Galvin
Circle, at Loma Vista and other locations. This reach of channel also has 3 drop
structures/stabilizers ranging
from 10’ to 14’ in height.
At Telegraph Road, the projected
Q100 from HSPF is 1750 cfs and
the 10’W X 10’H RCB transition to
10’W X 8.5’H RC Arch culvert and
has a capacity of approximately
1800 cfs based on HEC-RAS
analysis and the design drawings
2003-D-001.

_____________________________________________________________________________________
Franklin-Brown-Sudden-Clark Page 70 Technical Study Report 2-Dimensional Floodplain Analysis June 30, 2014
iii. Brown Barranca Reach 3 – D/S of Telegraph Road to Blackburn Road
Downstream of Telegraph Road, the natural channel continues through the surrounding
agricultural areas which is characterized by shallow flooding from overflow on
Telegraph Road impacting the private agricultural property on the west side of the
channel. This shallow surface flow travels in a southeasterly direction toward the
Brown Barranca/Wells Road/Freeway 126 interchange.
For events greater than a 25-year storm, water will overtop the channel upstream of
the Double 8’W X 6’H RCB culvert at Blackburn Road and will travel overland on both
the east and west sides, with the majority flowing to the southwest toward Freeway
126. Between the 50 and 100-year event, approximately 100-250 cfs leaves the channel
with the majority expected to overtop Wells Road at Blackburn Road.
The capacity of the Blackburn Road culvert is approximately 1314 to 1550 cfs based on
FLO-2D and HEC-RAS analyses, respectively. The projected Q100 at this location is
approximately 1900-2000 cfs based on the projected 1750 cfs through the Telegraph
Road Culvert plus the two incoming storm drains under Telegraph Road that deliver
water to Brown Barranca from the area to the west.

_____________________________________________________________________________________
Franklin-Brown-Sudden-Clark Page 71 Technical Study Report 2-Dimensional Floodplain Analysis June 30, 2014
iv. Brown Barranca Reach 4 – D/S of Blackburn Road to Freeway 126
Due to the capacity issues upstream, this reach is defined by a large volume of water
reaching Freeway 126 west of the channel. This water overtops the Freeway with some
of the water re-entering the open channel on both the north and south sides. The
remaining surface flow will travel northeasterly along Freeway 126 through the Wells
Road overpass toward the Saticoy Drain watershed.
At the Freeway 126 on and off ramps, the Double 8’W X 6’H RCB has a limited capacity
with water overtopping and following Blackburn Road to Freeway 126. There is a short
reach of approximately 200’ of open channel before the Triple 8’W X 6’ H RCB
underneath Freeway 126.
The original 100-year HSPF model shows that an additional 1000 cfs will be added to
the main channel flow on Brown Barranca to the Freeway 126 triple 8’W X 6’H RCB’s.
In reality, much of this flow would accumulate in the Caltrans open channel running
west to east parallel to the north side of Freeway 126. The two sets of double 5’W X 3’H
RCB culverts along this channel have an approximate capacity (flow before
embankment is overtopped) of 300 – 325 cfs. Due to this inadequate capacity, much of
the modeled flow in the Caltrans channel overtops Freeway 126 and flows easterly
down the Freeway.
As a result of the backwater
effect from the downstream
side of the freeway, the Triple
RCB underneath Freeway 126
has an estimated capacity of
1500 cfs, which is equivalent
to a 30-year flow, based on
HEC-RAS analysis, versus
1407 cfs from the FLO-2D
model. The projected HSPF
Q10 at this location is 836 cfs
while the Q100 is 2720 cfs.
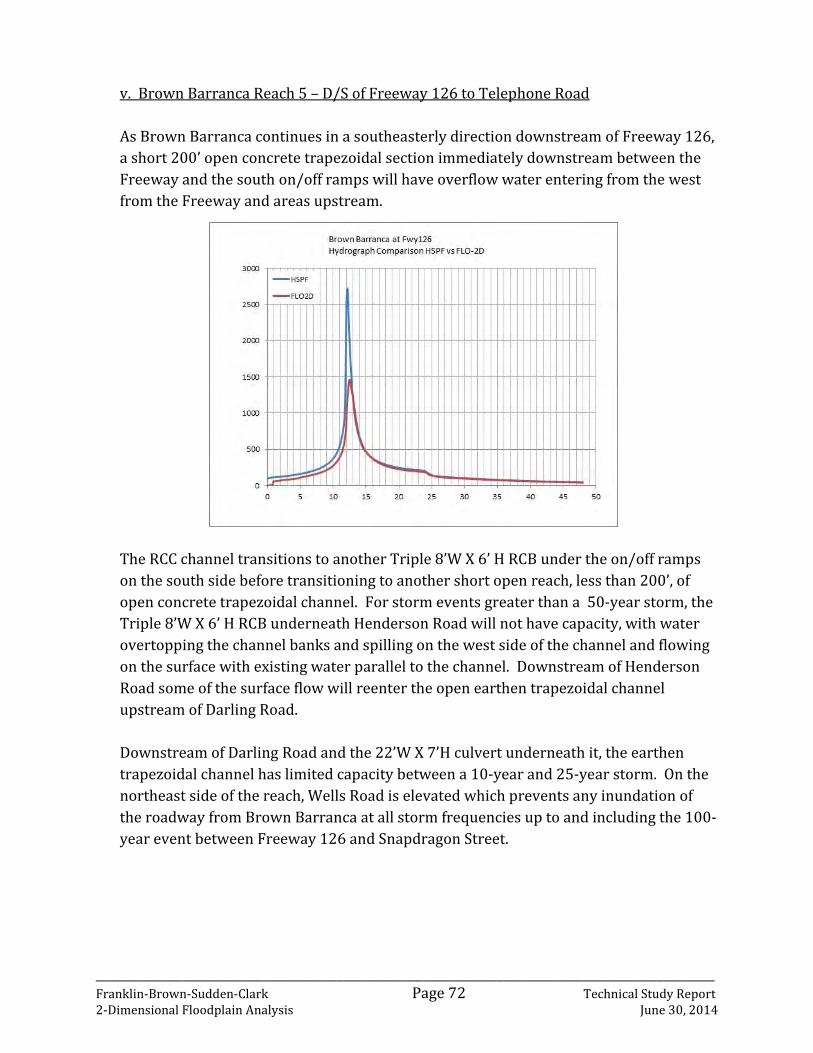
_____________________________________________________________________________________
Franklin-Brown-Sudden-Clark Page 72 Technical Study Report 2-Dimensional Floodplain Analysis June 30, 2014
v. Brown Barranca Reach 5 – D/S of Freeway 126 to Telephone Road
As Brown Barranca continues in a southeasterly direction downstream of Freeway 126,
a short 200’ open concrete trapezoidal section immediately downstream between the
Freeway and the south on/off ramps will have overflow water entering from the west
from the Freeway and areas upstream.
The RCC channel transitions to another Triple 8’W X 6’ H RCB under the on/off ramps
on the south side before transitioning to another short open reach, less than 200’, of
open concrete trapezoidal channel. For storm events greater than a 50-year storm, the
Triple 8’W X 6’ H RCB underneath Henderson Road will not have capacity, with water
overtopping the channel banks and spilling on the west side of the channel and flowing
on the surface with existing water parallel to the channel. Downstream of Henderson
Road some of the surface flow will reenter the open earthen trapezoidal channel
upstream of Darling Road.
Downstream of Darling Road and the 22’W X 7’H culvert underneath it, the earthen
trapezoidal channel has limited capacity between a 10-year and 25-year storm. On the
northeast side of the reach, Wells Road is elevated which prevents any inundation of
the roadway from Brown Barranca at all storm frequencies up to and including the 100-
year event between Freeway 126 and Snapdragon Street.

_____________________________________________________________________________________
Franklin-Brown-Sudden-Clark Page 73 Technical Study Report 2-Dimensional Floodplain Analysis June 30, 2014
At Telephone Road the projected 100-year flow from HSPF is 2950 cfs with the capacity
of the 22’W X 9’H culvert underneath Telephone Road being 2200 cfs, which is
equivalent to the 50-year event. However, upstream overflow results in only 1345 cfs
reaching the Telephone Road culvert. The 78” RCP with a 300 cfs capacity, Saticoy
Drain, also junctions with Brown Barranca underneath Telephone Road.
Downstream of Telephone Road, overflow from the channel joins the large amount of
existing flooding on both the east and west sides, traveling in a southeasterly direction
toward Santa Clara River.

_____________________________________________________________________________________
Franklin-Brown-Sudden-Clark Page 74 Technical Study Report 2-Dimensional Floodplain Analysis June 30, 2014
vi. Brown Barranca Reach 6 – D/S of Telephone Road to Railroad Tracks
The natural bottom trapezoidal channel continues downstream of Telephone Road and
ranges from 8-12’ in height and 15-25’ in bottom width. There are 2 private farm
crossings between Telephone Road and the railroad tracks. The FLO-2D model shows
the channel carrying up to approximately 1850 cfs until about 250’ upstream of the
railroad tracks, where the abandoned farm crossing causes a constriction of the
channel. Overflow from the channel at this location occurs at storm frequencies of 25-
year and greater, or approximately 1750 cfs. This overflow water will join the existing
flow overtopping Telephone
Road on the west side.
On the east side, the majority of
the surface water will flow down
Wells Road, with the potential
for a small amount to flow to the
west toward the open channel.
At the railroad tracks, the 28.5’
wide bridge has capacity to carry
approximately the 15-year flow
or 1100 cfs, though a lot of water
has already exited the channel
upstream and will not be
reaching this location.

_____________________________________________________________________________________
Franklin-Brown-Sudden-Clark Page 75 Technical Study Report 2-Dimensional Floodplain Analysis June 30, 2014
vii. Brown Barranca Reach 7 – D/S of Railroad Tracks to Santa Clara River
As the natural bottom trapezoidal channel continues downstream of the railroad tracks,
it can carry the flow up to and including the 15-year event or approximately 1400 cfs.
For these lower frequency storm events, surface water also has the potential to enter
the open channel on the east side. For the 50-year storm event and greater, water will
exit the channel on its west side near Nardo Street and join the large amount of water
already overtopping the railroad tracks and areas north. The agricultural area to the
west of this reach is almost
completely inundated for events
50-year or greater.
On the downstream end of this
reach the HSPF projected Q10 is
1077 cfs, while the Q100 is 3330
cfs. The FLO-2D model shows
approximately 1400 cfs within the
channel, as much of the flow has
already exited the channel and
entered the floodplain area.

_____________________________________________________________________________________
Franklin-Brown-Sudden-Clark Page 76 Technical Study Report 2-Dimensional Floodplain Analysis June 30, 2014
h. Saticoy Drain
i. Saticoy Drain Reach 1 – Freeway 126 to Darling Road
Saticoy Drain begins just upstream of Freeway 126 as 2 - 48” RCP’s underneath the
freeway. The area upstream of Freeway 126 is mostly residential and the inlet to the
double pipes receives most of its runoff via Pajaro Avenue with additional water coming
from the east along the freeway. On the downstream side of the freeway, the pipes
transition to an earthen trapezoidal channel with 9’ bottom width, 6’ of depth and side
slopes of 1.5:1. This portion of open channel has some areas of concrete and/or rip-rap
bank stabilization along both banks. To the west of this downstream reach, the
agricultural area will have water that has overtopped the Freeway flowing in a
southerly direction for all modeled storm frequency events. To the east, the potential
for water spilling from the Franklin-Wason confluence and reaching Saticoy Drain for
the higher frequency storms exists. Approximately 700 feet downstream of the freeway
the channel transitions to an 18’ bottom width, 6.5’ deep earthen bottom trapezoidal
channel with 2:1 rock riprap side slopes. This portion is roughly 550 feet in length and
at the downstream end transitions to the 10’W X 5’ H RCB under Darling Road. At this
location the projected HSPF Q10 is 111 cfs and the Q100 is 295 cfs. Local flow
combines with the overflows from the Franklin-Wason confluence resulting in a
combined FLO-2D peak of 400-450 cfs. The RCB and connecting 78” RCP have a
capacity of 300 cfs, resulting in excess flow leaving westward and combining with the
overflow from Brown
Barranca along Freeway 126.
The area between Wells Road
and the channel portion of
Saticoy Drain is subject to
flooding, with the main
concentration heading
southeast along Wells
Road/Los Angeles Avenue,
eventually joining other
outflows from Franklin
Barranca to inundate the
areas between Franklin
Barranca and Brown
Barranca.

_____________________________________________________________________________________
Franklin-Brown-Sudden-Clark Page 77 Technical Study Report 2-Dimensional Floodplain Analysis June 30, 2014
ii. Saticoy Drain Reach 2 – D/S of Darling Road to Brown Barranca
On the downstream side of Darling Road the RCB transitions to a 78” RCP with 300 cfs
capacity as shown on Y-2-0442. The 78” RCP continues in a southerly direction for
approximately 1200 feet before turning to the west and continuing for another 1200
feet to its junction with Brown Barranca underneath Telephone Road.
Although the RCP along this
reach has capacity to carry the
projected 100-year delivered
flow, the large amount of
surface flow coming from
Franklin-Wason to the east
that impacts the upstream
Reach 1 open channel and the
resulting overflow from the
channel immediately upstream
of Darling Road, will flow
overland in a southwesterly
direction concentrating at
Wells Road and Telephone
Road.

_____________________________________________________________________________________
Franklin-Brown-Sudden-Clark Page 78 Technical Study Report 2-Dimensional Floodplain Analysis June 30, 2014
i. Sudden Barranca
i. Sudden Barranca Reach 1 – U/S and parallel to Foothill Road
Upstream of Foothill Road, the contributing watershed is mixed open space and
agriculture. The shallow (2-4’) and wide (~60-80’) natural channel flows in a
southeasterly direction toward Foothill Road at which point it turns to the east,
transitions to a concrete trapezoidal channel with base width of 6’, height of 4’ and side
slopes 2:1. This trapezoidal channel runs parallel to Foothill Road on the north side.
Because the channel upstream of Foothill Road is heavily vegetated, and LiDAR does not
show a well-defined channel, water will get out of the natural channel at various
locations upstream of Foothill Road for all studied storm frequencies. As the flows
approach the road, only 58 cfs of the initial projected Q100 of 353 cfs makes it into the
modeled FLO-2D channel. A small amount of water overtopping will travel to the east
through the surrounding agriculture area, reentering trapezoidal channel along Foothill
Road. In addition to the water exiting the channel upstream of Foothill Road, at the
transition to the trapezoidal channel water will overtop Foothill Road for all
frequencies and flow in southeasterly direction through the orchard area south of
Foothill Road.
Immediately upstream of the Foothill Road culvert, the trapezoidal channel transition
to the a 10’W X 10’H RCC with a 6’ Drop Structure into the 6’W X 6’H RCB culvert under
Foothill Road. The projected HSPF Q10 at this location is 100 cfs while the Q100 is 372
cfs. The capacity of this culvert underneath Foothill Road is estimated at 475 cfs based
on HEC-RAS, which is equivalent to the 200-year storm event.
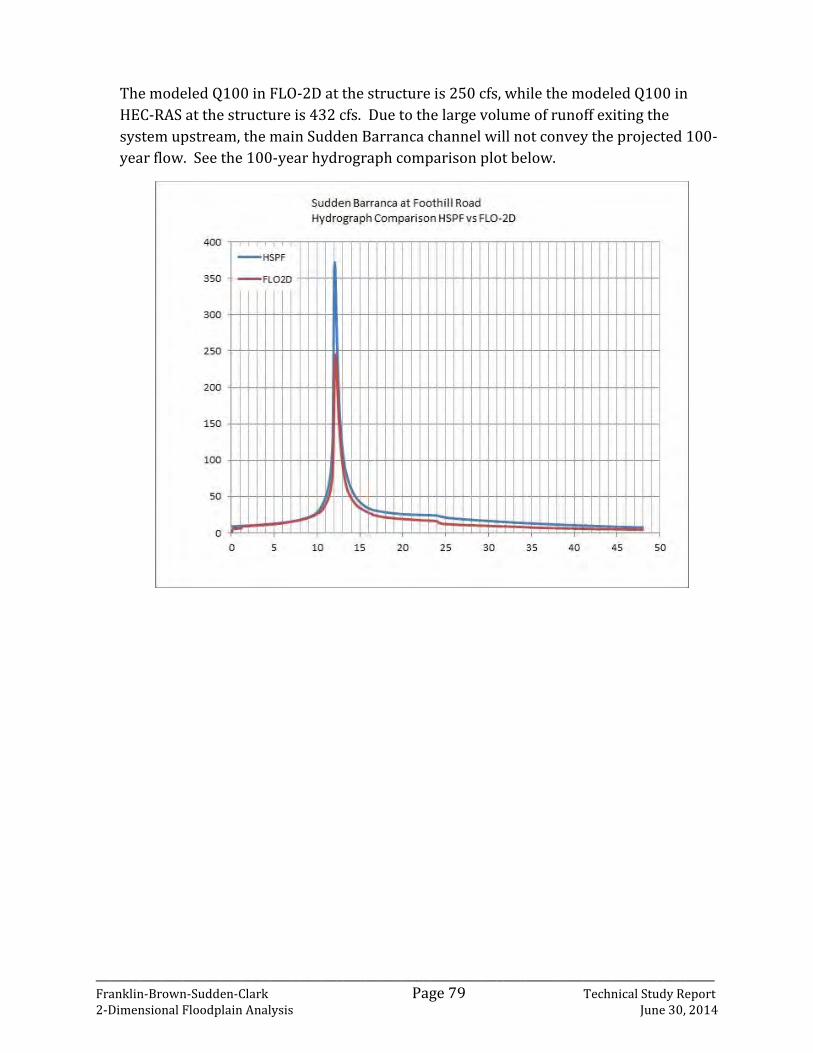
_____________________________________________________________________________________
Franklin-Brown-Sudden-Clark Page 79 Technical Study Report 2-Dimensional Floodplain Analysis June 30, 2014
The modeled Q100 in FLO-2D at the structure is 250 cfs, while the modeled Q100 in
HEC-RAS at the structure is 432 cfs. Due to the large volume of runoff exiting the
system upstream, the main Sudden Barranca channel will not convey the projected 100-
year flow. See the 100-year hydrograph comparison plot below.

_____________________________________________________________________________________
Franklin-Brown-Sudden-Clark Page 80 Technical Study Report 2-Dimensional Floodplain Analysis June 30, 2014
ii. Sudden Barranca Reach 2 – D/S of Foothill Road to Telegraph Road
Downstream of Foothill Road, the channel is a concrete trapezoidal channel with base
width of 3’, height of 5’ and side slopes of 2:1. It flows in a southeasterly direction
through the agriculture areas, which consists mostly of orchard. There is one private
farm crossing in this reach, 820’ downstream of Foothill Road, but it has capacity to
carry in excess of the 100-year flow. The channel itself along this reach has capacity to
carry up to and including the 50 year flow for the entire reach, but at the 100-year flow,
there is some breakout from the channel on its west side 1650’ downstream Foothill
Road. Because of the large breakout upstream of the channel, the channel itself has
some additional capacity in this reach. The surrounding area is characterized by large
amounts of surface flow through the orchards on both the east and west side. The
water present on west side of the channel is from the breakout upstream of Foothill
Road as described in Reach 1. Most of this water travels parallel with the channel, with
a small amount entering the open channel on the downstream end. Technically, partly
within the Brown Barranca watershed, the flow on the east side is from overtopping
Foothill Road and flows in the same general southeasterly direction toward Telegraph
Road.
The 6’W X 6’ RCB crossing
Telegraph Road has a capacity of
828 cfs as shown on Y-2-1924.
The HSPF Q10 at this location is
148 cfs while the Q100 is 538 cfs.

_____________________________________________________________________________________
Franklin-Brown-Sudden-Clark Page 81 Technical Study Report 2-Dimensional Floodplain Analysis June 30, 2014
iii. Sudden Barranca Reach 3 – D/S of Telegraph Road to Freeway 126
230’ downstream of Telegraph Road, the 6’W X 6’H RCB transitions to a 78” RCP. The
east overbank area for this reach consists of orchards while the west overbank area is a
residential neighborhood. There is no flooding shown above the upper portion of the
78” RCP, because the RCB at Telegraph Road currently has capacity to carry the
delivered flow due to breakouts upstream and at Foothill Road. But at the downstream
end, approximately 130’ north of the freeway, the 78” RCP transitions to a 90” RCP as it
turns to the northeast, running parallel to the north side of the Freeway 126. This area
has the potential for some flooding due to inefficiencies in the storm drain system
junctions and inlets. The large amount of surface overflow to the west of the 78” RCP
through this reach concentrates along Petit Road and other smaller streets running in a
north-south direction, eventually reaching Freeway 126, where a small amount of
water will enter the open Clark Barranca channel north of the freeway, and the
remaining majority of the water ponding and overtopping the freeway for all frequency
storms. The east side of this reach is characterized by additional shallow flooding
through the orchard for storm events of 50-year or greater. This water then ponds on
the north side of the freeway with some overtopping the freeway and continuing in a
southeast direction. The 90” RCP transitions to a 108” RCP as it crosses under Freeway
126. The HSPF projected Q10 at this location is 179 cfs while the Q100 is 650 cfs.
Based on Y-2-2059, the design capacity for the 108” RCP under the Freeway is 1252 cfs,
which is equivalent to the 500-year flow. Due to the large volume of breakouts
upstream, the delivered flow within the pipe system is less than the HSPF Q’s at this
location.

_____________________________________________________________________________________
Franklin-Brown-Sudden-Clark Page 82 Technical Study Report 2-Dimensional Floodplain Analysis June 30, 2014
iv. Sudden Barranca Reach 4 – D/S of Freeway 126 to Telephone Road
Downstream of Freeway 126, the 108” RCP transitions to a 10’W X 6’H RCB. 970’ feet
downstream, at Darling Road, the RCB transitions to a 10’W X 6’H RCC. As in the other
reaches upstream, this RCC currently contains the flow for all storm frequencies, due to
the large volume of flow that has already left the system upstream, contributing to the
floodplain. 650’ downstream of Darling Road, at Pueblo Street, the open channel
becomes a 10’W X 6’H RCB under the road. For the 500-year simulation, FLO-2D shows
a small amount of overtopping over the west bank with the water joining the existing
surface flow down Utica Avenue. Downstream of Pueblo Street, the RCB transitions
back to an 8.5’W X 7.5’H RCC. 680’ downstream of Pueblo Street, the RCC transitions to
a 9’W X 7.5’H RCB underneath Las Cruces Street. Due to water leaving the system
upstream, the FLO-2D model shows a Q100 of only 410 cfs within the channel between
Pueblo Street and Las Cruces Street, while the RCB underneath Las Cruces Street has a
design capacity of 1159 cfs based on Y-2-1713. Downstream of Las Cruces Street, the
9’W X 7.5’H RCB continues parallel to Telephone Road on the north side before crossing
Telephone Road just west of its intersection with Gardner Avenue.
This reach is characterized by large amounts of surface flow north of Darling Road
which then concentrates as street flow along the north-south oriented streets south of
Darling Road. At Telephone Road, a majority of this street flow will travel to the west
joining with the overflow from Clark Barranca overtopping Telephone Road to the east
and west of Petit Avenue.

_____________________________________________________________________________________
Franklin-Brown-Sudden-Clark Page 83 Technical Study Report 2-Dimensional Floodplain Analysis June 30, 2014
v. Sudden Barranca Reach 5 – D/S of Telephone Road to Railroad Tracks
The 9’W X 7.5’H RCB continues downstream of Telephone Road for approximately 350’
feet to Lake Vista Street, where it transitions to a 9’W X 6’H RCC. The area from
Telephone Road to Lake Vista Street is characterized by shallow flooding coming from
Telephone Road for all frequency storms. A small amount of this water will re-enter the
open channel downstream of Lake Vista Street, but the majority flows to the west along
Lake Vista Street to Jasper Avenue. 220’ upstream of Halifax Street the 9’W X 6’H RCC
changes to a 9’W X 6.5’H RCC before becoming a 9’W X 6.5’H RCB underneath Halifax
Street.
Downstream of Halifax Street, the 9’W X 6.5’H RCC continues in a southeasterly
direction toward the Railroad Tracks before becoming a 9’W X 8.5’H RCC 160’ upstream
of the Railroad Tracks. For this downstream section of RCC, the FLO-2D model shows a
Q100 in the channel ranging from 538 cfs just downstream of Halifax Street to 663 cfs
just upstream of the Railroad Tracks. The design capacity for this channel section
ranges from 1183 cfs to 1240 cfs. The FLO-2D model shows some water entering the
open channel just upstream of the Railroad Tracks from both Brazos Court on the east
and Big Horn Street on the west. At the Railroad Tracks the RCC transitions to an 8’W X
7’ Arch Culvert with a design capacity of 1240 cfs.

_____________________________________________________________________________________
Franklin-Brown-Sudden-Clark Page 84 Technical Study Report 2-Dimensional Floodplain Analysis June 30, 2014
vi. Sudden Barranca Reach 6 – D/S of Railroad Tracks to Santa Clara River
Immediately downstream of the Railroad Tracks the channel invert drops by about 8’.
The channel immediately downstream is a natural bottom trapezoidal. A large 19’ drop
structure is present in the channel 370’ downstream from the Railroad Tracks. After
the drop structure, the natural bottom trapezoidal channel continues until it reaches
the 30’W X 8’H RCB under North Bank Drive. Some shallow flooding along North Bank
Drive from the breakouts above will overtop at this location and re-enter the open
channel on the downstream side of North Bank Drive.

_____________________________________________________________________________________
Franklin-Brown-Sudden-Clark Page 85 Technical Study Report 2-Dimensional Floodplain Analysis June 30, 2014
j. Clark Barranca
i. Clark Barranca Reach 1 – U/S to Foothill Road
Upstream of Foothill Road the watershed consists of mainly orchards. At Foothill Road,
small ditches on the north side collect runoff from the areas to the north directing the
flow to the 4’W X 4’H RCB underneath Foothill Road just west of Imperial Avenue. Built
in 1991, Foothill Road Drain Unit I project connected a new 54” RCP to the existing 4’W
X 4’H RCB underneath Foothill Road which carries flows west to Harmon Barranca.
From Y-2-2090, the Foothill Road Drain is designed to carry Q50’s ranging from 82-127
cfs and Q100’s ranging from 104-160 cfs. Foothill Road Drain has 100-year capacity
and will carry the HSPF projected Q100 of 67 cfs. For the 500-year flows, there will be
some overtopping of Foothill Road on the west side of the original trapezoidal channel,
just west of Imperial Avenue.

_____________________________________________________________________________________
Franklin-Brown-Sudden-Clark Page 86 Technical Study Report 2-Dimensional Floodplain Analysis June 30, 2014
ii. Clark Barranca Reach 2 – D/S of Foothill Road to Telegraph Road
Downstream of Foothill Road the shallow water overtopping during the 500-year event
will travel southerly on San Diego Avenue to El Dorado Street. No water is shown
within the existing open trapezoidal channel between Foothill Road and El Dorado
Street, due to the diversion upstream from Foothill Road Drain. Downstream of El
Dorado Street, the channel transitions to a 36” RCP which runs underneath Atherton
Street. At El Dorado Street adjacent to the channel, surface flow for all frequency
storms, splits with some of the water following the general alignment of the RCP along
Atherton Avenue and additional water traveling in an easterly direction along El
Dorado Street to Imperial Avenue, where it flows in a southeasterly direction.
Upstream of Loma Vista, the 36” RCP transitions to a 42” RCP with a design Q50 of 88
cfs and design Q100 of 106 cfs. As the water on Imperial Avenue continues toward
Solano Street on the east side, the overflow on the west side will overtop Loma Vista
and continue in a southeasterly direction. Downstream of Loma Vista the 42” RCP
becomes a 48” RCP until Solano Street at which point it joins with the 42” RCP from the
west along Solano Street and becomes a 66” RCP and turns south under Solano Street,
transitioning to a 13’W X 4.5’H RCB at Telegraph Road.
Along Solano Street near the
intersection with Imperial
Avenue the surface flow
reaching this area will travel
to the east to San Mateo
Avenue where it will flow to
the south, reaching Telegraph
Road, where the water will
split with some continuing
east along Telephone Road
and the remaining water will
continue south on San Mateo
Avenue. Shallow amounts of
water will also be
overtopping Telegraph Road
throughout this area for all
storm frequencies. The
projected HSPF Q10 at
Telegraph Road is 125 cfs and the Q100 is 271 cfs. The design capacity for the RCB
under Telegraph Road is 408 cfs, as shown on Y-2-2039.

_____________________________________________________________________________________
Franklin-Brown-Sudden-Clark Page 87 Technical Study Report 2-Dimensional Floodplain Analysis June 30, 2014
iii. Clark Barranca Reach 3 – D/S of Telegraph Road to Freeway 126
The 13’W X 4.5’H RCB underneath Telegraph Road transitions to a concrete trapezoidal
channel with a base width of 4.5’ and a height of 3.5’ and side slopes of 2:1. No
overtopping of the channel itself is shown for any of the modeled storm events, with
FLO-2D showing a Q100 of 140 cfs within the channel until just north of Freeway 126.
There is no overtopping of the channel itself because water has left the system and is
flowing within the streets in parallel to the channel. Inflows within FLO-2D were
modeled by adding the prorated hydrographs to floodplain elements within the streets.
Flow from these locations then follows the topography until it reaches hydraulic
structures representing the inlets to the stormwater pipe system. Because Clark
Barranca is primarily underground, the FLO-2D has modeled it as a long culvert, with
no inlets coming into along the way. Due to City storm drain capacity limitations
(typically Q10), and lack of inlets into the underground Clark Barranca element in the
FLO-2D model, excess flow continues southward down streets towards Freeway 126
and does not reach the Clark Barranca channel. Within the surrounding streets the
flood depths are generally less than 0.5’ and contained within the curb and gutter.
Approximately 1330’ downstream from Telegraph Road, the trapezoidal channel
changes to an 8’W X 3.5’H RCB under Balboa Street transitioning back to the trapezoidal
channel downstream. As the channel approaches Freeway 126, it becomes an 8’W X 3’H
RCB as it bends to the east.

_____________________________________________________________________________________
Franklin-Brown-Sudden-Clark Page 88 Technical Study Report 2-Dimensional Floodplain Analysis June 30, 2014
As it runs along the north side of and parallel to Blackburn Road, it becomes a 10’W X
4’H RCC. Much of the surface flow from the north crosses Blackburn Road in this area
and enters the Caltrans trapezoidal channel along the north side of Freeway 126. As the
channel continues in an easterly direction along Blackburn Road, approximately 200’ to
the east of Lakewood Avenue, the RCC transitions to a 8’W X 4’H RCB underneath
Blackburn Road and junctioning with the existing trapezoidal channel on the north side
of Freeway 126. This concrete trapezoidal channel has a base width of 10’ and height of
5’ with 1:1 side slopes. Some of the surface flow from Blackburn Road in addition to
runoff from the Freeway will enter the channel along this section.
The FLO-2D model shows a Q100 ranging from 450-580 cfs inside the channel before it
turns south and goes underneath Freeway 126. At this location the projected Q100
from HSPF is 894 cfs. The channel becomes a Double 5’W X 5’H RCB underneath
Freeway 126 near Petit Road. It junctions with the Petit Road storm drain system
underneath the Freeway, becoming a triple 5’W X 5’H RCB. The surrounding area is
characterized by flood depths ranging from 0.5’ up to 3’ for the 100 year storm,
inundating Blackburn Road, Freeway 126 and areas to the north and south. See 100-
year hydrograph comparison plot below.

_____________________________________________________________________________________
Franklin-Brown-Sudden-Clark Page 89 Technical Study Report 2-Dimensional Floodplain Analysis June 30, 2014
iv. Clark Barranca Reach 4 – D/S of Freeway 126 to Telephone Road
The channel transitions to a 7’W X 7’H RCB downstream of Freeway 126 and continues
in a southeasterly direction until it reaches Telephone Road. The full flow capacity
calculated for this RCB ranges from 665 to 820 cfs. The surrounding streets carry flows
in a southeasterly direction toward Telephone Road, with 100-year depths less than
1.0’. As the 7’W X 7’H RCB turns toward the east at Telephone Road it becomes a 7’W X
8’H RCB along the north side of Telephone Road. The 7’W X 8’H RCB channel then turns
toward the south crossing Telephone Road. The entire area surrounding Telephone
Road and Petit Road will have flooding ranging in depths from 0.5’ to just over 1.0’
during the 100-year event. Flows for the underground portion of this system from
Freeway 126 to the Santa Clara River are transferred directly from the inlet to the
outlet of the system. Intermediate inlet locations were not modeled.
As a result, excess flows as
well as local inflow
hydrographs continue
southeasterly along surface
streets with deeper ponding
occurring at the
intersections of Greensboro
Road and Denver Street,
Albany Avenue and Las
Cruces Street. See 100-year
hydrograph comparison
plot.

_____________________________________________________________________________________
Franklin-Brown-Sudden-Clark Page 90 Technical Study Report 2-Dimensional Floodplain Analysis June 30, 2014
v. Clark Barranca Reach 5 – D/S of Telephone Road to Railroad Tracks
On the immediate downstream side of Telephone Road the 7’W X 8’H RCB becomes a
8’W X 8’H RCB. 200’ downstream of Telephone Road the 8’W X 8’H RCB transitions to a
5’ RCP and parallel 7.5’ RCP as it continues southeasterly under Petit Road. The portion
of Petit Road from Telephone Road to the Railroad Tracks will have flood depths
ranging from 0.5’ to 1.5’ for the 100-year event. Flows from Lucerne Street on the east
side of Petit Road and other surrounding streets will convey water to Petit Road. At the
Railroad Tracks this surface flow on Petit Road will split to the east and west inundating
the residential areas to the southwest and southeast with 100-year flood depths
ranging from 0.5’ up to a few small areas with 2.5’ depth. Deeper ponding from the
excess flows and inflow hydrographs also occur at the intersection of Neath Street and
Exeter Avenue. See 100-year hydrograph comparison plot below.

_____________________________________________________________________________________
Franklin-Brown-Sudden-Clark Page 91 Technical Study Report 2-Dimensional Floodplain Analysis June 30, 2014
vi. Clark Barranca Reach 6 – D/S of Railroad Tracks to Santa Clara River
100’ downstream of the Railroad Tracks, the parallel 5’ and 7.5’ RCP junction and
transition to a 7’W X 7’H RCB as it continues to the Santa Clara River. Water flowing
south on Carson Way to North Bank Drive and traveling to the east will inundate the
North Bank Drive at the channel outlet to Santa Clara River with 100-year depths of 0.5’
to 1.5’ eventually overtopping the road and entering the natural channel on the
downstream side.
Additional water from Carson
Way will continue in a
southerly direction
concentrating and flowing
along Arroyo Seco Drive and
San Joaquin Avenue. For the
natural channel just
downstream of North Bank
Drive the projected HSPF Q100
is 1180 cfs, while the FLO-2D
model shows Q100 in the
channel ranging from 730 –
965 cfs. See 100-year
hydrograph comparison plot
below.

_____________________________________________________________________________________
Franklin-Brown-Sudden-Clark Page 92 Technical Study Report 2-Dimensional Floodplain Analysis June 30, 2014
8. FLOOD DAMAGE ASSESSMENT AND STATISTICS
a. Introduction
VCWPD District facilities within the FBSC watersheds were designed to either pass the 50-
year flood event with additional added freeboard or the 100-year event, whichever is
greater. Non-District facilities such as the natural portions of channels along Brown,
Franklin, Sudden, and Wason as well as City stormdrains have capacities that vary. As a
result flooding occurs due to restrictions in the stormdrain system preventing runoff from
making it to the main channels, outflows from current facilities for events larger than the
original design capacity, and overtopping due to a reduction in event capacity resulting
from increased flood flow calculations. Resultant flood damages were estimated based on
the US Department of Housing and Urban Development (HUD) methods and parameters
(1975) provided by the District’s Advance Planning Section.
b. Generalized Flood Damage Methodology
The HUD methodology is generally applied to residential areas. Based on the number of
floors, whether a basement is present, and the depth of flooding; a percentage of the
structure’s value is assigned to represent both damage to the building and damage to its
contents. A HUD Damage Summary Table containing these percentages was created from
the original document provided by the District and interpolated at 0.1’ intervals.
For this study, the process was also applied to non-residential structures. Agricultural
damages were assigned based on $25,000 per flooded acre which is consistent with the
District’s 2009 Lower Calleguas Creek report assumptions.
c. Evaluation
In general, most flood damage assessments utilize a 1-D modeling scheme that generates a
single water surface elevation across the entire modeled floodplain, with varying depths
based on the floodplain topography. This methodology results in a flat pool that is
inconsistent with real world conditions within urban areas and locations where the
channel overbanks are appreciably lower than the main channel. The resultant floodplain
would then be intersected with available parcels to determine overall flood damages.
The analysis for this study employs 2-D modeling using FLO-2D based on a 25’x25’ cell size.
The added detail due to calculating flood routing on cell by cell basis rather than a single
cross-section, allows us to include features such as streets and their adjacent areas within

_____________________________________________________________________________________
Franklin-Brown-Sudden-Clark Page 93 Technical Study Report 2-Dimensional Floodplain Analysis June 30, 2014
the conveyance computations. In many cases, the more comprehensive analysis shows
flooding to be mostly within the street.
Using solely a spatial assessment with the parcel data may overestimate the predicted
damages for the various storm events. Instead, more precise building footprints were used
for this purpose. This information was originally digitized by the City of Ventura and
checked and/or supplemented by Kasraie Consulting.
Where available, County Assessor parcel data needed for the HUD methodology such as the
number of floors, total square footage, land-use description, taxable land value, and taxable
improved value were attached to the buildings through a spatial join. Parcels having more
than one building resulted in duplicate data; structures in these cases were dissolved into
one feature based on the unique APN number of the parcel. If County Assessor data was not
available within the version of the database used, it was estimated using ESRI’s ArcMap and
Google Earth applications.
Due to California Prop 13, taxable values for properties included in the County Assessor
parcel database do not reflect actual market value. Instead, market values as of April 2014
were estimated from the realty tracking website www.Zillow.com were utilized. The
project area was divided into 30 separate categories based on either building type or
neighborhood. For each category, home values were calculated for a sample set and a
median value per square foot was determined. For commercial, industrial, and public lands
$275/square foot was used, which is consistent with the 2012 Upper Calleguas Flood
Damage Assessment. Total Market Values were determined by taking the square footage of
each structure and multiplying it by the median value per square foot. For the HUD
Methodology, damages are calculated based on only the value of the structure. For parcels
that contain separate structure (improved) and land values (used for tax purposes, not
market value), a ratio of structure to total taxable value was determined. This ratio (as-is,
no adjustments for outliers) was then applied to the Total Market Value for each property.
For all other properties, the average ratio of 0.58 was used.
Maximum flood depths to the nearest tenth of a foot for each recurrence interval were
determined by exporting the flood depth layer from the FLO-2D model, converting it to a
TIN (triangulated irregular network) surface, and then intersecting it with the digitized
building layer (See Figure 23). The HUD Damage Summary Table was joined to the
digitized buildings layer based on flood depth to calculate damages for the structure and its
contents.

_____________________________________________________________________________________
Franklin-Brown-Sudden-Clark Page 94 Technical Study Report 2-Dimensional Floodplain Analysis June 30, 2014
Figure 23 100-Year Event Damage Overlay Example
A summary of flood damages and annualized costs for depths greater than or equal to 6-
inches (consistent with the 2012 Upper Calleguas Damage Assessment) are listed below
(Table 8). Annualized costs were determined using the methodology within the FEMA
Benefit Cost Analysis (BCA). They represent the amount of damage that can be expected
annually based on the probability of each of the modeled recurrence intervals happening.
Top number = maximum depth
Bottom number = damage ($)
Table 8 Studywide Flood Damage Costs for Depths Greater Than 6-inches

_____________________________________________________________________________________
Franklin-Brown-Sudden-Clark Page 95 Technical Study Report 2-Dimensional Floodplain Analysis June 30, 2014
Additional summaries by watershed and jurisdiction are also included (Tables 9–20)
below. This information can be utilized to prioritize future capital improvement projects
within the project area.
Damages by Watersheds
Table 9 Brown Barranca Watershed Flood Damage Costs for Depths Greater Than 6-inches

_____________________________________________________________________________________
Franklin-Brown-Sudden-Clark Page 96 Technical Study Report 2-Dimensional Floodplain Analysis June 30, 2014
Table 10 Clark Barranca Watershed Flood Damage Costs for Depths Greater Than 6-inches
Table 11 Franklin Barranca Watershed Flood Damage Costs for Depths Greater Than 6-inches

_____________________________________________________________________________________
Franklin-Brown-Sudden-Clark Page 97 Technical Study Report 2-Dimensional Floodplain Analysis June 30, 2014
Table 12 Mammoth Street-54” RCP Watershed Flood Damage Costs for Depths Greater Than 6-inches
Table 13 Montgomery Avenue Watershed Flood Damage Costs for Depths Greater Than 6-inches

_____________________________________________________________________________________
Franklin-Brown-Sudden-Clark Page 98 Technical Study Report 2-Dimensional Floodplain Analysis June 30, 2014
Table 14 Saticoy Yard Watershed Flood Damage Costs for Depths Greater Than 6-inches
Table 15 Saticoy Avenue Drain Watershed Flood Damage Costs for Depths Greater Than 6-inches
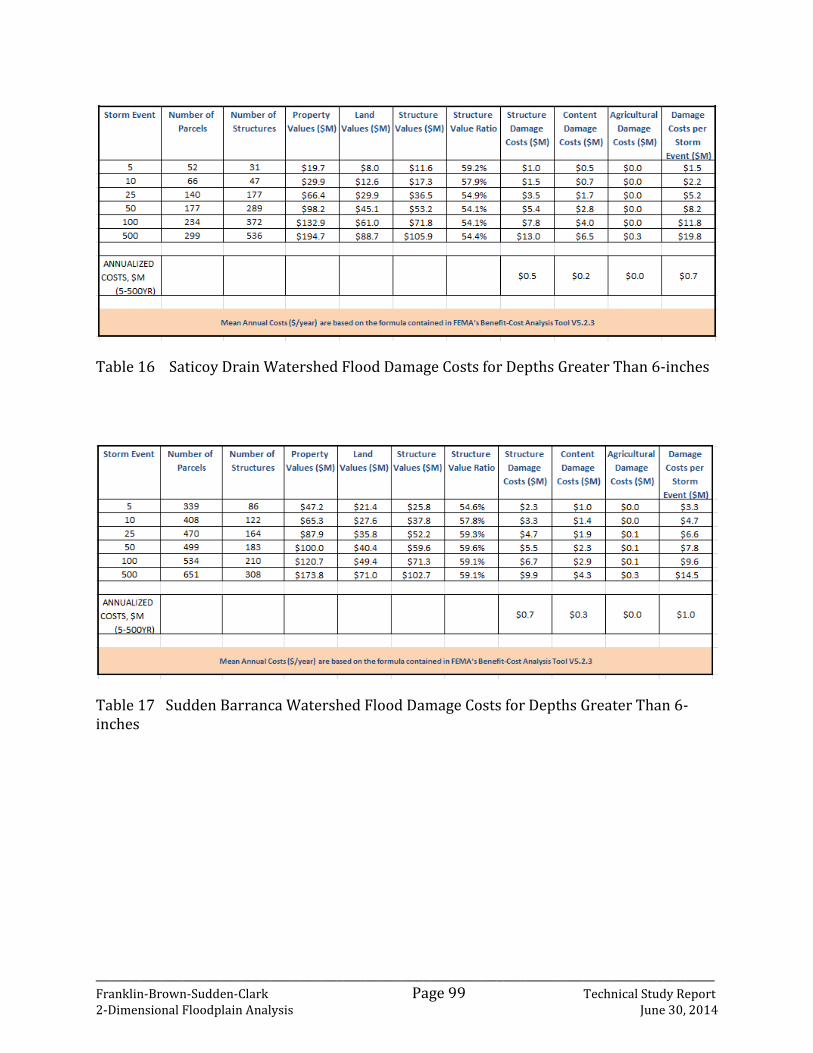
_____________________________________________________________________________________
Franklin-Brown-Sudden-Clark Page 99 Technical Study Report 2-Dimensional Floodplain Analysis June 30, 2014
Table 16 Saticoy Drain Watershed Flood Damage Costs for Depths Greater Than 6-inches
Table 17 Sudden Barranca Watershed Flood Damage Costs for Depths Greater Than 6-inches

_____________________________________________________________________________________
Franklin-Brown-Sudden-Clark Page 100 Technical Study Report 2-Dimensional Floodplain Analysis June 30, 2014
Table 18 Wason Barranca Watershed Flood Damage Costs for Depths Greater Than 6-inches

_____________________________________________________________________________________
Franklin-Brown-Sudden-Clark Page 101 Technical Study Report 2-Dimensional Floodplain Analysis June 30, 2014
Damages by Jurisdiction
Table 19 City of Ventura Area Flood Damage Costs for Depths Greater Than 6-inches
Table 20 Unincorporated County Areas Flood Damage Costs for Depths Greater Than 6-inches

_____________________________________________________________________________________
Franklin-Brown-Sudden-Clark Page 102 Technical Study Report 2-Dimensional Floodplain Analysis June 30, 2014
d. Statistics
As a planning level study, this set of FLO-2D modeling is not intended to replace the
existing FEMA floodplain analysis included in the 2010 Ventura County and Incorporated
Area Flood Insurance Study (FIS). However, it is useful to compare them to avoid confusion
regarding why their flooding extents differ so greatly.
Out of the four main tributaries within the FLO-2D model domain, only portions of Franklin
(Darling Road to the Santa Clara River) and Brown (approximately 400-500 feet upstream
of Telegraph Road to the downstream side of Freeway 126) were studied in detail. In both
cases, the FIS hydrology results in significantly lower flows (17-25%) at their outlets than
those from the current HSPF model that was provided by the District.
Based on these flows and the HEC-RAS model used to determine the stream hydraulics,
Franklin does not overtop during a 1% annual chance event and was mapped as an
approximate zone (no profiles or BFEs) due to mapping constraints. The majority of the
detailed segment of Brown included in the FIS is mainly in an area where the channel is
deep and incised, thus containing the 1% annual chance flood. Additionally, the FIS study
assumes that all of the excess runoff from the watershed makes it to the channels, which is
not necessarily the case due to limited capacities of the stormwater network (inlets and
pipes) that empties into the main channels.
Immediately upstream of Freeway 126, the mapping and modeling show that the flow
overtops the channel into the adjacent agricultural area. This is area was still being used for
agriculture at the time of the 2013 aerial photography. The remainder of Brown, until its
confluence with the Santa Clara River is mapped as an approximate zone.
For these reasons, when we spatially overlay the effective floodplain with the County
parcels and digitized structures, a limited number are shown to be affected (see Table 21).
Table 21 FEMA Effective Floodplain (2010) – Structures and Parcels Subjected to
Mandatory Flood Insurance By Land Use*

_____________________________________________________________________________________
Franklin-Brown-Sudden-Clark Page 103 Technical Study Report 2-Dimensional Floodplain Analysis June 30, 2014
In contrast, the FLO-2D study encompasses flooding over the entire study area. This
includes situations where restrictions in the storm drain system create localized flooding
as well as outflows from the main channels of Franklin, Brown, Sudden, and Clark. Due to
this added detail, a significantly larger amount of parcels and structures are shown to be
affected by flooding (see Table 22).
Table 22 FLO-2D 100-Year Event - Structures and Parcels Subjected to Flood Insurance By
Land Use**