fs4-05 recent key materials research on hydrogen storage
TRANSCRIPT

Recent Key Materials Research on Hydrogen Storage and PEM-fuel Cell
in Taiwan Power Company
San-Der. Chyou*1 Win-Tai.Lee*1 Hwa-Chong Tien*2
Shing-Hoa Wang*2 Ying-Ling Liu*3 Shinn-Shyong Tzeng*4
*1 Taiwan Power Research Institute, Taiwan Power Company, Taipei, Taiwan *2 National Taiwan Ocean University, Kelong, Taiwan
*3 Chung Yuan University, Chung-Li, Taiwan *4 Tatung University, Taipei, Taiwan
Presented by Win-Tai Lee,
Corresponding author:San-Der Chyou, 84, Ta-An Rd., Shu-Lin Taipei 238 Taiwan Tel:886 2 80782361;Fax:886 2 26822793
E-mail:u630071@taipower,com.tw
Abstract
After producing by the electrolysis of water using wind power, photovoltaic or biomass,hydrogen could react with oxygen in fuel cells to generate electricity. In other words, hydrogen could be used as an energy carrier to transform the unstable renewable energy into base-loaded electricity by means of hydrogen production, storage and electricity generation. Component materials of both hydrogen storage and proton electrolyte membranes(PEMs) in fuel cell play an important role in developing future new energy technology.
Hence, the first two parts of this presentation are focused on producing the hydrogen storage alloys (HSAs) as well as simulating on a tentative (small-size) metal hydride tank by utilizing these HSAs. The third part of this presentation is focused on the synthesis, structural characterization of nano carbon materials (NCMs) as well as hydrogenation behavior of these NCMs. The fourth part of this presentation is focused on the synthesis, structural characterization of the novel membranes of PEM fuel cell.
1. An Intermetallic Mg2Ni hydrogen storage alloy prepared by ball milling 1.1 Introduction Hydrogen energy plays an increasing important role in the power industry. In general, hydrogen storage in the solid state has following advantages over storage in a gaseous or liquid state: It is lightweight, safe, and low-cost, and it provides high hydrogen storage capacity [1]. Mg and Mg-based alloys are among the most attractive materials for hydrogen storage, since their hydrogen capacity exceeds those of known metal hydrides such as AB2 (ZrMn2), AB5 (LaNi5). Theoretically, a stoichiometric magnesium hydride (MgH2) can capture 7.6 wt. % of hydrogen. The chemical reaction of hydrogen storage materials is written as [2].
HMHHnM n ∆+⇔+ 22
Tsushio [3] proposed that hydrogen has a tendency to enter interstitial sites, which is the reason behind hydrogen storage in an intermetallic Mg2Ni alloy. Another mechanism suggests that the replacement of Mg or Ni in Mg2Ni by an alloying element forms a quaternary alloy system with larger
lattice intervals, as in Mg10Ni4.3Al0.3Mn0.4, in order to improve the absorption of hydrogen and increase the hydrogen absorption capacity. Making nanocrystalline Mg by ball milling not only improves powder morphology but also promotes the surface activity of the hydrogenation effect.
1.2 Experimental
Intermetallic Mg2Ni alloy was prepared by wet ball milling in ethanol. A mixture of magnesium
powder (99% purity), nickel powder (99.9% purity) and ethanol (99.9% purity) was milled in a 35 ml vial made of stainless steel with two kinds of steel balls, 0.5 inches and 0.25 inches in diameter, under a purified argon atmosphere for 20 hours. This stoichiometric composition was also prepared by dry milling for 18 hours. The weight ratio of ball-to-powder was 15 to 1, and the liquid-to-solid volume ratio was 1 to 4. The mixture was subjected to planetary SPEX 8000 high-energy ball milling with the milling speed at 1060 rpm.
The particle morphology was examined by scanning electron microscopy (SEM). The structure and constituent of the as-milled powder was characterized by using an X-ray diffractometer (XRD) with Cu Kα radiation. The hydrogen storage capability was evaluated with a pressure-composition-isotherms (PCI) automatic Sieverts apparatus.
1.3 Result and discussion
Generally, wet milling systems are more efficient than dry systems. The particles milled in ethanol
show a tendency to form unevenly and to create smaller particles. As compared to particles produced by dry milling, the surfaces of particles produced by wet milling are smoother, without crevices, and the particle size is more uneven than that produced by dry milling.
The diffraction patterns of sample (A) in Fig. 1 indicates the formation of Mg2Ni phase in dry milled powder, and those of sample (B) in Fig. 1 the results of wet milled powder. In contrast, three main elemental nickel element peaks appear without elemental Mg and Mg2Ni phase peaks for sample (B). Instead, an incipient amorphous phase characterized by diffused peaks appears in sample (B). The diffraction pattern of the wet milled powder after heating for 4 hours at 300℃, as shown in sample (C), is very similar to that of sample (B). It is confirmed that magnesium, in wet milling with ethanol, could form an amorphous phase.
After activation soaking, the full PCI curve of the organic metallic amorphous plus nickel mixture at 400 and ℃ under a pressure of 4.14 MPa (600 psi) was measured. As shown in Fig.2, the hydrogen capability of dry milling Mg2Ni attains about 3.6wt.%. In contrast, the extremely low hydrogen absorption for the wet milled amorphous phase plus nickel mixture suggests that the amorphous substance provides a barricade to hydrogen absorption.
1.4 Summary
Intermetallic Mg2Ni produced by dry milling has good hydrogen absorption content with an irregular particle surface. The surface morphology of the amorphous phase plus nickel mixture prepared by wet milling in ethanol is characterized by a smoother surface. The hydrogen absorption of dry milling Mg2Ni attains about 3.6wt.%, whereas, the extremely low hydrogen absorption for the wet milled amorphous phase plus nickel mixture suggests that the amorphous substance provides a barricade to hydrogen absorption.

Fig.1. XRD patterns of (A) dry milled powder and (B) wet milled powder in ethanol (C) after
heating for 4 hours at 300℃
Fig.2. PCI curve at 350 and ℃ under a pressure of 4.14 MPa (600psi) for an intermetallic
intermetallic Mg2Ni alloy milled by dry milling for 18 hours.
2.Testing and simulation on absorption/desorption in a hydrogen storage tank filled with high-weight-percent metal hydrides
2.1 Introduction
The R&D in hydrogen storage alloys trends toward high-weight-percent, fast reaction rate, and highly stable metal hydrides (MH). Mg-based alloys are the potential candidates among them. During the hydrogen absorption process, a lot of heat is released. As a result the reaction rate is greatly decreased. This work conducts both experimental and numerical studies on absorption/desorption of a hydrogen storage tank filled with Mg2Ni. The performance of the metal hydride bed is evaluated.
☉------Ni ☆------Mg2N
0 1 2 3 4 50.01
0.1
1
10
H absorption/desorption value (mole)
H2-p
ress
ure
(MPa
)
Mg2Ni
4.14 MPa(600 psi) 3500C
20 30 40 50 60 70 80
Inte
nsity
(cou
nts)
2θ Angle (degree)
☉
☆ ☆
☉
☉
☆
Amorphous phase
Amorphous phase
☉
☉
(A)
(B)
(C)
2.2 Theoretical Model
For an axisymmetric hydrogen storage bed, the energy equation reads
2 2
2 2
1 b h fb b
b b
Hc T T T Tk t r r r z k
ρ γρ ∂ ∂ ∂ ∂= + + −
∂ ∂ ∂ ∂ (1)
where bρ , cb, and kb denote, respectively, the density, specific heat, and the thermal conductivity of the reaction bed. In addition, hγ is the reaction rate and Hf is the heat of formation. The reaction rate can be expressed as
1000
2h
N x
M tγ
∂=
∂ (2)
In equation (2), N, M, and x denote the number of metal atoms in each MH molecule, molecular weight of the MH, and the concentration of hydrogen, respectively. It is noted that hγ is positive for hydrogen absorption while negative for hydrogen desorption. As for tx ∂∂ / , it is assumed to have the following expression:
exp( )b eq F
eq I F u
P Px x x E
t P x x R Tη
−∂ − −= ±
∂ −
⎛ ⎞⎜ ⎟⎝ ⎠
(3)
In equation (3),η is the rate constant, E activation energy, uR the universal gas constant, xI and xF are the initial and final concentrations of the hydrogen absorption/desorption process, and Pb and Peq are the pressure of the reaction bed and equilibrium pressure, respectively. The positive sign is for absorption while the negative sign is for desorption.
Finally, the equilibrium pressure can be expressed by the modified v’ant Hoff equation written below [4].
lneq ps hys
AP B f f
T= + + + (4)
where A, B are constants, and fps and fhys represent the effects of plateau slope and hysteresis, respectively. The above formulations can be found in [5]. Equations (1)-(4) along with pertinent boundary conditions are solved numerically by using the ADI scheme.
2.3 Absorption/desorption tests
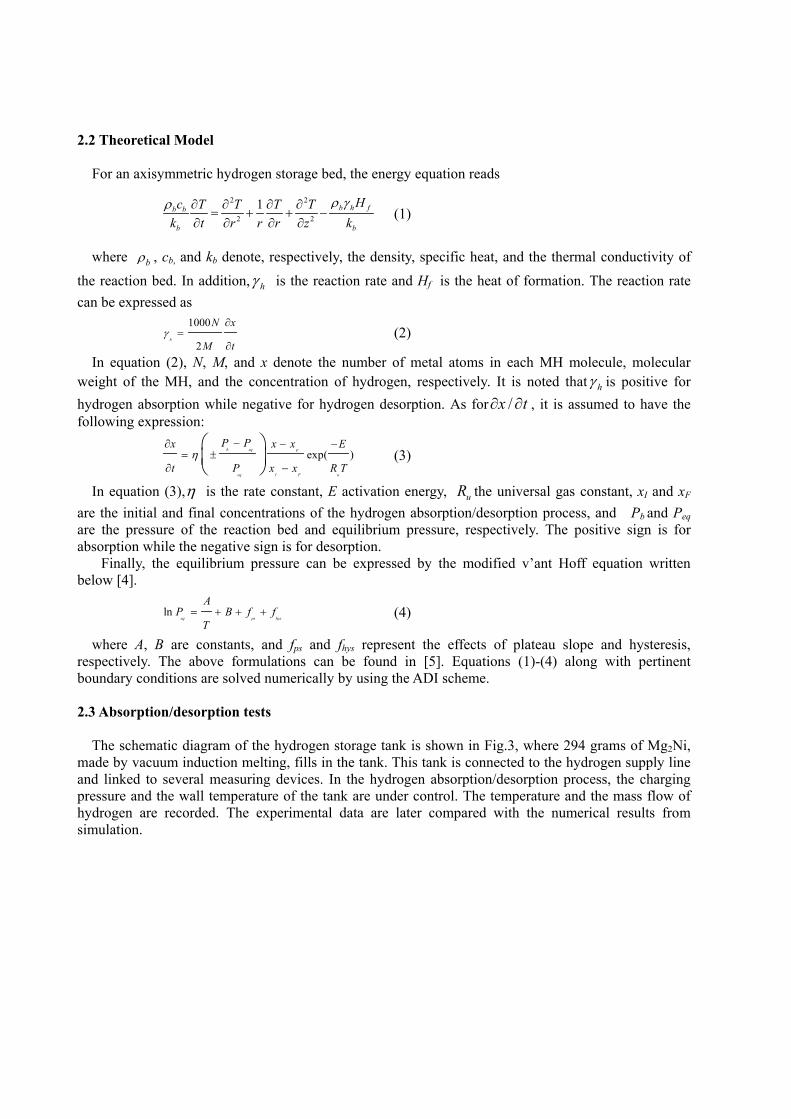
The schematic diagram of the hydrogen storage tank is shown in Fig.3, where 294 grams of Mg2Ni,
made by vacuum induction melting, fills in the tank. This tank is connected to the hydrogen supply line and linked to several measuring devices. In the hydrogen absorption/desorption process, the charging pressure and the wall temperature of the tank are under control. The temperature and the mass flow of hydrogen are recorded. The experimental data are later compared with the numerical results from simulation.
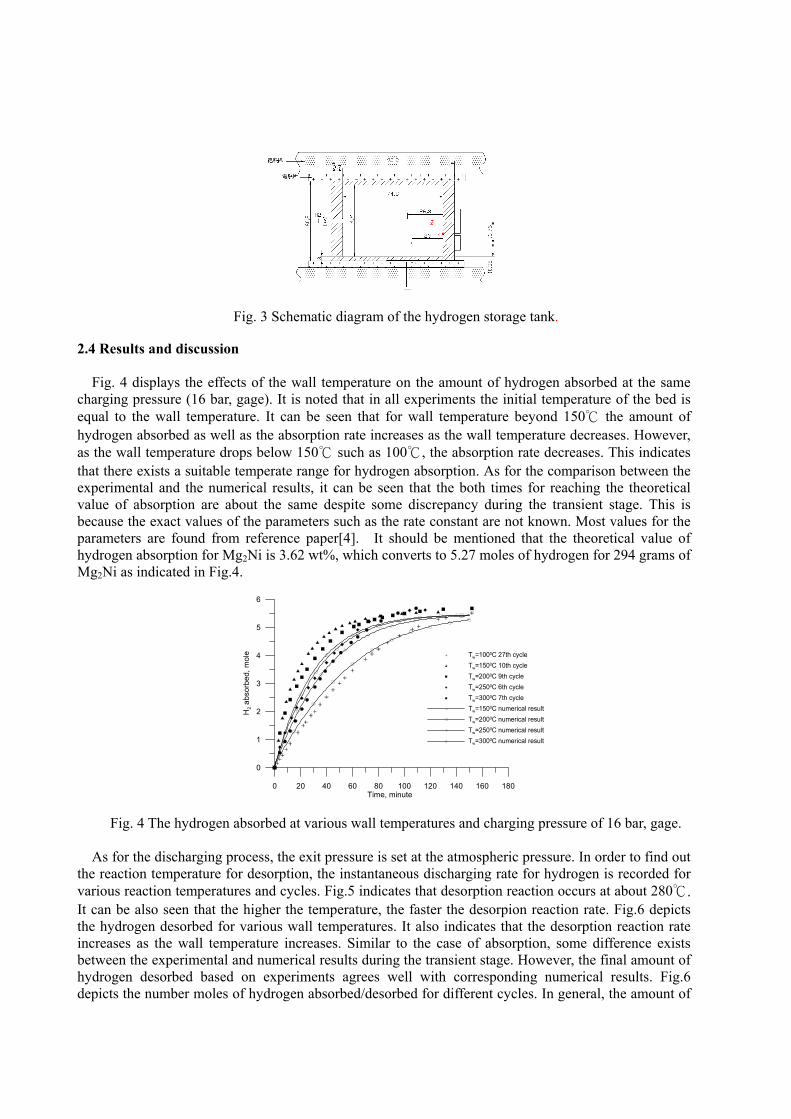
Fig. 3 Schematic diagram of the hydrogen storage tank.
2.4 Results and discussion
Fig. 4 displays the effects of the wall temperature on the amount of hydrogen absorbed at the same
charging pressure (16 bar, gage). It is noted that in all experiments the initial temperature of the bed is equal to the wall temperature. It can be seen that for wall temperature beyond 150℃ the amount of hydrogen absorbed as well as the absorption rate increases as the wall temperature decreases. However, as the wall temperature drops below 150℃ such as 100℃, the absorption rate decreases. This indicates that there exists a suitable temperate range for hydrogen absorption. As for the comparison between the experimental and the numerical results, it can be seen that the both times for reaching the theoretical value of absorption are about the same despite some discrepancy during the transient stage. This is because the exact values of the parameters such as the rate constant are not known. Most values for the parameters are found from reference paper[4]. It should be mentioned that the theoretical value of hydrogen absorption for Mg2Ni is 3.62 wt%, which converts to 5.27 moles of hydrogen for 294 grams of Mg2Ni as indicated in Fig.4.
0 20 40 60 80 100 120 140 160 180Time, minute
0
1
2
3
4
5
6
H2 a
bsor
bed,
mol
e Tw=1000C 27th cycleTw=1500C 10th cycleTw=2000C 9th cycleTw=2500C 6th cycleTw=3000C 7th cycleTw=1500C numerical resultTw=2000C numerical resultTw=2500C numerical resultTw=3000C numerical result
Fig. 4 The hydrogen absorbed at various wall temperatures and charging pressure of 16 bar, gage.
As for the discharging process, the exit pressure is set at the atmospheric pressure. In order to find out the reaction temperature for desorption, the instantaneous discharging rate for hydrogen is recorded for various reaction temperatures and cycles. Fig.5 indicates that desorption reaction occurs at about 280℃. It can be also seen that the higher the temperature, the faster the desorpion reaction rate. Fig.6 depicts the hydrogen desorbed for various wall temperatures. It also indicates that the desorption reaction rate increases as the wall temperature increases. Similar to the case of absorption, some difference exists between the experimental and numerical results during the transient stage. However, the final amount of hydrogen desorbed based on experiments agrees well with corresponding numerical results. Fig.6 depicts the number moles of hydrogen absorbed/desorbed for different cycles. In general, the amount of

hydrogen absorbed for each cycle can reach theoretical value but the amount desorbed is somewhat less than the theoretical value.
200 250 300 350 400 450Temperature, 0C
0
0.5
1
1.5
2
2.5
3
3.5
4
H2 f
low
rate
, Lite
r/min
ute
4th cycle9th cycle11th cycle14th cycle
Fig.5 Instantaneous reaction rate for hydrogen desorption for various cycles.
0 30 60 90 120 150 180 210 240Time, minute
0
1
2
3
4
5
6
H2 d
esor
bed,
mol
e
Pout=1 barTw=4000C 19th cycleTw=3750C 15th cycleTw=3500C 12th cycleTw=3250C 11th cycleTw=4000C numerical resultTw=3750C numerical resultTw=3500C numerical resultTw=3250C numerical result
Fig.6 Hydrogen desorbed at various wall temperatures and exit pressure of 1 bar, absolute.
2.5 Summary
The objective of this study is to conduct absorption/desorption tests and associated numerical simulation and comparison of a hydrogen storage tank filled with a high-weight-percent metal hydride (Mg2Ni). The metal hydride is prepared by Vacuum Induction Melting. The tank can be operated at high temperature and high pressure. It was found that the absorption rate is faster in the range of 150℃~250℃, while desorption occurs only when the temperature is above 280℃. Moreover, the higher the temperature, the faster the desorption rate. The experimental results also indicate that the metal hydride prepared in this work is able to absorb hydrogen to the theoretical value.
3. Structure and hydrogen storage of carbon nanofibers synthesized by PECVD using an ICP reactor
3.1 Introduction

A variety of microstructures gives carbon nanofibers (CNFs) many potential versatile applications. Three microstructures have been designated as platelet, herringbone, and tubular by Chambers et al. [6]. In a recent study Endo et al. [7] showed a new type of CNF with a cup-stacked-type microstructure. The structure feature of the cup-stacked-type CNFs is the stacking morphology of truncated conical graphene layers, which exhibit a large portion of open edges both on the outer surface and in the inner core. These CNFs showed a different structure when heat treated at 1800 to 3000 ℃ [8]. The most significant structure change after heat treatment is the formation of stable loops both on the inner and outer surfaces of CNFs between the adjacent open edges of graphene planes. Lower annealing temperature of the loop formation was also reported later by Endo et al. [9]. They suggested that single-layer loop (SLL) forms at 900-1200 between neighboring truncated conical graphene layers ℃and that transition from SLL to multi-layer loop (MLL), which is an energetically stable structure, occurs above 1500 . Endo et al.℃ [2003b] take the release of hydrogen atoms, which are bonded on the edges of graphite layers during synthesis, as the reason of loop formation. When the hydrogen is released, the dangling bonds at the edges of graphite planes have to be stabilized through forming loop structure [9]. Loop structure was also observed by Zheng et al. [10] in CNFs with platelet and herringbone structures and heat treated at 2500℃. In this letter, we reported the observation of loop structure in the as-grown CNFs synthesized by plasma enhanced chemical vapor deposition (CVD) using an inductively coupled plasma (ICP) reactor.
3.2.Experimental
We synthesized CNFs using a Ni-Al2O3 composite catalyst [11] both by ICP-CVD and thermal-CVD
processes. In the ICP-CVD apparatus the inductive coil is arranged cylindrically to the chamber. For the thermal-CVD process, a three-zone tube furnace was used. The Ni-Al2O3 catalyst was derived from the Feitknecht compound precursor. The thermal-CVD process was carried out at 600 , and the substrate ℃temperature was set at 800 in the ICP℃ -CVD process. CH4 was introduced as the carbon source in both processes. The CNFs synthesized by thermal CVD were annealed at various temperatures from 1600 ℃to 2400 using an Astro 1000℃ -3060-FP20 graphite furnace under a helium atmosphere.
3.3 Rresults and discussion
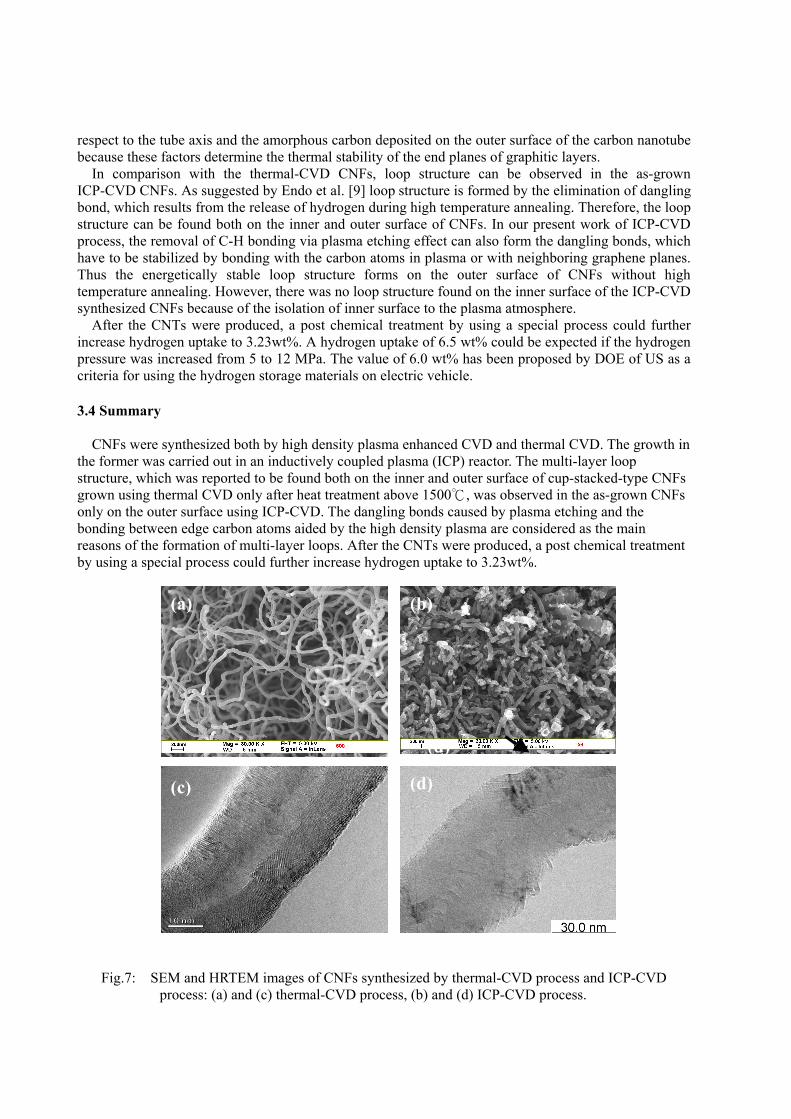
Fig.7 shows the SEM and HRTEM images of as-grown CNFs. CNFs in Fig.7 (a) and (c) were
synthesized using thermal-CVD and CNFs in Fig.7 (b) and (d) were synthesized using ICP-CVD. Although the morphology was crooked, the yield of CNFs grown by thermal CVD was high and the diameter distribution was also quite uniform. A yield of 14 times of the catalyst weight could be obtained for a reaction time of 3 hrs. In contrast, the length and yield of CNFs synthesized by ICP-CVD were limited. HRTEM images reveal that both CNFs have hollow compartments separated by conical shaped graphite layers. However, the size of the compartment for ICP-CVD CNFs is smaller although the size is not uniform for both fibers. Such internal compartments are considered as a consequence of the quasi-liquid state of the catalysts [12].
Comparison of the HRTEM images indicates that loop structures could be found on the outer surface of ICP-CVD CNFs, but are absent in thermal-CVD CNFs. As mentioned previously, the loop structure was reported to be found only when the as-grown CNFs were heat treated at high temperatures [Endo et al. 2003a,b; Zheng et al. 2003], which was also observed in this study. by the HRTEM image of CNFs grown by thermal CVD and then annealed at 2400 . MLLs can be found not only on the outer ℃surface (small arrow signs) but also on the inner surface (big arrow sign). However, the number of MLL on the inner surface is much less. In our experiments, loop structures were observed when the thermal-CVD CNFs were annealed above 1800 . Both SLL and MLL were observed at 1800 . SLL ℃ ℃found at 1600 was extremely unstable and will be destroyed under electron beam. Endo et al. ℃ [9] pointed out that the starting temperature for loop formation and also the transformation from SLL to MLL will be dependent on the tube diameter, wall thickness, crystallinity, truncated conical angles with
respect to the tube axis and the amorphous carbon deposited on the outer surface of the carbon nanotube because these factors determine the thermal stability of the end planes of graphitic layers.
In comparison with the thermal-CVD CNFs, loop structure can be observed in the as-grown ICP-CVD CNFs. As suggested by Endo et al. [9] loop structure is formed by the elimination of dangling bond, which results from the release of hydrogen during high temperature annealing. Therefore, the loop structure can be found both on the inner and outer surface of CNFs. In our present work of ICP-CVD process, the removal of C-H bonding via plasma etching effect can also form the dangling bonds, which have to be stabilized by bonding with the carbon atoms in plasma or with neighboring graphene planes. Thus the energetically stable loop structure forms on the outer surface of CNFs without high temperature annealing. However, there was no loop structure found on the inner surface of the ICP-CVD synthesized CNFs because of the isolation of inner surface to the plasma atmosphere.
After the CNTs were produced, a post chemical treatment by using a special process could further increase hydrogen uptake to 3.23wt%. A hydrogen uptake of 6.5 wt% could be expected if the hydrogen pressure was increased from 5 to 12 MPa. The value of 6.0 wt% has been proposed by DOE of US as a criteria for using the hydrogen storage materials on electric vehicle. 3.4 Summary
CNFs were synthesized both by high density plasma enhanced CVD and thermal CVD. The growth in
the former was carried out in an inductively coupled plasma (ICP) reactor. The multi-layer loop structure, which was reported to be found both on the inner and outer surface of cup-stacked-type CNFs grown using thermal CVD only after heat treatment above 1500 , was observed in the as℃ -grown CNFs only on the outer surface using ICP-CVD. The dangling bonds caused by plasma etching and the bonding between edge carbon atoms aided by the high density plasma are considered as the main reasons of the formation of multi-layer loops. After the CNTs were produced, a post chemical treatment by using a special process could further increase hydrogen uptake to 3.23wt%.
Fig.7: SEM and HRTEM images of CNFs synthesized by thermal-CVD process and ICP-CVD process: (a) and (c) thermal-CVD process, (b) and (d) ICP-CVD process.
(b)
(c)
(a)
(c)
(b)
(d)
(c) (d)

4.Proton exchange materials using as Nafion® alternatives in fuel cell membranes
4.1 Introduction
Searches for clean energy sources rather than nuclear generation and fossil fuel combustions are attractive nowadays. Fuel cells, which convert the chemical energy of a fuel in a reaction with oxygen into electricity in high efficiency, are major candidates of the clean energy sources under developments. Fuel cells are classified according to their electrolytes, and here we are focusing on the proton exchange membrane fuel cells (PEMFC). In PEMFC, a proton exchange membrane fuel cell converts hydrogen and oxygen electrochemically into electrical power. To take place this reaction, an ion-conducting polymer membrane sandwiched between the anode and cathode is needed. Fluorinated polymers are potential candidates using as PEM due to their outstanding properties. Some commercial products like Nafion® from DuPont have shown certain achievements in PEMFC developments. However, fluorinated polymers are in high cost and suffer from its high methanol permeability while using in direct methanol fuel cells (DMFC). This report therefore focuses on the concerns of non-fluorinated polyelectrolyte membrane alternatives.
4.2 Some commercial products using as non-fluorinated PEMs
The first attractive alternative of fluorinated PEMs is sulfonated styrene polymers and their
copolymers. A sulfonated styrene-ethylbutylene-styrene triblock copolymer was supplied from Dais Inc. (USA). A sample with 50% sulfonation on polystyrene segments exhibited comparable electrical conductivity to Nafion®, and a 60% sulfonation sample showed the optimum mechanical and electrical properties. The Ballard Inc. also provided non-fluorinated polymers using as PEMs. Two typical products of Ballard are BAM1G and BAM2G A MEA test revealed that BAM2G showed better cell performance than did Nafion® 117. However, the long-term stability of the membranes are not as good as for practical products. 4.3 Sulfonated aromatic polymers from direct sulfonation on polymers
Introducing sulfonic acid groups into the main chains of high performance polymers by a sulfonation
reaction is an important and widely used method for imparting polymers with proton exchange capacity [26-28]. The reaction can be simply schemed in Fig.8. In general, the degree of sulfonation (DS) can be controlled by the reaction time and temperature in concentrated sulfonic acid.
sunflonating agents
SO3H
Fig.8. Scheme for direct sulfonation on non-fluorinated aromatic polymers Fig.9 shows an example of sulfonation on poly(phthalazinone ether ketone) (PPEK) [14]. A full
control of degree of sulfonation, which was determined from the 1H NMR spectra of the sulfonated samples, was achieved by changing oleum/concentrated sulfuric acid compositions (Table 1). However, before sulfonation, the DS could not be blindly predicted.
The samples possessing DS above 1.02 exhibited sufficient proton conductivity for single cell tests. However, highly sulfonated samples exhibited high methanol permeation and poor mechanical properties, to limit their application in DMFC.

Fig.9. Scheme for direct sulfonation on poly(phthalazinone ether ketone)s [14].
4.4 Pore-filling membranes
Considering it is hard to find/prepare a proton exchange material to satisfy all criteria for using in PEMFC or DMFC, another pore-filling type polyelectrolyte membranes were developed (Fig.10) [15]. This concept can be applied to polyelectrolyte membranes, in which a porous substrate is filled with a gel-type or graft-type polyelectrolyte.
The substrate is completely inert to the fuels, has mechanical strength, and the filled polyelectrolytes in pores might form proton migration channels, which significantly promote the proton conductivity through the membranes. Fig.11 shows the relationship between the pore-filling ratio and the proton conductivity through the membrane. A high proton conductivity of 0.15 Scm-1 at 25 oC was observed.
Table1. The effects of sulfonation conditions on the degree of sulfonation of
poly(phthalazinone ether ketone) [14]
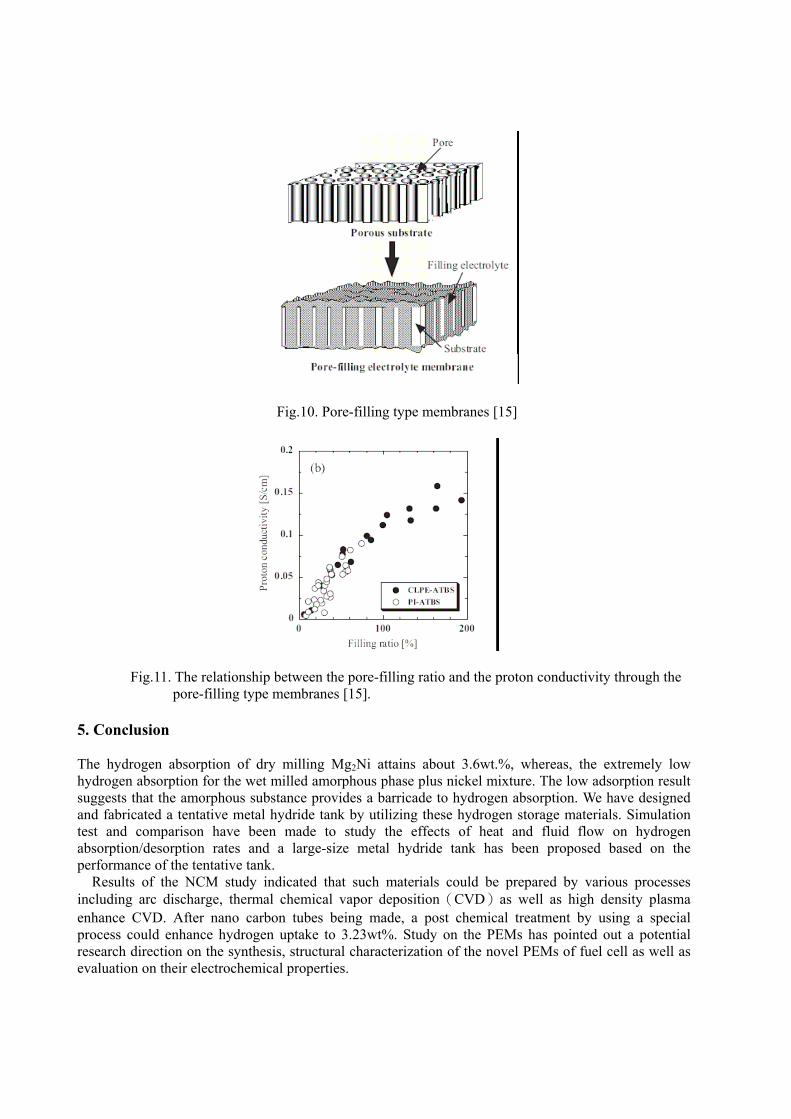
Fig.10. Pore-filling type membranes [15]
Fig.11. The relationship between the pore-filling ratio and the proton conductivity through the
pore-filling type membranes [15]. 5. Conclusion
The hydrogen absorption of dry milling Mg2Ni attains about 3.6wt.%, whereas, the extremely low hydrogen absorption for the wet milled amorphous phase plus nickel mixture. The low adsorption result suggests that the amorphous substance provides a barricade to hydrogen absorption. We have designed and fabricated a tentative metal hydride tank by utilizing these hydrogen storage materials. Simulation test and comparison have been made to study the effects of heat and fluid flow on hydrogen absorption/desorption rates and a large-size metal hydride tank has been proposed based on the performance of the tentative tank.
Results of the NCM study indicated that such materials could be prepared by various processes including arc discharge, thermal chemical vapor deposition(CVD)as well as high density plasma enhance CVD. After nano carbon tubes being made, a post chemical treatment by using a special process could enhance hydrogen uptake to 3.23wt%. Study on the PEMs has pointed out a potential research direction on the synthesis, structural characterization of the novel PEMs of fuel cell as well as evaluation on their electrochemical properties.

6. References
[1] M.V.C. Sastry, B. Viswanathan, S. Srinivasa Murthy (Eds.). Metal hydrides. New Delhi: Narosa Publishing House; 1998.
[2] J.J. Reilly, Chemistry of intermetallic Hydrides. Presented at the Symposium for Hydrogen Storage Materials, Batteries and Electrochemical Society, Phoenix, Arizona, October 1991.
[3] Y. Tsushio and E. Akiba, J. Alloys Compd. 267 (1998) 246. [4] M. Gambini, “Performance of metal hydride heat pumps operating under dynamic conditions”,
International Journal of Hydrogen Energy, 1989, Vol. 14, pp. 821-830. [5] M. R. Gopal and S. S. Murthy, “Studies on heat and mass transfer in metal hydride beds”,
International Journal of Hydrogen Energy, 1995, Vol. 20, pp. 911-917. [6] Chambers, A., Park, C., Baker, R. T. K. and Rodriguez, N. M. (1998). Hydrogen storage in
graphite nanofibers. Phys Chem B, 102, [22], 4253-4256. [7] Endo, M., Kim, Y. A., Hayashi, T., Fukai, Y., Oshida, K., Terrones, M., Yanagisawa, T., Higaki,
S. and Dressslhaus, M. S. (2002). Structural characterization of cup-stacked-type nanofibers with an entirely hollow core. Appl Phys Lett, 80, 1267-1269.
[8] Endo, M., Kim, Y. A., Hayashi, T., Yanagisawa, T., Muramatsu, H., Ezaka, M., Terrones, H., Terrones, M. and Dressslhaus, M. S. (2003). Microstructural changes induced in “stacked cup” carbon nanofibers by heat treatment. Carbon, 41, 1941-1947.
[9] Endo, M., Lee, B. J., Kim, Y. A., Kim, Y. J., Muramatsu, H., Yanagisawa, T., Hayashi, T., Terrones, M. and Dressslhaus, M. S. (2003). Transition behaviour in the transformation from active end planes to stable loops caused by annealing. New Journal of Physics, 5, 121.1-121.9.
[10] Zheng, G. B., Sano, H. and Uchiyama, Y. (2003). New structure of carbon nanofibers after high-temperature heat-treatment. Carbon, 41, 853-856.
[11] Avdeeva, L. B., Goncharova, O. V., Kochubey, D. I., Zaikovskii, V. I., Plyasova, L. M., Novgorodov, B. N. and Shaikhutdinov, S. K. (1996). Coprecipitated Ni-alumina and Ni-Cu-alumina catalysts of methane decomposition and carbon deposition. II. Evolution of the catalysts in reaction. Appl Catal A: General, 141, 117-129.
[12] Li, Y. F., Qiu, J. S., Zhao, Z. B., Wang, T. H., Wang, Y. P. and Li, W. (2002). Bamboo-shaped carbon tubes from coal. Chem Phys Lett, 366, 544-550.
[13] Kobayashi T, Rikukawa M, Sanui K, Ogata N. Solid State Ionics 1997, 97, 323. [14] Gao Y, Robertson GP, Guiver MD, Jian X. J Polym Sci Part A: Polym Chem 2003, 41,
497. [15] Yamaguchi T, Miyata F, Nakao S. Adv Mater 2003, 15, 1198.