functional analysis of the cellulose synthase class
TRANSCRIPT

University of Rhode Island University of Rhode Island
DigitalCommons@URI DigitalCommons@URI
Open Access Master's Theses
2014
FUNCTIONAL ANALYSIS OF THE CELLULOSE SYNTHASE CLASS FUNCTIONAL ANALYSIS OF THE CELLULOSE SYNTHASE CLASS
SPECIFIC REGION IN SPECIFIC REGION IN PHYSCOMITRELLA PATENS
Tess Scavuzzo-Duggan University of Rhode Island, [email protected]
Follow this and additional works at: https://digitalcommons.uri.edu/theses
Recommended Citation Recommended Citation Scavuzzo-Duggan, Tess, "FUNCTIONAL ANALYSIS OF THE CELLULOSE SYNTHASE CLASS SPECIFIC REGION IN PHYSCOMITRELLA PATENS" (2014). Open Access Master's Theses. Paper 448. https://digitalcommons.uri.edu/theses/448
This Thesis is brought to you for free and open access by DigitalCommons@URI. It has been accepted for inclusion in Open Access Master's Theses by an authorized administrator of DigitalCommons@URI. For more information, please contact [email protected].

FUNCTIONAL ANALYSIS OF THE CELLULOSE SYNTHASE CLASS SPECIFIC
REGION IN PHYSCOMITRELLA PATENS
BY
TESS SCAVUZZO-DUGGAN
A THESIS SUBMITTED IN PARTIAL FULFILLMENT OF THE REQUIREMENTS
FOR THE DEGREE OF
MASTER OF SCIENCE
IN
BIOLOGICAL AND ENVIRONMENTAL SCIENCES
UNIVERSITY OF RHODE ISLAND
2014

MASTER OF SCIENCE THESIS
OF
TESS SCAVUZZO-DUGGAN
APPROVED: Thesis Committee: Major Professor Alison Roberts Joanna Norris Gongqin Sun Nasser H. Zawia DEAN OF THE GRADUATE SCHOOL
UNIVERSITY OF RHODE ISLAND 2014

ABSTRACT
Cellulose synthases are found in a wide range of organisms, from bacteria to land
plants. However, the cellulose synthases found in land plants (CESAs) form large,
multimeric, rosette-shaped cellulose synthase complexes (CSCs) and have three unique
regions not found in other cellulose synthases; the N-terminal zinc-binding domain, the
Plant Conserved Region (P-CR) and the Class Specific Region (CSR). The CSR, a
portion of the large cytoplasmic region that contains the catalytic domain, has been
predicted to be involved in CSC formation through in silico modeling. This project tested
the hypothesis that the CSR is necessary for clade-specific CESA function. We have
developed a complementation assay in the moss Physcomitrella patens based on the
ppcesa5KO-2B line, which does not produce gametophores. In P. patens, CESAs in the
A Clade (CESA3, 5 and 8) have similar CSR structures that are distinct from those in the
B Clade (CESA4, 6, 7, 10). The ppcesa5KO-2B line is complemented by overexpression
of PpCESA3 and PpCESA8, but not by the overexpression of CESAs in Clade B. An
overexpression vector containing a Clade A CESA with a Clade B CSR was unable to
rescue ppcesa5KO phenotype, indicating that the CSR is necessary for clade-specific
CESA function. However, an overexpression vector containing a Clade B CESA with a
Clade A CSR was also unable to rescue the ppcesa5KO phenotype. This signifies that the
CSR is not the sole determinant of clade-specific CESA function. A vector containing a
Clade A CESA and the C-terminus of a Clade B CESA was able to rescue the ppcesa5KO
phenotype. This suggests that the functionality of the C-terminal region, containing six
transmembrane helices, is not a determinant of clade-specific function. A vector
containing a Clade A CESA with the N-terminus of a Clade B CESA was unable to rescue

the ppcesa5KO phenotype. This suggests that CSR may be interacting with an N-terminal
domain, possibly the P-CR or zinc-binding domain to confer clade-specific function.

iv
ACKNOWLEDGEMENTS
I would like to thank Dr. Alison Roberts for her encouragement and guidance
during my tenure not only as a graduate student in her lab, but also as an undergraduate
student researcher. Her incredible patience and support have made this degree possible
and have greatly impacted my career beyond the University of Rhode Island, for which I
am unendingly grateful. I would also like to thank my committee members, Dr. Joanna
Norris and Dr. Gongqin Sun for their support as advisors and instructors. Their wisdom
both inside and outside the classroom have impacted my education and career on a scale
that I never could have imagined. I would like to thank Dr. Candace Oviatt for serving as
the Chair for my defense.
I would like to thank Mai Tran for support and guidance with laboratory protocols
and for her friendship through a periodically tumultuous degree. I would like to thank
XingXing Li for his guidance in optimizing Western blot protocols.
I would like to thank my family and friends for their amazing and seemingly
endless belief in my abilities. I would also like to thank them for their understanding
during stressful periods in my degree.
This research was supported by The Center for LignoCellulose Structure and
Formation, an Energy Frontier Research Center funded by the US Department of Energy,
Office of Science, Basic Energy Sciences under award # DE-SC0001090.
This research is based in part upon work conducted using the Rhode Island
Genomics and Sequencing Center which is supported in part by the National Science
Foundation (MRI Grant No. DBI-0215393 and EPSCoR Grant Nos. 0554548 & EPS-

v
1004057), the US Department of Agriculture (Grant Nos. 2002-34438-12688 and 2003-
34438-13111), and the University of Rhode Island.
vi
TABLE OF CONTENTS
Abstract……………………………………………………………………………………ii
Acknowledgements……………………………………………………………………….iv
Table of Contents…………………………………………………………………………vi
List of Figures……………………………………………………………………………vii
List of Tables……………………………………………………………………………viii
Introduction……………………………………………………………………………......1
Materials and Methods…………………………………………………………………….8
Results……………………………………………………………………………………19
Discussion………………………………………………………………………………..31
Appendix…………………………………………………………………………………38
Bibliography……………………………………………………………………………..48
vii
LIST OF FIGURES
Figure 1. A cellulose synthase protein in the plasma membrane………………………….4
Figure 2. Chimeric CESA primers ………………………………………………………10
Figure 3. PCR Fusion…………………………………………………………………….12
Figure 4. Sequencing primers……………………………………………………………14
Figure 5. Rescue rates of Class Specific Region chimeras………………………………23
Figure 6. Protein expression of transformed ppcesa5KO-2B lines……………………...24
Figure 7. Rescue rates of N- and C-Terminal chimeras………………………………….27
Figure 8. Morphology of complementation lines………………………………………..28
viii
LIST OF TABLES
Table 1. Chimeric CESA primers…………………………………………………………9
Table 2. Sequencing Primers…………………………………………………………….13
Table 3. Chimeric CESA complementation results……………………………………...22
1
INTRODUCTION
Cellulose Applications
Cellulose is the most abundant biopolymer on earth and is important in a range of
applications such as textiles, food and biofuels. Lignocellulosic biofuels are produced in a
variety of ways, from thermal conversion to microbial conversion and chemical
conversion (Carroll and Somerville 2009). The most cost efficient methods are microbial
and chemical conversion. These methods require size reduction of biomass on the
submillimeter level, pretreatment to increase accessibility of cell wall polysaccharides,
hydrolysis of polysaccharides to simple sugars and conversion of those sugars into fuel,
usually ethanol (Carroll and Somerville 2009). One of the main obstacles in efficient
cellulosic biofuel production is the recalcitrance of cellulose. As cellulose exists as long
microfibrils, cellulases may be prevented sterically from cleaving glycosidic linkages.
The cellulose microfibril may additionally prevent hydrolysis due to extensive hydrogen
bonding of the glucan chains to one another (Carroll and Somerville 2009). The
mechanism of cellulose biosynthesis is still not completely understood, making
improvement on cellulose recalcitrance difficult. Thus, it is necessary to understand
cellulose structure and synthesis in order to engineer crops better suited for biofuels.
Cellulose Structure
Cellulose occurs as microfibrils composed of hydrogen-bonded β (1, 4)-glucan
chains. Cellulose has been characterized as having six different allomorphs, with the first
two, cellulose Iα and Iβ, being the native celluloses and the other four, II, III, V, and VI,
being chemically and physically altered derivatives (Sturcova et al. 2004; Thomas et al.
2013; Wada et al. 2004). In algae, the Iα and Iβ allomorphs are found with a high degree

2
of crystallinity, in part due to the large, ribbon-like microfibrillar bundles. In higher
plants, these allomorphs predominate, but are more disordered than their algal
counterparts, forming thin, ropelike microfibrillar bundles (Sturcova et al. 2004; Thomas
et al. 2013; Wada et al. 2004). The exact number of chains in a land plant cellulose
microfibril is unknown. Early studies using NMR estimated thirty-six glucan chains in a
microfibril (Delmer 1999; Ha et al. 1998; Herth 1983). However, land plant cellulose
microfibrils are long, but very thin, making accurate measurements from NMR very
difficult. More recent studies, using a combination of NMR with WAXS, SAXS and
SANS for more accurate measurement of microfibril diameter, estimate 18-24 glucan
chains (Newman et al. 2013; Thomas et al. 2013).
Cellulose Synthases
Cellulose synthases are members of the family 2 glycosyltransferases (GT),
characterized by the D, D, D, QXXRW motif (Delmer 1999; Saxena et al. 1995).
Cellulose synthases are present in many organisms, from bacteria to land plants. In
contrast to bacterial cellulose synthases (BCSs), land plant cellulose synthases (CESAs)
have additional domains, including the N-terminal zinc-binding domain, the plant-
conserved region (P-CR) and the class-specific region (CSR) (Figure 1) (Arioli 1998;
Ihara et al. 1997; Pear et al. 1996). The CSR is notable in that among CESAs of the same
class, there is sequence similarity, but between CESAs of different classes, there is little
similarity, thus the former designation of hypervariable region (Vergara and Carpita
2001). A recent crystal structure of the bacterial cellulose synthase RsBcsA of
Rhodobacter sphaeroides confirmed that the conserved D, D, D, QXXRW motif is

3
responsible for catalysis of β (1, 4)-glucan synthesis using UDP-glucose as a substrate
(Morgan et al. 2013).
Cellulose Synthase Complexes
In contrast to BCSs, the CESA subunits aggregate into six-particle rosette-shaped
cellulose synthase complexes (CSCs) visible in freeze-fracture electron microscopy of
plasma membranes of land plants (Doblin et al. 2002; Kimura et al. 1999; Mueller and
Brown 1980) and their closest green algal relatives (Herth 1983). Vascular plants have
multiple isoforms of CESAs, with the model plant Arabidopsis thaliana containing ten
different isoforms (Doblin et al. 2002); three isoforms form CSCs that produce primary
cell walls (Desprez et al. 2007; Persson et al. 2007), and three different isoforms form
CSCs that produce secondary cell walls (Taylor et al. 2003). Although it is known which
CESA isoforms compose the CSCs responsible for either primary or secondary cell wall
synthesis in Arabidposis, the CESA stoichiometry of rosette CSCs is unknown. The exact
number of CESAs in a CSC is also unknown, but it is generally assumed that the number
of CESAs in a rosette is equal to the number of glucan chains in a cellulose microfibril.
Although previously speculated to contain about thirty six CESAs (Doblin et al. 2002),
recent spectroscopic and diffraction data on cellulose microfibrils from celery
collenchyma and spruce fibers suggests that CSCs are more likely to contain 18-24
CESAs (Thomas et al. 2013). Sequence analysis has shown that major differences
between the six CESA classes, three from primary and three from secondary cell wall
CSCs, occur in the CSR (Vergara and Carpita 2001). Taken together with the observation
that the CSR is found in CESAs, but not BCSs, this suggests that the CSR plays a role in
rosette CSC formation.

4
Figure 1: A schematic of an Arabidopsis thaliana CESA protein in the plasma membrane. The three unique regions found only in land plant CESAs are marked; the Zinc-binding domain, the P-CR and the CSR. The large cytosolic loop contains the catalytic motif D, D, D, QxxRW, shown with red stars. Also marked is the known mutation in the P-CR of an AtCESA known as fra6. No mutations have been found in the CSR or zinc-binding domain.

5
Physcomitrella patens Cellulose Synthases and the Class-Specific Region
In the moss Physcomitrella patens, there are seven CESA isoforms, which is
particularly interesting given that it lacks vascular tissue with secondary cell walls
(Roberts and Bushoven 2007). P. patens has become established as a model system due
to its ease of genetic manipulation. P. patens has a fully sequenced genome (Rensing et
al. 2008) and has a high rate of homologous recombination, which enables targeted gene
modification (Cove 2005). Additionally, a stream-lined process for genetic
transformation has been developed and optimized (Roberts et al. 2011). P. patens also
exists predominantly in the haploid phase of its life cycle, enabling rapid, efficient and
facile genetic manipulation (Cove 2005).
Unlike in Arabidopsis, the specific functions of the CESA isoforms in P. patens
are unknown (Roberts and Bushoven 2007). Whereas Arabidopsis CESAs are specific to
primary and secondary cell wall synthesis (Desprez et al. 2007; Persson et al. 2007;
Taylor et al. 2003), PpCESAs appear to function in the development of particular tissues
(Goss et al. 2012). Additionally, seed plant CSCs contain three CESA isoforms (Desprez
et al. 2007; Persson et al. 2007; Taylor et al. 2003), whereas CSCs in P. patens could be
homo- or hetero-oligomeric (Goss et al. 2012). However, there are two phylogenetically
distinct groups of CESAs in P. patens, referred to as Clade A and Clade B, which differ
in the sequences of their CSRs (Appendix 1, 2) (Goss et al. 2012). Computational
modeling indicates that CSRs of Clade B CESAs have a long, central α-helix, whereas in
CSRs of Clade A CESAs, this α-helix is disrupted (Sethaphong, personal
communication). Previous experiments in which a lesion was inserted into the catalytic
region of PpCESA5 and was thus functionally knocked out indicate that PpCESA5, a

6
member of Clade A, is expressed in the gametophore and has a striking mutant phenotype
in which gametophores fail to develop (Goss et al. 2012). Interestingly, when
ppcesa5KO-2B was complemented with PpCESA3 or PpCESA8, both in Clade A, the
wild-type gametophore phenotype was fully rescued. However, when ppcesa5KO-2B
was complemented with CESAs from Clade B (PpCESA4, 6, 7, 10), the wild-type
phenotype was not rescued (A. Roberts, unpublished). As Clade A and Clade B differ in
CSRs, this region may be implicated in the functional differences revealed by the
complementation assays. More specifically, the central α-helix found in Clade B CESAs
and absent in Clade A CESAs may contribute to CSR-specific function of the CESAs.
Further evidence of CSR function in CSC formation is demonstrated by the recent
computational modeling of the Gossypium hirsutum CESA1 cytosolic domain. The
catalytic residues of the GhCESA1 computational model align closely with that of the
RsBcsA crystal structure, indicating that the catalytic mechanism is conserved across
family 2 GTs and validating the computational model (Sethaphong et al. 2013). This
model depicts the P-CR and CSR as facing away from the catalytic region into the
cytoplasm, indicating that these regions may be involved in CSC formation. Models
created using the program Rosetta Symmetry (Rohl et al. 2004) predict that the P-CR and
CSR interact when the CESAs form dimers, trimers and hexamers (Sethaphong et al.
2013). A missense mutation in the P-CR of Arabidopsis thaliana leads to a decrease in
cellulose deposition and wall thickness in fiber cell walls (Zhong et al. 2003), indicating
that the P-CR is necessary for cellulose synthesis (Figure 1). However, no known
mutations that affect cellulose biosynthesis are located in the CSR (Sethaphong et al.
2013). Coupled with evidence that Arabidopsis primary and secondary CSC components

7
differ in CSR structure and that CSR structure is correlated with the ability of P. patens
CESAs to complement the ppcesa5 mutant, the computational model of GhCESA1
suggests that the CSR plays a direct role in CSC formation.
In this study, I analyzed the role of the CSR in the functional differences between
Clade A and Clade B CESAs in gametophore development using the ppcesa5KO-2B
complementation system. By complementing ppcesa5KO-2B with a chimeric CESA5
containing the CSR from a Clade B CESA (CESA4), I determined that the ability of
Clade A CESAs to complement the ppcesa5KO phenotype is dependent on the CSR. By
complementing ppcesa5KO-2B with a chimeric CESA4 containing the CSR of a Clade A
CESA (CESA5), I determined that the CSR is not the only region necessary for clade-
specific CESA function. By complementing ppcesa5KO-2B with a chimeric CESA5
containing the C-terminus of CESA4, I determined that the C-terminus is not necessary
for clade-specific function. By complementing ppcesa5KO-2B with a chimeric CESA5
containing the N-terminus of CESA4, I determined that the N-terminus, including the
zinc-binding domain and P-CR, is necessary for clade-specific function.

8
MATERIALS AND METHODS
Vector Construction
General Strategy
Chimeric CESA expression vectors were constructed using PCR fusion and
Invitrogen MultiSite Gateway cloning (Life Technologies, Grand Island, NY, USA).
PpCESA8, PpCESA4 and PpCESA5 cDNA clones were used as templates for PCR. PCR
products were fused by a single overlap extension to produce chimeric CESAs
(Atanassov et al. 2009), which were inserted with a triple hemagglutinin tag into the
pTHAct1Gate (xt18) destination vector containing an actin1 promoter driving
constitutive expression and sequences that target the expression vector to the P. patens
108 locus, which can be disrupted without producing a phenotype (Perroud and Quatrano
2006).
PCR Fusion
PCR fusion was carried out as described by Atanassov (Atanassov et al. 2009)
with modifications (Appendix 3). Instead of amplifying into attL sites, which recombine
into expression vectors, chimeric CESAs were amplified into attB sites, which recombine
into entry clones. PCR primers were designed containing twelve nucleotides of shared
sequence (overlap region) and fifteen nucleotides of upstream or downstream sequence
from PpCESA4, PpCESA5 or PpCESA8 (Figure 2, Table 1). CesaXattB5 and SR1 (F1),
SF1 and SR2 (F2), or CesaXattB2 and SF2 (F3) primers were combined into three
separate 50 µl PCR reactions with Phusion polymerase (New England Biolabs, Ipswich,
MA, USA) and PpCESA4, 5, or 8 cDNA clones pdp39044, pdp21409, and pdp24095,
respectively (RIKEN BRC, http://www.brc.riken.jp/lab/epd/Eng/), as previously

9
Table 1. Primers used to amplify fragments for constructing chimeric CESAs.
Primer Name Primer Sequence
CesA5attB5 GGGGACAACTTTGTATACAAAAGTTGCGATGGAGGCTAATGCAGGCCTTAT
CesaA5attB2 GGGGACCACTTTGTACAAGAAAGCTGGGTACTAACAGCTAAGCCCGCACTCGAC
CesA4CDSattB5 GGGGACAACTTTGTATACAAAAGTTGTCATGAAGGCGAATGCGGGGCTGTT
CesA4CDSattB2 GGGGACCACTTTGTACAAGAAAGCTGGGTACTATCGACAGTTGATCCCACACTG
CesA5CSR4 SF1 GTATATGTAGGCACGGGATGCTGTTTCAAGAGGCGA
CesA5CSR4 SF2 AATCCTGGGTCATTGTTGAAGGAGGCAATTCACGTC
CesA5CSR4 SR1 TCGCCTCTTGAAACAGCATCCCGTGCCTACATATAC
CesA5CSR4 SR2 GACGTGAATTGCCTCCTTCAACAATGACCCAGGATT
CesA5CSR8 SF1 GTATATGTAGGCACGGGATGTGTCTTTAGGAGGCAA
CesA5CSR8 SF2 AGCGCGGGCTCCCTCCTCAAGGAGGCAATTCACGTC
CesA5CSR8 SR1 TTGCCTCCTAAAGACACATCCCGTGCCTACATATAC
CesA5CSR8 SR2 GACGTGAATTGCCTCCTTGAGGAGGGAGCCCGCGCT
CesA4CSR5 SF1 GTTTATGTGGGTACGGGGACTGTGTTCAACAGGAAG
CesA4CSR5 SF2 AGCCCGGGATCTCTTCTCAAGGAGGCAATTCATGTG
CesA4CSR5 SR1 CTTCCTGTTGAACACAGTCCCCGTACCCACATAAAC
CesA4CSR5 SR2 CACATGAATTGCCTCCTTGAGAAGAGATCCCGGGCT
CesA5CSR3 SF1 GTATATGTAGGCACGGGATGCGTGTTCAGGAGGCAA
CesA5CSR3 SF2 AGCGCGGGCTCACTCCTCAAGGAGGCAATTCACGTC
CesA5CSR3 SR1 TTGCCTCCTGAACACGCATCCCGTGCCTACATATAC
CesA5CSR3 SR2 GACGTGAATTGCCTCCTTGAGGAGTGAGCCCGCGCT

10
Figure 2. A schematic detailing the primer design for each chimera and nomenclature of the chimeric CESAs.

11
described (Atanassov et al. 2009). PCR products were run with a calibrated ladder (New
England Biolabs) on a 1% agarose gel containing 0.5 µg/ml ethidium bromide at 100 V
for 20 minutes and imaged to estimate the concentration. PCR products F1 (400 ng), F2
(80 ng), and F3 (200 ng) were combined in a 30 µl PCR fusion reaction with Phusion
polymerase (New England Biolabs) (Figure 3) and no primers. PCR fusion products were
purified according to the Invitrogen MultiSite Gateway Pro kit (Life Technologies) and
resuspended in 7 µl of 1X TE.
MultiSite Gateway Cloning
Expression vectors were constructed using the MultiSite Gateway Pro kit (Life
Technologies). To construct entry clones, fusion products containing attB sites were
cloned into Invitrogen pDONR P5-P2 (Life Technologies). Plasmid DNA was purified
from kanamycin resistant colonies using a QIAGEN QIAPrep Spin Miniprep kit
according to manufacturer’s instructions (QIAGEN Inc, Valencia, CA, USA). Plasmids
were digested with EcoRI-HF and EcoRV-HF restriction enzymes (New England
Biolabs) selected to produce a chimera-specific digestion pattern. Clones with the
predicted digestion pattern were confirmed by sequencing on the Applied Biosystems
3130xl genetic analyzer using Applied Biosystems BigDye Terminator v3.1 chemistry
(Life Technologies) using gene-specific primers (Table 2). Entry clones and an
Invitrogen pDONR P1-P5r (Life Technologies) entry clone containing a triple
hemagglutinin tag were cloned into the pTHAct1Gate, referred to here as xt18 (Perroud
and Quatrano 2006), destination vector. Plasmid DNA was purified from ampicillin
resistant colonies as previously described and digested with the SwaI restriction
enzyme(New England Biolabs). Plasmids with the predicted digestion pattern were tested

12
Figure 3. A schematic of PCR fusion adapted from Atanassov et al (Atanassov et al. 2009). Using PpCESA cDNA as templates, F1, F2 and F3 fragments were amplified by PCR for the final overlap extension step to create chimeric Ppcesa PCR products.

13
Table 2. Primers used for sequencing CESA chimeras.
Primer Name Primer Sequence
P99 CCCGTTTTTGAAAGGTCTGA
P101 CAGTGTGGGATCAACTGTCG
P117 CCTTATTGCAGGCTCACACA
P118 CGTACATCAACGCCACAATC
P119 TTCTTACAGATGGCACCGT
P143 TTTGGACGATGACTCTCACG
P146 CCCTTTGTGGTACGGGTATG
P153 GATTTTGGATCAGTTCCCGA
P155 CCATGCTGACCTTTGAGGTT
P373 CCACAACACTGTCTTCTTCGAC
P374 TGATACAGGTCTTTCTGGGACA
P395 GAGCTATGGTGGCAATTACGAC
P403 CTTTCTCTCGATTTTCGTGACC
P404 TGACACGGAAGTGATGCTATCT
P405 AGTAATTTGGCGAGTCTGTGGT

14
Figure 4. A schematic of sequencing primers in relation to PpCESA5 and PpCESA4 gene sequences. CSR shown in red.

15
for correct recombination by sequencing with primers P395 and P403 for PpCESA5
constructs and P404 and P405 for PpCESA4 constructs (Table 2, Figure 4).
Expression Clone Preparation
Plasmid DNA from sequence-verified expression clones was isolated using
GenElute HP Plasmid Midiprep kit (Sigma-Aldrich, St. Louis, MO, USA) or
NucleoBond Midiprep Xtra kit (Macherey-Nagel Inc., Bethlehem, PA, USA) according
to the manufacturer’s instruction. 100 µg of plasmid DNA was linearized using 50
activity units of SwaI restriction enzyme (New England Biolabs) in a 110 µl reaction,
ethanol precipitated and resuspended in sterile 5 mM Tris-Cl at 1 µg/µl.
Moss Subculture
Protonemal filaments from the P. patens cesa5KO-2 line (Goss et al. 2012)
provided by Dr. Alison Roberts (University of Rhode Island, Kingston, RI, USA) were
grown on BCDAT overlain with cellophane at 25°C with fluorescent lights at a photon
flux density of 60 µM m-2s-1 for 7 d. The tissue was then homogenized using Omni
International hard tissue omni tip probes (USA Scientific, Ocala, FL, USA) in 4-6 ml of
sterile water and plated on BCDAT overlain with cellophane and grown under the same
conditions for 5-6 d for protoplast isolation according to Roberts et al (2011).
Protoplast Isolation & Transformation
Protoplasts were isolated according to Roberts et al (2011) using the P. patens
cesa5KO-2 line. Briefly, protonemal tissue was digested using driselase, washed thrice in
an isosmotic medium, mixed with the linearized expression vector and polyethylene
glycol and heat shocked at 45°C for three minutes. Protoplasts were resuspended in top
agar protoplast regeneration medium (PRMT) and plated on bottom agar protoplast

16
regeneration medium (PRMB) overlain with cellophane. Transformed protoplasts were
screened through two rounds of hygromycin selection to obtain stable transformants.
Complementation Assays
Stably transformed moss lines were arrayed on BCDAT plates and incubated at
25°C with fluorescent lights at a photon flux density of 60 µM m-2s-1 for 7 d. A dissecting
microscope was used at 20X - 40X to count the number of lines producing gametophores
and to assess gametophore development and phyllotaxy. The Leica M165 FC dissecting
microscope was used to examine lines and individual gametophores between 4.6 and 63X
(Leica Microsystems Inc, Buffalo Grove, IL, USA). The Olympus BH2-RFCA
compound microscope was used to examine individual leaves at 312.5X (Olympus
Corporation, Lake Successs, NY, USA). Images were captured using a Leica BFC310 FX
camera (Leica Microsystems Inc, Buffalo Grove, IL, USA). Lines resulting from
transformation with chimeric CESA expression vectors were compared to lines resulting
from transformation with a positive control vector (PpCESA5::ppcesa5KO-2) and a
negative control vector (the destination vector without the Gateway cassette transformed
into ppcesa5KO-2).
Statistics
P values were assigned using the Two-Tailed Fisher’s Exact Test of Independence
(Sokal and Rohlf 1981). For each expression vector, data from each trial was pooled and
compared against the corresponding opposite control data (i.e. a vector that did not rescue
would be compared against the positive control) to determine the p value. Each
expression vector was compared against the corresponding similar control to determine
whether or not there was a significant difference.

17
Protein Isolation
Microsomal proteins were isolated from at least twelve lines from each non-
rescuing transformation along with 3XHACESA8 lines (positive control) and xt18-GW
lines (negative control) according to Hutton et al (Hutton et al. 1998) with modifications.
Tissue was ground using the Argos pellet mixer and pestle (Argos Technologies Inc.,
Elgin, IL, USA) in 100 µl of extraction buffer containing 50 mM HEPES, 0.5 M sucrose,
0.1 mM EDTA, and 4 mM M-ascorbic acid for five minutes on ice. The lysate was
centrifuged at 10,000 x g for ten minutes at 4° C and the supernatant centrifuged again
under the same conditions in order to remove plastids and nuclei. The final supernatant
was collected and centrifuged at 100,000 x g for thirty minutes at 4°C and the pellet was
resuspended in 15 µl 2X SDS buffer and 15 µl of deionized water.
Protein Quantification
Protein extractions were quantified using the Pierce BCA Protein Assay kit
(Thermo Scientific Inc., Rockford, IL, USA) according to manufacturer’s instructions,
using 25 µl of each standard and 7-10 µl of each unknown. Proteins run on the NuPAGE
4-12% Bis-Tris gel (Thermo Scientific Inc.) were normalized according to the protein
sample with the lowest concentration from the BCA Protein Assay (Thermo Scientific
Inc.).
Western Blot
At least 10 ng of each protein sample was run on a NuPAGE 4-12% Bis-Tris gel
(Thermo Fisher Scientific Inc.) at 50 mV for 15 minutes and then 200 mV for 30 minutes.
The gel was soaked in 1X transfer buffer (0.2 M glycine, 0.025 M Tris base) for 10 min
at 4° C and then transferred onto a polyvinylidene difluoride membrane (Thermo

18
Scientific Inc.) using the BioRad Mini-PROTEAN II Electrophoresis Cell (Bio-Rad Life
Sciences, Hercules, CA, USA) at 75 V for one hour at 4° C. The membrane was blocked
by incubating with shaking at 80 rpm in 5% (w/v) milk in 1X TBST (50 mM Tris, 150
mM NaCl, 0.05% Tween 20) for one hour at 25° C and washed with 1X TBST. The
membrane was then incubated with shaking at 80 rpm in 5% (w/v) milk in TBST with
1:1000 anti-hemagglutinin antibody (HA11 Clone 16B12, Covance, Dedham, MA, USA)
overnight at 4° C and washed four times with 1X TBST for four minutes at 80 rpm. The
membrane was then incubated with shaking at 80 rpm in 5% (w/v) milk in 1X TBST with
1:200 anti-mouse IgG peroxidase antibody for one hour at 25° C and washed four times
with 1X TBST for 4 minutes at 80 rpm. 2-3 ml of Substrate A & B from the Pierce ECL
Western Blotting Substrate kit (Thermo Scientific Inc.) were applied to the membrane
and incubated for one minute. Membranes were exposed for 20 minutes using X-ray film
(Research Products International, Mount Prospect, IL, USA). Blots were subsequently
incubated with shaking at 80 rpm in 5% (w/v) milk in TBST with 1:500 anti-tubulin
antibody (Monoclonal Anti-α-TubulinClone DM1A, Sigma-Aldrich, St. Louis, MO,
USA) overnight at 4° C. The membrane was washed as previously described and
incubated with shaking at 80 rpm in 5% (w/v) milk in 1X TBST with 1:200 anti-mouse
IgG peroxidase antibody for one hour at 25° C. Finally, the membrane was washed as
previously described, blotted and exposed using X-ray film (Research Products
International) after 20 minutes.

19
RESULTS
Experimental Design
The ppcesa5KO-2B complementation assay was developed to test the role of the
CSR in clade-specific CESA function in P. patens. The ppcesa5KO mutants are
characterized by an inability to form normal gametophores, most commonly developing
abnormal buds and rarely producing small gametophores with irregular phyllotaxy (Goss
et al. 2012). PpCESAs within the same clade (Clade A) can rescue the ppcesa5KO
phenotype but PpCESAs from Clade B cannot (Roberts, unpublished). By transforming
the ppcesa5KO-2B line with expression vectors containing various PpCESA chimeras
and scoring for complementation of the mutant phenotype, I tested the hypothesis that a
Clade A CSR is necessary and sufficient for Clade A-specific CESA function in
gametophore development. Based on this hypothesis, I predicted that a Clade A CESA
with the CSR of a Clade B CESA would be unable to rescue the ppcesa5KO phenotype,
whereas a Clade A CESA with the CSR of another Clade A CESA would be able to
rescue the phenotype. Additionally, I predicted that if the CSR is sufficient for clade-
specific function, then a Clade B CESA with the CSR of a Clade A CESA would also be
able to rescue the ppcesa5KO phenotype. The chimeric PpCESAs designed to test these
predictions were fused with a triple hemagglutinin tag so that the resulting moss
transformants could be tested for expression of the transgene. In the complementation
assays, ppcesa5KO-2B lines were transformed with three separate expression clones
along with a positive control vector containing the wild-type PpCESA5 and negative
empty vector control. Stable transformants were arrayed on solid medium and scored for
gametophore development. Results were included if they met several criteria, the first

20
being a minimum number of five stable lines per expression clone transformation.
Results were excluded if the positive and/or negative control was absent or produced too
few lines (a result of either a low transformation rate or contamination). Results were also
excluded if the positive and/or negative control behaved abnormally (i.e the positive
control produced gametophores in less than 40% of stable, transformed lines).
Transformation with Positive and Negative Control Vectors
The ppcesa5KO phenotype is characterized by a complete absence of leafy
gametophores, or occasionally stunted gametophores with abnormal phyllotaxy.
PpCESA5KO lines typically produce cellulose deficient buds that are unable to mature
into normal leafy gametophores due to irregularities in cell expansion and cell division
(Goss et al. 2012). The gametophores that are able to develop from these irregular buds
are small, producing only one to three irregularly spaced, misshapen leaves.
Transformation with a 3XHAPpCESA5 expression vector fully and reproducibly rescued
the ppcesa5KO phenotype. Between 40% and 100% of lines stably transformed with this
vector produced gametophores, with an average of 74% of lines producing gametophores,
and each line that produced gametophores also produced a full length protein when
probed with an anti-hemagglutinin antibody (Table 3, Figures 5, 6 & 7). These lines
produced several gametophores (usually more than four per colony) of normal size and
phyllotaxy, with leaves occurring in a regular spiral pattern (Figure 8). Leaves were
narrow and pointed with elongated cells occurring in distinct files (Figure 8).
Transformation with the xt18-GW empty vector consistently failed to rescue the ppcesa5
KO phenotype. Between 0% and 20% of lines produced gametophores, with an average
of 5% of lines producing gametophores (Table 3, Figure 5 & 7). Gametophores produced

21
by xt18-GW lines resembled those of the ppcesa5KO-2B line. Each line that produced
gametophores typically only produced one or two per colony. The gametophores
themselves were small, with only one to three misshapen, small leaves. The leaves were
composed of irregularly shaped cells and lacked the conducting cells present in mature
leaves and gametophores (Figure 8).
The Class-Specific Region in Clade-Specific Function
Transformation with a vector containing CESA5 with the CSR of another Clade A
CESA (3XHAppcesa5CSR8) was able to rescue the ppcesa5KO phenotype, producing
normal gametophores in the same numbers as 3XHAPpCESA5 transformed moss lines (p
< 0.0001, Figure 5 A, Table 3). The ability of 3XHAppcesa5CSR8 to rescue the
ppcesa5KO phenotype indicates that CSRs within the same clade can perform clade-
specific functions in Clade A CESAs.
Transformation with a vector containing CESA5 with the CSR of a Clade B CESA
(3XHAppcesa5CSR4) failed to rescue the ppcesa5KO phenotype, producing no
gametophores in both trials (p < 0.0001, Figure 5 B, Table 3). This was consistent with
the negative control, xt18-GW transformations, which rarely produced gametophores that
tended to be stunted with an abnormal phyllotaxy (Figure 5 A, Table 3, Figure 8), similar
to the ppcesa5KO phenotype (Goss et al. 2012).
Transformation with a vector containing a Clade B CESA with the CSR of a Clade
A CESA (3XHAppcesa4CSR5) also failed to rescue the ppcesa5KO phenotype,
producing low numbers of lines with stunted, abnormal gametophores in both trials (p <
0.0001, Figure 5 C, Table 3), consistent with the negative control and the ppcesa5KO
phenotype (Goss et al. 2012).

22
Table 3. Summary of chimeric CESA expression clone-transformed ppcesa5 KO-2 moss lines producing gametophores. The positive and negative controls of each trial are included. All data are shown with indication of which trials were included in the analysis. Expression Clone
Trial No.
Lines with Gametophores
Positive Control with Gametophores
Negative Control with Gametophores
Included in Statistical Analysis
Ppcesa5CSR4 1 0/9 11/27 5/65 Yes
Ppcesa5CSR4 2 0/20 11/18 0/20 Yes
Ppcesa5CSR4 3 0/4 1/8 12/25 No
Ppcesa5CSR4 4 0/14 3/12 0/15 No
Ppcesa4CSR5 1 3/33 21/24 2/51 Yes
Ppcesa4CSR5 2 0/11 9/13 0/30 Yes
Ppcesa4CSR5 3 0/6 0 0 No
Ppcesa5CSR8 1 9/14 19/24 2/21 Yes
Ppcesa5CSR8 2 3/4 15/15 0/12 No
Ppcesa5CSR8 3 10/15 6/10 1/5 Yes
Ppcesa5CSR8 4 3/6 4/4 0/4 No
Ppcesa5CSR8 5 0/6 0/4 0/4 No
Ppcesa4/5/5 1 1/21 9/13 0/30 Yes
Ppcesa4/5/5 2 1/14 15/15 0/12 Yes
Ppcesa5/5/4 1 6/15 19/24 2/21 Yes
Ppcesa5/5/4 2 2/6 3/4 2/4 No
Ppcesa5/5/4 3 2/8 15/15 0/12 Yes
Ppcesa5/5/4 4 15/43 23/33 1/21 Yes

23
Figure 5. Ppcesa5KO-2B phenotypic rescue by PpCESA CSR swap vectors and corresponding positive and negative control vectors. Data from replicate trials was pooled for graphical representation and statistical analysis using the two-tailed Fisher exact probability test. (A) Vector containing Clade A CESA with Clade A CSR. (B) Vector containing Clade A CESA with Clade B CSR. (C) Vector containing Clade B CESA with Clade A CSR. Chart detailing individual trials of each CSR swap presented in Appendix 4.
0
20
40
60
80
100
3XHAppcesa5CSR8 3XHAPpCESA5 xt18-‐GW
Percent Lines with
Gametophores
Transformed Line P<0.0001 A
0
20
40
60
80
100
3XHAppcesa5CSR4 3XHAPpCESA5 xt18-‐GW
Percent Lines with
Gametophores
Transformed Line P<0.0001 B
0
20
40
60
80
100
3XHAppcesa4CSR5 3XHAPpCESA5 xt18-‐GW
Percent Lines with
Gametophores
Transformed Line P<0.0001 C

24
Figure 6. Western blots of microsomal protein extracts from ppcesa5KO-2B lines transformed with expression vectors containing various 3XHA-CESA fusions. Blots probed with anti-HA probe are above blots probed with anti-tubulin probe. + = positive control (3XHAPpCESA8) - = negative control (xt18-GW). G = lines with normal gametophores; g = lines without gametophores. Numbered lines did not produce gametophores. From top to bottom: 3XHAPpCESA5, 3XHAPpCESA5, 3XHAppcesa4CSR5, 3XHAppcesa5CSR4, 3XHAppcesa4/5/5, 3XHAppcesa5/5/4, and 3XHAppcesa5/5/4. Uncropped Western blots can be found in Appendix 5.
25
To test whether failure to rescue the ppcesa5KO phenotype could be explained by
poor expression or misfolding and subsequent destruction of proteins coded by the
transgenes, transformants that did not rescue the ppcesa5KO phenotype were analyzed
for accumulation of the transgenic protein through Western blots probed with an anti-
hemagglutinin antibody and an anti-tubulin antibody to evaluate protein loading. Initially,
Western blots were performed on microsomal protein extracts from 3XHAPpCESA5
transformed moss lines that both produced and did not produce gametophores (Figure 6).
All lines that produced gametophores showed the predicted band at 125 kD, indicating
that the full-length 3XHAPpCESA5 protein was expressed. Six lines that did not produce
gametophores produced the predicted band and the other four lines did not. One
interpretation of this result is that a minimum dose of PpCESA5 proteins is needed to
successfully rescue the ppcesa5 KO phenotype. It is also possible that some of the stable
transformants do not contain the intact vector, as evidenced by the lack of a 125 kD band
in most of the gametophore-less lines, instead containing an truncated vector with the
functional resistance cassette.
Tubulin bands across the Western blots were often faint and of variable intensity,
indicating that protein loading was uneven. Despite using the Pierce BCA Protein Assay,
protein concentrations were too low to measure accurately. Additionally, a linear trend
line was used initially to calculate protein concentration against BSA standards instead of
the recommended exponential trend line. Both of these factors contributed to inconsistent
protein loading, as indicated by variable tubulin levels across the blots (Figure 6). Using
larger quantities of moss tissue to increase protein concentration of the samples will make
calculating protein concentration more reliable.
26
All 3XHAppcesa4CSR5 lines produced the predicted band at 125 kD, indicating
that the full-length protein was expressed (Figure 6). This expression validates the
inability of 3XHAppcesa4CSR5 to rescue the ppcesa5 KO phenotype. In contrast, only
seven out of twelve 3XHAppcesa5CSR4 transformed lines produced the predicted band
at 125 kD (Figure 6). However, this still indicates that full-length 3XHAppcesa5CSR4 is
unable to rescue the ppcesa5 KO phenotype. The lower apparent expression rate may be
due to uneven protein loading, as in this particular Western blot, a fainter anti-HA band
correlated to a fainter anti-tubulin band (Figure 6). Regardless, the Western blots
indicated that the chimeric proteins were intact and not truncated, indicating that failure
to rescue cannot be solely attributed to lack of protein expression.
The N and C-termini in Clade-Specific Function
In order to determine other regions necessary in clade-specific CESA function in
P. patens, N and C-terminal swaps were created between PpCESA5 and PpCESA4. The
C-terminal swap termed 3XHAppcesa5/5/4 consisted of the C-terminus of PpCESA4
after the CSR fused onto the N-terminus of PpCESA5 up to and including the CSR. The
N-terminal swap termed 3XHAppcesa4/5/5 consisted of the N-terminus of PpCESA4 up
to the CSR fused onto the C-terminus of PpCESA5 from the CSR onwards. The
ppcesa5KO phenotype was not rescued in 3XHAppcesa4/5/5 transformed lines,
with only one line in each trial producing stunted gametophores with abnormal
phyllotaxy, consistent with the ppcesa5KO phenotype (Figure 7, Table 3) (Goss et al.
2012). The ppcesa5KO phenotype was rescued in some 3XHAppcesa5/5/4 transformed
lines, but not in the same numbers as the positive control (Figure 7, Table 3), possibly
indicating a partial rescue.

27
Figure 7. Ppcesa5KO-2B phenotypic rescue by each N- and C-terminal swap mutant and corresponding positive and negative control vectors. Data from replicate trials was pooled for graphical representation and statistical analysis using the two-tailed Fisher exact probability test. (A) Vector containing Clade A CESA with N-terminus of Clade B CESA. (B) Vector containing Clade A CESA with C-terminus of Clade B CESA. (C) Individual trials of both vectors.
0
20
40
60
80
100
3XHAppcesa4/5/5 3XHAPpCESA5 xt18-‐GW
Percent Lines with
Gametophres
Transformed Line P<0.0001 A
0
20
40
60
80
100
ppcesa4/5/5 PpCESA5 xt18-‐GW ppcesa5/5/4 PpCESA5 xt18-‐GW
Percent Lines with
Gametophores
Transformed Lines
Trial 1
Trial 2
Trial 3
C
0
20
40
60
80
100
3XHAppcesa5/5/4 3XHAPpCESA5 xt18-‐GW
Percent Lines with
Gametophores
Transformed Lines P<0.0001 B

28
Figure 8. Stably transformed lines from (A) 3XHAppcesa5/5/4, (B) 3XHAPpCESA5 and (C) xt18-GW. Gametophores from (D) 3XHAppcesa5/5/4, (E) 3XHAPpCESA5 and (F) xt18-GW. Leaves from (G) 3XHAppcesa5/5/4, (H) 3XHAPpCESA5 and (I) xt18-GW. 3XHAppcesa5/5/4 and 3XHAPpCESA5 lines resembled the wild type, producing several gametophores per moss line with normal height, phyllotaxy and cell shape and pattern. Xt18-GW lines resembled the ppcesa5KO-2B line, producing gametophores rarely with stunted growth, abnormal phyllotaxy and irregular cell shape and pattern. Scale bars are as follows: (A-C) 2mm (D-F) 1 mm (G-I) 0.5mm.
A B C
D E F
G H I

29
The 3XHAppcesa5/5/4, 3XHAPpCESA5 and xt18-GW transformed ppcesa5KO-
2B lines were examined with bright field light microscopy to assess differences in
gametophore development. Whole gametophores from 3XHAppcesa5/5/4 lines showed
no difference in size or phyllotaxy from gametophores from 3XHAPpCESA5 lines
(Figure 8). Closer examination of individual leaves revealed no difference in leaf
morphology, nor any difference in cell size, shape and pattern within the leaves (Figure
8).
Expression levels of both transgenes were analyzed through Western blots using
an anti-HA antibody and an anti-tubulin antibody. All microsomal protein extracts from
twelve lines of 3XHAppcesa4/5/5 produced the expected band at 125 kD, indicating that
the full-length protein was expressed (Figure 6). In the first blot (Figure 6), all protein
extracts from gametophore producing 3XHAppcesa5/5/4 lines produced the expected
band at 125 kD. Several protein extracts from lines that did not produce gametophores
also produced a fainter band at 125 kD. However, it is difficult to determine whether or
not protein expression levels are different between gametophore-producing and
gametophore-less lines, as anti-tubulin staining shows that protein loading was not
properly normalized. In the second blot, all microsomal protein extracts from
gametophore producing lines of 3XHAppcesa5/5/4 transformed moss, with the exception
of the last lane, in which the sample had not been loaded into the well, produced the
expected band at 125 kD. Protein from lines that did not produce gametophores did not
produce the expected band (Figure 6). However, the presence of the tubulin band (55 kD)
is varied in intensity across the samples, indicating that protein levels were not properly
normalized. This is most obvious in the positive control, in which neither the HA nor

30
tubulin band is visible (Figure 6). This opens up the possibility that the transgene is being
expressed, but is undetected by the blot.

31
DISCUSSION
The Experimental Assay
A complementation assay should be able test hypotheses about the function of a
specific gene and its encoded product in a reliable and reproducible manner. In order to
achieve this, a complementation assay must be based on a mutant with a measurable
phenotype that is easy to score. In the ppcesa5KO mutants, the phenotype is clear: an
inability to form leafy gametophores, only rarely forming stunted, abnormal
gametophores (Goss et al. 2012). This phenotype is rescued by the constitutive
expression of the disrupted PpCESA5 gene, demonstrating that this phenotype is the
result of a PpCESA5 deficiency. Additionally, this phenotype is rescued by other
PpCESAs of the same clade, but not by PpCESAs of Clade B (Roberts, unpublished),
providing an ideal system in which to test clade-specific functional differences between
the CESAs. Strengthening this system is the use of positive and negative controls, which
provide standards of comparison for statistical analysis. Since constitutive expression of
PpCESA5 in the ppcesa5KO-2B line fully rescues the mutant phenotype, an expression
vector containing this gene is the ideal positive control. Additionally, the use of the
empty destination vector serves as a control for changes in the ppcesa5KO phenotype
resulting from the transformation process or insertion of vector sequence alone, while
simultaneously acting as a standard of comparison for null rescues. To test the
functionality of a protein region, it must be possible to modify the region without
compromising the functional integrity of the protein as a whole. The use of PCR fusion
(Atanassov et al. 2009) adds no recombination or restriction sites between gene
fragments, thus maintaining structural integrity and decreasing the likelihood of

32
misfolding. Additionally, the system must provide a means to test for protein expression
levels and integrity. The use of a triple hemagglutinin tag enables the determination of
protein expression levels and mass by Western blotting. Protein extracted from the
chimeric lines probed with an anti-hemagglutinin antibody indicated that the chimeric
genes were indeed being transcribed and translated into proteins of the correct mass.
Due to the high rate of homologous recombination in P. patens, it was not
necessary to genotype stable transformants. Although not all stable lines transformed
with the positive control vector were rescued, statistical analysis comparing test vectors
to positive and negative controls enabled testing of complementation with high reliability.
We expect that complemented lines resulted from integration of the vector into the 108
locus with no deleterious effect on the phenotype. However, failure to complement in
some lines could result from integration of the vector at other loci, which could have an
effect on gametophore development independent of the ppcesa5KO lesion. It has been
reported that PEG-mediated transformation generates a small percentage of polyploidy
cells, which are slow-growing (Schaefer and Zryd 1997). Colonies that failed to produce
gametophores were often small and it is possible that these lines were polyploid and
failed to produce gametophores due to developmental delay. Some stable non-
complemented lines may have resulted from integration of a truncated vector that
included the resistance marker, but lacked either the actin1 promoter or the CESA coding
sequence. This could be tested by variability in protein expression levels across the lines.
In summary, the advantages of the ppcesa5KO complementation assay include a)
a clear phenotype consisting of abnormal buds and the absence of leafy gametophores, b)
the ability to score complementation as either full (normal gametophores), partial

33
(abundant abnormal gametophores/fewer normal gametophores), or none (no
gametophores or very few abnormal gametophores) rescue, c) functional discrimination
between the Clade A and Clade B CESAs, d) positive and negative controls for validation
of results and comparison of rescues, e) creation of chimeras through PCR fusion without
compromising the structural integrity of these closely related proteins, f) the ability to test
the expression and integrity of the transgenic proteins through Western blotting with anti-
HA and g) the ability to exclude genotyping the mutants.
The CSR is Necessary for Clade-Specific CESA Function
Transformation with an expression vector containing a Clade A CESA with the
CSR of another Clade A CESA (3XHAppcesa5CSR8) rescued the ppcesa5KO phenotype
(Figure 5 A, Table 3), indicating that CSRs can perform clade-specific functions when
inserted into a different CESA from the same clade. Additionally, as the chimeric CESA
was not misfolded, this may indicate that the other CSR swaps are unlikely to misfold as
well.
The mutant ppcesa5KO transformed by an expression vector containing a Clade
A CESA with the CSR of a Clade B CESA (3XHAppcesa5CSR4) did not produce
gametophores, retaining the knock out phenotype (Figure 5 B, Table 3). This result
supports the hypothesis that the CSR is necessary for clade-specific function, as the
change from Clade A CSR to Clade B CSR leads to loss of function of PpCESA5. This
may be due to the inability of the chimeric CESA to join a cellulose synthase complex, as
supported by the in silico modeling of Gossypium hirsutum CESA1 catalytic domains as
oligomers (Sethaphong et al. 2013). However, it may also be due to the inability of the
chimeric CESA to interact with other non-CESA proteins, as the proteins necessary for

34
CSC formation and function are still unknown (Delmer 1999; Doblin et al. 2002;
Guerriero et al. 2010). Alternatively, the CSR may play a previously unidentified role in
CESA function unrelated to protein-protein interactions. Although misfolding of the
transgenic protein cannot be ruled out, Western blotting results indicate that the transgene
is transcribed and translated to produce a protein of the expected mass that is not rapidly
degraded. In order to determine whether or not the CSR is involved in CSC formation, it
would be useful to perform co-immunoprecipitation experiments on wild type P. patens
and 3XHAppcesa5CSR4 lines. To further test the hypothesis that the CSR is responsible
for clade specific function, it would be useful to transform ppcesa5KO-2B lines with
PpCESA5 with the CSR of the third Clade A gene (PpCESA3) in addition to PpCESA5
with the CSRs of the untested Clade B genes (PpCESA7 and PpCESA10). This would
demonstrate whether the clade-specific function of the CSR is consistent across all P.
patens CESAs, and not simply CESAs 4, 5 and 8.
The CSR is Not Sufficient for Clade-Specific CESA Function
Transformation with an expression vector containing a Clade B CESA with the
CSR of a Clade A CESA (3XHAppcesa4CSR5) did not rescue the ppcesa5KO phenotype,
predominantly producing no gametophores and only occasionally producing malformed
gametophores consistent with the knock out phenotype (Figure 5 C, Table 3).
Transformed lines all produced the expected band at 125 kD (Figure 6) in Western blots.
The inability of the PpCESA5 CSR to confer Clade A-specific function on a Clade B
CESA suggests that whereas the CSR is important for clade-specific CESA function in P.
patens, it is not sufficient. It follows that other CESA features are also required for clade-
specific function. To further test this hypothesis, it would be useful to transform

35
ppcesa5KO-2B lines with PpCESA4 with the CSRs of PpCESA 8 and PpCESA3. Until
these tests are performed, it remains possible that one of the Clade CSRs is sufficient to
confer Clade A-specific function. If the CSR is not sufficient, then this complementation
system could be used to determine the region or regions that are also necessary for clade-
specific functions.
The N-terminus is Required for Clade-Specific CESA Function
Transformation with an expression vector containing the N-terminus of a Clade B
CESA and the CSR and C-terminus of a Clade A CESA (3XHAppcesa4/5/5) did not
rescue the ppcesa5KO phenotype (Table 3, Figure 7 A). Transformed lines all produced
the predicted band (Figure 6) in Western blots, indicating that the transgene was
transcribed and translated into a full-length protein. These results indicate that at least one
feature of the N-terminal segment, including the zinc-binding domain and the P-CR, is
necessary for clade-specific function. This is supported by an earlier study in Arabidopsis
thaliana where CESAs from two different classes, AtCESA1 and AtCESA3 were fused
such that the N-terminal region of AtCESA1 (up to the catalytic domain) was fused with
the C-terminal region of AtCESA3 (including the catalytic domain) and used to transform
both atcesa1 and atcesa3 knock outs. The chimera was only able to rescue atcesa3
knockouts, indicating that class-specific CESA function in Arabidopsis is attributed to
regions in the C-terminus encompassing the catalytic domain (Wang et al. 2006).
Coupled with the results of this thesis, this indicates that regions in the catalytic domain
are potentially involved in clade-specific function. Based on the results of Wang’s
experiments, one hypothesis is that the P-CR and CSR must be compatible. Fusing the P-

36
CR and CSR of a Clade A CESA to the remainder of a Clade B CESA and using the
expression vector in the ppcesa5 KO complementation assay could test this hypothesis.
Incomplete Rescue by 3XHAppcesa5/5/4
Normal gametophores were produced by mutant ppcesa5KO lines transformed
with an expression vector containing the N-terminus and CSR of a Clade A CESA and the
C-terminus of a Clade B CESA (3XHAppcesa5/5/4, Figure 7 B, Table 3), indicating that
the C-terminal portion of all PpCESAs may be able to support clade-specific function.
However, fewer colonies from these transformations produced gametophores, suggesting
that the chimera may not be fully functional. Every line of the 3XHAppcesa5/5/4
transformants that produced gametophores also produced the expected 125 kD band, with
the exception of one in which the protein sample was not loaded into the well. However,
three lines that did not produce gametophores produced a weaker 125 kD band (Figure
6). The incomplete rescue of this chimera could be attributed to a fully functional protein
that was expressed at a lower level in ppcesa5KO than the 3XHAPpCESA5 and
3XHAppcesa5CSR8 chimeras. This is supported by the lower level of transgene
expression relative to tubulin expression (Figure 6), although it is difficult to tell due to
uneven protein loading. The presence of gametophores could be due to a dosage effect, in
which a certain amount of the transgene is required to rescue the ppcesa5KO phenotype,
as mentioned above. Alternatively, the protein may lack functional integrity, such as a
higher propensity for misfolding. In order to test for a dosage effect and functional
integrity, Western blots with higher protein concentrations that are properly normalized
could reveal a lesser intensity in lines that do not produce gametophores, indicating a

37
dosage effect or truncated proteins, which would indicate a higher rate of protein
misfolding and thus suggest a lack of functional integrity.
Future Directions
This thesis demonstrates that while the CSR is necessary for clade-specific
function, it is not sufficient, indicating that one or more other features of the Clade A
CESAs are necessary for clade-specific function. Further tests have narrowed down other
necessary region or regions as residing in the N-terminal portion of the CESA up to the
CSR. Given that the zinc-binding domain, the Plant Conserved Region and the Class
Specific Regions are unique to rosette-forming CESAs (Delmer 1999; Doblin et al. 2002;
Sethaphong et al. 2013) and that the zinc-binding domain and P-CR occur in the N-
terminal region up to the CSR, it seems likely that one or both of these regions are
necessary for clade-specific function and possibly CSC formation. In particular,
compatibility between the P-CR and CSR, as suggested by G. hirsutum in silico models
(Sethaphong et al. 2013), may be necessary for clade-specific function. This could be
tested by creating swaps of the P-CR and zinc-binding domain between CESAs of Clade
A and B to test in the ppcesa5KO complementation system. Upon the results of these
proposed swaps, it would be useful to create swaps of the other necessary region(s) along
with the CSR between CESAs of Clade A and B to test in the ppcesa5KO
complementation system. Additionally, it would be useful to determine if the clade-
specific function that the CSR and other regions have is in CSC formation through co-
immunoprecipitation assays.

38
APPENDIX 1: List of Abbreviations
GT: Glycosyltransferase
CESA: Streptophyte cellulose synthase
CSC: Cellulose synthase complex
CSR: Clade-Specific Region
P-CR: Plant Conserved Region
WAXS: Wide angle X-ray scattering
SAXS: Small angle X-ray scattering
SANS: Small angle neutron scattering
NMR: Neutron magnetic resonance
PEG: Polyethylene glycol
CESA5CSR4: CESA5 with the CSR of CESA4
CESA5CSR8: CESA5 with the CSR of CESA8
CESA4CSR5: CESA4 with the CSR of CESA5
5/5/4: CESA5 with the C-terminus of CESA4
4/5/5: CESA5 with the N-terminus of CESA5

39
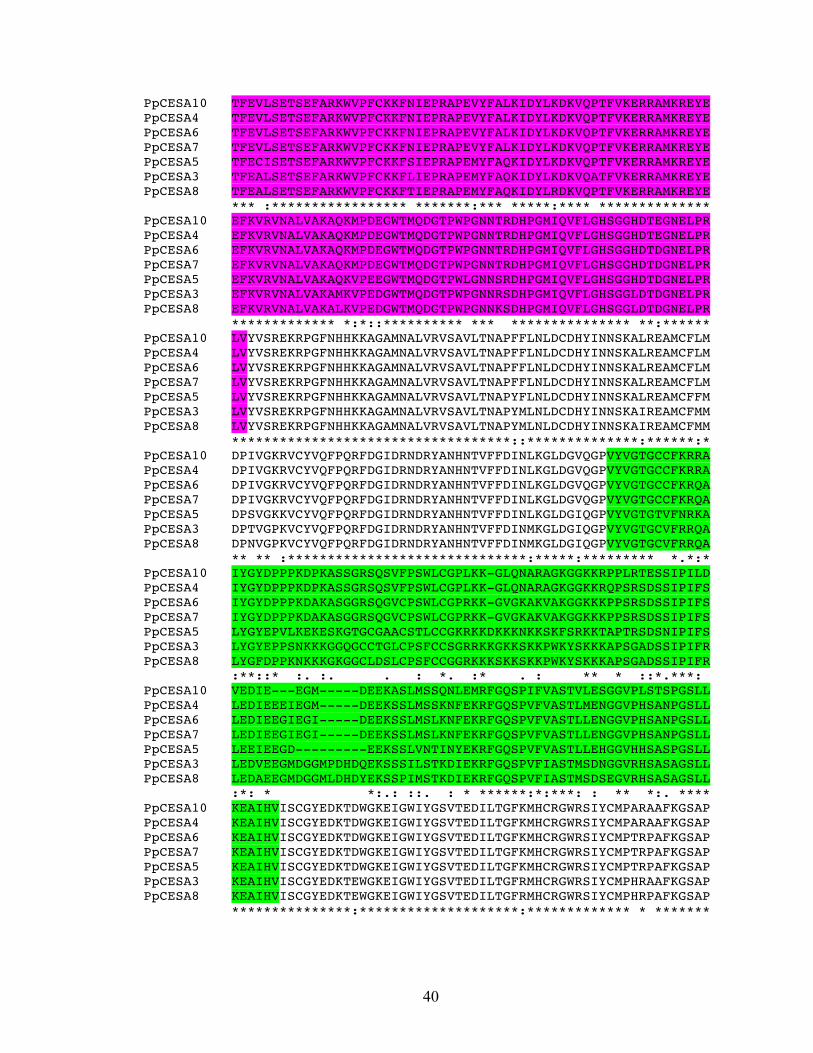
APPENDIX 2: Alignment of P. patens CESAs
PpCESA10 MESSPGLLAGSHNRNELVVIRQEG-DGPKPLSYVDSRICQICGDDVGLNMRREIFVACDE PpCESA4 MKANAGLLAGSHNRNELVIIRQEG-DGPKPLSYVNSHICQICGDDVGLTVEGEMFVACNE PpCESA6 MEANAGLVAGSHNRNELVVIRQES-DGPRPLSNVNSHICQICGDDVGVTLEGEMFVACTE PpCESA7 MEANAGLLAGSHNRNELVVIRQEG-DEPRPLSNVNSHICQICGDDVGVTLEGEMFVACTE PpCESA5 MEANAGLIAGSHNRNELVVLRP-DHEGPKPLSQVNSQFCQICGDDVGVTVDGELFVACFE PpCESA3 MEANAGLVAGSHNRNELVVIPAEGIHGPRPENQMNELVCQICGDAVGLNQDNELFVACNE PpCESA8 MEANAGLVAGSHNRNELVVIPAEGIHGPRPENQVNELVCQICGDAVGVNQDNELFVACNE *::. **:**********:: . *:* . ::. .****** **:. *:**** * PpCESA10 CGFPVCRPCYEYERKDGTQACPQCRTRYKRHKGSPRVKGDDEE-EDSDDLDNEFNHDGDL PpCESA4 CGFPVCRPCYEYERKDGTQACPQCRTRYRRHKGSPRVKGDDEE-EDTDDLDNEFNHAVNL PpCESA6 CGFPVCRPCYEYERKDGTQACPQCRTRYRRHKGSPRVKGDDEE-EDTDDLDNEFNHNVDI PpCESA7 CGFPVCRPCYEYERKDGTQACPQCRTRYRRHKGSPRVKGDDEE-EDTDDLDNEFNHNVDI PpCESA5 CGFPVCRPCFEYERKEGNQSCPQCKSRYNRQKGSPRVPGDEE-EDDTDDLENEFAL--EM PpCESA3 CAFPVCRTCYEYERKEGNGVCPHCKTRYKRLKGSLRVPGDDDEEDDLDDLENEFQM---- PpCESA8 CAFPVCRTCYEYERKEGNGVCPHCKTRYKRLKGSARVPGDD-EEDDLDDLENEFEM---- *.***** *:*****:*. **:*::**.* *** ** **: :* ***:*** PpCESA10 GKRDEQQVVDEMLHSQMAYGRDMDVTLS-----AMQPTYPLLTDRHRHTVSVTSDSDAMS PpCESA4 DNHDKQQVVDEMLHSQMAYGRDTEVMLS-----ATQPRYPLLTDGHRHMVSVTSESNATS PpCESA6 DKHDKQQVVDEMLHSQMAYGRDTDVMMS-----AMQPQYPLLTDGHT--VSGAGESNATS PpCESA7 DKHDKQQVVDEMLHSQMAYGRDTDVMMS-----AMQPQYPLLTDGHT--VSGAGESNATS PpCESA5 GQLDEQNVTDAMLHGHMSYGGNYDHNLP---NLHQTPQFPLLTDGKMGDLDDD------S PpCESA3 DKQDQQPSPDAMLHGRMSYGSMYEQEMATHRMMHQQPRFPLITDGQVGDSEED------E PpCESA8 DKKDQQPSPDAMLHGRMNYGRMYEHEMATHHMMHQQPRFPLITDGQVGDSEDD------E : *:* * ***.:* ** : : * :**:** : . . PpCESA10 PDRQAIFPVTGRRLTHATSYSDIGTP--VRALDSAKDAGSDGYGNVVWKERVESWKSRQG PpCESA4 PDHQAIFHVAGGKGSHTVSYSDIGSP--ARSLDPAKDLGSYGYGSIAWKERVESWKLRQG PpCESA6 PDHQAIFPVAGGKRIHPVAYSDIGSP--ARPLDPAKDLGSYGYGSIAWKERVESWKLRQG PpCESA7 PDHQAIFPVAGGKRIHPVAYSDIGSP--ARPLDPAKDLGSYGYGSIAWKERVESWKLRQG PpCESA5 HAIVLPPPMNGGKRVHPLPYIESNLPVQARPMDPTKDLAAYGYGSVAWKDRVESWKMRQE PpCESA3 NHA-LVVPSNGNKRVHPINYMDPNLPVQARPMDPTKDLAAYGYGSVAWKDKVENWKQRQE PpCESA8 NHA-LVVPSNSNKRVQPINYMDSNLPVQARPMDPSKDLAAYGYGSVAWKDKVDSWKQRQE . : : * : * .* :* :** .: ***.:.**::*:.** ** PpCESA10 MQMTMR-EGGQLQASGEGGYDGSGLDCSDLPIMDESRQPLSRKVPFPSSKINPYRMIIVI PpCESA4 MQMTTT-AGGQLQANGKGGDDGSHQDCSDLPIMDESRQPLSRKVPFPSSKINPYRMIIVI PpCESA6 MQMTTT-EGGQLQASGKGGHDENGPDCPDLPIMDESRQPLSRKVPIPSSKINPYRMIIVI PpCESA7 MQMTTT-EGGQLQASGKGGHDENGPDCPDLPIMDESRQPLSRKVPIPSSKINPYRMIIVI PpCESA5 KMMT---EGSHHHK----GGDMDGDNGPDLPIMDEARQPLSRKVPISSARINPYRMLIVI PpCESA3 KMQMMMSEGGVLHP-----SDM-DLNDPDLPIMDESRQPLSRKIPLASSKINPYRMVIVI PpCESA8 KMQMMMSEGGVLHP-----SDV-DPNGPDLPIMDESRQPLSRKIPIASSRINPYRMVIVI *. : * : *******:*******:*: *::******:*** PpCESA10 RLVVICLFFRYRILNPVNEAYGLWLVSVICEIWFGISWILDQFPKWLPINRETYLDRLSL PpCESA4 RLVVICLFFRYRILNPVNEAYGLWLVSVICEIWFGISWILDQFPKWLPINRETYLDRLSL PpCESA6 RLVVICLFFRYRILNPVNEAYALWLVSVICEIWFAISWILDQFPKWLPINRETYLDRLSL PpCESA7 RLVVICLFFRYRILNPVNEAYALWLVSVICEIWFAISWILDQFPKWLPINRETYLDRLSL PpCESA5 RLVVLAFFFRYRILNPVEGAYGMWLTSVICEIWFAISWILDQFPKWLPINRETYLDRLSL PpCESA3 RLVVLAFFLRYRILHPVEGAFGLWITSVVCEIWFAVSWILDQFPKWLPIQRETYLDRLSL PpCESA8 RLVVLAFFLRYRILHPVEGAFGLWITSVVCEIWFAVSWILDQFPKWLPIQRETYLDRLSL ****:.:*:*****.**: *:.:*:.**:*****.:*************:********** PpCESA10 RFEKEGEPSQLAPVDIYVSTVDPMKEPPLVTANTVLSILAVDYPVDKVSCYISDDGASML PpCESA4 RFEKEGEPSQLAPVDIYVSTVDPMKEPPLVTANTVLSILAVDYPVDKVSCYISDDGASML PpCESA6 RFEKEGEPSRLCPVDIYVSTVDPMKEPPLVTANTILSILAVDYPVDKVSCYISDDGASML PpCESA7 RFEKEGEPSRLCPVDIYVSTVDPMKEPPLVTANTILSILAVDYPVDKVSCYISDDGASML PpCESA5 RYEKEGEPSQLEHVDIFVSTVDPMKEPPLVTANTILSILAVDYPVDKVSCYLSDDGAAML PpCESA3 RYEKPGEPSQLAHVDVYVSTVDPLKEPPIVTANTILSILAVDYPVDKVSCYLSDDGAAML PpCESA8 RYEKPGEPSQLVNVDVYVSTVDPLKEPPIVTANTILSILAVDYPVDKVSCYLSDDGAAML *:** ****:* **::******:****:*****:****************:*****:**
40
PpCESA10 TFEVLSETSEFARKWVPFCKKFNIEPRAPEVYFALKIDYLKDKVQPTFVKERRAMKREYE PpCESA4 TFEVLSETSEFARKWVPFCKKFNIEPRAPEVYFALKIDYLKDKVQPTFVKERRAMKREYE PpCESA6 TFEVLSETSEFARKWVPFCKKFNIEPRAPEVYFALKIDYLKDKVQPTFVKERRAMKREYE PpCESA7 TFEVLSETSEFARKWVPFCKKFNIEPRAPEVYFALKIDYLKDKVQPTFVKERRAMKREYE PpCESA5 TFECISETSEFARKWVPFCKKFSIEPRAPEMYFAQKIDYLKDKVQPTFVKERRAMKREYE PpCESA3 TFEALSETSEFARKWVPFCKKFLIEPRAPEMYFAQKIDYLKDKVQATFVKERRAMKREYE PpCESA8 TFEALSETSEFARKWVPFCKKFTIEPRAPEMYFAQKIDYLRDKVQPTFVKERRAMKREYE *** :***************** *******:*** *****:**** ************** PpCESA10 EFKVRVNALVAKAQKMPDEGWTMQDGTPWPGNNTRDHPGMIQVFLGHSGGHDTEGNELPR PpCESA4 EFKVRVNALVAKAQKMPDEGWTMQDGTPWPGNNTRDHPGMIQVFLGHSGGHDTEGNELPR PpCESA6 EFKVRVNALVAKAQKMPDEGWTMQDGTPWPGNNTRDHPGMIQVFLGHSGGHDTDGNELPR PpCESA7 EFKVRVNALVAKAQKMPDEGWTMQDGTPWPGNNTRDHPGMIQVFLGHSGGHDTDGNELPR PpCESA5 EFKVRVNALVAKAQKVPEEGWTMQDGTPWLGNNSRDHPGMIQVFLGHSGGHDTDGNELPR PpCESA3 EFKVRVNALVAKAMKVPEDGWTMQDGTPWPGNNRSDHPGMIQVFLGHSGGLDTDGNELPR PpCESA8 EFKVRVNALVAKALKVPEDGWTMQDGTPWPGNNKSDHPGMIQVFLGHSGGLDTDGNELPR ************* *:*::********** *** *************** **:****** PpCESA10 LVYVSREKRPGFNHHKKAGAMNALVRVSAVLTNAPFFLNLDCDHYINNSKALREAMCFLM PpCESA4 LVYVSREKRPGFNHHKKAGAMNALVRVSAVLTNAPFFLNLDCDHYINNSKALREAMCFLM PpCESA6 LVYVSREKRPGFNHHKKAGAMNALVRVSAVLTNAPFFLNLDCDHYINNSKALREAMCFLM PpCESA7 LVYVSREKRPGFNHHKKAGAMNALVRVSAVLTNAPFFLNLDCDHYINNSKALREAMCFLM PpCESA5 LVYVSREKRPGFNHHKKAGAMNALVRVSAVLTNAPYFLNLDCDHYINNSKALREAMCFFM PpCESA3 LVYVSREKRPGFNHHKKAGAMNALVRVSAVLTNAPYMLNLDCDHYINNSKAIREAMCFMM PpCESA8 LVYVSREKRPGFNHHKKAGAMNALVRVSAVLTNAPYMLNLDCDHYINNSKAIREAMCFMM ***********************************::**************:******:* PpCESA10 DPIVGKRVCYVQFPQRFDGIDRNDRYANHNTVFFDINLKGLDGVQGPVYVGTGCCFKRRA PpCESA4 DPIVGKRVCYVQFPQRFDGIDRNDRYANHNTVFFDINLKGLDGVQGPVYVGTGCCFKRRA PpCESA6 DPIVGKRVCYVQFPQRFDGIDRNDRYANHNTVFFDINLKGLDGVQGPVYVGTGCCFKRQA PpCESA7 DPIVGKRVCYVQFPQRFDGIDRNDRYANHNTVFFDINLKGLDGVQGPVYVGTGCCFKRQA PpCESA5 DPSVGKKVCYVQFPQRFDGIDRNDRYANHNTVFFDINLKGLDGIQGPVYVGTGTVFNRKA PpCESA3 DPTVGPKVCYVQFPQRFDGIDRNDRYANHNTVFFDINMKGLDGIQGPVYVGTGCVFRRQA PpCESA8 DPNVGPKVCYVQFPQRFDGIDRNDRYANHNTVFFDINMKGLDGIQGPVYVGTGCVFRRQA ** ** :******************************:*****:********* *.*:* PpCESA10 IYGYDPPPKDPKASSGRSQSVFPSWLCGPLKK-GLQNARAGKGGKKRPPLRTESSIPILD PpCESA4 IYGYDPPPKDPKASSGRSQSVFPSWLCGPLKK-GLQNARAGKGGKKRQPSRSDSSIPIFS PpCESA6 IYGYDPPPKDAKASGGRSQGVCPSWLCGPRKK-GVGKAKVAKGGKKKPPSRSDSSIPIFS PpCESA7 IYGYDPPPKDAKASGGRSQGVCPSWLCGPRKK-GVGKAKVAKGGKKKPPSRSDSSIPIFS PpCESA5 LYGYEPVLKEKESKGTGCGAACSTLCCGKRKKDKKKNKKSKFSRKKTAPTRSDSNIPIFS PpCESA3 LYGYEPPSNKKKGGQGCCTGLCPSFCCSGRRKKGKKSKKPWKYSKKKAPSGADSSIPIFR PpCESA8 LYGFDPPKNKKKGKGGCLDSLCPSFCCGGRKKKSKKSKKPWKYSKKKAPSGADSSIPIFR :**::* :. :. . : *. :* . : ** * ::*.***: PpCESA10 VEDIE---EGM-----DEEKASLMSSQNLEMRFGQSPIFVASTVLESGGVPLSTSPGSLL PpCESA4 LEDIEEEIEGM-----DEEKSSLMSSKNFEKRFGQSPVFVASTLMENGGVPHSANPGSLL PpCESA6 LEDIEEGIEGI-----DEEKSSLMSLKNFEKRFGQSPVFVASTLLENGGVPHSANPGSLL PpCESA7 LEDIEEGIEGI-----DEEKSSLMSLKNFEKRFGQSPVFVASTLLENGGVPHSANPGSLL PpCESA5 LEEIEEGD---------EEKSSLVNTINYEKRFGQSPVFVASTLLEHGGVHHSASPGSLL PpCESA3 LEDVEEGMDGGMPDHDQEKSSSILSTKDIEKRFGQSPVFIASTMSDNGGVRHSASAGSLL PpCESA8 LEDAEEGMDGGMLDHDYEKSSPIMSTKDIEKRFGQSPVFIASTMSDSEGVRHSASAGSLL :*: * *:.: ::. : * ******:*:***: : ** *:. **** PpCESA10 KEAIHVISCGYEDKTDWGKEIGWIYGSVTEDILTGFKMHCRGWRSIYCMPARAAFKGSAP PpCESA4 KEAIHVISCGYEDKTDWGKEIGWIYGSVTEDILTGFKMHCRGWRSIYCMPARAAFKGSAP PpCESA6 KEAIHVISCGYEDKTDWGKEIGWIYGSVTEDILTGFKMHCRGWRSIYCMPTRPAFKGSAP PpCESA7 KEAIHVISCGYEDKTDWGKEIGWIYGSVTEDILTGFKMHCRGWRSIYCMPTRPAFKGSAP PpCESA5 KEAIHVISCGYEDKTDWGKEIGWIYGSVTEDILTGFKMHCRGWRSIYCMPTRPAFKGSAP PpCESA3 KEAIHVISCGYEDKTEWGKEIGWIYGSVTEDILTGFRMHCRGWRSIYCMPHRAAFKGSAP PpCESA8 KEAIHVISCGYEDKTEWGKEIGWIYGSVTEDILTGFRMHCRGWRSIYCMPHRPAFKGSAP ***************:********************:************* * *******

41
PpCESA10 INLSDRLQQVLRWALGSVEISLSRHCPLWYGYGGGKHGELKCLERLAYINTTIYPLTSLP PpCESA4 INLSDRLQQVLRWALGSVEISLSRHCPLWYGYGGGKNGGLKCLERLAYINTTIYPLTSLP PpCESA6 INLSDRLNQVLRWALGSVEISLSRHCPLWYGYGGGKNGGLKCLERLAYINTTIYPLTSLP PpCESA7 INLSDRLNQVLRWALGSVEISLSRHCPLWYGYGGGKNGGLKCLERLAYINTTIYPLTSLP PpCESA5 INLSDRLNQVLRWALGSVEISLSRHCPLWYGYGG----RLKCLERLAYINATIYPLTSLP PpCESA3 INLSDRLNQVLRWALGSVEISLSRHCPLWFGYG-----RLKCLERLAYINTTIYPLTSLP PpCESA8 INLSDRLNQVLRWALGSVEISLSRHCPLWYGYG-----RLKCLERLAYINTTIYPLTSLP *******:*********************:*** ***********:********* PpCESA10 LLAYCVLPAVCLLTGKFIIPTITNLDSLWFISLFISIFATGILEMRWSGVGIDEWWRNEQ PpCESA4 LLAYCVLPAVCLLTGKFIIPTISNLASLWFISLFISIFATGILEMRWSGVGIDEWWRNEQ PpCESA6 LLAYCVLPAVCLLTGKFIIPTISNLASLWFISLFISIFATGILEMRWSGVGIDEWWRNEQ PpCESA7 LLAYCVLPAVCLLTGKFIIPTISNLASLWFISLFISIFATGILEMRWSGVGIDEWWRNEQ PpCESA5 LVAYCVLPAVCLLTGNFIIPTISNLDSLYFISLFLSIFVTGILEMRWSGVGIDEWWRNEQ PpCESA3 LVAYCTLPAVCLLTGNFIIPTISNLDSLWFISLFMSIFITGILEMRWSGVGIDEWWRNEQ PpCESA8 LVAYCTLPAVCLLTGKFIIPTISNLDSLWFISLFMSIFITGILEMRWSGVGIDEWWRNEQ *:***.*********:******:** **:*****:*** ********************* PpCESA10 FWVIGGVSAHLFALFQGLLKVLAGIDTNFTVTSKQAEDEDFAELYMIKWTALLIPPTTLL PpCESA4 FWVIGGVSAHLFALFQGLLKVFAGIDTNFTVTSKQAEDEDFAELYMIKWTALLIPPTTLL PpCESA6 FWVIGGVSAHLFALFQGLLKVFAGIDTNFTVTSKQAEDEDFAELYMIKWTALLIPPTTLI PpCESA7 FWVIGGVSAHLFALFQGLLKVFAGIDTNFTVTSKQAEDEDFAELYMIKWTALLIPPTTLI PpCESA5 FWVIGGVSAHLFALFQGLLKVFAGVDTNFTVTSKQADDEDFGELYMLKWTSLLIPPTTIL PpCESA3 FWVIGGVSAHLFALFQGLLKVFAGIDTNFTVTSKTGEDEDFGELYALKWTSLLIPPTTLL PpCESA8 FWVIGGVSAHLFALFQGLLKVFAGIDTNFTVTSKTGEDEDFGELYTLKWTSLLIPPTTLL *********************:**:********* .:****.*** :***:*******:: PpCESA10 VINMIGVVAGISDAINNGYQSWGPLFGKLFFAFWVIVHLYPFLKGLMGRQNRTPTIVIVW PpCESA4 VINMIGVVAGISDAINNGYQSWGPLFGKLFFAFWVIVHLYPFLKGLMGRQNRTPTIVIVW PpCESA6 VINMIGVVAGISDAINNGYQSWGPLFGKLFFAFWVIVHLYPFLKGLMGRQNRTPTIVIVW PpCESA7 VINMIGVVAGISDAINNGYQSWGPLFGKLFFAFWVIVHLYPFLKGLMGRQNRTPTIVIVW PpCESA5 ILNLVGVVAGISDAINNGYQSWGPLFGKLFFAFWVIVHLYPFLKGLMGRQNRTPTIVIVW PpCESA3 IFNMVGVVAGISDAINNGYSAWGPLFGKLFFAFWVIVHLYPFLKGLMGRQNRTPTIVIVW PpCESA8 LFNMVGVVAGISDAINNGYSAWGPLFGKLFFAFWVIVHLYPFLKGLMGRQNRTPTIVIVW ::*::**************.:*************************************** PpCESA10 SILLASIFSLLWVRIDPFLAKVTGPDITECGINC- PpCESA4 SILLASIFSLLWVRIDPFLAKVKGPDLSQCGINCR PpCESA6 SILLASIFSLLWVRIDPFLAKVKGPDLSQCGINC- PpCESA7 SILLASIFSLLWVRIDPFLAKVKGPDLSQCGINC- PpCESA5 SILLASIFSLLWVRINPFLSRSNGPNLVECGLSC- PpCESA3 SILLASIFSLLWVRIDPFLPKVTGPNLVRCGLTCL PpCESA8 SILLASIFSLLWVRIDPFLPKSTGPNLVRCGLTCL ***************:*** : .**:: .**:.* Alignment of four Clade B CESAs are (top) and three Clade A CESAs (bottom) via Clustal Omega (European Molecular Biology Labs-European Bioinformatics Institute, Cambridge, UK, http://www.ebi.ac.uk/Tools/msa/clustalo/). The zinc-binding domain is highlighted in blue, the P-CR is highlighted in purple, the CSR is highlighted in green. Stars indicate a conserved residue while colons indicate a similar structure. Periods indicate a relatively similar size and blank spaces indicate no conservation.

42
Alig
nmen
t of f
our C
lade
B C
ESA
s are
(top
) and
thre
e C
lade
A C
ESA
s (bo
ttom
) via
Clu
stal
Om
ega
(Eur
opea
n M
olec
ular
Bio
logy
Lab
s-Eu
rope
an B
ioin
form
atic
s Ins
titut
e, C
ambr
idge
, UK
, ht
tp://
ww
w.e
bi.a
c.uk
/Too
ls/m
sa/c
lust
alo/
).Red
line
s ind
icat
e α-
helic
es a
s pre
dict
ed b
y in
silic
o m
odel
ing
(Set
haph
ong,
un
publ
ishe
d). P
pCES
A7
helic
es n
ot sh
own
beca
use
the
CSR
am
ino
acid
sequ
ence
is id
entic
al fo
r tha
t of P
pCES
A6.
APP
EN
DIX
3: C
SR A
lignm
ent a
nd H
elix
Pre
dict
ion

43
APPENDIX 4: PCR Fusion Protocol Fusion reaction schematic with fragments and primers labeled:
SF1 F2 SR2 attB5 attB2 F1 F3 SR1 SF2 Procedure: 1. Program thermocycler as follows for standard Phusion polymerase (hot start step can be deleted if using Phusion HS).
Hot Start – 98C Initial Denaturation – 98C, 30s Denaturation – 98C, 8s Annealing – 68C, 25s 30 cycles Extension – 72C, 1 min Final Extension – 72C, 5 min Hold – 4C
2. Prepare PCR reactions for two or three fragment fusion according to the tables below and amplify: Ingredient Reaction F1 Reaction F2 Reaction F3 PCR grade water 34.5 µl 34.5 µl 34.5 µl HF Phusion Buffer 10 µl 10 µl 10 µl dNTP mix (10 mM each) 1 µl 1 µl 1 µl Forward primer (25 µM) 1 µl (CESA attB5) 1 µl (SF1) 1 µl (SF2) Reverse primer (25 µM) 1 µl (SR1) 1 µl (SR2) 1 µl (CESA attB2) Template DNA (1 ng/µl) 2 µl 2 µl 2 µl Phusion polymerase 0.5 µl 0.5 µl 0.5 µl

44
A gel with estimated concentrations and suggested amounts for PCR fusion reaction: 60 ng 120 ng 120 ng 6.67 µl 0.67 µl 1.67 µl If they are correct, proceed to PCR fusion:
• Make sure that your total DNA mass does not exceed 800 ng. • Make sure that the mass (ng) of each fragment is proportional to its size. Ex: F1 is
2000 bp, F2 is 400 bp and F3 is 1000 bp, so you will use 400 ng of F1, 80 ng of F2 and 200 ng of F3 (680 ng total < 800 ng). PCR Fusion Mix: 6 µl HF Phusion Buffer 0.3 µl Phusion enzyme 0.3 µl dNTP (10 ng/µl) F1, F2, F3 (3 fragment) or F1 & F2 (2 fragment) up to 800 ng Add ddH2O to bring the remaining volume to 30 µl Thermocycler conditions: Hot Start – 98C Denaturation – 98C, 30s Annealing – 60C, 1 min Extension – 72C, 7 min Hold – 4C
After this step, PEG purify the PCR products: 70 µl 1XTE 30 µl PCR product 50 µl 30% PEG/MgCl2 Vortex & centrifuge at 15,000 rpm for 15 minutes. Slowly pipette off supernatant. Resuspend in 7 µl 1XTE.
Use 3.5 µl of PCR product per BP reaction (add 0.5 µl pDONR – 75ng).

45
APPENDIX 5: Individual Trials of N- and C-Terminal Swaps
Individual trials of ppcesa5KO-2B phenotypic rescue by (from left to right): Clade A CESA with Clade B CSR, Clade B CESA with Clade A CSR, Clade A CESA with Clade A CSR and corresponding positive and negative control vectors. Stars indicate a value of zero.
0 10 20 30 40 50 60 70 80 90 100
Percent Lines with Gametophores
Transformed Lines
Trial 1
Trial 2

46
APPENDIX 6: Western Blots
A B
C D
E F

47
Western blots of microsomal protein extracts from ppcesa5KO-2B lines transformed with expression vectors containing various 3XHA-CESA fusions. Blots were probed with an anti-HA antibody and an anti-tubulin antibody. The Novex Sharp Standard (Life Technologies) was used to determine molecular weights. Western blots of vectors containing (A) 3XHAPpCESA5, (B) 3XHAPpCESA5, (C) 3XHAppcesa4CSR5, (D) 3XHAppcesa5CSR4, (E) 3XHAppcesa4/5/5, (F) 3XHAppcesa5/5/4, (G) 3XHAppcesa5/5/4 and (H) 3XHAppcesa5/5/4.
G H

48
BIBLIOGRAPHY
Arioli T (1998) Molecular analysis of cellulose biosynthesis in Arabidopsis. Science 279: 717-720
Atanassov II, Atanassov II, Etchells JP, Turner SR (2009) A simple, flexible and efficient PCR-fusion/Gateway cloning procedure for gene fusion, site-directed mutagenesis, short sequence insertion and domain deletions and swaps. Plant methods 5: 14
Carroll A, Somerville C (2009) Cellulosic biofuels. Annual review of plant biology 60: 165-182
Cove D (2005) The moss Physcomitrella patens. Annual Review of Genetics 39: 339-358
Delmer D (1999) Cellulose biosynthesis: Exciting times for a difficult field of study. Annual Review of Plant Physiology and Plant Molecular Biology 50: 245-276
Desprez T, Juraniec M, Crowell EF, Jouy H, Pochylova Z, Parcy F, Hofte H, Gonneau M, Vernhettes S (2007) Organization of cellulose synthase complexes involved in primary cell wall synthesis in Arabidopsis thaliana. Proceedings of the National Academy of Science U S A 104: 15572-15577
Doblin MS, Kurek I, Jacob-Wilk D, Delmer DP (2002) Cellulose biosynthesis in plants: from genes to rosettes. Plant Cell Physiology 43: 1407-1420
Goss CA, Brockmann DJ, Bushoven JT, Roberts AW (2012) A CELLULOSE SYNTHASE (CESA) gene essential for gametophore morphogenesis in the moss Physcomitrella patens. Planta 235: 1355-1367
Guerriero G, Fugelstad J, Bulone V (2010) What do we really know about cellulose biosynthesis in higher plants? Journal of integrative plant biology 52: 161-175
Ha M-A, Apperley DC, Evans BW, Jardine WG, Vietor RJ, Reis D, Vian B, Jarvis MC (1998) Fine structure in cellulose microfibrils: NMR evidence from onion and quince. The Plant Journal 16: 183-190
Herth W (1983) Arrays of plasma-membrane "rosettes" involved in cellulose microfibril formation of Spirogyra. Planta 159: 347-356
Hutton JL, Knight CD, Millner PA (1998) The Physcomitrella patens GPa1 homologue is located at protonemal cell junctions. Journal of Experimental Botany 49: 1113-1118
Ihara Y, Sakai F, Hayashi T (1997) Cloning of homologs of bcsA gene from developing cotton fiber cells. Wood Research 84: 1-6

49
Kimura S, Laosinchai W, Itoh T, Cui X, Linder CR, Brown J, R. M. (1999) Immunogold labeling of rosette terminal cellulose-synthesizing complexes in the vascular plant Vigna angularis. The Plant Cell 11: 2075-2085
Morgan JL, Strumillo J, Zimmer J (2013) Crystallographic snapshot of cellulose synthesis and membrane translocation. Nature 493: 181-186
Mueller SC, Brown J, R. M. (1980) Evidence for an intramembrane component associated with a cellulose microfibril-synthesizing complex in higher plants. Journal of Cell Biology 84: 315-326
Newman RH, Hill SJ, Harris PJ (2013) Wide-angle x-ray scattering and solid-state nuclear magnetic resonance data combined to test models for cellulose microfibrils in mung bean cell walls. Plant physiology 163: 1558-1567
Pear JR, Kawagoe Y, Schreckengost WE, Delmer DP, Stalker DM (1996) Higher plants contain homologs of the bacterial celA genes encoding the catalytic subunit of cellulose synthase. Proceedings of the National Academy of Sciences U S A 93: 12637-12642
Perroud PF, Quatrano RS (2006) The role of ARPC4 in tip growth and alignment of the polar axis in filaments of Physcomitrella patens. Cell Motility and Cytoskeleton 63: 162-171
Persson S, Paredez A, Carroll A, Palsdottir H, Doblin M, Poindexter P, Khitrov N, Auer M, Somerville CR (2007) Genetic evidence for three unique components in primary cell-wall cellulose synthase complexes in Arabidopsis. Proceedings of the National Academy of Sciences U S A 104: 15566-15571
Rensing SA, Lang D, Zimmer AD, Terry A, Salamov A, Shapiro H, Nishiyama T, Perroud PF, Lindquist EA, Kamisugi Y, Tanahashi T, Sakakibara K, Fujita T, Oishi K, Shin IT, Kuroki Y, Toyoda A, Suzuki Y, Hashimoto S, Yamaguchi K, Sugano S, Kohara Y, Fujiyama A, Anterola A, Aoki S, Ashton N, Barbazuk WB, Barker E, Bennetzen JL, Blankenship R, Cho SH, Dutcher SK, Estelle M, Fawcett JA, Gundlach H, Hanada K, Heyl A, Hicks KA, Hughes J, Lohr M, Mayer K, Melkozernov A, Murata T, Nelson DR, Pils B, Prigge M, Reiss B, Renner T, Rombauts S, Rushton PJ, Sanderfoot A, Schween G, Shiu SH, Stueber K, Theodoulou FL, Tu H, Van de Peer Y, Verrier PJ, Waters E, Wood A, Yang L, Cove D, Cuming AC, Hasebe M, Lucas S, Mishler BD, Reski R, Grigoriev IV, Quatrano RS, Boore JL (2008) The Physcomitrella genome reveals evolutionary insights into the conquest of land by plants. Science 319: 64-69
Roberts AW, Bushoven JT (2007) The cellulose synthase (CESA) gene superfamily of the moss Physcomitrella patens. Plant Molecular Biology 63: 207-219
Roberts AW, Dimos CS, Budziszek MJ, Jr., Goss CA, Lai V (2011) Knocking out the wall: protocols for gene targeting in Physcomitrella patens. Methods in molecular biology 715: 273-290

50
Rohl CA, Strauss CEM, Misura KMS, Baker D (2004) Protein structure prediction using Rosetta. Methods in Enzymology 383: 66-93
Saxena IM, Brown J, R. M., Fevre M, Geremia RA, Henrissat B (1995) Multidomain architecture of B-glycosyl transferases: Implications for mechanism of action. Journal of Bacteriology 177: 1419-1424
Schaefer DG, Zryd JP (1997) Efficient gene targeting in the moss Physcomitrella patens. . The Plant Journal 11: 1195-1206
Sethaphong L, Haigler CH, Kubicki JD, Zimmer J, Bonetta D, DeBolt S, Yingling YG (2013) Tertiary model of a plant cellulose synthase. Proceedings of the National Academy of Sciences U S A 110: 7512-7517
Sokal RR, Rohlf FJ (1981) Biometry. W. H. Freeman and Company, New York
Sturcova A, His I, Apperley DC, Sugiyama J, Jarvis MC (2004) Structural details of crystalline cellulose from higher plants. Biomacromolecules 5: 1333-1339
Taylor NG, Howells RM, Huttly AK, Vickers K, Turner SR (2003) Interactions among three distinct CesA proteins essential for cellulose synthesis. Proceedings of the National Academy of Science U S A 100: 1450-1455
Thomas LH, Forsyth VT, Sturcova A, Kennedy CJ, May RP, Altaner CM, Apperley DC, Wess TJ, Jarvis MC (2013) Structure of cellulose microfibrils in primary cell walls from collenchyma. Plant physiology 161: 465-476
Vergara CE, Carpita NC (2001) β-D-Glycan synthases and the CesA gene family: lessons to be learned from the mixed-linkage (1→3),(1→4) β-D-glucan synthase. Plant Molecular Biology 47: 145-160
Wada M, Heux L, Sugiyama J (2004) Polymorphism of cellulose I family: Reinvestigation of cellulose IV. Biomacromolecules 5: 1385-1391
Wang J, Howles PA, Cork AH, Birch RJ, Williamson RE (2006) Chimeric proteins suggest that the catalytic and/or C-terminal domains give CesA1 and CesA3 access to their specific sites in the cellulose synthase of primary walls. Plant physiology 142: 685-695
Zhong R, Morrison WH, 3rd, Freshour GD, Hahn MG, Ye ZH (2003) Expression of a mutant form of cellulose synthase AtCesA7 causes dominant negative effect on cellulose biosynthesis. Plant physiology 132: 786-795