geophysical investigation of the cedar mountain complex …
TRANSCRIPT
MINNESOTA GEOLOGICAL SURVEY
MATT WALTON, Director
GEOPHYSICAL INVESTIGATION OF
THE CEDAR MOUNTAIN COMPLEX,
REDWOOD COUNTY, MINNESOTA
l5i1
R.J. Beltrame, Val W. Chandler, and Brian L. Gulbranson
Report of Investigations 27 ISSN 0076-9177
UNIVERSITY OF MINNESOTA
Saint Paul - 1982

GEOPHYSICAL INVESTIGATION OF
THE CEDAR MOUNTAIN COMPLEX,
REDWOOD COUNTY, MINNESOTA

CONTENTS
Abstract.
Introduction.
Previous geologic investigations.
Surface geologic configuration. Location of stations • Acquisition and reduction of the magnetic anomaly data • Magnetic anomalies • Topographic lineaments and magnetic interpretation • Discussion •
Geologic configuration at depth • Model studies of magnetic data • Gravity survey methods and procedures. Gravity anomalies. Model study of gravity data Discussion •
Regional geology. Reconnaissance gravity survey Aeromagnetic studies • Paleomagnetic studies
Conclusions •
Acknowledgments •
References cited
ILLUSTRATIONS
Figure 1. Location map •
2. Geologic map of the Franklin area by E.H. Lund.
3. Total magnetic intensity contour map of the Cedar Mountain study area.
4. Total magnetic intensity contour map of the Cedar Mountain study area smoothed by upward continuation and reduced to the pole.
2
2 3 3 5 7 9
• 10 • 10
12 12 12 14
• 14 14
•• 15
• 19
• 19
• 20
20
2
3
4
6
5. Geologic map of the Cedar Mountain study area. 7
6. Topographic contour map of the Cedar Mountain study area. 8
7. Topographic lineaments in the Franklin area. 9
8. Total magnetic intensity model profiles of the Cedar Mountain study area. · 11
9. Simple Bouguer gravity contour map of the Cedar Mountain study area. · 13
iii
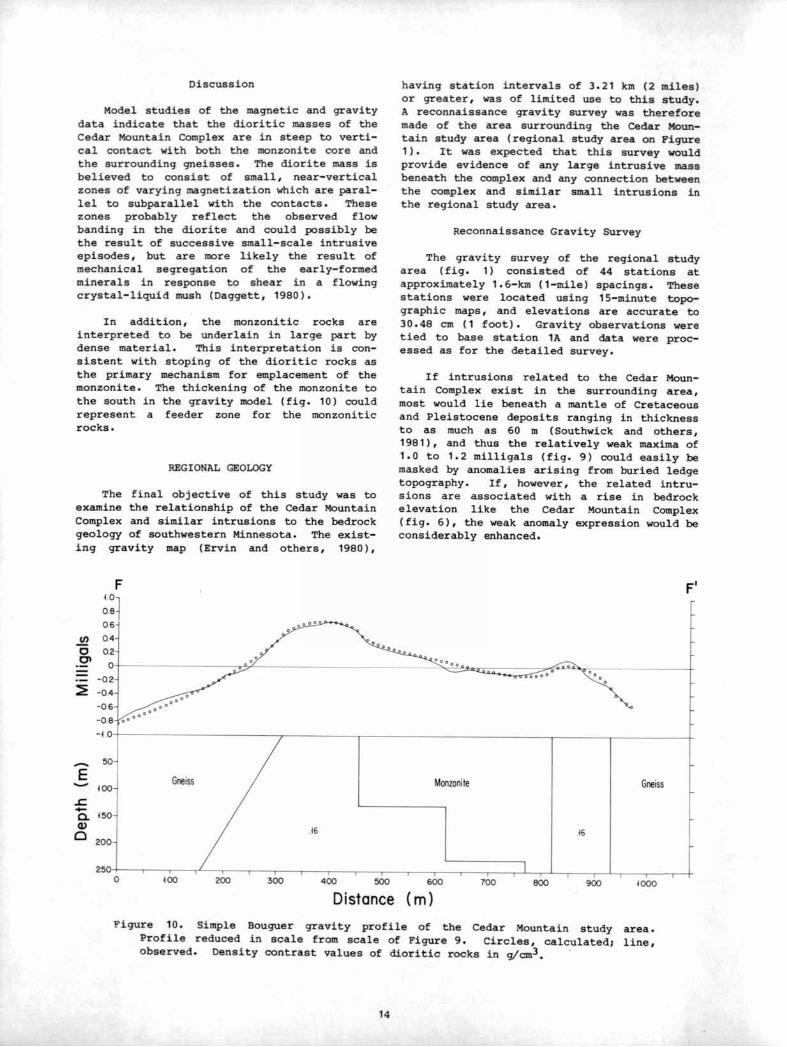
Figure 10. Simple Bouguer gravity profile of the Cedar Mountain study area. • • • • • • • • • • • 14
11. Total magnetic intensity model profile F-F' • 15
12. Simple Bouguer gravity map of the regional study area. 16
13. Total magnetic intensity contour map of the Cedar Mountain study area smoothed by upward continuation • • • 17
14. Upward-continued data of Figure 13 recontoured along 400-m flight lines •••••••••••••••••••• 18
TABLE
Table 1. Magnetic susceptibility and density of Morton Gneiss and Cedar Mountain Complex • • • • • • • • • • • • • 5
The University of Minnesota is committed to the policy that all persons shall have equal access to its programs, facilities, and employment without regard to race, creed, color, sex, national origin, or handicap.
iv
GEOPHYSICAL INVESTIGATION OF THE CEDAR MOUNTAIN COMPLEX,
REDWOOD COUNTY, MINNESOTA
By
R.J. Beltrame, Val W. Chandler, and Brian L. Gulbranson
ABSTRACT
The Cedar Mountain Complex is a roughly circular composite intrusion, 500 to 600 m in diameter, in the Archean gneiss terrane of southwestern Minnesota. Emplaced during early Proterozoic time, the complex consists of a central core of monzonite surrounded by slightly older, compositionally layered diori tic rocks. Existing geophysical and geologic data indicate that the complex may reflect a widespread igneous event that also formed the granite-rhyolite terrane of central Wisconsin. A gravity and magnetic survey was conducted over the Cedar Mountain Complex to (1) delineate the contacts which are nowhere exposed; (2) interpret the configuration of the intrusion at depth; and (3) determine what relationships the complex may have with similar intrusions in the area and determine how they might be detected geophysically.
Magnetic anomaly and rock property data indicate that the dioritic rocks are the principal sources of anomalies and that they are polarized near or along the present earth's field. Magnetic anomaly data indicate an angular and irregular configuration for the diorite-gneiss contact and a somewhat rectangular configuration for the monzonite-diorite contact. Model studies of the magnetic data imply that some contacts may dip steeply outward, but most are nearly vertical. The gravity anomaly data indicate that the core monzonite may be in part underlain by dioritic rocks.
The configuration of the outermost contact and the density constraints indicate forceful injection as the mechanism for emplacement of the dioritic rocks. Similar emplacement is possible for the core monzonite, but the regular configuration of the inner contact, density constraints, and gravity interpretation favor stoping out of large blocks of diorite.
Upward continuation of the magnetic data indicates that gross anomaly attributes of the complex and related intrusions would be detectable by aeromagnetic surveying using a flight-line spacing of 400 m and terrain clearance of 150 m.
INTRODUCTION
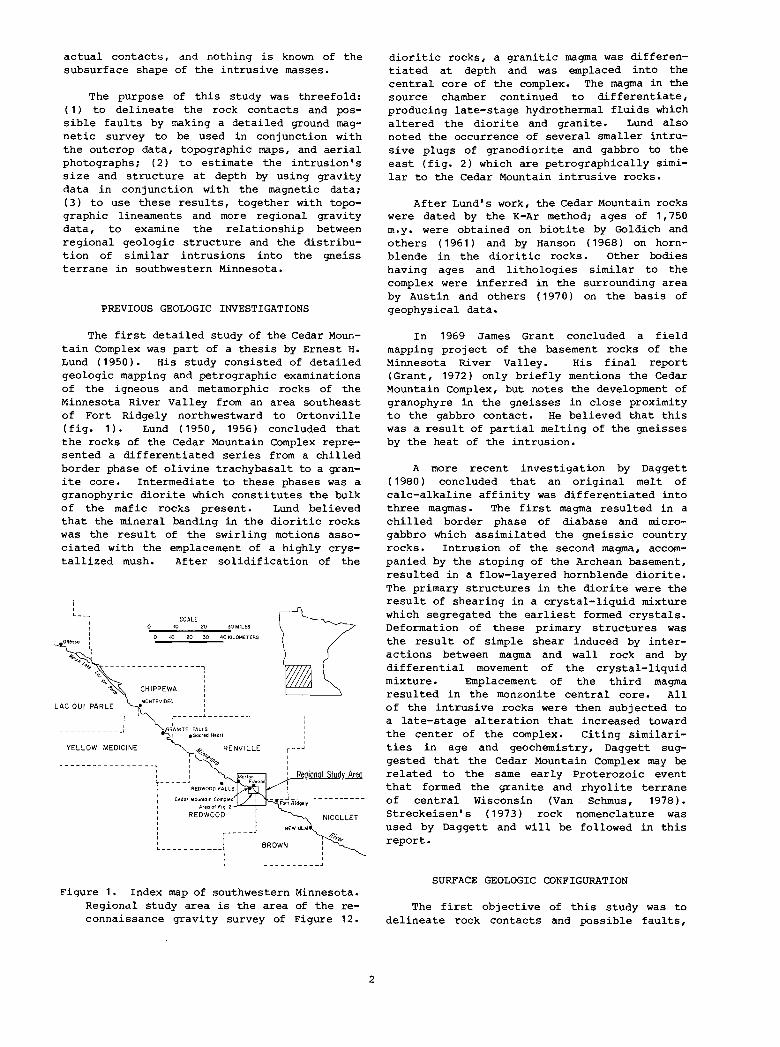
The Cedar Mountain Complex is a lower Proterozoic composite intrusion in the Archean gneiss terrane of southwestern Minnesota (fig. 1 ) • It consists of a central core of monzonite approximately 350 m x 300 m in size, surrounded for the most part by a rim 25 to 175 m wide of older dioritic rocks (fig. 2). A few outcrops of a chilled border phase of diabase to microgabbro are present near the contact of the diorite with the surrounding gneiss. The complex lies along a narrow belt of bedrock exposures in the floor of the Minnesota River Valley. Elsewhere the Precambrian bedrock is mantled by Cretaceous and Pleistocene materials.
Although the outcrop control over the complex (fig. 2) is adequate for regional-scale mapping, the distribution of individual outcrops is not sufficient for detailed interpretation. The contact between the central monzonite and surrounding diorite is not exposed and nowhere are outcrops of these two rock types within 35 m of each other. The contact between the diorite and surrounding gneisses also is not exposed; however, in several places on the southwest, northwest, and north sides of the complex, these two rock types are exposed within a few meters of each other. Thus in spite of relatively good outcrop in the area, little is known in regard to the
actual contacts, and nothing is known of the subsurface shape of the intrusive masses.
The purpose of this study was threefold: ( 1) to delineate the rock contacts and possible faults by making a detailed ground magnetic survey to be used in conjunction with the outcrop data, topographic maps, and aerial photographs; (2) to estimate the intrusion's size and structure at depth by using gravity data in conjunction with the magnetic data; (3) to use these results, together with topographic lineaments and more regional gravity data, to examine the relationship between regional geologic structure and the distribution of similar intrusions into the gneiss terrane in southwestern Minnesota.
PREVIOUS GEOLOGIC INVESTIGATIONS
The first detailed study of the Cedar Mountain Complex was part of a thesis by Ernest H. Lund (1950). His study consisted of detailed geologic mapping and petrographic examinations of the igneous and metamorphic rocks of the Minnesota River Valley from an area southeast of Fort Ridgely northwestward to Ortonville (fig. 1). Lund (1950, 1956) concluded that the rocks of the Cedar Mountain Complex represented a differentiated series from a chilled border phase of olivine trachybasalt to a granite core. Intermediate to these phases was a granophyric diorite which constitutes the bulk of the mafic rocks present. Lund believed that the mineral banding in the dioritic rocks was the result of the swirling motions associated with the emplacement of a highly crystallized mush. After solidification of the
LAC QUI PARLE
r--J
, ____________ J
YELLOW MEDICINE
SCALE m 20 30 MILES
W 20 30 40 KILOMETERS
CHIPPEWA
r-- - __ .1._ ---- - - - -- -------, GRANITE FALLS
.Sacred Heart
RENVILLE r-, , -----------------, : Regional Study Area
, , , '1-----" •
REDWOOD FALLS
, ;-----.1
, , , - ·Fo~Rid;IY- - - -- - -- - --
NICOLLET NEW ULM
~ ___________ ~ BROWN , , L ________________ .l
Figure 1. Index map of southwestern Minnesota. Regional study area is the area of the reconnaissance gravity survey of Figure 12.
2
dioritic rocks, a granitic magma was differentiated at depth and was emplaced into the central core of the complex. The magma in the source chamber continued to differentiate, producing late-stage hydrothermal fluids which al tered the diorite and granite. Lund also noted the occurrence of several smaller intrusive plugs of granodiorite and gabbro to the east (fig. 2) which are petrographically similar to the Cedar Mountain intrusive rocks.
After Lund's work, the Cedar Mountain rocks were dated by the K-Ar method; ages of 1,750 m.y. were obtained on biotite by Goldich and others (1961) and by Hanson (1968) on hornblende in the diori tic rocks. Other bodies having ages and lithologies similar to the complex were inferred in the surrounding area by Austin and others (1970 ) on the basis of geophysical data.
In 1969 James Grant concluded a field mapping project of the basement rocks of the Minnesota River Valley. His final report (Grant, 1972) only briefly mentions the Cedar Mountain Complex, but notes the development of granophyre in the gneisses in close proximity to the gabbro contact. He believed that this was a result of partial melting of the gneisses by the heat of the intrusion.
A more recent investigation by Daggett (1980) concluded that an original melt of calc-alkaline affinity was differentiated into three magmas. The first magma resulted in a chilled border phase of diabase and microgabbro which assimilated the gneissic country rocks. Intrusion of the second magma, accompanied by the stoping of the Archean basement, resulted in a flow-layered hornblende diorite. The primary structures in the diorite were the result of shearing in a crystal-liquid mixture which segregated the earliest formed crystals. Deformation of these primary structures was the result of simple shear induced by interactions between magma and wall rock and by differential movement of the crystal-liquid mixture. Emplacement of the third magma resulted in the monzonite central core. All of the intrusive rocks were then subjected to a late-stage alteration that increased toward the center of the complex. Citing similarities in age and geochemistry, Daggett suggested that the Cedar Mountain Complex may be related to the same early Proterozoic event that formed the granite and rhyolite terrane of central Wisconsin (Van Schmus, 1978). Streckeisen's (1973) rock nomenclature was used by Daggett and will be followed in this report.
SURFACE GEOLOGIC CONFIGURATION
The first objective of this study was to delineate rock contacts and possible faults,

producing a more detailed bedrock geologic map. Magnetic susceptibilities (table 1), measured on chip samples using a Bison model 3101A susceptibility bridge, indicated that the dioritic rocks should have a significant anomaly signature, and therefore that both the inner and outer contacts of the complex should be traceable by a ground magnetic survey.
Location of Stations
A network of stations for use in both the gravity and magnetic surveys was established using a plane table and Gurley model 580-F alidade. This network was tied to county road intersections immediately west and south of the complex, which were given on the Morgan and Morton 15-minute topographic sheets to a vertical accuracy of 0.31 m. A 1:10,000-scale aerial photograph was used as an underlay to the plane-tabled map. Leveling and surveying were hampered by dense underbrush which covers much of the complex, and so the network was limited to 184 plane-table stations. These stations allowed reconnaissance gravity coverage and provided an accurate locational net-
I
work to which more extensive magnetic surveying was tied by the pace and compass method. Subsequently 1,168 magnetic stations were established along 150 profiles in the Cedar Mountain study area (fig. 3). Survey closures indicated that the plane-tabled stations are accurate to within 2 m horizontally and 7 em v ertically, and pace and compass stations to 4 m horizontally.
Acquisition and Reduction of the Magnetic Anomaly Data
Total magnetic field intensity measurements were conducted using a geoMetrics model G-826 proton precession magnetometer (precision of 1 gamma) in the backpack mode ( 1 gamma = 1nT). Base station 28 (fig. 3) was designated as the primary base station for the magnetic survey because of its central location and because preliminary measurements in the vicinity showed it to be associated with low magnetic gradients. Sixty magnetic measurements at the base station over a 3-day period averaged 58,881 gammas. All subsequent field measurements were adjusted to this common base.
1/ '1'
--- --- --~-~--- ---- ----- --EXPLANATION
------+ ~l EB + I ott 9 : \ (-<Xn
,-------'--------, : ~ Cedar Mountain Complex
I ~ ~~ : =~t~nlle Cedar Mountain Related Rocks I
Qd - granodiorite
23
J<Xn I --+ -------------9
Q
/' '1'0---
I
/ '1'
9 - Qabbro I '" I W c=:o
I :l~minoo~~t~~~~lhiC ~ gneiss (9"1 with rafts of
amphibolite (om)
A~ of cont inuous or nearly continuous outer",
ConlOCI, dashed whert inferred
':....~~~~~500 METERS
\y; 0 1000 2000 FEET
--~~------ -------------
'1' 1
~ I '1',
-- ------+---------------------- ____ -L _____________ - -_ ~:~~~. _ -I ~ I
I L-~------____________ ~ ______________________ ~~ ______________________________ ~~L_ ____ _L __________________________ ~~,M~·
Figure 2. Geologic map of the Franklin area (T. 112 N., R. 33 and 34 W.) by E.H. Lund. See text for description of mappe d units. Box delineates Cedar Mountain study area.
3
The base station was also used to check for diurnal variation and for magnetic storms. When slight diurnal variations occurred ( <20 gammas over 1 to 2 hours) the data were adjusted accordingly; however, when magnetic storms were active (>10 gammas over a 10-minute period) no measurements were recorded. At least three r eadings were taken at each location. Multiple readings at most individ-
I \ '. : \ " ~ , .. ' ~
, , , , , ,
"
ual stations varied by only 1 to 2 gammas. Where fluctuations were more than 100 gammas in a few high-gradient areas, all the data were excluded.
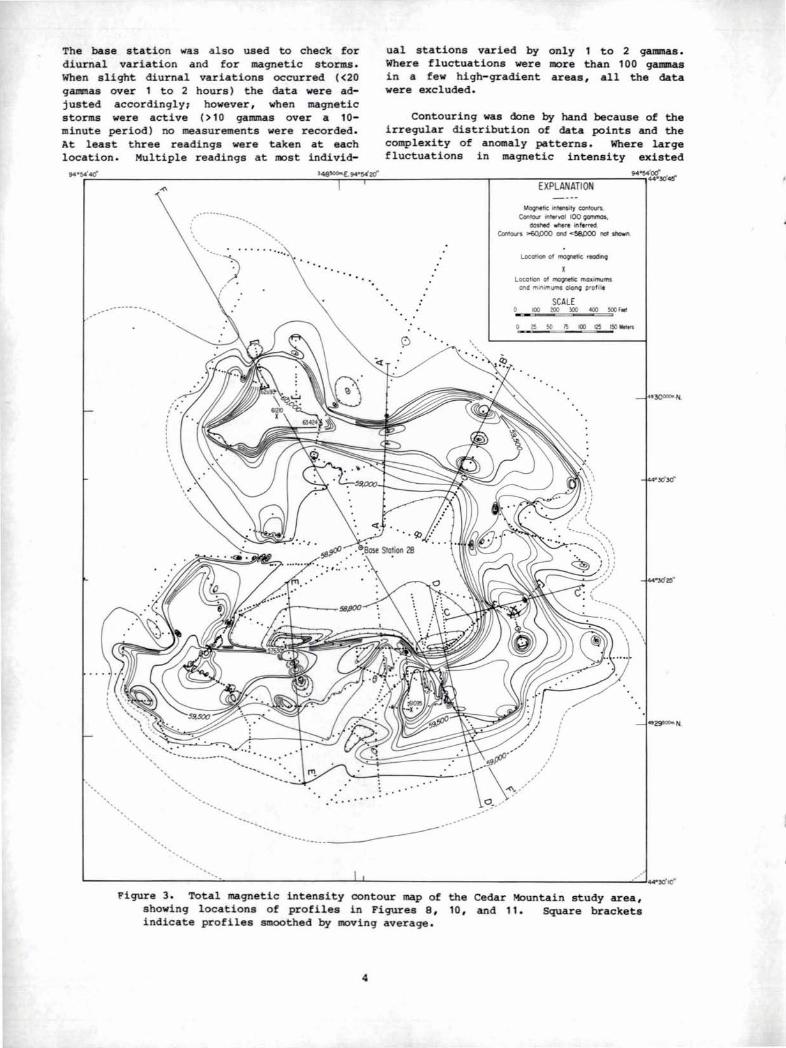
Contouring was done by hand because of the irregular distribution of data points and the complexity of anomaly patterns. Where large fluctuations in magnetic intensity existed
EXPLANATION
Magnetic intensity contours. ConIOU'" interval 100 Ocmnos,
dashed where inferred. Co'ttcus :oo6CI.DOO and <58POO not shown.
Location of tI'IOQI"letic moxilT'lJms and minimums olOnQ profile
SCALE 100 200 JOO 400 JOO ''''
I
~~~~~~~) : : , ,
94"54:'f.3Cf4O"
", <~':', ::' ,',-----~-'-'-.-:' ~~:::::::::...--__:.-;-. 5 9p:P-"-' "
. ---- -' \ /"
....... " ........
' .. . . ' . .. ' .
-------- --- -- -------------
-(\:,/
0 ;-,.'
~ ______________________ ~ ____________________ ~_L ____________________________________________ ~~~~.~.
Figure 3. Total magnetic intensity contour map of showing locations of profiles in Figures 8, indicate profiles smoothed by moving average.
4
the Cedar Mountain study area, 10, and 11. Square brackets
between measured locations along seven of the profiles, the data were smoothed by averaging the nearest surrounding 3 to 5 data points according to the simple running average method of Breiner (1973). Contour lines, at 100-gamma intervals, were suppressed in high-gradient areas and were omitted in areas where intensities were greater than 60,000 gammas or less than 58,000 gammas.
All field station locations were digitized. The magnetic data and corresponding geographic coordinates are available in the files of the Minnesota Geological Survey.
Magnetic Anomalies
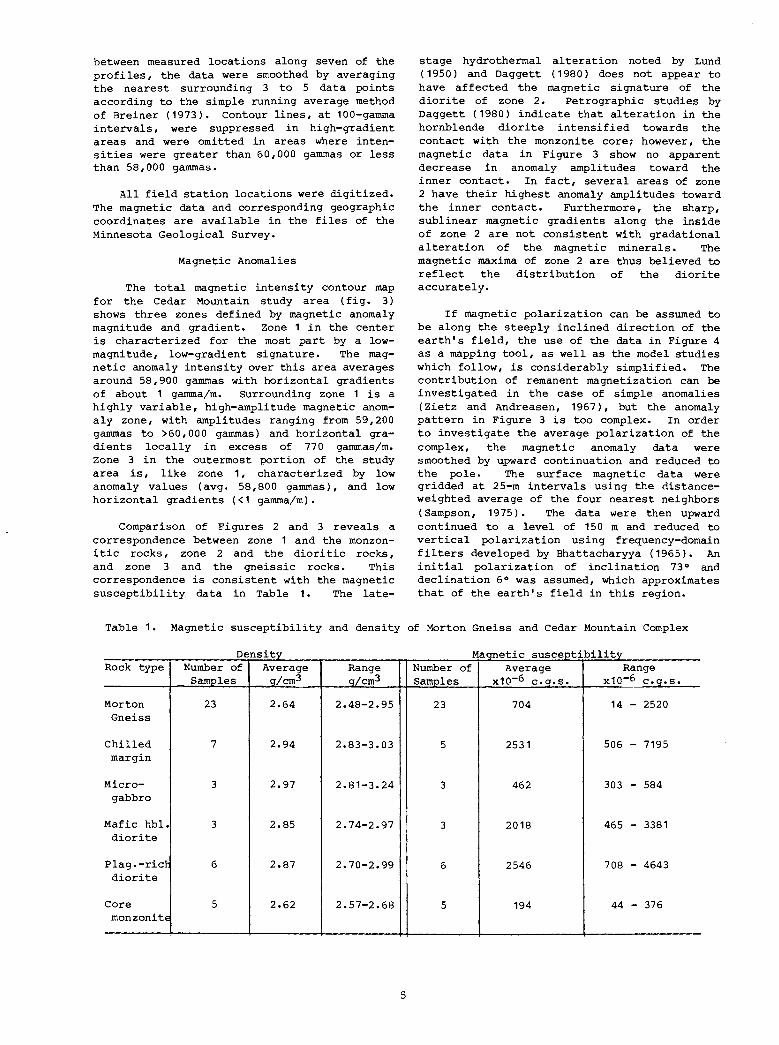
The total magnetic intensity contour map for the Cedar Mountain study area (fig. 3) shows three zones defined by magnetic anomaly magnitude and gradient. Zone 1 in the center is characterized for the most part by a lowmagnitude, low-gradient signature. The magnetic anomaly intensity over this area averages around 58,900 gammas with horizontal gradients of about 1 gamma/m. Surrounding zone 1 is a highly variable, high-amplitude magnetic anomaly zone, with amplitudes ranging from 59,200 gammas to >60,000 gammas) and horizontal gradients locally in excess of 770 gammas/m. Zone 3 in the outermost portion of the study area is, like zone 1, characterized by low anomaly values (avg. 58,800 gammas), and low horizontal gradients «1 gamma/m).
Comparison of Figures 2 and 3 reveals a correspondence between zone 1 and the monzoni tic rocks, zone 2 and the diori tic rocks, and zone 3 and the gneissic rocks. This correspondence is consistent with the magnetic susceptibility. data in Table 1. The late-
stage hydrothermal al teration noted by Lund (1950) and Daggett (1980) does not appear to have affected the magnetic signature of the diori te of zone 2. Petrographic studies by Daggett (1980) indicate that alteration in the hornblende diorite intensified towards the contact with the monzonite core; however, the magnetic data in Figure 3 show no apparent decrease in anomaly amplitudes toward the inner contact. In fact, several areas of zone 2 have their highest anomaly amplitudes toward the inner contact. Furthermore, the sharp, sublinear magnetic gradients along the inside of zone 2 are not consistent with gradational alteration of the magnetic minerals. The magnetic maxima of zone 2 are thus believed to reflect the distribution of the diorite accurately.
If magnetic polarization can be assumed to be along the steeply inclined direction of the earth's field, the use of the data in Figure 4 as a mapping tool, as well as the model studies which follow, is considerably simplified. The contribution of remanent magnetization can be investigated in the case of simple anomalies (Zietz and Andreasen, 1967), but the anomaly pattern in Figure 3 is too complex. In order to investigate the average polarization of the complex, the magnetic anomaly data were smoothed by upward continuation and reduced to the pole. The surface magnetic data were gridded at 25-m intervals using the distanceweighted average of the four nearest neighbors (Sampson, 1975). The data were then upward continued to a level of 150 m and reduced to vertical polarization using frequency-domain filters developed by Bhattacharyya (1965). An initial polarization of inclination 73° and declination 6° was assumed, which approximates that of the earth's field in this region.
Table 1. Magnetic susceptibility and density of Morton Gneiss and Cedar Mountain Complex
D 't ens~ ~v 'b'l' Magnet~c susce~t~ ~ ~tv
Rock type Number of Average Range Number of Average Range Samples g/cm3 q/cm3 Samples x10-6 c.q.s. x10-6 c.q.s.
Morton 23 2.64 2.48-2.95 23 704 14 - 2520 Gneiss
Chilled 7 2.94 2.83-3.03 5 2531 506 - 7195 margin
Micro- 3 2.97 2.81-3.24 3 462 303 - 584 gabbro
Mafic hbl. 3 2.85 2.74-2.97 3 2018 465 - 3381 diorite
Plag.-ricl: 6 2.87 2.70-2.99 6 2546 708 - 4643 diorite
Core 5 2.62 2.57-2.68 5 194 44 - 376 monzonite
5
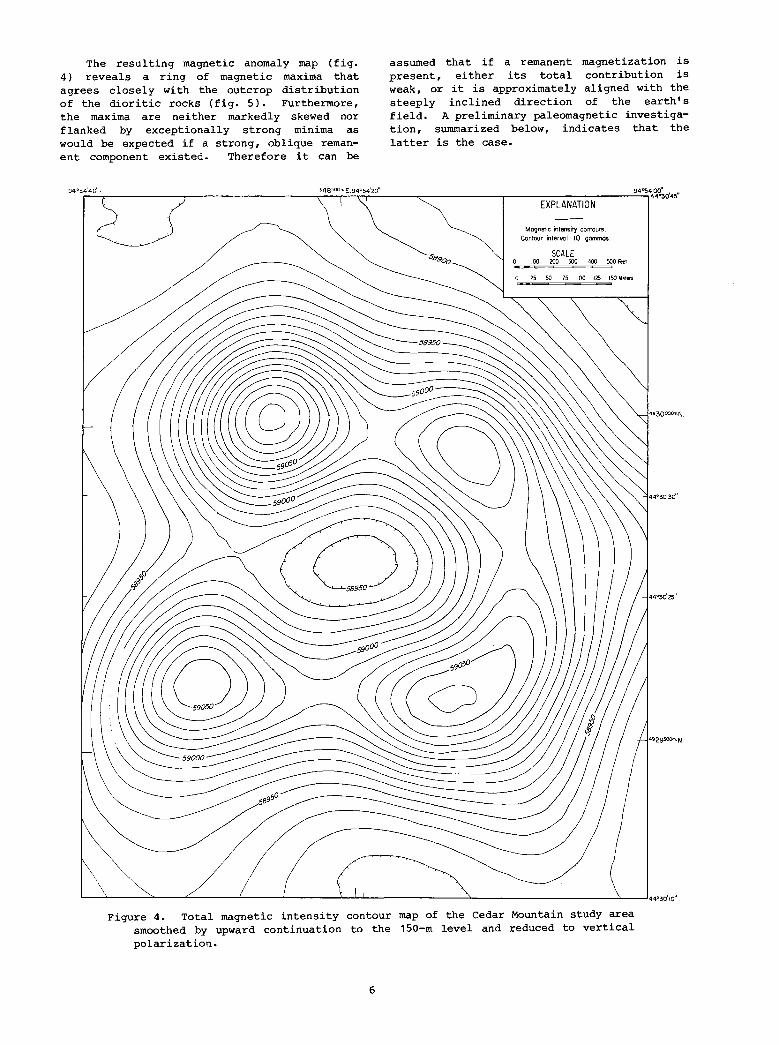
The resulting magnetic anomaly map (fig. 4) reveals a ring of magnetic maxima that agrees closely with the outcrop distribution of the dioritic rocks (fig. 5). Furthermore, the maxima are neither markedly skewed nor flanked by exceptionally strong m~n~ma as would be expected if a strong, oblique remanent component existed. Therefore it can be
59000
assumed that if a remanent magnetization is present, either its total contribution is weak, or it is approximately aligned with the steeply inclined direction of the earth's field. A preliminary paleomagnetic investigation, summarized below, indicates that the latter is the case.
EXPLANATION
Magnetic intensity contours. Contour interval 10 gammas.
SCALE 100 roo 300 400 500 Feet
25 50 75 100 125 150 Meiers
o
/ / L---'--------''''---L....-----1.-----L------'----l-L------__ ....::,. ____________ --..::._-..l44°30'10"
Figure 4. Total magnetic intensity contour map of the Cedar Mountain study area smoothed by upward continuation to the 150-m level and reduced to vertical polarization.
6
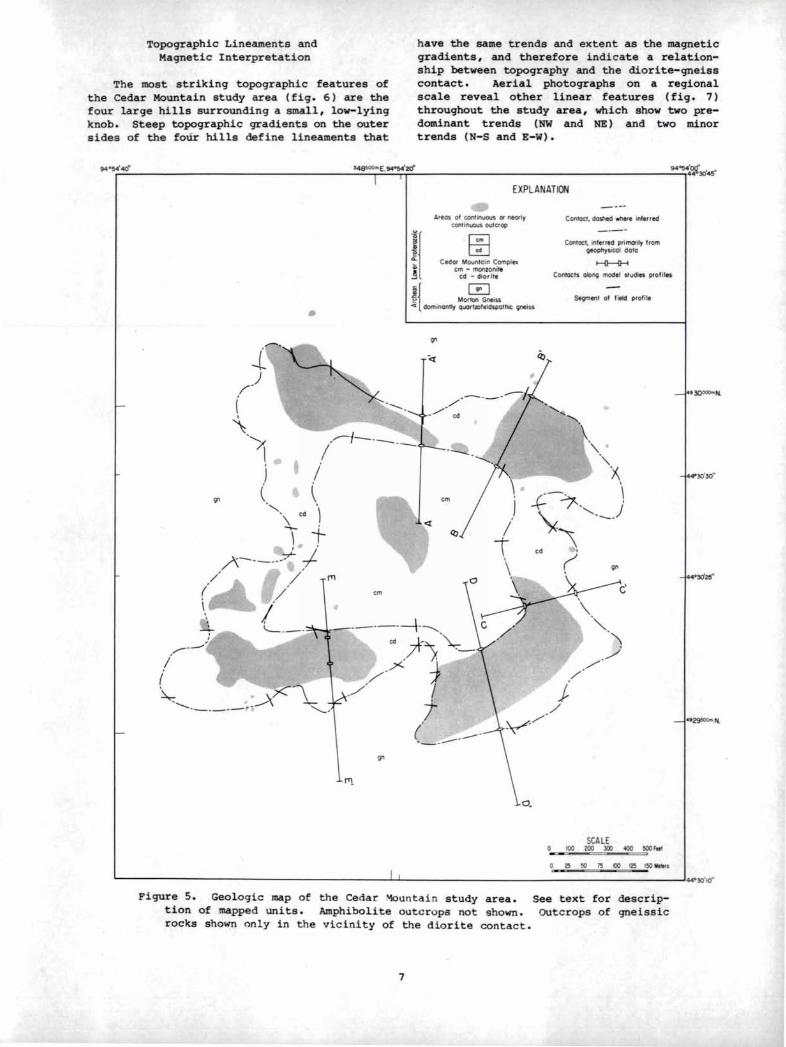
Topographic Lineaments and Magneti c Interpretati on
The most striking topographic features of the Cedar Mountain study area (fig. 6 ) are the four large hills surrounding a small, low-lying knob. Steep topographic gradients on the outer sides of the foUr hills def ine lineaments that
,r--
-L ,/) (
'\ ''x
1 , ) (
•
'" cd \ ,
, 1-/\------~ I '
/ / ( , , /
~ L __ -.,.....- - ---~
/ I ~ ;><:"",
,- -- ---- --_\ - '-....,
have the same trends and extent as the magnetic gradients, and therefore indicate a relationship between topography and the diorite-gneiss contact. Aerial photographs on a regional scale reveal other linear features (fig. 7 ) throughout the study area, which show two predominant trends (NW and NE) and two minor trends (N-S and E-W).
EXPLANATION
11
Areas of cont inuous or nearly cont inuous outcrop
Cedar Mountain Complex em - monzonite
cd - diorite
2{ 0 ~ Morlon Gneiss C( dominantly quortzofeldspolhic oneiss
Contoct. dashed where inferred
Contoct, inferred primarily from Qeophysicol dOlO
~
Contacts eking model studies Pfof iles
SeQrnent of field profile
•
''\',\
X. ----- \ +- -'7--, )' ~ ,-----
\ cd (
SCALE 100 200 300 400 SOOfM'
L--------------------____ l...l ________________________ ....J ••• 30"0·
Figure 5. Geologic map of the Cedar Mo un ta in study area. tion of mapped units. Amphibolite outc r ops not shown. rocks shown on l y in the vicinity of the diorite contact.
7
See text for descripoutcrops o f gneissic
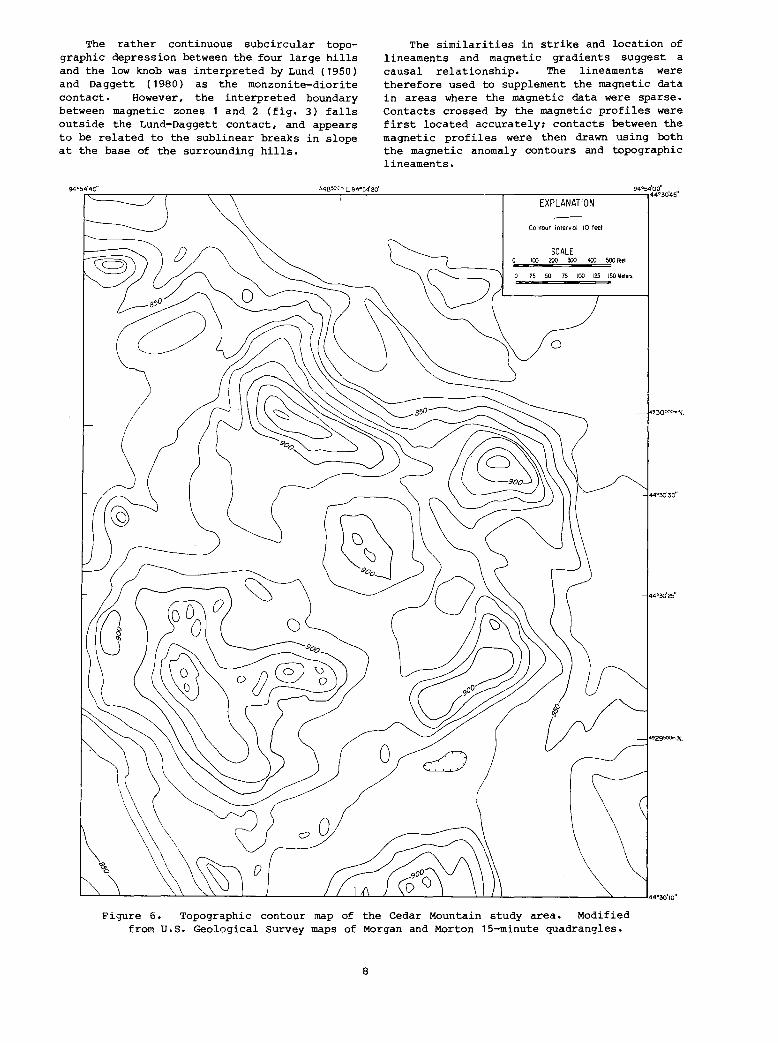
The rather continuous subcircular topographic depression between the four large hills and the low knob was interpreted by Lund (1950) and Daggett (1980) as the monzonite-diorite contact. However, the interpreted boundary between magnetic zones 1 and 2 (fig. 3) falls outside the Lund-Daggett contact, and appears to be related to the sublinear breaks in slope at the base of the surrounding hills.
The similarities in strike and location of lineaments and magnetic gradients suggest a causal relationship. The lineaments were therefore used to supplement the magnetic data in areas where the magnetic data were sparse. contacts crossed by the magnetic profiles were first located accurately; contacts between the magnetic profiles were then drawn using both the magnetic anomaly contours and topographic lineaments.
EXPLANATION
Contour interval 10 feet
SCALE 100 200 300 <00 500 FOe'
25 50 75 100 125 150 Meters
o
4930000mN.
Figure 6. Topographic contour map of the Cedar Mountain study area. Modified from u.s. Geological Survey maps of Morgan and Morton 15-minute quadrangles.
8
Discussion
The geologic map of the Cedar Mountain Complex (fig. 5) differs substantially from maps by previous investigators. The irregularity of the outermost contact was not fully realized in previous studies. The width of the dioritic rocks appears to range from 25 to 175 m, primarily due to angular impingements of gneissic rocks. In addition, the core monzonite appears to be more extensive and more angular in outline than previously thought. The subcircular topographic depression previously interpreted as the monzonitediorite contact is more likely an expression of some internal feature within the monzonite, perhaps jointing or exfoliation. Topographic lineaments over the monzonite body (fig. 7 ) might be related to post-intrusive structures.
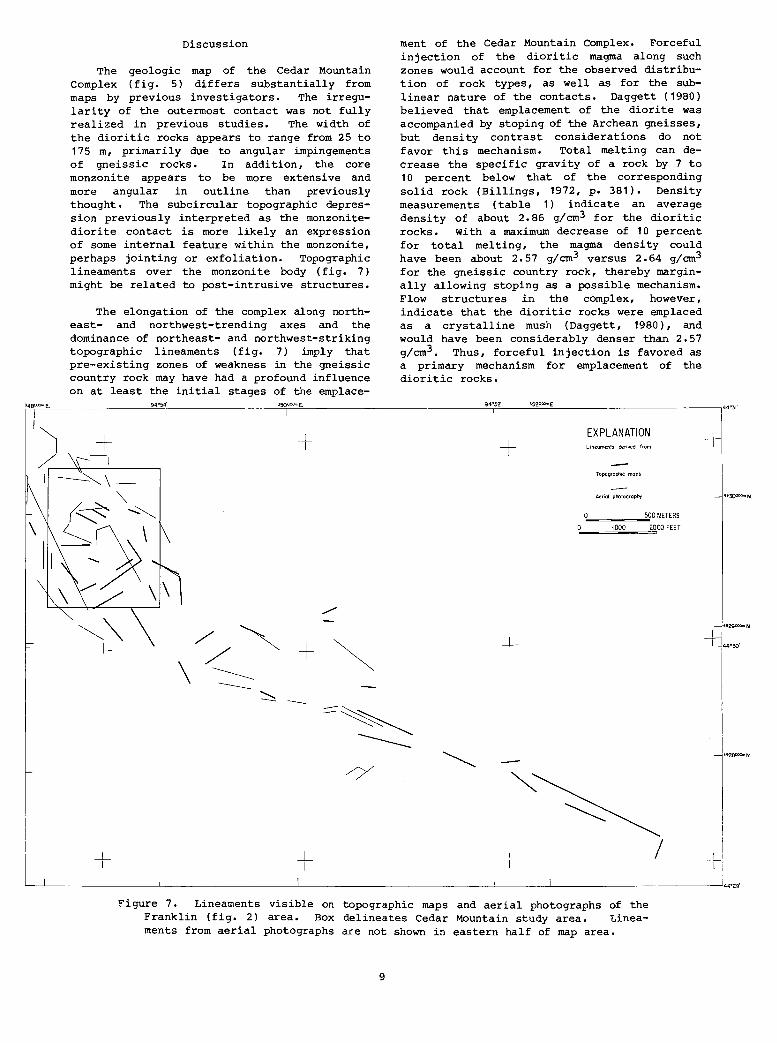
The elongation of the complex along northeast- and northwest-trending axes and the dominance of northeast- and northwest-striking topographic lineaments (fig. 7) imply that pre-existing zones of weakness in the gneissic country rock may have had a profound influence on at least the initial stages of the emplace-
ment of the Cedar Mountain Complex. Forceful injection of the dioritic magma along such zones would account for the observed distribution of rock types, as well as for the sublinear nature of the contacts. Daggett (1980) believed that emplacement of the diorite was accompanied by stoping of the Archean gneisses, but density contrast considerations do not favor this mechanism. Total melting can decrease the specific gravity of a rock by 7 to 10 percent below that of the corresponding solid rock (Billings, 1972, p. 381). Density measurements (table 1) indicate an average densi ty of about 2. 86 g/ cm3 for the diori tic rocks. With a maximum decrease of 10 percent for total melting, the magma density could have been about 2. 57 g/ cm3 versus 2.64 g/ cm3 for the gneissic country rock, thereby marginally allowing stoping as a possible mechanism. Flow structures in the complex, however, indicate that the dioritic rocks were emplaced as a crystalline mush (Daggett, 1980), and would have been considerably denser than 2.57 g/cm3 • Thus, forceful injection is favored as a primary mechanism for emplacement of the dioritic rocks.
r;:""",~ _______ --,9",-'Or54,-' ________ -----"""50r-:-=-', ______________ -----'9c:.oF5Z=--_---='5=r2'_""-=o''--' ____________ ----,440 31'
/~
\Z ---- ~
+
+
+
~ I
.,./
~
::::~ ~
ij ~
EXPLANATION
+ Lineaments derived from
Topographic mops
:.....~_=~500 METERS lOOO 2000 FEET
-:- /
+
I T
49~N.
, L--'-_________ "--__________ ---'--_______________ --'-____ -"---__________ ------'1.4°29'
Figure 7. Lineaments visible on topographic maps and aerial photographs of the Franklin (fig. 2) area. Box delineates Cedar Mountain study area. Lineaments from aerial photographs are not shown in eastern half of map area.
9
The scattered occurrence of granitic dikes in the dioritic rocks (Daggett, 1980) would seem to imply forceful injection of the core monzonite. However, the greater regularity of the innermost contact (fig. 5) indicates that if dioritic rocks originally occupied the core, they were possibly removed in large masses. Furthermore the low density of the monzonite relative to the dioritic rocks (table 1) would certainly allow stoping as a mechanism. This problem is further discussed in the interpretation of the gravity data.
GEOLOGIC CONFIGURATION AT DEPTH
The second objective of this investigation was to estimate the physical attributes of the intrusion at depth in order to investigate further the mechanism of emplacement. This involved model studies of the magnetic data and interpretation of gravity data.
Model Studies of Magnetic Data
Five profiles approximately perpendicular to the rock contacts and either aligned with actual field profiles or intersecting areas of high station density were selected. Magnetic intensities at 10-m intervals were interpolated from the contoured map (fig. 3) along each profile. In all models two-dimensional, strike-infinite sources were assumed. Induced magnetization was also assumed, using an earth's field of 59,000 gammas at an inclination of 73° and declination of 6° (Peddie and others, 1976). All models were constrained by existing geologic data at the surface and by measured magnetic susceptibilities (table 1). The extremely low magnetic expressions of both the gneissic country rock and the core monzonite were ignored in the modeling.
To expedite interpretation, flat topography was assumed for the model studies. Approximating terrain with triangular bodies revealed that the ridges associated with the diori tes enhanced the overall anomaly expression by a maximum of about 20 percent at the base of the northern slope (negative anomaly) and near the peak (positive anomaly) (C.G. Chase, written commun.). Thus, the magnetic susceptibilities near these areas derived using a model with flat topography may be exaggerated, but this minor effect of the terrain should not appreciably affect the generalized structural interpretations that follow. All bodies in the models were extended to a depth of 1,000 m.
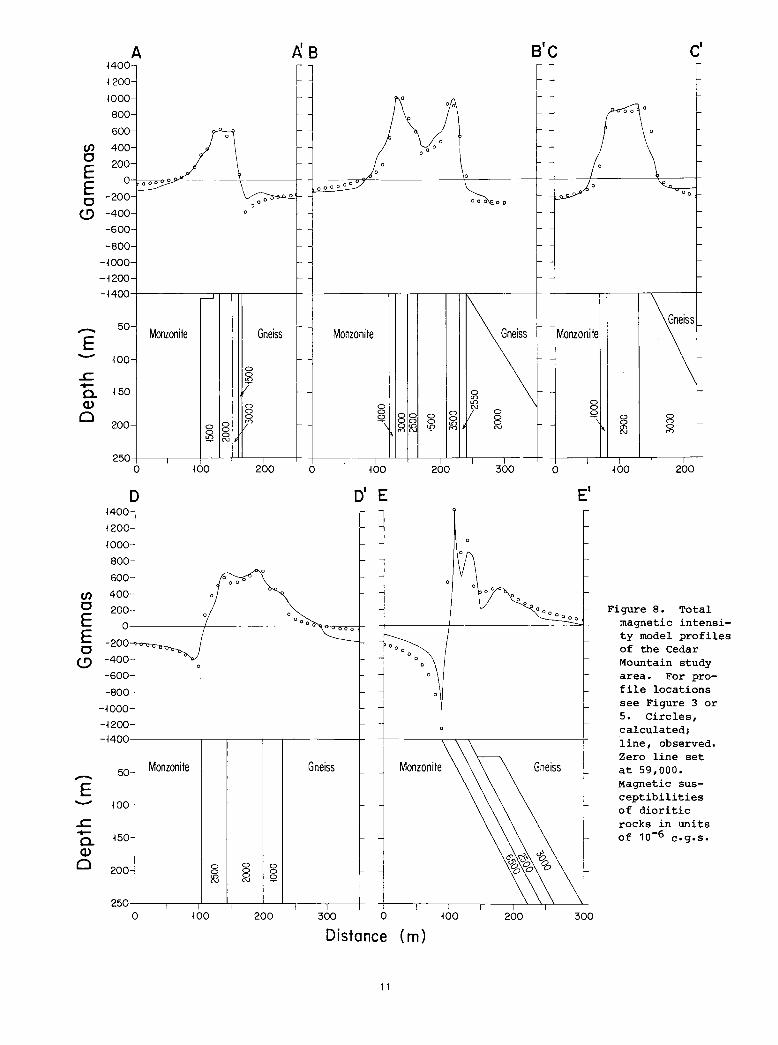
Profile A-A' crosses the northern part of the complex (fig. 5) where the dioritic rocks may be relatively narrow. The model that approximates the observed data (fig. 8) assumes vertical contacts and several parallel zones of varying magnetic susceptibility. These are
10
probably related to the near-vertical flow banding reported by Lund (1950, 1956) and Daggett (1980) in the dioritic rocks. All susceptibilities used in the model are within the range of observed susceptibilities (table 1).
Profile B-B' crosses the northeastern contacts of the complex and a model yielding a reasonable fit is shown in Figure 8. Once again vertical bands of varying susceptibilities were assumed, all of which were within the range in Table 1. The best fit assumes a vertical inner contact and a steep northeastdipping outer contact.
A reasonable match for profile C-C' along the eastern contacts (fig. 8), includes a vertical-banded configuration with a range of susceptibilities (table 1) similar to the previous models. The outer contact was assumed to dip outwards, and the inner contact was interpreted to be vertical.
The observed data control along Profile D-D' was not as tight as for the previous profiles (fig. 3) and thus only a general fit was attempted (fig. 8). In this model a banded configuration was again assumed, with the highest susceptibility value (2500x10-6 c.g.s.) occurring along the monzonite contact. Vertical inner and outer contacts were assumed.
Profile E-E' along the southern contacts was the most difficult to model, in that the observed anomaly displayed a marked skewness and an unusually large m~n~mum along its northern margin (fig. 3). A fit was obtained, however, by dipping both the monzonite and gneiss contacts steeply outward (fig. 8). The rather high susceptibility (6500x10-6 c. g.s.) of the innermost contact of the dioritic rocks is slightly out of the range of the observed susceptibili ties (table 1), however, but no samples were taken over this area. Unlike the previous models, there is some disparity between the contacts derived by the model and those derived from outcrop data (fig. 5). The disparity on the inner contact is small and could be accounted for by some minor contact irregularity between the model profile and the actual position of field profiles (fig. 5). However, the disparity on the outer contact is significantly large. Field checking revealed that the position of the outer contact according to the model approximately coincided with a marked decrease in both outcrop control and elevation to the south (fig. 6), implying a significant change from the rock properties that typify the dioritic rocks. A possible explanation would be that the area in question is not entirely underlain by dioritic rocks, but may actually be a mixed zone which includes some gneissic country rocks. The near-surface mass of dioritic rock implied beneath this zone in the model (fig. 8) would be consistent with such an interpretation.
A A:B SIC C' ~400
~ ] ~ 1 f
~ 200
WOO
~j 00
800
1 600
en 400 C 200 E E
0 000 000000
C -200 000 0 [ <..9 -400
[ -600
-800
-woo -~2oo
-~4oo
50 Gneiss - Monzonite Gneiss Monzonite Gneiss IMonzonite E
"-" wo 0 .r::. 0 - !a
0. 150 0
"' 0) 0 ID 0 N 0
0 0 00 0 0 0 S:> 8 S:> 0 0 0
200 0 00 0 ID 0 0
0 OlD !a r<) N a> ~ 0 0 r<) N N 0 !£2 N
250 0 wo 200 0 wo 200 300 0 1O0 200
D D' E E' ~400
1200
woo 800
600 0 o 00
en 400 0 0
C 200 00 Figure 8. Total E 000000
0 000 magnetic intensi-
E 000
-200 ty model profiles
C 000 0
of the Cedar <..9 -400 0 Mountain study 0
-600 area. For pro--800 file locations
-WOO see Figure 3 or 5. Circles,
-1200 calculated; -1400 line, observed.
Zero line set 50 Monzonite Gneiss Monzonite at 59,000. - Magnetic sus-E
"-" WO ceptibilities of dioritic
.r::. rocks in units - 150 of 10-6 c.g.s. 0. 0)
0 200 0 0 0
~ 0 8 0 ID S:> N N
250 0 WO 200 300 0 WO 200 300
Distance (m)
11
The model studies indicate that the contacts of the diori tic rocks with the country rock are either vertical or dip steeply outwards. Most of the monzonite-diorite contacts appear to be near vertical, but a steep outward dip is implied along the southwest margin. Thus the overall dimensions of the complex do not appear to diminish with depth, but may actually increase. Model studies also indicate that parallel zones of varying magnetic susceptibilities exist which are probably the consequence of the near-vertical flow banding observed in the diorite. These interpretations were examined in light of the gravity data.
Gravity Survey Methods and Procedures
The gravity survey consisted of observations at 167 of the stations located by plane table and alidade. Of these, 83 stations are within the Cedar Mountain study area, and the remainder are in the immediate surrounding area. A Lacoste and Romberg model G-320 gravity meter was used.
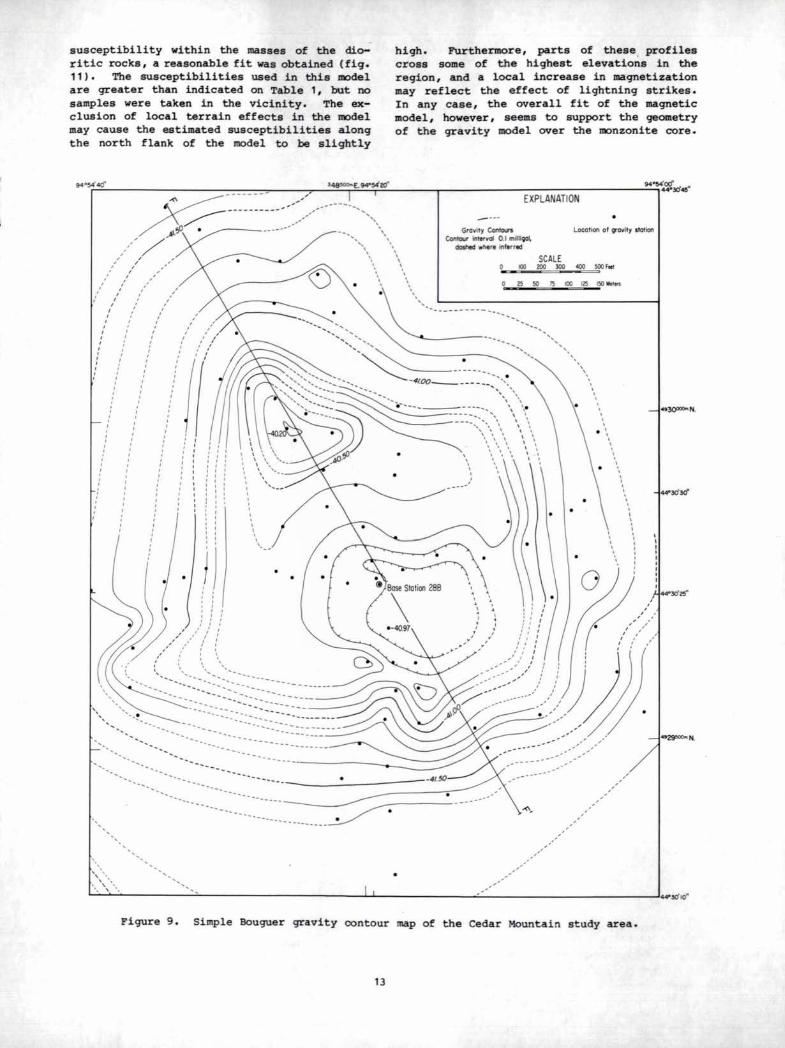
A primary base station (1A in fig. 12) was established for all measurements in the study area and was tied, by a single loop, to base station 31 (Granite Falls) of the state gravity network. Next, a secondary base station (28B in fig. 9) was tied by mUltiple loops to station 1A. Instrument drift was corrected by checks taken at intervals of 1 to 2 hours, and all data were reduced according to the 1930 International Gravity Formula using a Bouguer density of 2.67 g/em3 • The 1930 formula was used rather than the updated 1967 formula so that the Cedar Mountain Complex data would be consistent with the Minnesota network, which is based on the older formula.
Use of the Bouguer density of 2.67 causes a slight positive bias at stations on hills composed of diorite, which has an average densi ty of around 2.85 g/ em3 • However, checks using a Bouguer slab approximation revealed that the maximum effect--for the stations over the northwestern hill of diorite (figs. 6 and 9) --amounted to less than 0.25 milligal, and therefore the bias was assumed to be negligible over most of the diorite.
In order to investigate the effect of the local terrain on the gravity determinations, topographic corrections were calculated at 47 stations in the study area. Hammer's (1939) zone charts were used and most corrections were calculated over the northwestern part of the complex where the greatest topographic variations occur. Corrections for Hammer's zones B through D were estimated in the field; adjustments for zones E through J were based on 15-minute topographic maps. Most of the adjustments were less than O. 1 milligal and it was assumed that corrections on the remain-
12
der of the data would not be necessary. The data obtained by the gravity survey are available in the files of the Minnesota Geological Survey. Density measurements (table 1) on representative chip samples were determined using a Jolly balance (table 1).
Gravity Anomalies
The calculated simple Bouguer gravity data for the Cedar Mountain Study area were contoured by hand (fig. 9) because of the reconnaissance nature of the data. In spite of very poor control in some areas, some general inferences are possible. The overall expression of the complex is positive. Where control is adequate, the dioritic rocks are associated with anomaly values that are 1.0 to 1.5 milligals above general background. Although the core monzonite is associated with a localized minimum, its expression is still 0.5 milligal above general background, implying that the core monzonite may be only a thin body resting on denser rocks. The location of the axis of the small minimum over the monzonite along the southern edge of these rocks indicates that the monzonite is thickest towards the south.
Model Study of Gravity Data
For the gravity model, like the magnetic model, strike-infinite, two-dimensional sources were assumed. The density contrasts used for the various bodies were based on density determinations in Table 1, and the boundaries of the bodies were constrained by the outcrop data. Because of the sparse gravity control, only one profile (fig. 9, F-F') was selected for study. The position of the profile was selected to fall near the highest density of observed stations over the core monzonite, which was of primary interest. As in the magnetic model studies, the bodies were extended to a depth of 1,000 m.
In spite of some obvious departures in two-dimensionality in the anomaly data, some generalized interpretations are possible. The model results in Figure 10 are consistent with the steep intrusive contacts derived from the magnetic model studies. In addition, the gravity model study includes a mass of dense material, presumably diorite, buried 130 m below the northern part of the monzonitic rocks. The overall shape of the monzonite in the model is suggestive of a gradual southward thickening toward a possible feeder zone for emplacement of the monzonite core.
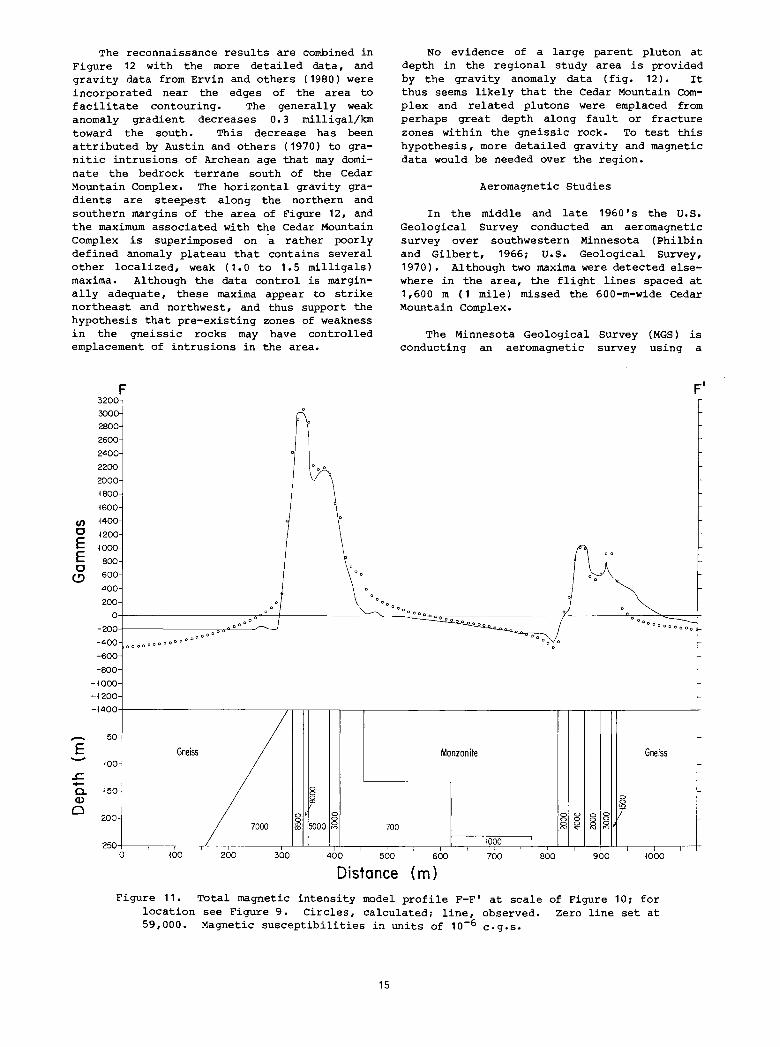
In order to check the gravity model interpretation, a magnetic model study was made using the same general body shapes as Figure 10. Magnetic data control is locally sparse along the profile (fig. 3) and cautions about assuming two-dimensionality also apply here. By assuming vertical bands of varying magnetic
susceptibility within the masses of the dioritic rocks, a reasonable fit was obtained (fig. 11 ) • The susceptibilities used in this model are greater than indicated on Table 1, but no samples were taken in the vicinity. The exclusion of local terrain effects in the model may cause the estimated susceptibilities along the north flank of the model to be slightly
"
" "
" '-
, , , , , ,
'-----
---
high. Furthermore, parts of these . profiles cross some of the highest elevations in the region, and a local increase in magnetization may reflect the effect of lightning strikes. In any case, the overall fit of the magnetic model, however, seems to support the geometry of the gravity model over the monzonite core.
,
"
EXPLANATION
Grovity ContOl.J"S Contour intetyaJ 0.1 milli~
dashed where inferred
Location of Ql'ovity station
... _-- ------
SCALE 100 200 300 400 lOO Feet
-, "
· · · · . ..
,
· · I
, , . · ,
. , , , . · · · I
I . . ,
"93()f'JCOLN.
/,'44"y;J2!f' ?:: : , , , ,
• ,'~ ,1,1 ,
" ' I , " , .
. -:'-~ ) , -'
.. t~N.
"
"
-- ------- - - -
, , , ' , " "
-----.-'----' ----------~~~~~~----------~-
" ~\. " ". ~~~~----------~~--__________________________ _L~ ________________ ~~' ______________________________ ~4'3d1~
Figure 9 . Simple Bouguer gravity contour map of the Cedar Mountain study area.
13
The reconnaissance results are combined in Figure 12 with the more detailed data, and gravity data from Ervin and others (1980) were incorporated near the edges of the area to facilitate contouring. The generally weak anomaly gradient decreases 0.3 milligal/km toward the south. This decrease has been attributed by Austin and others (1970) to granitic intrusions of Archean age that may dominate the bedrock terrane south of the Cedar Mountain Complex. The horizontal gravity gradients are steepest along the northern and southern margins of the area of Figure 12, and the maximum associated with the Cedar Mountain Complex is superimposed on a rather poorly defined anomaly plateau that contains several other localized, weak (1.0 to 1.5 milligals) maxima. Although the data control is marginally adequate, these maxima appear to strike northeast and northwest, and thus support the hypothesis that pre-existing zones of weakness in the gneissic rocks may have controlled emplacement of intrusions in the area.
F 3200
3000
2800 ~
2600
2400 0
2200 , 00
2000
1800
1600
en 1400 of 0
C 1200 E lOoo E 800 C
600 t9 0
00
400 0
0
200 0 0
000
No evidence of a large parent pluton at depth in the regional study area is provided by the gravity anomaly data (fig. 12). It thus seems likely that the Cedar Mountain Complex and related plutons were emplaced from perhaps great depth along fault or fracture zones within the gneissic rock. To test this hypothesis, more detailed gravity and magnetic data would be needed over the region.
Aeromagnetic Studies
In the middle and late 1960' s the U. S. Geological Survey conducted an aeromagnetic survey over southwestern Minnesota (Philbin and Gilbert, 1966; U.S. Geological Survey, 1970). Although two maxima were detected elsewhere in the area, the flight lines spaced at 1,600 m (1 mile) missed the 600-m-wide Cedar Mountain Complex.
The Minnesota Geological Survey (MGS) is conducting an aeromagnetic survey using a
F'
0 0 ~
000000 j~
,.... E .......
..c. -c.. Q)
0
-200 00
~ ~ 00000000;:::-000 o 00 I....a.... ,00 ~oo-J
-400
-600
-800
-lQoo -1200
-1400
50
100
150
200
250 o
OOOQoooooooocoo
Gneiss
7000
, 100 200
Monzonite
0 0 g
0 0 0 0
'" 5000 ~ 700 a;>
300 400 500 600
Distance (m)
00 0
0
Gneiss
0 0
'" 0 0 0 0 T 0 0 2 0
2 0 ~ .".
moo I 700 800 900 1000
Figure 11. Total magnetic intensity model profile F-F' at scale of Figure 10; for location see Figure 9. Circles, calculated; line, observed. Zero line set at 59,000. Magnetic susceptibilities in units of 10-6 c.g.s.
15
I

terrain clearance of 150 m and flight-line spacing of 400 m. East-central Minnesota is currently being flown, and northeastern Minnesota has already been completed. It therefore was of interest to see if small features like the Cedar Mountain Complex would be detectable when the MGS survey is extended to southwestern Minnesota.
In order to approximate a 150-m terrain clearance, the 150-m-Ievel data generated prior to reduction to pole were used. The data were also upward continued to 300 m above surface to approximate the additional attenuation of
95000'
o
-44.0 ________ _
burial beneath thick Cretaceous and Pleistocene materials.
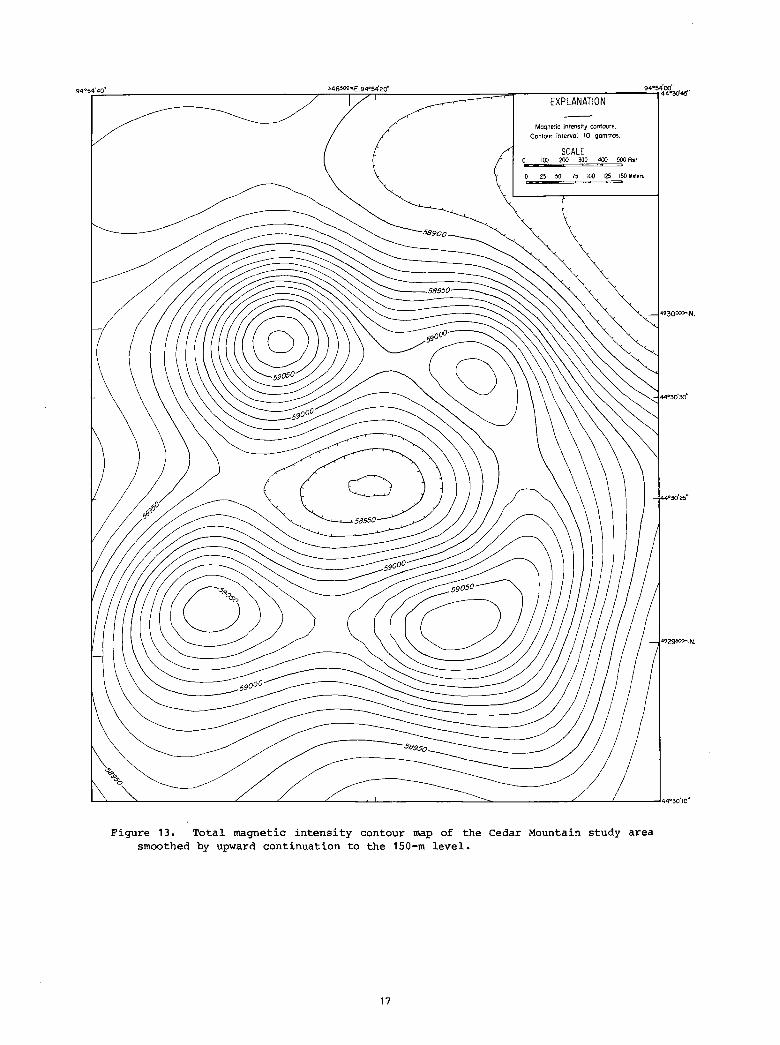
The 150-m-Ievel data (fig. 13) show, as expected, a much smoothed and subdued pattern relative to the surface data in Figure 3, although the general anomaly patterns are similar. The ring of maxima associated with the hornblende diorite attains amplitudes of 150 to 200 gammas above background, which certainly are detectable by airborne magnetometers. However, the 400-m line spacing would effectively limit the geologic resolution. The data along three such flight lines centered
4935000N.
4925000N.
-43.0------1
4920000N.
F----------L----...:::,.L---.:~--='=~===_ __ ~~L___L...L__L~~~~____144°25' EXPLANATION
location of gravity station
O:-~~~=:=~~====~==~4 Miles ___ 0::...o~~=~==='i=~~=~=~6 Kilometers Gravity Contours
This study
- Contour interval 0.5 milligol
Figure 12. Figure
Simple Bouguer for location.
are shown in Figure 9. Ervin and others (1980).
Bose station +
!kolo, ~969
gravity contour map of the regional study area; see Gravity stations within the Cedar Mountain study area
Gravity data from Ikola' s survey were published in
16
EXPLANATION
Magnetic intensity contours.
Contour interval 10 gom!'TYJS.
SCALE 100 200 300 400 500 Feel
2.5 50 75 100 125 150 Meters
o 4929'OO'"N.
L-...:..... __ "'-________ ...L.. ___ ""-___ --<. ___ --'--'-_________ ~ _______ ...L.. ___ '__ ___ ... 44030'10"
Figure 13. Total magnetic intensity contour map of the Cedar Mountain study area smoothed by upward continuation to the 150-m level.
17
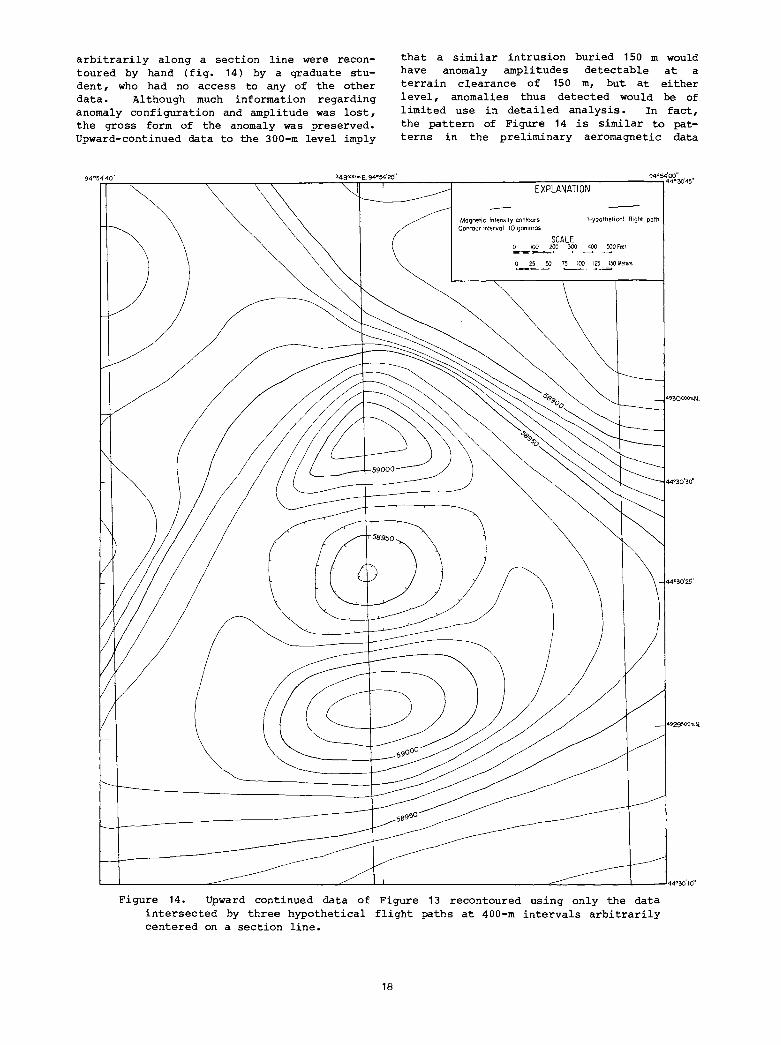
arbitrarily along a section line were recontoured by hand (f ig. 14) by a graduate student, who had no access to any of the other data. Although much information regarding anomaly configuration and amplitude was lost, the gross form of the anomaly was preserved. Upward-continued data to the 300-m level imply
94°54'40"
that a similar intrusion buried 150 m would have anomaly amplitudes detectable at a terrain clearance of 150 m, but at either level, anomalies thus detected would be of limited use in detailed analysis. In fact, the pattern of Figure 14 is similar to patterns in the preliminary aeromagnetic data
EXPLANATION
Magnetic intensity contours Contour interval 10 gammas
SCALE
Hypothetical flight path
o 100 200 300 400 SOD Feel .... ---~ -~---= o 25 50 75 100 125 150 Meiers
492g:'iO?m.N.
'---'-_______ ~= _________ ~~ _ _I_L ______________ """':::::... _____ L _ ___l44°30'10"
Figure 14. Upward continued data of Figure 13 recontoured using only the data intersected by three hypothetical flight paths at 400-m intervals arbitrarily centered on a section line.
18
from east-central Minnesota, which correspond to gabbroic and dioritic rocks mapped by Morey and others (1981).
Paleomagnetic Studies
During the final preparation of this report, eight oriented core samples--five from the chilled margin and three from the dioritic rocks--were measured for remanent magnetization and subjected to progressive alternating field demagnetization. This preliminary treatment was conducted to further investigat~ the total polarization of the intrusive rocks and to see how the results compared with the polar wander path proposed by Irving (1979) for early Proterozoic time. Four of the samples were eliminated because of their extremely high intensity <)40,000x10-6 c.g.s.) and unstable behavior during demagnetization, probably reflecting past lightning strikes.
The four remaining samples--three from the chilled margin and one from the diorite--had raw NRM intensities between 2,000 and 4,500 x10-6 c.g.s. and were associated with steeply dipping stable components upon demagnetization levels above 300 oersteds. At 400 oersteds demagnetization, the three chilled margin samples gave respective declination/inclination values of 193°/68°, 199°/68°, and 226°/84°, and the diorite gave values of 304°/67°. More work would be required before a statistically valid direction for the complex could be determined, but these results imply that the mafic rocks acquired their principal magnetization when they were at a high geographic latitude.
Paleolatitude maps by Irving (1979) indicate that North America was at high latitudes twice during Proterozoic time--once between 2,200 and 1,850 m.y. and again around 1,650 m.y. If the paleomagnetic data are interpreted as reflecting the earlier interval, the complex would be considerably older than its K-Ar age of 1,750 m.y. (Goldich and others, 1961; Hanson, 1968). In order for the results to represent the 1,650-m.y. interval, one would have to assume an event that completely reset the magnetization of the intrusive rocks, but not the somewhat delicate K-Ar ratio. The older time interval for magnetization thus is tentatively favored, although further paleomagnetic and geochronologic work is clearly needed before this problem can be resolved.
CONCLUSIONS
Total intensity magnetic anomaly data supplemented by topographic maps and aerial photographs reveal that the contact of the dioritic rocks of the Cedar Mountain Complex with the enclosing gneisses is considerably
19
more irregular than previously thought. In several areas large angular masses of gneissic host rock impinge into the dioritic rocks. Linear segments of the outer contact, as well as the elongation of the complex, strike to the northeast and northwest. The magnetic data also indicate that the monzonite core is considerably larger and more rectangular in outline than previously believed.
Model studies of the magnetic data imply that all contacts of the complex are nearly vertical and some may dip steeply outward. This interpretation assumes polarization that is totally induced by, or at least aligned along the ambient field of the earth. Model studies of the gravity anomaly data indicate that the northern part of the monzonite core may be underlain by dioritic rocks.
The overall configuration indicated by modeling is consistent with emplacement of the dioritic rocks by forceful injection of a crystalline mush along near-vertical, northeastand northwest-striking zones of weakness in the Archean gneiss terrane. The higher density that the partially crystallized dioritic magma would have had, relative to the felsic gneisses, also favors emplacement by forceful injection. The core monzonite was emplaced later, perhaps by stoping of large blocks of the dioritic rock.
Lineaments visible on topographic maps and aerial photographs indicate that northeastand northwest-striking structures may be com-mon throughout much of the gneissic terrane of the region. The regional-scale gravity data do not indicate any large intrusive mass beneath the area surrounding the Cedar Mountain Complex, but localized maxima of about 1 milligal amplitude exist to the south and east at distances of about 6 km, and may reflect mafic intrusions emplaced during the same igneous event.
Aeromagnetic surveying by the u. S. Geological Survey at 1. 6-km flight-line spacing detected localized high-intensity anomalies in the vicinity of the Cedar Mountain Complex, but completely missed the complex itself. Similar and smaller intrusions are thus not accurately reflected in aeromagnetic data at this level of resolution. However, upward continuation of the ground magnetic data indicates that the general attributes of the Cedar Mountain Complex would be detectable by the aeromagnetic survey using a flight-line spacing of 400 m and average terrain clearance of 150 m which is currently being conducted by the Minnesota Geological Survey. Extension of this survey to southwestern Minnesota should thus provide information on the extent and significance of this poorly defined but widespread lower Proterozoic igneous event.
ACKNOWLEDGMENTS
R.A. Black and R.R. Anderson of the Iowa Geological Survey and c.G. Chase of the University of Minnesota provided helpful comments on the manuscript. George Mickelson, Habeeb Galadanchi, Arthur Watts, and Marie Del Toro assisted at various times in the field. Robert Ferderer contoured the data in Figure 14. The authors are grateful to the local landowners, especially Mr. John Crain, for their cooperation. This study was funded by an award from the Legislative Commission on Minnesota Resources.
REFERENCES CITED
Austin, G.S., Grant, J.A., Ikola, R.J., and Sims, P.K., 1970, Geologic map of Minnesota, New Ulm Sheet: Minnesota Geological Survey, scale 1:250,000.
Bhattacharyya, B.K., harmonic analysis interpretation: 829-857.
1965, Two dimensional as a tool for magnetic Geophysics, v. 30, p.
Billings, M.P., 1972, Structural geology (3rd ed.): Prentice Hall, 606 p.
Breiner, S., 1973, Applications manual for portable magnetometers: Sunnyvale, Calif., geoMetrics, Inc., 58 p.
Daggett, M.D., III, 1980, The structure and petrology of the Cedar Mountain COmplex, Redwood County, Minnesota: Unpublished M.S. thesis, University of Minnesota, 85 p.
Ervin, C.P., Ikola, R.J., and McGinnis, L.D., 1980, Simple Bouguer gravity map of Minnesota, New Ulm Sheet: Minnesota Geological Survey Miscellaneous Map Series M-43, scale 1:250,000.
Goldich, S.S., Nier, A.C., Baadsgaard, H., Hoffman, J. H., and Krueger, H. W., 1961, The Precambrian geology and geochronology of Minnesota: Minnesota Geological Survey Bulletin 41, 193 p.
Grant, J.A., 1972, Minnesota River Valley, southwestern Minnesota, in Sims, P.K., and Morey, G.B., eds., Geology of Minnesota: A centennial volume: Minnesota Geological Survey, p. 177-196.
Hammer, S., 1939, Terrain correction for gravimeter stations: Geophysics, v. 4, p. 184-194.
Hanson, G.N., 1968, K-Ar ages for hornblende from granites and gneisses and for basaltic intrusives in Minnesota: Minnesota
20
Geological Survey Report of Investigations 8, 20 p.
Irving, E., 1979, Paleopoles and paleolatitudes and speculations about displaced terrains: Canadian Journal of Earth Sciences, v. 16, p. 669-694.
Lund, E.H., 1950, Igneous and metamorphic rocks of the Minnesota River Valley: Unpublished Ph.D. dissertation, University of Minnesota, 89 p.
_____ , 1956, Igneous and metamorphic rocks of the Minnesota River Valley: Geological Society of America Bulletin, v. 67, p. 1475-1490.
Morey, G.B., Olsen, B.M., and Southwick, D.L., 1981, Geologic map of Minnesota, eastcentral Minnesota: Minnesota Geological Survey, scale 1:250,000.
Peddie, N.W., Jones, W.J., and Fabiano, E.B., 1976, Magnetic inclination in the United States--Epoch 1975.0: U.S. Geological Survey Miscellaneous Investigations Map 1-912, scale 1:5,000,000.
Philbin, P.w., and Gilbert, F.P., 1966, Aeromagnetic map of southwestern Minnesota: U.S. Geological Survey Geophysical Investigations Map GP-560, scale 1:250,000.
Sampson, R.J., 1975, SURFACE II graphics system: Kansas Geological Survey, 240 p.
Southwick, D.L., Morey, G.B., Lively, R.S., and Beltrame, R.J., 1981, Uranium resource evaluation, New Ulm quadrangle, Minnesota: U.S. Department of Energy Report PGJ-052(81), 61 p.
Streckeisen, A.L., 1973, Plutonic rocks: Classification and nomenclature recommended by the lUGS Subcommission on the Systematics of Igneous Rocks: Geotimes, v. 18, no. 10, p. 26-30.
U.S. Geological Survey, 1970, Aeromagnetic map of a part of western Minnesota: U. S. Geological Survey Geophysical Investigations Map GP-692, scale 1:250,000.
Van Schmus, W.R., 1978, Geochronology of the southern Wisconsin rhyolites and grani tes: Wisconsin Geological and Natural History Survey, Geoscience Wisconsin, v. 2, p. 19-24.
Zietz, I., and Andreasen, G.E., 1967, Remanent magnetization and aeromagnetic interpretation, ~ Hansen, D.A., and others, eds., Mining geophysics, v. 2: Tulsa, Society of Exploration Geophysicists, p. 569-590.