geotechnical engineering report · geotechnical engineering report june 27, 2018 (revised september...
TRANSCRIPT

GEOTECHNICAL ENGINEERING REPORT
CAMPBELL HIGH SCHOOL PERFORMANCE HALL & CLASSROOM ADDITION Smyrna, Cobb County, Georgia
PREPARED FOR: Cobb County School District 514 Glover Street Marietta, Georgia 30060
NOVA Project Number: 2018090.2
June 27, 2018 (Revised September 26, 2019)


TABLE OF CONTENTS
1.0 INTRODUCTION .............................................................................................................. 1
1.1 PROJECT INFORMATION............................................................................................................... 1
1.2 SCOPE OF WORK .......................................................................................................................... 2
2.0 SITE DESCRIPTION ........................................................................................................ 4
2.1 LOCATION AND LEGAL DESCRIPTION .......................................................................................... 4
2.2 SUBJECT PROPERTY AND VICINITY GENERAL CHARACTERISTICS ............................................. 4
2.3 CURRENT USE OF THE PROPERTY ............................................................................................... 4
3.0 FIELD AND LABORATORY PROCEDURES ....................................................................... 5
3.1 FIELD EXPLORATION .................................................................................................................... 5
3.2 LABORATORY TESTING ................................................................................................................. 7
4.0 SUBSURFACE CONDITIONS ........................................................................................... 8
4.1 GEOLOGY ...................................................................................................................................... 8
4.2 SOIL AND ROCK CONDITIONS ...................................................................................................... 9
4.3 GROUNDWATER CONDITIONS .................................................................................................. 12
4.4 PERCOLATION TEST RESULTS .................................................................................................. 13
5.0 CONCLUSIONS AND RECOMMENDATIONS ................................................................. 14
5.1 SITE PREPARATION ................................................................................................................... 14
5.2 FILL PLACEMENT ....................................................................................................................... 15
5.3 GROUNDWATER CONTROL ....................................................................................................... 16
5.4 FOUNDATIONS ........................................................................................................................... 17
5.5 SLAB-ON-GRADE ........................................................................................................................ 19
5.6 BELOW GRADE WALLS .............................................................................................................. 20
5.7 SEISMIC SOIL SITE CLASSIFICATION ........................................................................................ 22
6.0 BEDROCK MOTION STUDY .......................................................................................... 23
6.1 INTRODUCTION .......................................................................................................................... 23
6.2 HISTORICAL SEISMICITY ........................................................................................................... 23
6.3 SEISMIC HAZARD ANALYSIS METHODS ................................................................................... 29
6.4 SEISMIC HAZARD ANALYSIS RESULTS ..................................................................................... 31
7.0 CONSTRUCTION OBSERVATIONS ................................................................................ 34
7.1 SHALLOW FOUNDATIONS ......................................................................................................... 34
7.2 AP FOUNDATIONS ...................................................................................................................... 34
7.3 SUBGRADE ................................................................................................................................ 34
APPENDICES
Appendix A – Figures and Maps Appendix B – Subsurface Data Appendix C – Qualifications of Recommendations

Geotechnical Engineering Report June 27, 2018 (Revised September 26, 2019) Campbell High School Performance Hall & Classroom Addition NOVA Project Number 2018090.2
Page 1
1.0 INTRODUCTION
1.1 PROJECT INFORMATION
Our understanding of this project is based on email and telephone correspondence with
you, review of the provided documents, a site reconnaissance during boring layout, and
our experience with similar projects.
1.1.1 Site Plans and Documents
We were furnished with the following plans and documents:
• Geotechnical Report Criteria
Prepared by: Uzun + Case
Dated: April 27, 2018
• Geotechnical Report Criteria
• Proposed Geotechnical Boring Plan
Prepared by: Collins Cooper Carusi Architects, Inc.
Dated: March 23, 2018
• Aerial image with the approximate footprint of the proposed cafeteria
expansion
• Campbell High School Additions Infiltration Testing Borings Locations plan
• Campbell High School Infiltration Test Locations plan
Prepared by: Breedlove Land Planning
1.1.2 Proposed Structures
The proposed construction will consist of an approximately 23,000 square-foot
Performance Arts Center (PAC) and an approximately 33,000 square-foot three-
story classroom addition. In addition, a proposed cafeteria expansion will consist
of a one-story metal framed building extending into the existing senior courtyard.
1.1.3 Maximum Loads
Based on the furnished structural loading information, we understand the new
classroom addition will produce maximum interior and exterior column loads
on the order of 230 and 165 kips, respectively. The new classroom addition

Geotechnical Engineering Report June 27, 2018 (Revised September 26, 2019) Campbell High School Performance Hall & Classroom Addition NOVA Project Number 2018090.2
Page 2
will also have maximum wall loads on the order of 1.5 kips per lineal foot (klf).
We understand the new PAC will produce maximum column and wall loads on
the order of 55 kips and 5.75 klf, respectively.
Structural loading information was not provided for the cafeteria expansion;
however, based on our experience with similar projects, we assume maximum
column and continuous wall loads on the order of 150 kips and 4 kips per lineal
foot (klf), respectively.
1.1.4 Floor Elevations / Site Grading
We assume the finished floor elevation (FFE) of the additions will nearly match
that of the existing buildings, thus requiring minimal site grading. Therefore, we
have assumed maximum cuts and fills will be on the order of 3 feet or less.
1.2 SCOPE OF WORK
Cobb County School District engaged NOVA to provide geotechnical engineering
consulting services for the Campbell High School Performance Hall & Classroom
Additions, and for the proposed cafeteria expansion. This report briefly discusses our
understanding of the project, describes our exploratory procedures, and presents our
findings, conclusions, and recommendations.
The primary objective of this study was to perform a geotechnical exploration within the
areas of the proposed construction and to assess these findings as they relate to
geotechnical aspects of the planned site development. The authorized geotechnical
engineering services included a site reconnaissance, a soil test boring and sampling
program, in-situ testing, laboratory testing, engineering evaluation of the field and
laboratory data, and the preparation of this report.
The services were performed substantially as outlined in our proposal number 002-
20184924.1, dated May 17, 2018, as well as the Additional Services Agreements,
dated June 7, 2018, July 10, 2018, and August 27, 2019, and in general accordance
with industry standards.
As authorized per the above referenced proposal, the completed geotechnical report was
to include:
• A description of the site, fieldwork, and general soil conditions encountered,
as well as a Boring Location Plan, and individual Boring Records;
• Discussion on potential design/construction issues indicated by the
exploration, such as materials that would require difficult excavation
techniques, shallow groundwater table, etc.;

Geotechnical Engineering Report June 27, 2018 (Revised September 26, 2019) Campbell High School Performance Hall & Classroom Addition NOVA Project Number 2018090.2
Page 3
• Results of percolation testing;
• Recommendations for controlling groundwater and/or run-off during
construction and, the need for permanent de-watering systems based on the
anticipated post construction groundwater levels;
• Suitability of on-site soils for re-use as structural fill and backfill. Additionally,
the criteria for suitable fill materials were to be provided;
• Recommendations for foundation design and construction, including
allowable bearing pressures and bearing depths;
• Estimate of total and differential settlements of foundation based on provided
structural loading data;
• Slab-on-grade construction considerations based on the geotechnical
findings, including the need for a sub-slab vapor barrier or a capillary barrier;
• Seismic site classification using correlation with SPT N-values in accordance
with the 2012 IBC;
• Seismic design parameters SDS and SD1 and Design Response Spectrum from
Seismic Risk-Based Hazard Analysis;
• Recommended quality control measures (i.e. sampling, testing, and
inspection requirements) for site grading and foundation construction. Soil
compaction requirements for foundations, structural fill and pavements were
to be provided.
The assessment of the presence of wetlands, floodplains, or water classified as State
Waters of Georgia was beyond the scope of this study. Additionally, the assessment of
site environmental conditions, including the detection of pollutants in the soil, rock, or
groundwater, at the site was also beyond the scope of this geotechnical study. If desired
by the client, NOVA can provide these services.
Geotechnical Engineering Report June 27, 2018 (Revised September 26, 2019) Campbell High School Performance Hall & Classroom Addition NOVA Project Number 2018090.2
Page 4
2.0 SITE DESCRIPTION
2.1 LOCATION AND LEGAL DESCRIPTION
The Subject Property is located at 5265 Ward Street Southeast in Smyrna, Georgia.
The school campus is bounded by Belmont Boulevard SE to the north, Smyrna
Elementary School to the east, Powder Springs Street SE to the south, and Ward Street
SE to the west.
A Site Location Map and a Topographic Map depicting the location of the Subject Property
and its surrounding topography are included in Appendix A (Figures 1 and 2). The
approximate latitude and longitude coordinates of the subject site are 33.892710° north
and 84.529280° west, respectively.
2.2 SUBJECT PROPERTY AND VICINITY GENERAL CHARACTERISTICS
The Subject Property is located within the Marietta, Georgia, United States Geological
Survey, 7.5-minute series topographic quadrangle map. According to Figure 2, the school
campus slopes downward from a high point of approximately 1040 feet above mean sea
level (MSL) in the northern portion to approximately 1000 feet-MSL in the southern
portion of the Subject Property.
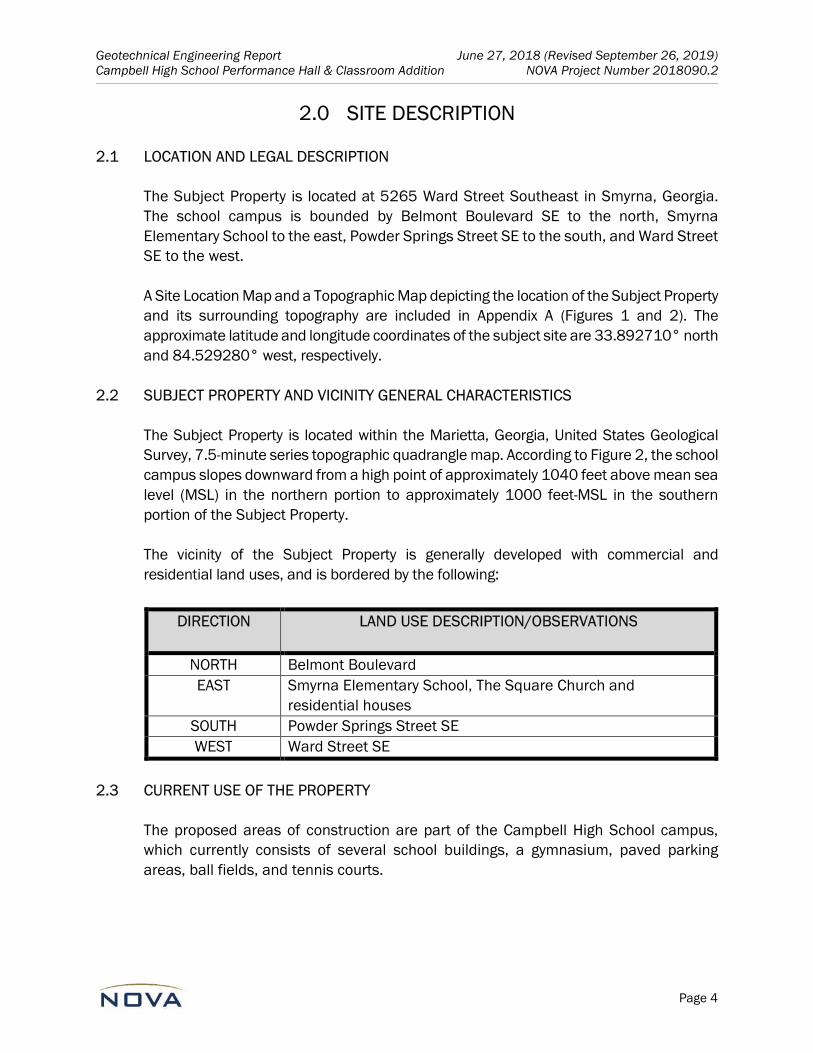
The vicinity of the Subject Property is generally developed with commercial and
residential land uses, and is bordered by the following:
2.3 CURRENT USE OF THE PROPERTY
The proposed areas of construction are part of the Campbell High School campus,
which currently consists of several school buildings, a gymnasium, paved parking
areas, ball fields, and tennis courts.
DIRECTION LAND USE DESCRIPTION/OBSERVATIONS
NORTH Belmont Boulevard
EAST Smyrna Elementary School, The Square Church and
residential houses
SOUTH Powder Springs Street SE
WEST Ward Street SE

Geotechnical Engineering Report June 27, 2018 (Revised September 26, 2019) Campbell High School Performance Hall & Classroom Addition NOVA Project Number 2018090.2
Page 5
3.0 FIELD AND LABORATORY PROCEDURES
3.1 FIELD EXPLORATION
Boring locations were established in the field by NOVA personnel using the Proposed
Geotechnical Boring Plan attached to the provided Geotechnical Report Criteria.
Underground utility related adjustments of the boring locations were made at the time
of the field exploration. The approximate locations are shown on Figures 3A and 3B in
Appendix A. Consequently, referenced boring locations are approximate. If increased
accuracy is desired by the client, NOVA recommends that the boring locations and
elevations be surveyed.
Our initial field exploration was conducted on May 29, 2018 and included 15 soil test
borings (B-1 through B-11 and C-1 through C-4) drilled to depths ranging from 15 to 68
feet below the existing ground surface in the areas of the proposed PAC and classroom
additions. Two (2) additional soil test borings (N-1 and N-2) were conducted in the
expanded footprint of the proposed PAC on September 6, 2019. The approximate
locations of the soil test borings are shown on Figure 3A.
On June 13, 2018, 3 hand auger borings (H-1 through H-3) were completed to depths
ranging from 3 to 5 feet below the existing ground surface in the senior courtyard, where
the cafeteria expansion is planned. The Approximate locations of the hand auger borings
are shown on Figure 3B.
Three (3) percolation tests were performed (I-1 through I-3) within the area of the
proposed underground detention system in the existing western parking lot on July 24,
2018. An additional two (2) percolation tests were performed (I-4 and I-5) in the
southern parking lot on September 6, 2019. Approximate locations of the percolation
tests are shown on Figures 4A and 4B in Appendix A.
Soil Test Borings: The soil test borings were performed using the guidelines of ASTM
Designation D-1586, "Penetration Test and Split-Barrel Sampling of Soils". A hollow-stem
auger was used to advance the borings. At regular intervals, soil samples were obtained
with a standard 1.4-inch I.D., 2.0-inch O.D., split-tube sampler. The sampler was first
seated six inches and then driven an additional foot with blows of a 140-pound hammer
falling 30 inches. The number of hammer blows required to drive the sampler the final
foot is designated the "Penetration Resistance". The penetration resistance, when
properly interpreted, is an index to the soil strength and density. Representative portions
of the soil samples, obtained from the sampler, were placed in jars and transported to
our laboratory for further evaluation and laboratory testing.

Geotechnical Engineering Report June 27, 2018 (Revised September 26, 2019) Campbell High School Performance Hall & Classroom Addition NOVA Project Number 2018090.2
Page 6
Test Boring Records in Appendix B show the standard penetration test (SPT) resistances,
or “N-values”, and present the soil conditions encountered in the borings. These records
represent our interpretation of the subsurface conditions based on the field exploration
data, visual examination of the split-barrel samples, laboratory test data, and generally
accepted geotechnical engineering practices. The stratification lines and depth
designations represent approximate boundaries between various subsurface strata.
Actual transitions between materials may be gradual.
Hand Auger Borings: The hand auger borings were performed in areas of the site that
were not drill rig accessible. At regular intervals in the hand auger borings, the soil
consistency was measured with a portable dynamic cone penetrometer (DCP). After
first seating the conical point, the point was driven an additional 1¾ inches with blows
of a manually-operated 15-pound hammer falling freely over a 20-inch drop. The
number of blows required to achieve this penetration was recorded and is an empirical
assessment of the soil’s load bearing capacity and density. Please refer to the Hand
Auger Boring Logs included in Appendix B.
Groundwater: The groundwater levels reported on the Test Boring Records represent
measurements made at the completion of the soil test boring. The soil test borings were
subsequently backfilled with the soil cuttings and patched with asphalt, if necessary.
Percolation Tests: The percolation tests were performed in general accordance with
standard test procedures adopted by the Georgia Department of Human Resources.
In summary, the boreholes were at least 4 inches in diameter, hand augered to test
elevation, then scarified with a pointed tool and cleaned of loose soil. Approximately
two (2) inches of gravel was placed in the bottom of the boreholes, then the holes were
filled with water for a minimum of 30 minutes to saturate the adjacent soil. The water
levels were then adjusted to approximately six (6) inches above the gravel, and water
level measurements were taken at varying time intervals until the levels reached two
(2) inches above the gravel. Water was then added to re-establish the approximate 6-
inch water column and measurements were continued. This was repeated until
constant rates of percolation were measured.
Following calculation of the percolation rates for the tests, the percolation rates were
converted to infiltration rates (inches/hour) via the Porchet method. The Porchet
method takes into account the radius of the augered hole, and the average head over
the final time interval. Furthermore, the infiltration rate considers only the downward
progression of water into the soil as opposed to a percolation test which also allows
lateral flow through the soil.

Geotechnical Engineering Report June 27, 2018 (Revised September 26, 2019) Campbell High School Performance Hall & Classroom Addition NOVA Project Number 2018090.2
Page 7
3.2 LABORATORY TESTING
A laboratory testing program of visual classification was conducted to characterize
materials existing at the site using split-barrel samples recovered from the site. Visual
classification provides a general guide to the engineering properties of various soil
types and enable the engineer to apply past experience to current problems. In our
explorations, samples obtained during drilling operations are observed in our
laboratory and visually classified by an engineer. The soils are classified according to
consistency (based on number of blows from standard penetration tests), color and
texture. These classification descriptions are included on our "Test Boring Records".
The classification system discussed above is primarily qualitative; laboratory testing is
generally performed for detailed soil classification. Using the test results, the soils
were classified using the Unified Soil Classification Systems. This classification system
and the in-place physical soil properties provide an index for estimating the soil's
behavior. The soil classification and physical properties obtained are presented in this
report.

Geotechnical Engineering Report June 27, 2018 (Revised September 26, 2019) Campbell High School Performance Hall & Classroom Addition NOVA Project Number 2018090.2
Page 8
4.0 SUBSURFACE CONDITIONS
4.1 GEOLOGY
The site is located in the Piedmont Geologic Region, a broad northeasterly trending
province underlain by crystalline rocks up to 600 million years old. The Piedmont is
bounded on the northwest by the Blue Ridge Range of the Appalachian Mountains, and
on the southeast by the leading edge of Coastal Plain sediments, commonly referred to
as the “Fall Line”. Numerous episodes of crystal deformation have produced varying
degrees of metamorphism, folding and shearing in the underlying rock. The resulting
metamorphic rock types in this area of the Piedmont are predominantly a series of
Precambrian age schists and gneisses, with scattered granitic or quartzite intrusions.
According to the "Geology of the Greater Atlanta Region" by McConnell and Abrams,
1984, the site is generally underlain by intercalated biotite gneiss, micaceous schist and
amphibolite (pfu), shown in Figure 5 in Appendix A.
Residual soils in the region are primarily the product of in-situ chemical decomposition of
the parent rock. The extent of the weathering is influenced by the mineral composition
of the rock and defects such as fissures, faults and fractures. The residual profile can
generally be divided into three zones:
• An upper zone near the ground surface consisting of red clays and clayey silts
which have undergone the most advanced weathering,
• An intermediate zone of less weathered micaceous sandy silts and silty sands,
frequently described as “saprolite”, whose mineralogy, texture and banded
appearance reflects the structure of the original rock, and
• A transitional zone between soil and rock termed partially weathered rock (PWR).
Partially weathered rock is defined locally by standard penetration resistances
exceeding 100 blows per foot.
The boundaries between zones of soil, partially weathered rock, and bedrock are
erratic and poorly defined. Weathering is often more advanced next to fractures and
joints that transmit water, and in mineral bands that are more susceptible to
decomposition. Boulders and rock lenses are sometimes encountered within the
overlying PWR or soil matrix. Consequently, significant fluctuations in depths to
materials requiring difficult excavation techniques may occur over short horizontal
distances.

Geotechnical Engineering Report June 27, 2018 (Revised September 26, 2019) Campbell High School Performance Hall & Classroom Addition NOVA Project Number 2018090.2
Page 9
4.2 SOIL AND ROCK CONDITIONS
The following paragraphs provide generalized descriptions of the subsurface profiles and
soil conditions encountered by the borings conducted during this study.
The Boring Records in Appendix B should be reviewed to provide more detailed
descriptions of the subsurface conditions encountered at each boring location. These
records represent our interpretation of the subsurface conditions based on the field logs
and visual observations of samples by an engineer. The lines designating the interface
between various strata on the Boring Records represent the approximate interface
locations and elevation. The actual transition between strata may be gradual.
Groundwater levels shown on the Boring Records represent the conditions at the time
of drilling. It should be understood that soil conditions may vary between boring
locations.
4.2.1 Surface Materials
Topsoil: Approximately 3 to 4 inches of topsoil was encountered in borings B-1,
B-5, B-7, C-3, and C-4. Topsoil thickness is frequently erratic, and thicker zones
of topsoil should be anticipated.
Asphalt/Graded Aggregate Base: Some of the borings were performed within
existing parking lot areas and encountered up to approximately 6 inches of
asphalt underlain by up to approximately 6 inches of graded aggregate base
(GAB). The following table summarizes the thicknesses of asphalt and GAB.
BORING ASPHALT THICKNESS
(inches)
GAB THICKNESS
(inches)
B-2 4 4
B-6 4 4
B-8 4 4
B-9 4 5
B-10 4 4
B-11 4 5
C-1 4 4
C-2 4 4
N-1 4 6
N-2 6 5
Geotechnical Engineering Report June 27, 2018 (Revised September 26, 2019) Campbell High School Performance Hall & Classroom Addition NOVA Project Number 2018090.2
Page 10
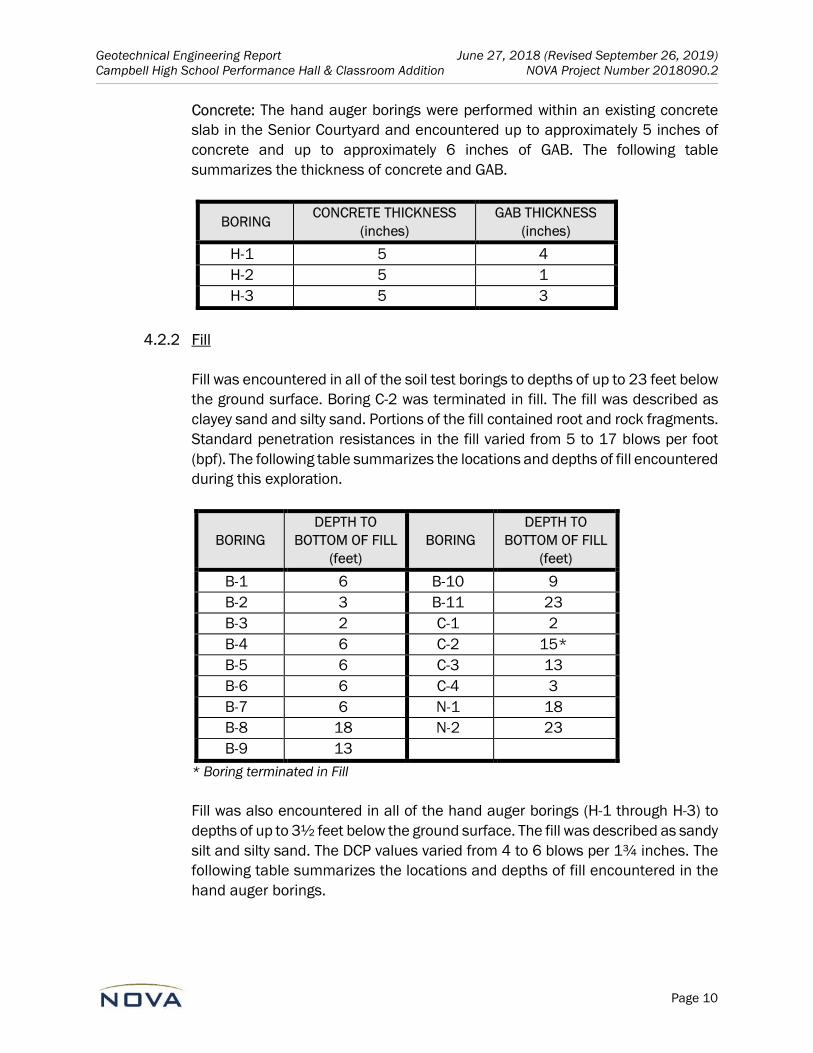
Concrete: The hand auger borings were performed within an existing concrete
slab in the Senior Courtyard and encountered up to approximately 5 inches of
concrete and up to approximately 6 inches of GAB. The following table
summarizes the thickness of concrete and GAB.
BORING CONCRETE THICKNESS
(inches)
GAB THICKNESS
(inches)
H-1 5 4
H-2 5 1
H-3 5 3
4.2.2 Fill
Fill was encountered in all of the soil test borings to depths of up to 23 feet below
the ground surface. Boring C-2 was terminated in fill. The fill was described as
clayey sand and silty sand. Portions of the fill contained root and rock fragments.
Standard penetration resistances in the fill varied from 5 to 17 blows per foot
(bpf). The following table summarizes the locations and depths of fill encountered
during this exploration.
BORING
DEPTH TO
BOTTOM OF FILL
(feet)
BORING
DEPTH TO
BOTTOM OF FILL
(feet)
B-1 6 B-10 9
B-2 3 B-11 23
B-3 2 C-1 2
B-4 6 C-2 15*
B-5 6 C-3 13
B-6 6 C-4 3
B-7 6 N-1 18
B-8 18 N-2 23
B-9 13
* Boring terminated in Fill
Fill was also encountered in all of the hand auger borings (H-1 through H-3) to
depths of up to 3½ feet below the ground surface. The fill was described as sandy
silt and silty sand. The DCP values varied from 4 to 6 blows per 1¾ inches. The
following table summarizes the locations and depths of fill encountered in the
hand auger borings.

Geotechnical Engineering Report June 27, 2018 (Revised September 26, 2019) Campbell High School Performance Hall & Classroom Addition NOVA Project Number 2018090.2
Page 11
BORING DEPTH OF FILL
(feet)
H-1 1½
H-2 3½
H-3 2
We anticipate fill materials likely exist at other locations between our borings.
Fills are typically erratic in composition and consistency.
4.2.3 Alluvium
Alluvium (water deposited soil) was encountered in soil test borings B-11, C-3,
and N-1 to depths of 15 to 23 below the ground surface. Boring C-3 was
terminated at 15 feet within the alluvium. The alluvium was described as clayey
sand and silty sand. Standard penetration resistances in the alluvium ranged
from 4 to 8 bpf.
BORING
DEPTH TO BOTTOM
OF ALLUVIUM
(feet)
B-11 23
C-3 15*
N-1 23
*Boring terminated in Alluvium
4.2.4 Residual Soils
Residual soils were encountered in all soil test borings, except boring C-2 and C-
3, beneath the fill or alluvium. The residuum was described as silty sand.
Standard penetration resistance values ranged from 4 to 48 bpf, but more
typically varied from 8 to 15 bpf.
Residual soils were encountered in the hand auger borings (H-1 through H-3),
beneath the fill. The residuum was described as silty sand. The DCP values in the
residual soils varied from 4 to 7 blows per 1¾ inches.
4.2.5 Partially Weathered Rock
Partially weathered rock (PWR) is a transitional material between soil and the
underlying parent rock that is defined locally as materials that exhibit a standard
penetration resistance exceeding 100 bpf. PWR was encountered in boring B-5

Geotechnical Engineering Report June 27, 2018 (Revised September 26, 2019) Campbell High School Performance Hall & Classroom Addition NOVA Project Number 2018090.2
Page 12
at a depth of 63 feet below the ground surface immediately above the auger
refusal.
4.2.6 Auger Refusal Materials
Auger refusal materials are any very hard or very dense material, frequently
boulders or the upper surface of bedrock, which cannot be penetrated by the
drilling equipment. Boring B-5 was extended to auger refusal for determination
of seismic site class. The auger refusal was encountered at 68 feet.
Rock coring to determine the nature and continuity of refusal materials was
beyond the scope of this exploration.
4.3 GROUNDWATER CONDITIONS
4.3.1 General
Groundwater in the Piedmont typically occurs as an unconfined or semi-confined
aquifer condition. Recharge is provided by the infiltration of rainfall and surface
water through the soil overburden. More permeable zones in the soil matrix, as
well as fractures, joints and discontinuities in the underlying bedrock can affect
groundwater conditions. The groundwater table in the Piedmont is expected to
be a subdued replica of the original surface topography.
Groundwater levels vary with changes in season and rainfall, construction
activity, surface water runoff, and other site-specific factors. Groundwater levels
in the Smyrna area are typically lowest in the late summer-early fall and highest
in the late winter-early spring, with annual groundwater fluctuations of 4 to 8 feet;
consequently, the water table may vary at times.
4.3.2 Soil Test Boring Groundwater Conditions
Groundwater was observed at the time of boring in 11 borings at depths ranging
from 13 to 20 feet below the ground surface. The groundwater depth at each
boring is shown in the following table.

Geotechnical Engineering Report June 27, 2018 (Revised September 26, 2019) Campbell High School Performance Hall & Classroom Addition NOVA Project Number 2018090.2
Page 13
BORING DEPTH
(feet)
B-1 20
B-2 18
B-3 20
B-4 18
B-5 20
B-6 20
B-8 18
B-9 15
B-11 20
C-3 13
N-2 19
4.4 PERCOLATION TEST RESULTS
A total of five (5) percolation tests (I-1 through I-5) were conducted during our field
exploration at depths of 8 to 10 feet below the existing ground surface at locations
depicted on Figures 4A and 4B in Appendix A. The following table summarizes the results
of the percolation testing. Ground surface elevations were interpolated from provided
topographic plan.
LOCATION
APPROXIMATE
EXISTING
GROUND
SURFACE
ELEVATION
(ft.-MSL)
APPROXIMATE
TEST DEPTH
BELOW
GROUND
SURFACE
(feet)
APPROXIMATE
TEST
ELEVATION
(ft.-MSL)
INFILTRATION
RATE
(inches/hour)
I-1 1012 8 1004 0.85
I-2 1012 8 1004 0.95
I-3 1014 10 1004 0.50 I-4 1012 10 1002 0.84 I-5 1009 10 999 0.31
We note that infiltration rates may vary from those reported below due to the natural
variation in soil and that larger areas of soil will be affected by the stormwater systems.
Geotechnical Engineering Report June 27, 2018 (Revised September 26, 2019) Campbell High School Performance Hall & Classroom Addition NOVA Project Number 2018090.2
Page 14
5.0 CONCLUSIONS AND RECOMMENDATIONS
The following conclusions and recommendations are based on our understanding of the
proposed construction, site observations, our evaluation and interpretation of the field and
laboratory data obtained during this exploration, our experience with similar subsurface
conditions, and generally accepted geotechnical engineering principles and practices.
Subsurface conditions in unexplored locations or at other times may vary from those
encountered at specific boring locations. If such variations are noted during construction, or if
project development plans are changed, we request the opportunity to review the changes and
amend our recommendations, if necessary.
As previously noted, boring locations were established by estimating distances and angles from
site landmarks. If increased accuracy is desired by the client, we recommend that the boring
locations and elevations be surveyed.
5.1 SITE PREPARATION
5.1.1 General
Prior to proceeding with construction, all existing structures, pavements,
vegetation, root systems, topsoil, and other deleterious non-soil materials should
be stripped from proposed construction areas. Clean topsoil may be stockpiled
and subsequently re-used in landscaped areas. Debris-laden materials should
be excavated, transported, and disposed of off-site in accordance with
appropriate solid waste rules and regulations. All existing utility locations should
be reviewed to assess their impact on the proposed construction and
relocated/grouted in-place as appropriate.
After clearing and stripping, areas, which are at grade or will receive fill should be
carefully evaluated by a NOVA geotechnical engineer. The engineer will require
proofrolling of the subgrade with multiple passes of a 20 to 30 ton loaded truck,
or other vehicle of similar size and weight.
The purpose of the proofrolling is to locate soft, weak, or excessively wet fill or
residual soils present at the time of construction. Unstable materials observed
during the evaluation and proof-rolling operations should be undercut and
replaced with structural fill or stabilized in-place by scarifying and re-densifying.
In the event that low consistency and/or debris laden fill materials are
encountered during construction, typical recommendations would include
those mentioned in the previous paragraph.
Geotechnical Engineering Report June 27, 2018 (Revised September 26, 2019) Campbell High School Performance Hall & Classroom Addition NOVA Project Number 2018090.2
Page 15
The site should be graded during construction such that positive drainage is
maintained away from the construction areas, to prevent ponding of storm water
on the site during and shortly following significant rain events. The construction
areas should also be sealed and crowned with a smooth roller to minimize
ponding water from storm events at the end of each day of work.
5.1.2 Existing / Old Fill
Previously placed fill materials were encountered during this exploration. Based
on our experience, we anticipate fill materials likely exist at other locations
between our borings. In the event that low consistency and/or debris-laden fill
materials are encountered during construction, typical recommendations
would include undercutting and backfilling with structural fill and/or stabilizing
in-place with fabric, stone, and/or other remedial techniques. Actual remedial
recommendations can best be determined by the geotechnical engineer in the
field at the time of construction.
5.1.3 Groundwater Softened Soil
Groundwater was encountered at depths ranging from 13 to 20 feet below the
ground surface. Because groundwater levels tendency to fluctuate, it is possible
the groundwater will have an impact on construction and the nature and extent
of remedial subgrade improvement. We believe it would be prudent to schedule
construction activities for the drier season of the year, typically late summer/early
fall, when groundwater levels and rainfall are usually near their yearly minimum.
5.1.4 Difficult Excavation
None of the borings encountered dense soil, PWR or rock above assumed
finished grades. However, as previously discussed, the weathering process at
this site is erratic and variations in the partially weathered rock or rock profile can
occur in small lateral distances. Therefore, it is possible that dense soil, PWR
and/or rock may be encountered in areas between the boring locations.
5.2 FILL PLACEMENT
5.2.1 Fill Suitability
Fill materials should be low plasticity soil (Plasticity Index less than 30), free of
non-soil materials and rock fragments larger than 3 inches in any one dimension.
Based on visual examination and limited laboratory testing, the existing residual
soils and much of the existing fill, which does not contain appreciable amounts
of rock or root fragments encountered during this exploration generally appear

Geotechnical Engineering Report June 27, 2018 (Revised September 26, 2019) Campbell High School Performance Hall & Classroom Addition NOVA Project Number 2018090.2
Page 16
suitable for re-use as structural fill. Prior to construction, bulk samples of the
proposed fill materials should be laboratory-tested to confirm their suitability.
Organic and/or debris-laden material is not suitable for re-use as structural fill.
Topsoil, mulch, and similar organic materials can be wasted in architectural
areas. Debris-laden materials should be excavated, transported, and disposed
of off-site in accordance with appropriate solid waste rules and regulations.
5.2.2 Soil Compaction
Fill should be placed in thin, horizontal loose lifts (maximum 8-inch) and
compacted to at least 95 percent of the standard Proctor maximum dry density
(ASTM D 698 - SPMDD). The upper 8 inches of soil beneath pavements and
slab-on-grade should be compacted to at least 98 percent of the SPMDD. In
confined areas, such as utility trenches or behind retaining walls, portable
compaction equipment and thinner fill lifts (3 to 4 inches) may be necessary.
Fill materials used in structural areas should have a target maximum dry
density of at least 95 pounds per cubic foot (pcf). If lighter weight fill materials
are used, the NOVA geotechnical engineer should be consulted to assess the
impact on design recommendations.
Soil moisture content should be maintained within 3 percent of the optimum
moisture content. We recommend that the grading contractor have equipment
on site during earthwork for both drying and wetting fill soils. Moisture control
may be difficult during rainy weather.
Filling operations should be observed by a NOVA soils technician, who can
confirm suitability of material used and uniformity and appropriateness of
compaction efforts. The technician can also document compliance with the
specifications by performing field density tests using thin-walled tube, nuclear,
or sand cone testing methods (ASTM D 2937, D 6938, or D 1556, respectively).
One test per 400 cubic yards and every 2 feet of placed fill is recommended,
with test locations well distributed throughout the fill mass. When filling in small
areas, at least one test per day per area should be performed.
5.3 GROUNDWATER CONTROL
During the current study, depths to groundwater ranged from 13 to 20 feet
below the existing ground surface. Based on the assumed finished floor
elevation of the additions matching the existing buildings, we do not anticipate
significant groundwater control problems during mass grading.
Geotechnical Engineering Report June 27, 2018 (Revised September 26, 2019) Campbell High School Performance Hall & Classroom Addition NOVA Project Number 2018090.2
Page 17
As previously noted, groundwater levels are subject to seasonal, climatic and
other variations and may be different at other times and locations. The extent
and nature of any dewatering required during construction will be dependent on
the actual groundwater conditions prevalent at the time of construction and the
effectiveness of construction drainage to prevent run-off into open excavations.
5.4 FOUNDATIONS
5.4.1 Shallow Foundations on Soil – Performance Arts Center and Cafeteria
Expansion
Design: We understand the new PAC will produce maximum column and wall
loads on the order of 55 kips and 5.75 klf, respectively. Structural loading
information was not provided for the cafeteria expansion; however, based on
our experience with similar projects, we assume maximum column and
continuous wall loads on the order of 150 kips and 4 kips per lineal foot (klf),
respectively.
After the recommended site and subgrade preparation and fill placement, we
recommend that the PAC structure and cafeteria expansion structure be
supported by conventional shallow foundations. Foundations bearing on
undisturbed residual soils and/or compacted structural fill may be designed for
a maximum allowable bearing pressure of 2,500 pounds per square foot (psf).
Previously placed fill materials were encountered on the site. In the event that
low consistency or debris-laden fill materials are present in foundation
excavations, undercutting and backfilling with crushed stone or structural fill or
redesigning for a reduced bearing pressure, may be required.
Settlement: Settlements for foundations bearing on the higher consistency
residual materials were assessed using SPT values to estimate elastic modulus,
based on published correlations and previous NOVA experience. We note that
the settlements presented are based on random field data and an assumed
subsoil profile. Conditions may be better or worse in other areas, however, we
believe the estimated settlements are reasonably conservative.
Based on wall loadings, soil bearing capacities and the presumed foundation
elevations as discussed above, we expect primary total settlement beneath
individual foundations to be on the order of 1 inch or less. We note that the total
settlement will be equal to the differential settlement between the new structures
and immediately adjacent structures.

Geotechnical Engineering Report June 27, 2018 (Revised September 26, 2019) Campbell High School Performance Hall & Classroom Addition NOVA Project Number 2018090.2
Page 18
The amount of differential settlement is difficult to predict because the
subsurface and foundation loading conditions can vary considerably across the
site. However, we anticipate differential settlement of ¼ inch. The final deflected
shape of the structure will be dependent on actual foundation locations and
loading.
As previously discussed, existing fill was encountered to depths of up to 23 feet
below the existing ground surface beneath the footprint of the proposed PAC.
Additionally, alluvial soils were encountered immediately beneath the existing fill
in the area of the southeast corner in B-11 and N-1 at depths of 23 and 18 feet
below existing grade, respectively. Our experience with this type of soil indicates
that some time-dependent settlements could occur due to alternating wetting
and drying cycles causing loose alluvial soils to further settle. The magnitude of
settlement will be in addition to that caused by structural loading, and could be
significant enough to cause localized minor cracking of exterior walls, minor
cracking of concrete floor slabs, and minor settlement of the floor slab relative to
footing-supported exterior walls, particularly in the area of B-11 and N-1. This
area should be periodically monitored, and we anticipate that aesthetic repairs,
may be needed periodically, if any repairs are needed.
Construction: Foundation excavations should be evaluated by the NOVA
geotechnical engineer prior to reinforcing steel placement to observe
foundation subgrade preparation and confirm bearing pressure capacity.
Foundation excavations should be level and free of debris, ponded water, mud,
and loose, frozen, or water-softened soils. Concrete should be placed as soon
as is practical after the foundation is excavated and the subgrade evaluated.
Foundation concrete should not be placed on frozen or saturated soil. If a
foundation excavation remains open overnight, or if rain or snow is imminent,
a 3 to 4-inch thick "mud mat" of lean concrete should be placed in the bottom
of the excavation to protect the bearing soils until reinforcing steel and concrete
can be placed.
5.4.2 Shallow Foundations with Selective Undercutting - Three-Story Classroom
Based upon the maximum column loads on the order of 165 and 230 kips, we
estimate total settlements on the order of 1¼ to 1¾ inches. In addition, we note
that the total settlement will be equal to the differential settlement between the
new structures and immediately adjacent structures. If these settlements are not
tolerable to the structural engineer, the three-story classroom may be supported
on shallow foundations bearing on existing soils in areas of lighter loads, or with
a program of undercutting existing soils and replacing with compacted #57 stone
in areas of heavier loads. We anticipate that undercutting of up to 4 feet may be
Geotechnical Engineering Report June 27, 2018 (Revised September 26, 2019) Campbell High School Performance Hall & Classroom Addition NOVA Project Number 2018090.2
Page 19
required for the heaviest loads on the order of 230 kips. Determination of
required undercutting would be performed on a column by column basis once all
final loads are known. Upon undercutting, the subgrades would be acceptable
for a maximum allowable bearing pressure of 2,500 psf.
5.4.3 Shallow Foundations on Aggregate Piers or Rigid Inclusions- Three-Story
Classroom
Aggregate Piers: As an option to selective undercutting, the structure may be
supported by conventional shallow foundations bearing on an improved
subgrade that has been remediated by the installation of an Aggregate Pier (AP)
system. The AP system will improve the density of the underlying residual soil and
help reduce differential settlements.
Aggregate piers typically consist of 12-inch thick layers of well graded stone
within a drilled shaft 24- to 36-inches in diameter and compacted with a heavy
ram or vibrated in place. The compaction method is usually vibratory and forces
the aggregate into the surrounding soils increasing the density. Aggregate Piers
usually allow a bearing pressure on the order of 6 ksf for a conventional
foundation system and are typically designed to accommodate for 1 inch or less
of settlement.
It should be noted that there is no structural connection between aggregate
piers and shallow foundations. If the structure experiences moderate to high
lateral loads at the footing that cannot be resisted by the foundation or slab,
aggregate piers typically do not provide additional lateral resistance. Therefore,
if the shear cannot be resisted by the shallow foundations or slabs-on-grade, a
key wall to resist the additional shear should be considered.
The installation criteria for the APs should be verified by performing a load test in
general accordance with ASTM standard D1143. The load test should be carried
out to at least 1½ times the design load. Preferably, the test pier should be
loaded to failure to more accurately determine ultimate working capacities and
recommended working loads.
5.5 SLAB-ON-GRADE
The conditions exposed at subgrade levels will consist of fill and residual soils. Slabs-on-
grade may be adequately supported on these subgrade conditions subject to the
recommendations in this report. Slabs-on-grade should be jointed around columns and
along walls to reduce cracking due to differential movement.

Geotechnical Engineering Report June 27, 2018 (Revised September 26, 2019) Campbell High School Performance Hall & Classroom Addition NOVA Project Number 2018090.2
Page 20
An underdrain system is not required. However, we recommend a minimum of 6-inches
of graded aggregate base (GAB) beneath the slabs to:
• Reduce non-uniform support conditions
• Provide a stable base to support construction traffic
• Provide a base material that can be fine graded to design tolerances.
GAB should be compacted to 98 percent of the maximum dry density as determined
by the modified Proctor compaction test (ASTM D 1557) and overlain by a conventional
plastic vapor barrier. Typical vapor barrier thicknesses are on the order of 6 mil.
Once grading is completed, the subgrade is usually exposed to adverse construction
activities and weather conditions during the period of sub-slab utility installation. The
subgrade should be well-drained to prevent the accumulation of water. If the exposed
subgrade becomes saturated or frozen, the geotechnical engineer should be
consulted.
After utilities have been installed and backfilled, a final subgrade evaluation should be
performed by the geotechnical engineer immediately prior to slab-on-grade placement.
If practical, proofrolling may be used to redensify the surface and to detect any soil
that has become excessively wet or otherwise loosened.
5.6 BELOW GRADE WALLS
The magnitude and distribution of earth pressures against below grade walls depends
on the deformation condition (rotation) of the wall, soil properties and water conditions.
When the soil behind the wall is prevented from lateral strain, the resulting force is
known as the at-rest earth pressure (KO). If the retaining structure moves away from
the soil mass, the earth pressure decreases with the increasing lateral expansion until
a minimum pressure, known as the active earth pressure (KA), is reached. If the wall is
forced into the soil mass, the earth pressure increases until a maximum pressure,
known as the passive earth pressure (KP), is obtained.
Free-standing retaining walls are usually designed for active earth pressures. Rigid
basement walls are typically designed for at-rest earth pressures. If basement walls
will be backfilled before they are braced by the floor slabs, they should also be
designed to withstand active earth pressures as self-supporting cantilever walls.
However, the earth pressures must be compatible with the wall rotation, which is
limited by the wall rigidity, foundation support conditions and connections to adjoining
structures. If active earth pressure development requires horizontal wall movements
that cannot occur, or which are architecturally undesirable, walls should be designed
for an intermediate pressure based on restraint conditions.

Geotechnical Engineering Report June 27, 2018 (Revised September 26, 2019) Campbell High School Performance Hall & Classroom Addition NOVA Project Number 2018090.2
Page 21
Laboratory analysis to determine actual soil shear strength properties was beyond the
authorized scope of services. Based on our experience with similar soils and
construction, we have provided the earth pressure estimates shown in the following
table:
Earth Pressure
Condition
Earth Pressure
Coefficient
Equivalent Fluid Pressure (pcf)
Above Water Table Below Water Table
Soil Backfill
Active (Ka) 0.33 40 80
At-Rest (Ko) 0.50 60 89
Passive (Kp) 3.00 150* TBD**
#57 Stone Backfill
Active (Ka) 0.29 35 75
At-Rest (Ko) 0.46 55 84
Passive (Kp) 3.40 400* TBD**
* Passive earth pressure is frequently used in retaining wall design to resist active earth
pressures. Wall movements required to develop full passive earth pressures are significantly
greater than movements necessary for active earth pressures. Consequently, this passive
pressure value has been reduced by at least 50% for wall design
** Passive earth pressure for submerged wall design shall be determined on a case-by-case
basis.
We recommend a value of 0.35 as the coefficient of friction (sliding resistance)
between wall foundations and the underlying residual or fill soils. This design value
does not contain a safety factor.

Geotechnical Engineering Report June 27, 2018 (Revised September 26, 2019) Campbell High School Performance Hall & Classroom Addition NOVA Project Number 2018090.2
Page 22
Our lateral earth pressure recommendations assume that:
• The ground surface adjacent to the wall is level,
• Residual soils will be reused for wall backfill, compacted between 95% to 98%
of the standard proctor maximum dry density,
• Soil backfill weight is a maximum of 120 pcf,
• Heavy construction equipment does not operate within 5 feet of the walls,
• A constantly functioning drainage system is installed between the wall and the
soil backfill to prevent hydrostatic pressures from acting on the wall,
• Foundations or other significant surcharge loads are located outside the wall a
distance at least equal to the wall height,
• For active earth pressure, wall must rotate about base, with top lateral
movements of about 0.002 H to 0.004 H, where H is wall height.
• For passive earth pressure to develop, wall must move horizontally to mobilize
resistance.
5.7 SEISMIC SOIL SITE CLASSIFICATION
In accordance with Section 1613.3.2 of the 2012 International Building Code (IBC), the
seismic Site Class was estimated using the standard penetration resistance values
obtained from the soil test borings performed during this study. Based upon this analysis,
and our knowledge of general subsurface conditions in the area, we believe the soil
profiles associated with a Site Class “D” are generally appropriate for this site.

Geotechnical Engineering Report June 27, 2018 (Revised September 26, 2019) Campbell High School Performance Hall & Classroom Addition NOVA Project Number 2018090.2
Page 23
6.0 BEDROCK MOTION STUDY
6.1 INTRODUCTION
The objective of this Seismic Hazard Study was to estimate bedrock motions at varying
natural frequencies with a 2% probability of exceedance in 50 years, and to calculate
the resulting levels of maximum considered earthquake spectral response design
acceleration at short periods (SDS) and at a 1-second period (SD1) for comparison to the
spectral response acceleration maps presented in the 2012 International Building Code
(IBC) (Section 1613.3.1). Specifically, the seismic hazard study provides the following:
• Discussion of regional and historical seismicity.
• Discussion of the seismic source zones.
• Discussion of the probabilistic analysis used in seismic hazard modeling.
• Presentation of the results of the bedrock motion model.
6.2 HISTORICAL SEISMICITY
The assessment of historical seismicity includes a review of earthquakes known from
descriptions or damage records, as well as from instrument records. Most earthquakes
which occur in the United States are located in the seismically active western portion of
the country, with earthquake records going back about 200 years. The eastern United
States is generally considered an area of low historical seismicity, with records that date
back about 350 years. However, most damaging earthquakes in the east occurred prior
to the establishment of reliable seismic instrument recording in the early 1900s.
Seismic stations were not established in the Southeast until the 1960s. Consequently,
earthquake data for the southeastern United States has been derived primarily from
anecdotal seismic event descriptions.
6.2.1 Earthquake Size: The size of an earthquake is an important parameter in
assessing seismic hazards. Historically, the characterization of earthquake size
was based on qualitative descriptions of the earthquake’s effect and damage.
Recently, earthquake engineers and seismologists have developed a number
of quantitative measures of the size of earthquakes, based on seismic
instrument data.
6.2.2 Earthquake Magnitude: Seismic instruments allow a qualitative measurement
of earthquake size, called earthquake magnitude. Typically, the energy
released is described by the amplitude of waves measured by seismographs,
with corrections made for instrument amplification and the distance from the

Geotechnical Engineering Report June 27, 2018 (Revised September 26, 2019) Campbell High School Performance Hall & Classroom Addition NOVA Project Number 2018090.2
Page 24
earthquake epicenter (epicentral distance). Frequently used magnitude scales
are described below:
ML The Richter local magnitude (ML) scale, developed by Charles Richter in
1935, is defined as the base ten logarithm of the maximum amplitude
of deflection of a standard Wood-Anderson seismograph located 100
kilometers from the epicenter of the earthquake. Originally, it was
meant only for shallow local earthquakes in Southern California. ML has
since been extended to other types of seismographs and other tectonic
regions. However, the Richter local magnitude scale is not always
comparable between regions and may not be the most appropriate scale
for earthquake size description.
Ms The Richter local magnitude scale does not distinguish between
different types of waves. At large epicentral distances, the resulting
motion is typically dominated by surface waves. The surface wave
magnitude (Ms), developed by Gutenberg and Richter in 1936, used the
amplitude of Rayleigh waves with a period of about 20 seconds. The
surface wave magnitude is usually used to describe shallow (<70 km),
distant (>1000 km), moderate to large earthquakes (magnitudes of 5 to
7.5).
mb Surface waves are often too small for reliable evaluation of deep-
focused earthquakes. The body wave magnitude (mb), developed by
Gutenberg in 1945, uses the amplitude of compression waves (p-waves)
to evaluate distant earthquakes. Subsequent developments by Nuttli
(mbLg) and Herrmann and Kiiko (mLg) are used to describe intraplate
earthquakes at closer distances. Body wave magnitude is typically used
for earthquakes with magnitudes of 3 to 7.
Mw As the amount of released energy increases, the ground-shaking
characteristics measured by ML, Mb and Ms become less sensitive to the
earthquake size, producing a phenomenon referred to as “saturation”.
The Richter local magnitude and the body wave magnitude saturate at
magnitudes of 6 to 7, while the surface wave magnitude saturates at a
magnitude of about 8. The moment magnitude (Mw), developed by
Kanamori in 1977, does not use a magnitude scale based on ground-
shaking levels and therefore does not saturate. The moment magnitude
uses seismic moment calculated from fault displacement and fault
rupture area to describe very large earthquakes, typically with
magnitudes >7.5.

Geotechnical Engineering Report June 27, 2018 (Revised September 26, 2019) Campbell High School Performance Hall & Classroom Addition NOVA Project Number 2018090.2
Page 25
Saturation of Earthquake Magnitude Scales
ML –
Ms –
mb –
Mw –
Richter Local Magnitude Surface Wave Magnitude Short period Body wave Magnitude Moment Magnitude
6.2.3 Earthquake Intensity: The oldest method of earthquake characterization is
earthquake intensity, which is a qualitative description of an earthquake’s
effect at a specific location. Because earthquake descriptions date back as far
as 3,000 years (China), the concept of intensity can be applied to historical
accounts to estimate the size and location of seismic events that preceded
instrumentation. Earthquake engineers and seismologists have developed
measuring scales to quantify the size of earthquakes, based on this anecdotal
data. Typically, the energy release of the earthquake is described by the level
of ground motion experienced and damage noted by observers.
The most commonly used scale is the modified Mercalli intensity scale (MMI),
developed by the Italian seismologist Mercalli and modified in 1931 to better
represent conditions in California.

Geotechnical Engineering Report June 27, 2018 (Revised September 26, 2019) Campbell High School Performance Hall & Classroom Addition NOVA Project Number 2018090.2
Page 26
Modified Mercalli Intensity Scale
I Not felt except by a very few under especially favorable circumstances
II Felt by only a few persons at rest, especially on upper floors of buildings; delicately suspended objects may swing
III Felt quite noticeably indoors, especially on upper floors of buildings, but many people do not recognize it as an earthquake; standing motor cars may rock slightly; vibration like passing of truck; duration estimated.
IV During the day felt indoors by many, outdoors by few; at night some awakened; dishes, windows, doors disturbed; walls make cracking sound; sensation like heavy truck striking building; standing motor cars rocked noticeably.
V Felt by nearly everyone, many awakened; some dishes, windows, etc., broken; a few instances of cracked plaster; unstable objects overturned; disturbances of trees, piles, and other tall objects sometimes noticed; pendulum clocks may stop.
VI Felt by all, many frightened and run outdoors; some heavy furniture moved; a few instances of fallen plaster or damaged chimneys; damage slight.
VII Everybody runs outdoors; damage negligible in buildings of good design and construction, slight to moderate in well-built ordinary structures, considerable in poorly built or badly designed structures; some chimneys broken; noticed by persons driving motor cars.
VIII Damage slight in specially designed structures, considerable in ordinary substantial buildings, with partial collapse, great in poorly built structures; panel walls thrown out of frame structures; fall of chimneys, factory stacks, columns, monuments, walls; heavy furniture overturned; sand and mud ejected in small amounts; changes in well water; persons driving motor cars disturbed.
IX Damage considerable in specially designed structures; well-designed frame structures thrown out of plumb; great in substantial buildings, with partial collapse; buildings shifted off foundations; ground cracked conspicuously; underground pipes broken.
X Some well-built wooden structures destroyed; most masonry and frame structures destroyed with foundations; ground badly cracked; rails bent; landslides considerable from river banks and steep slopes; shifted sand and mud; water splashed over banks.
XI Few, if any masonry structures remain standing; bridges destroyed; broad fissures in ground; underground pipelines completely out of service; earth slumps and land slips in soft ground; rails bent greatly.
XII Damage total; practically all works of construction are damaged greatly or destroyed; waves seen on ground surface; lines of sight and level are distorted; objects thrown into the air.

Geotechnical Engineering Report June 27, 2018 (Revised September 26, 2019) Campbell High School Performance Hall & Classroom Addition NOVA Project Number 2018090.2
Page 27
6.2.4 Tectonic Seismicity: The site is in an area of historically low tectonic activity. A
review of the plot of earthquakes in the Central and Eastern United States
(Figure 6 in Appendix A) reveals distinct seismic activity trends within Georgia.
The mountainous area of north and northwest Georgia has a relative
concentration of seismic activity. A second area of seismic activity is located
along the Georgia / South Carolina border, with an extension into Central
Georgia near Milledgeville. Additional earthquake activity in Georgia is often
associated with large reservoirs.
The faults associated with regional seismicity are typically not exposed at the
ground surface and the low occurrence of earthquakes makes delineation and
assessment of the tectonic structures difficult. However, within the southeastern
U.S., a general trend of seismicity roughly parallels the Appalachian Mountains
(located north-northwest of the site).
Numerous earthquakes with a magnitude (Mb) in the range of 3.0 to 5.0 have
been experienced in the Appalachian Mountains. Recent earthquakes have
been detected in Hot Springs, NC, August 2005 (Mb) and Niota, TN, October
2005 (Mb). However, the largest earthquakes of concern to the planned
development at this site were not located within the Appalachian Orogen. The
most notable earthquakes located in the eastern and central United States
were the 1811-1812 earthquake series in New Madrid, Missouri and the 1886
Charleston, South Carolina earthquake sequence. These earthquake series
contained seismic events that were felt throughout the southeast and which
have seismic hazard implications for the site.
1811-1812 New Madrid, Missouri Earthquakes - This series of four major earthquakes, which occurred during the winter of 1811-1812, were the largest eastern North America earthquakes in recorded history. The New Madrid earthquakes occurred in an area extending from southeastern Missouri and northwestern Tennessee into northeastern Arkansas. Modified Mercalli intensities for the three largest earthquakes are listed as XI, with an estimated Mb of 7.1 to 7.3.
Damage in the epicenter included ground failure, landslides and ground
subsidence. The Missouri towns of New Madrid, Little Prairie and Big Prairie
were destroyed. Damage occurred to buildings as far away as Cincinnati, Ohio
and Saint Louis, Missouri. The actual number of people killed by the
earthquake is unknown.

Geotechnical Engineering Report June 27, 2018 (Revised September 26, 2019) Campbell High School Performance Hall & Classroom Addition NOVA Project Number 2018090.2
Page 28
1886 Charleston, South Carolina Earthquakes - On the night of August 16, 1886, a large earthquake occurred near Charleston, South Carolina. The main shock lasted about one minute and resulted in about 60 deaths and severe damage to the city of Charleston. Effects in the epicenter included distorted and dislocated railroad tracks, ground surface distress and settlement, damage to most buildings, and areas of horizontal displacement. The earthquake magnitude estimated from the damage and reported effects data indicate Mb ranged from 6.5 to 7.1.
The Charleston earthquake was felt throughout most of the Eastern United
States. Ground motion was generally noted in the area eastward from the
Mississippi Valley and southward from the Great Lakes. Modified Mercalli
Intensities ranged from V to X in North and South Carolina, and ranged from II
to VIII in Georgia. The intensities were greatly affected by the nature of the
subsurface conditions underlying any specific location. Sites with soft alluvial
sediments were reported to have higher intensities than sites with more
consolidated sediments or residual soil support.
Liquefaction features such as sand blows, large craters, and fissures, were
frequently noted near the epicenter of the Charleston earthquake. Liquefaction
features were also reported throughout the coastal plain of South Carolina, as
far as 100 miles from Charleston.
The earthquake of August 16, 1886 was followed by a sequence of aftershocks
that gradually diminished in magnitude and frequency over several years. Such
a long aftershock period is somewhat unusual for an area of low historic and
current seismic activity. The frequency of inland earthquakes also increased
following the 1886 Charleston earthquake.
6.2.5 Reservior-Induced Seismicity: The phenomenon of reservoir-induced
earthquakes has been noted with several reservoirs in the southeast. In
contrast to tectonic-based earthquakes, reservoir-induced earthquakes
typically have larger numbers of smaller magnitude events. Reservoir-induced
earthquakes typically occur in swarms with earthquakes clustered in time and
location. Reservoir-induced earthquakes often seem to correlate to rapid
changes of water level, with seismic activity frequently the greatest during the
filling of the reservoir. Consequently, while the earthquakes may be related to
unknown geologic properties of the Piedmont region, the increase in porewater
pressure that migrates rapidly away from the reservoir after filling may
sufficiently reduce the rock strength to allow rupture.

Geotechnical Engineering Report June 27, 2018 (Revised September 26, 2019) Campbell High School Performance Hall & Classroom Addition NOVA Project Number 2018090.2
Page 29
6.3 SEISMIC HAZARD ANALYSIS METHODS
6.3.1 Earthquake Catalogs
Data from seismic recording stations around the U.S. have been compiled into
numerous databases or earthquake catalogs. The earthquake catalog used in
this analysis was developed by the United States Geologic Survey (2008) for
the Central and Eastern United States (CEUS). For seismic events prior to
instrumentation, the Modified Mercalli Intensity (MMI) scale values have been
converted to body wave magnitude (Mb). The earthquakes included are limited
to events with measured or interpreted Mb > 3. Aftershocks and other
dependent events were removed from the catalog.
6.3.2 Earthquake Source Zones
Until recently, the lack of seismic recording stations in areas of low seismicity in
the southeast resulted in a lack of detection of many small earthquakes and the
imprecise location of those that were detected. Consequently, the exclusive use
of historic seismicity in the southeast United States may not be effective in
predicting where large earthquakes may occur in the future.
Current seismic analysis utilizes the concept of background source zones to
quantify seismic hazard in areas without significant historic seismicity, but which
could produce sizable future earthquakes. A background source zone is a region
characterized by a relatively consistent series of geologic structures. In addition,
special source zones have been developed to quantify the hazards from specific
areas, such as: New Madrid, Missouri; Charleston, South Carolina; and Eastern
Tennessee. The source zones used in this analysis were primarily those resulting
from USGS-Seismic Hazards Mapping Workshop in April 1995.
6.3.3 Probabilistic Analysis
To estimate bedrock motion, seismic hazard studies utilize either a
deterministic or a probabilistic analysis. A deterministic analysis estimates the
historical bedrock motion caused at a site by specific previous seismic events,
such the 1886 Charleston earthquake. A probabilistic analysis estimates the
bedrock motion that a site might experience over a specific period of time
considering all regional seismic sources.

Geotechnical Engineering Report June 27, 2018 (Revised September 26, 2019) Campbell High School Performance Hall & Classroom Addition NOVA Project Number 2018090.2
Page 30
The spectral response acceleration maps in the 2012 International Building
Code (IBC) are based on a target risk of structural collapse equal to 1% in 50
years, with factors to adjust from a geometric mean to a maximum response in
one direction. Since the purpose of this study was to produce acceleration
coefficients that are equivalent to the IBC maps, this seismic hazard
investigation included the probabilistic estimation of bedrock motion in the
vicinity of the site using a magnitude-based bedrock motion model. The results
of our model were modified using Risk Coefficients defined in ASCE 7-10
Minimum Design Loads for Buildings and Other Structures Section 21.2.1.1 to
compare to the IBC mapped values.
The probabilistic seismic hazard analysis (PSHA) utilizes the concepts of
probability theory to consider the uncertainties in the size, location, and
recurrence rate of earthquakes, as well as the variation in ground motion
characteristics associated with earthquake size and location.
The PSHA is generally described as a four-step procedure consisting of:
1) Source Characterization - Identification and characterization of all
earthquake sources capable of producing significant ground motion at
the site. Source characterization includes the definition of each source's
geometry (the source zone) and earthquake potential. Probability
distributions of potential rupture locations are assigned within each
source zone, and then combined within the source geometry to obtain the
corresponding probability distribution of source-to-site distance.
2) Earthquake Recurrence - A recurrence relationship that specifies the
average rate at which an earthquake of some size will be exceeded is then
used to characterize the seismicity of each source zone. The recurrence
relationship may accommodate the maximum earthquake expected but
is not limited to that earthquake as done in a deterministic analysis.
3) Attenuation/Amplification - The potential ground motion at the site
produced by any possible size earthquake at any possible point in each
source zone is then determined using predictive relationships, most
notably the attenuation and/or amplification characteristics of the rock
and overlying soil mass. The inherent uncertainty of predictive
relationships must also be addressed.
4) Computation - The uncertainties in earthquake location, size, and ground
motion prediction are combined to produce the probability that the
ground motion parameters (acceleration, displacement, etc.) under
consideration will be exceeded during a specified time period.

Geotechnical Engineering Report June 27, 2018 (Revised September 26, 2019) Campbell High School Performance Hall & Classroom Addition NOVA Project Number 2018090.2
Page 31
6.3.4 Bedrock Motion Model
A magnitude-based bedrock motion model was used for this study. The model
assumes that the data available is sufficient to estimate previous seismic activity
in the vicinity of the site, and that future seismic activity will be similar to historic
seismic activity. The model also assumes that the distribution between
earthquakes of varying magnitudes (recurrence relationships) can be expressed
by the formula:
Log N = a - bs mb
N number of events equal to or greater than magnitude mb
mb body wave magnitude (typically mbLg)
a, bs constants dependent upon regional seismicity
Attenuation relationships provide an estimate of the decrease of the ground
motion parameter values (most notably the decay of peak ground acceleration
and spectral acceleration) with increased distance from the seismic source.
Attenuation relationships in the eastern United States are primarily derived from
random vibration theory and stochastic simulation. Numerous attenuation
models have been developed by the geoscience community to estimate bedrock
motion. For this study, we have used attenuation relationships proposed by Toro
and others (1999) for the mid-continent region to estimate ground motion.
The computer program EZ-FRISK was used to calculate ground motion and
spectral acceleration for various periods of vibration. A design response
spectrum was subsequently determined.
6.4 SEISMIC HAZARD ANALYSIS RESULTS
The results of the probabilistic analysis of seismic hazard are presented in terms of a
site-specific design spectrum and acceleration coefficients.
6.4.1 PSHA Design Spectra
The estimated design response spectrum is shown in Figure 7 in Appendix A as
a plot of the estimated ground motion versus natural frequency at a damping
ratio of 0.05 with a 2% probability of exceedance in 50 years. This plot is a
composite of hazard generated by earthquakes of all sizes at all distances and
shows the mean relative hazard at the site for various frequencies of bedrock
motion.

Geotechnical Engineering Report June 27, 2018 (Revised September 26, 2019) Campbell High School Performance Hall & Classroom Addition NOVA Project Number 2018090.2
Page 32
6.4.2 Acceleration Coefficients
The seismic portion of the 2006 International Building Code (IBC) generally
followed the recommendations presented in the 1997 NEHRP Recommended
Provisions for Seismic Regulations for New Buildings and Other Structures.
NEHRP (National Earthquake Hazards Reduction Program) has identified two
parameters, SS and S1, to characterize the intensity of bedrock shaking
attributable to the maximum considered earthquake (2% probability in 50 years).
These parameters are associated with specific period ranges of a smoothed
response spectrum and are based on a national seismic hazard study conducted
by the U.S. Geological Service. SS is associated with a spectral acceleration with
5% damping at a period of 0.2 seconds for structures founded on firm rock sites.
S1 is associated with the spectral acceleration at a period of 1-second.
The 2012 IBC upgraded the maps to reflect the risk of collapse for a generic
structure and allow for maximum bedrock motion in one direction rather than a
geometric means of all directions. The periods of 0.2 and 1 second for SS and S1,
respectively, are still used for analysis.
ASCE 7-10 allows for a site-specific probabilistic analysis to be performed using
the 2% probability in 50 years, then converting to a risk-based number using a
Risk Coefficient defined in Section 21.2.1.1. These numbers are compared to a
deterministic model created from Site Coefficients obtained from the soil Site
Class to obtain design values for SS and S1. As stipulated in ASCE 7-10, the site-
specific design values cannot be less than 80% of the USGS mapped values.
The hard bedrock in the eastern United States typically exhibits higher shear
wave velocities and lower damping than the rock in the western U.S.;
consequently, ground motions tend to attenuate more slowly. The result of the
lower attenuation is that earthquakes at greater distances (New Madrid,
Charleston, etc.) can have a significant contribution to the longer period (>1-
second) seismic hazard in the eastern US.
As per ASCE 7-10, the response accelerations obtained by the EZ-FRISK analysis
were multiplied by the risk coefficient CR obtained from the included charts. The
resulting modified accelerations were compared to the mapped accelerations
obtained from the USGS maps. The short period (0.2 second) acceleration
design coefficient (SDS) recommended for the proposed site is 0.172g, which
compares to a value of approximately 0.215g interpolated from the map
provided in the 2012 International Building Code (IBC) using a Site Class “D”.
The recommended 1-second acceleration design coefficient (SD1) is 0.119g,
which compares to a value of approximately 0.149g interpolated from the map
provided in the IBC using a Site Class “D”.
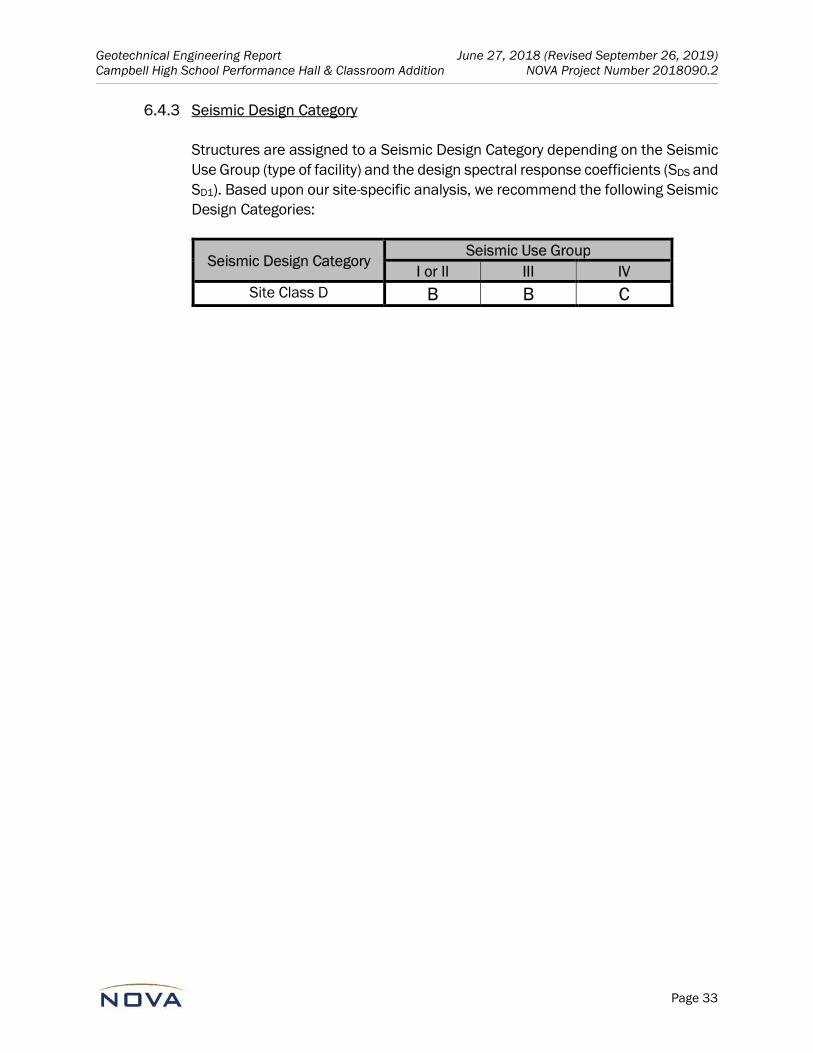
Geotechnical Engineering Report June 27, 2018 (Revised September 26, 2019) Campbell High School Performance Hall & Classroom Addition NOVA Project Number 2018090.2
Page 33
6.4.3 Seismic Design Category
Structures are assigned to a Seismic Design Category depending on the Seismic
Use Group (type of facility) and the design spectral response coefficients (SDS and
SD1). Based upon our site-specific analysis, we recommend the following Seismic
Design Categories:
Seismic Design Category Seismic Use Group
I or II III IV
Site Class D B B C

Geotechnical Engineering Report June 27, 2018 (Revised September 26, 2019) Campbell High School Performance Hall & Classroom Addition NOVA Project Number 2018090.2
Page 34
7.0 CONSTRUCTION OBSERVATIONS
7.1 SHALLOW FOUNDATIONS
Foundation excavations should be level and free of debris, ponded water, mud, and
loose, frozen or water-softened soils. All foundation excavations should be evaluated by
the NOVA geotechnical engineer prior to reinforcing steel placement to observe
foundation subgrade preparation and confirm bearing pressure capacity. Due to
variable site subsurface and construction conditions, some adjustments in isolated
foundation bearing pressures, depth of foundations or undercutting and replacement
with controlled structural fill may be necessary.
7.2 AP FOUNDATIONS
Installation of all aggregate pier foundation (AP) elements should be observed and
documented by a NOVA engineer. Subsequent foundation excavations should be level
and free of debris, ponded water, mud, and loose, frozen or water-softened soils.
7.3 SUBGRADE
Once site grading is completed, the subgrade may be exposed to adverse construction
activities and weather conditions. The subgrade should be well-drained to prevent the
accumulation of water. If the exposed subgrade becomes saturated or frozen, the
NOVA geotechnical engineer should be consulted.
A final subgrade evaluation should be performed by the NOVA geotechnical engineer
immediately prior to pavements or slab-on-grade placement. If practical, proofrolling
may be used to re-densify the surface and to detect any soil, which has become
excessively wet or otherwise loosened.

APPENDIX A
FIGURES AND MAPS

FIGURE 1 SITE LOCATION MAP
SOURCES: Google Maps and Google Earth SCALE: Not to Scale
Cobb County School District Campbell High School Performance Hall &
Classroom Addition Smyrna, Cobb County, Georgia
NOVA Project Number 2018090
Subject Site
Proposed
Construction

FIGURE 2
TOPOGRAPHIC MAP SOURCE: USGS Marietta, Georgia Topographic Map
SCALE: Not to Scale
Cobb County School District Campbell High School Performance Hall &
Classroom Addition Smyrna, Cobb County, Georgia
NOVA Project Number 2018090
Subject Site

FIGURE 3A BORING LOCATION PLAN
SOURCE: Concept Plan provided by Collins Cooper Carusi Architects, Inc. dated March 23, 2018
SCALE: Not to Scale
Cobb County School District Campbell High School Performance Hall &
Classroom Addition Smyrna, Cobb County, Georgia
NOVA Project Number 2018090
APPROXIMATE LOCATION OF NOVA SOIL TEST CIVIL BORINGS
C-2
C-4 C-3
C-1
APPROXIMATE LOCATION OF NOVA SOIL TEST STRUCTUAL BORINGS
B-1
B-2
B-3
B-4
B-5
B-6
B-8
B-9
B-10
B-7
B-11
Updated Estimated Building Footprint
N-1
N-2

FIGURE 3B BORING LOCATION PLAN
SOURCE: Concept Plan provided by Collins Cooper Carusi Architects, Inc. dated March 23, 2018
SCALE: Not to Scale
Cobb County School District Campbell High School Performance Hall
& Classroom Addition Smyrna, Cobb County, Georgia
NOVA Project Number 2018090
APPROXIMATE LOCATION OF NOVA HAND-AUGER BORINGS
H-1
H-2 H-3
B-1
B-2
B-7
B-10
B-9
APPROXIMATE LOCATION OF NOVA SOIL TEST STRUCTUAL BORINGS
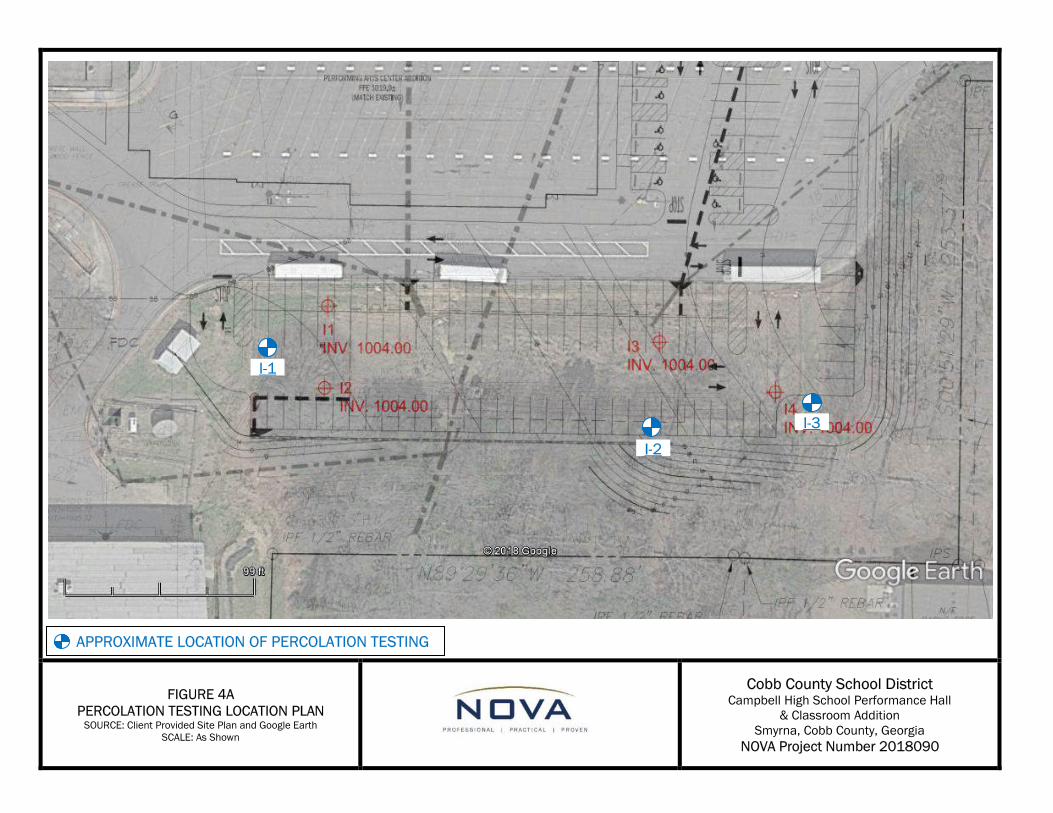
FIGURE 4A PERCOLATION TESTING LOCATION PLAN
SOURCE: Client Provided Site Plan and Google Earth SCALE: As Shown
Cobb County School District Campbell High School Performance Hall
& Classroom Addition Smyrna, Cobb County, Georgia
NOVA Project Number 2018090
APPROXIMATE LOCATION OF PERCOLATION TESTING
I-1
I-2
I-3

FIGURE 4B PERCOLATION TESTING LOCATION PLAN
SOURCE: Client Provided Site Plan prepared by Breedlove Land Planning and Google Earth
SCALE: As Shown
Cobb County School District Campbell High School Performance Hall
& Classroom Addition Smyrna, Cobb County, Georgia
NOVA Project Number 2018090
APPROXIMATE LOCATION OF PERCOLATION TESTING
I-4
I-5

FIGURE 5 REGIONAL GEOLOGY
SOURCE: McConnell and Abrams, 1984 SCALE: Not to Scale
Cobb County School District Campbell High School Performance Hall
& Classroom Addition Smyrna, Cobb County, Georgia
NOVA Project Number 2018090
Subject Site

FIGURE 6 EARTHQUAKE ACTIVITY
Cobb County School District Campbell High School Performance Hall
& Classroom Addition Smyrna, Cobb County, Georgia
NOVA Project Number 2018090

FIGURE 7 DESIGN RESPONSE SPECTRUM
SITE CLASS D
Cobb County School District Campbell High School Performance Hall
& Classroom Addition Smyrna, Cobb County, Georgia
NOVA Project Number 2018090

APPENDIX B
SUBSURFACE DATA
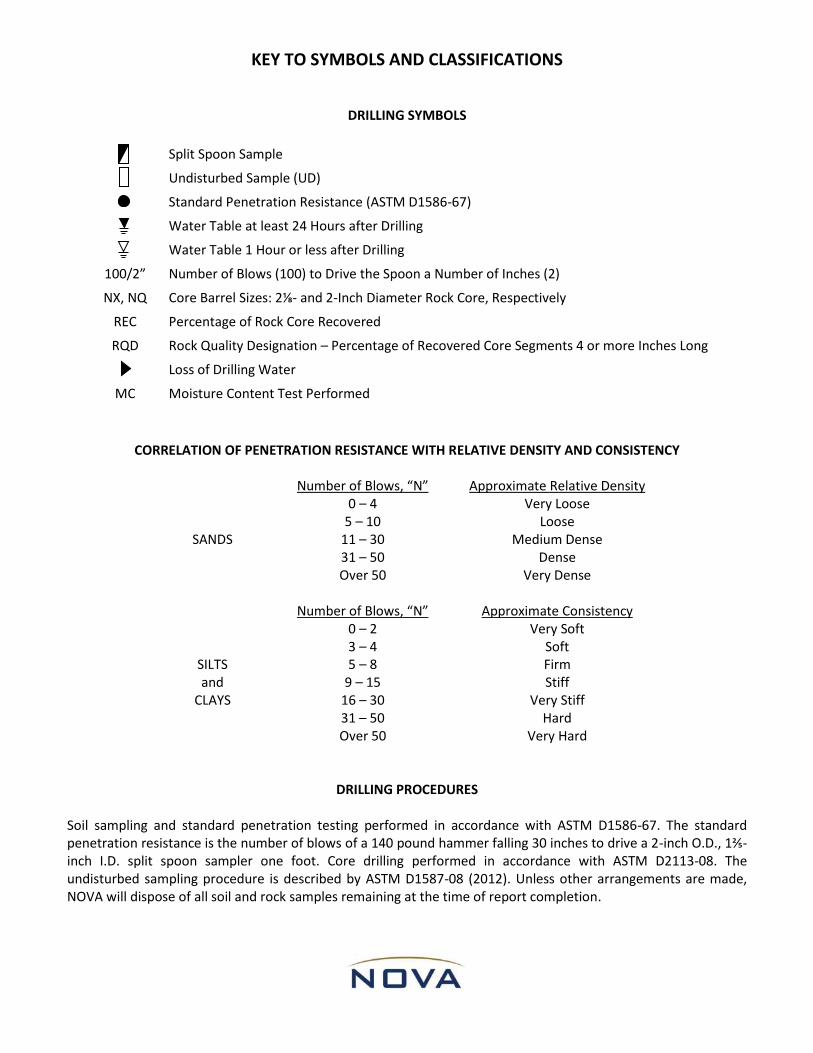
KEY TO SYMBOLS AND CLASSIFICATIONS
DRILLING SYMBOLS
Split Spoon Sample
Undisturbed Sample (UD)
Standard Penetration Resistance (ASTM D1586-67)
Water Table at least 24 Hours after Drilling
Water Table 1 Hour or less after Drilling
100/2” Number of Blows (100) to Drive the Spoon a Number of Inches (2)
NX, NQ Core Barrel Sizes: 2⅛- and 2-Inch Diameter Rock Core, Respectively
REC Percentage of Rock Core Recovered
RQD Rock Quality Designation – Percentage of Recovered Core Segments 4 or more Inches Long
Loss of Drilling Water
MC Moisture Content Test Performed
CORRELATION OF PENETRATION RESISTANCE WITH RELATIVE DENSITY AND CONSISTENCY
Number of Blows, “N” Approximate Relative Density
SANDS
0 – 4 Very Loose 5 – 10 Loose
11 – 30 Medium Dense 31 – 50 Dense Over 50 Very Dense
Number of Blows, “N” Approximate Consistency
SILTS and
CLAYS
0 – 2 Very Soft 3 – 4 Soft 5 – 8 Firm
9 – 15 Stiff 16 – 30 Very Stiff 31 – 50 Hard Over 50 Very Hard
DRILLING PROCEDURES
Soil sampling and standard penetration testing performed in accordance with ASTM D1586-67. The standard penetration resistance is the number of blows of a 140 pound hammer falling 30 inches to drive a 2-inch O.D., 1⅖-inch I.D. split spoon sampler one foot. Core drilling performed in accordance with ASTM D2113-08. The undisturbed sampling procedure is described by ASTM D1587-08 (2012). Unless other arrangements are made, NOVA will dispose of all soil and rock samples remaining at the time of report completion.
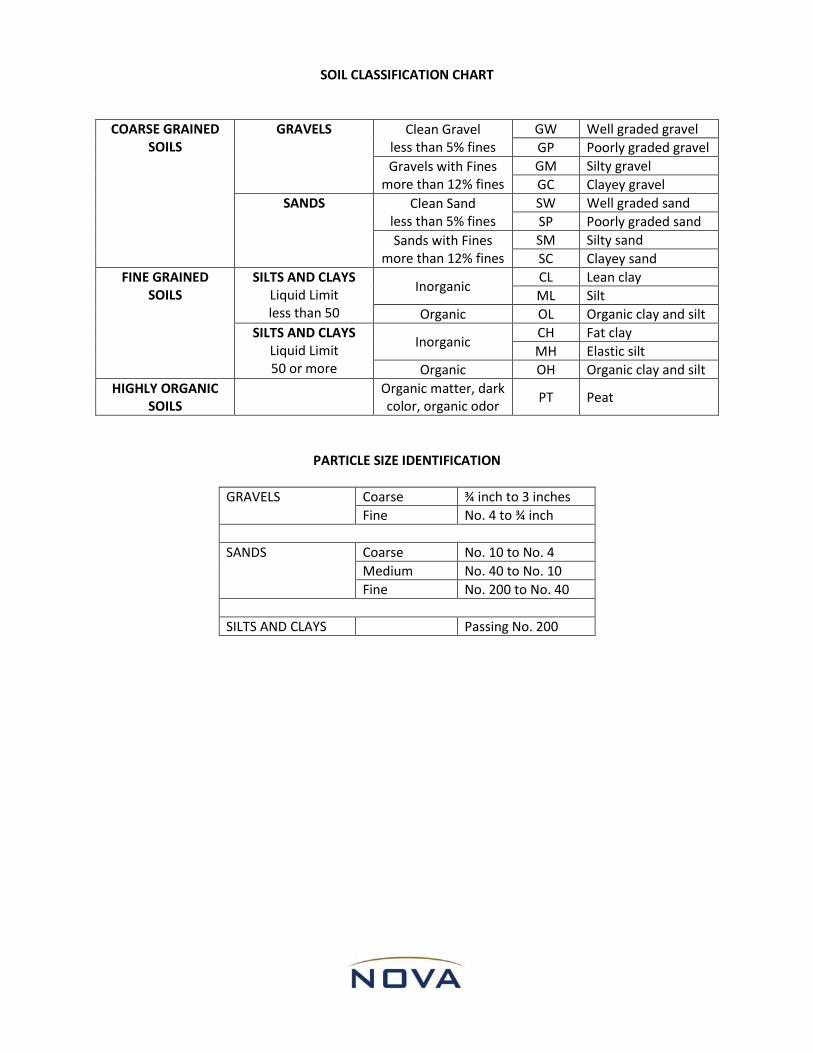
SOIL CLASSIFICATION CHART
COARSE GRAINED SOILS
GRAVELS Clean Gravel less than 5% fines
GW Well graded gravel
GP Poorly graded gravel
Gravels with Fines more than 12% fines
GM Silty gravel
GC Clayey gravel
SANDS Clean Sand less than 5% fines
SW Well graded sand
SP Poorly graded sand
Sands with Fines more than 12% fines
SM Silty sand
SC Clayey sand
FINE GRAINED SOILS
SILTS AND CLAYS Liquid Limit less than 50
Inorganic CL Lean clay
ML Silt
Organic OL Organic clay and silt
SILTS AND CLAYS Liquid Limit 50 or more
Inorganic CH Fat clay
MH Elastic silt
Organic OH Organic clay and silt
HIGHLY ORGANIC SOILS
Organic matter, dark color, organic odor
PT Peat
PARTICLE SIZE IDENTIFICATION
GRAVELS Coarse ¾ inch to 3 inches
Fine No. 4 to ¾ inch
SANDS Coarse No. 10 to No. 4
Medium No. 40 to No. 10
Fine No. 200 to No. 40
SILTS AND CLAYS Passing No. 200

0
5
10
15
20
25
30
35
TOPSOIL: 3 inchesFILL: Loose red brown silty medium to fine SAND with
organics
RESIDUUM: Medium dense white tan gray silty medium tofine SAND
Medium dense brown tan micaceous silty fine SAND
Boring Terminated at 30 ft.
5
9
11
11
13
14
30
12
PROJECT: Campbell High School Additions PROJECT NO.: 2018090
CLIENT: Cobb County School District
PROJECT LOCATION: Smyrna, Cobb County, Georgia
TEST BORINGRECORD
B-1
LOCATION: Three-Story Classroom Addition ELEVATION:
DRILLER: Piedmont Environmental Drilling, Inc. LOGGED BY: T. Steinkoenig
DRILLING METHOD: Hollow Stem Auger DATE: 5/29/2018DEPTH TO - WATER> INITIAL: 20' AFTER 24 HOURS: N/M CAVING> N/E
De
pth
(fe
et)
Ele
vati
on
(ft-
MS
L)
Description
Gra
ph
ic
Gro
un
dw
ate
r
Sa
mp
leTy
pe
N-V
alu
e
Graphic Depiction
10 20 30 40 60 100PLASTIC LIMIT LIQUID LIMIT
NATURAL MOISTURE
BLOW COUNT
Th
is i
nfo
rma
tio
n p
ert
ain
s o
nly
to
th
is b
ori
ng
an
d s
ho
uld
no
t b
e i
nte
rpre
ted
as
be
ing
in
dic
ati
ve
of
the
sit
e.
Page 1 of 1

0
5
10
15
20
25
30
35
ASPHALT: 4 inchesGRADED AGGREGATE BASE: 4 inches
FILL: Medium dense red brown clayey medium to fine SAND
RESIDUUM: Medium dense red brown silty medium to fineSAND
Medium dense white tan brown silty medium to fine SAND
Medium dense tan brown micaceous silty fine SAND
Medium dense white tan brown silty medium to fine SAND
Mdium dense tan white brown micaceous silty fine SAND
Boring Terminated at 30 ft.
15
13
10
13
11
16
15
25
PROJECT: Campbell High School Additions PROJECT NO.: 2018090
CLIENT: Cobb County School District
PROJECT LOCATION: Smyrna, Cobb County, Georgia
TEST BORINGRECORD
B-2
LOCATION: Three-Story Classroom Addition ELEVATION:
DRILLER: Piedmont Environmental Drilling, Inc. LOGGED BY: T. Steinkoenig
DRILLING METHOD: Hollow Stem Auger DATE: 5/29/2018DEPTH TO - WATER> INITIAL: 18' AFTER 24 HOURS: N/M CAVING> N/E
De
pth
(fe
et)
Ele
vati
on
(ft-
MS
L)
Description
Gra
ph
ic
Gro
un
dw
ate
r
Sa
mp
leTy
pe
N-V
alu
e
Graphic Depiction
10 20 30 40 60 100PLASTIC LIMIT LIQUID LIMIT
NATURAL MOISTURE
BLOW COUNT
Th
is i
nfo
rma
tio
n p
ert
ain
s o
nly
to
th
is b
ori
ng
an
d s
ho
uld
no
t b
e i
nte
rpre
ted
as
be
ing
in
dic
ati
ve
of
the
sit
e.
Page 1 of 1

0
5
10
15
20
25
30
35
FILL: Loose red brown silty medium to fine SAND
RESIDUUM: Loose brown white silty fine SAND
Medium dense tan micaceous silty fine SAND
Medium dense white tan silty medium to fine SAND
Medium dense to dense tan brown white micaceous siltymedium to fine SAND
Boring Terminated at 30 ft.
6
18
10
16
13
26
19
33
PROJECT: Campbell High School Additions PROJECT NO.: 2018090
CLIENT: Cobb County School District
PROJECT LOCATION: Smyrna, Cobb County, Georgia
TEST BORINGRECORD
B-3
LOCATION: Three-Story Classroom Addition ELEVATION:
DRILLER: Piedmont Environmental Drilling, Inc. LOGGED BY: T. Steinkoenig
DRILLING METHOD: Hollow Stem Auger DATE: 5/29/2018DEPTH TO - WATER> INITIAL: 20' AFTER 24 HOURS: N/M CAVING> N/E
De
pth
(fe
et)
Ele
vati
on
(ft-
MS
L)
Description
Gra
ph
ic
Gro
un
dw
ate
r
Sa
mp
leTy
pe
N-V
alu
e
Graphic Depiction
10 20 30 40 60 100PLASTIC LIMIT LIQUID LIMIT
NATURAL MOISTURE
BLOW COUNT
Th
is i
nfo
rma
tio
n p
ert
ain
s o
nly
to
th
is b
ori
ng
an
d s
ho
uld
no
t b
e i
nte
rpre
ted
as
be
ing
in
dic
ati
ve
of
the
sit
e.
Page 1 of 1

0
5
10
15
20
25
30
35
FILL: Loose red brown silty medium to fine SAND
RESIDUUM: Loose to medium dense tan white brownmicaceous silty medium to fine SAND
Dense white brown silty mediun to fine SAND
Boring Terminated at 30 ft.
6
8
8
10
13
14
30
48
PROJECT: Campbell High School Additions PROJECT NO.: 2018090
CLIENT: Cobb County School District
PROJECT LOCATION: Smyrna, Cobb County, Georgia
TEST BORINGRECORD
B-4
LOCATION: Three-Story Classroom Addition ELEVATION:
DRILLER: Piedmont Environmental Drilling, Inc. LOGGED BY: T. Steinkoenig
DRILLING METHOD: Hollow Stem Auger DATE: 5/29/2018DEPTH TO - WATER> INITIAL: 18' AFTER 24 HOURS: N/M CAVING> N/E
De
pth
(fe
et)
Ele
vati
on
(ft-
MS
L)
Description
Gra
ph
ic
Gro
un
dw
ate
r
Sa
mp
leTy
pe
N-V
alu
e
Graphic Depiction
10 20 30 40 60 100PLASTIC LIMIT LIQUID LIMIT
NATURAL MOISTURE
BLOW COUNT
Th
is i
nfo
rma
tio
n p
ert
ain
s o
nly
to
th
is b
ori
ng
an
d s
ho
uld
no
t b
e i
nte
rpre
ted
as
be
ing
in
dic
ati
ve
of
the
sit
e.
Page 1 of 1

0
5
10
15
20
25
30
35
TOPSOIL: 4 inchesFILL: Medium dense brown red clayey medium to fine SAND
with root fragments
Loose brown red clayey medium to fine SAND
RESIDUUM: Loose tan white black silty medium to fineSAND
Loose tan white black silty medium to fine SAND with roots
Loose white gray tan silty medium to fine SAND
Medium dense tan brown micaceous silty medium to fineSAND
16
8
7
8
9
8
8
11
11
PROJECT: Campbell High School Additions PROJECT NO.: 2018090
CLIENT: Cobb County School District
PROJECT LOCATION: Smyrna, Cobb County, Georgia
TEST BORINGRECORD
B-5
LOCATION: Three-Story Classroom Addition ELEVATION:
DRILLER: Piedmont Environmental Drilling, Inc. LOGGED BY: T. Steinkoenig
DRILLING METHOD: Hollow Stem Auger DATE: 5/30/2018DEPTH TO - WATER> INITIAL: 20' AFTER 24 HOURS: N/M CAVING> N/E
De
pth
(fe
et)
Ele
vati
on
(ft-
MS
L)
Description
Gra
ph
ic
Gro
un
dw
ate
r
Sa
mp
leTy
pe
N-V
alu
e
Graphic Depiction
10 20 30 40 60 100PLASTIC LIMIT LIQUID LIMIT
NATURAL MOISTURE
BLOW COUNT
Th
is i
nfo
rma
tio
n p
ert
ain
s o
nly
to
th
is b
ori
ng
an
d s
ho
uld
no
t b
e i
nte
rpre
ted
as
be
ing
in
dic
ati
ve
of
the
sit
e.
Page 1 of 2

40
45
50
55
60
65
70
Medium dense tan brown micaceous silty medium to fineSAND
Medium dense tan white brown silty medium to fine SAND
PARTIALLY WEATHERED ROCK: Sampled as very dense tanwhite brown silty medium to fine sand
Auger Refusal at 68 ft.
13
14
15
25
30
100/2"
PROJECT: Campbell High School Additions PROJECT NO.: 2018090
CLIENT: Cobb County School District
PROJECT LOCATION: Smyrna, Cobb County, Georgia
TEST BORINGRECORD
B-5
LOCATION: Three-Story Classroom Addition ELEVATION:
DRILLER: Piedmont Environmental Drilling, Inc. LOGGED BY: T. Steinkoenig
DRILLING METHOD: Hollow Stem Auger DATE: 5/30/2018DEPTH TO - WATER> INITIAL: 20' AFTER 24 HOURS: N/M CAVING> N/E
De
pth
(fe
et)
Ele
vati
on
(ft-
MS
L)
Description
Gra
ph
ic
Gro
un
dw
ate
r
Sa
mp
leTy
pe
N-V
alu
e
Graphic Depiction
10 20 30 40 60 100PLASTIC LIMIT LIQUID LIMIT
NATURAL MOISTURE
BLOW COUNT
Th
is i
nfo
rma
tio
n p
ert
ain
s o
nly
to
th
is b
ori
ng
an
d s
ho
uld
no
t b
e i
nte
rpre
ted
as
be
ing
in
dic
ati
ve
of
the
sit
e.
Page 2 of 2
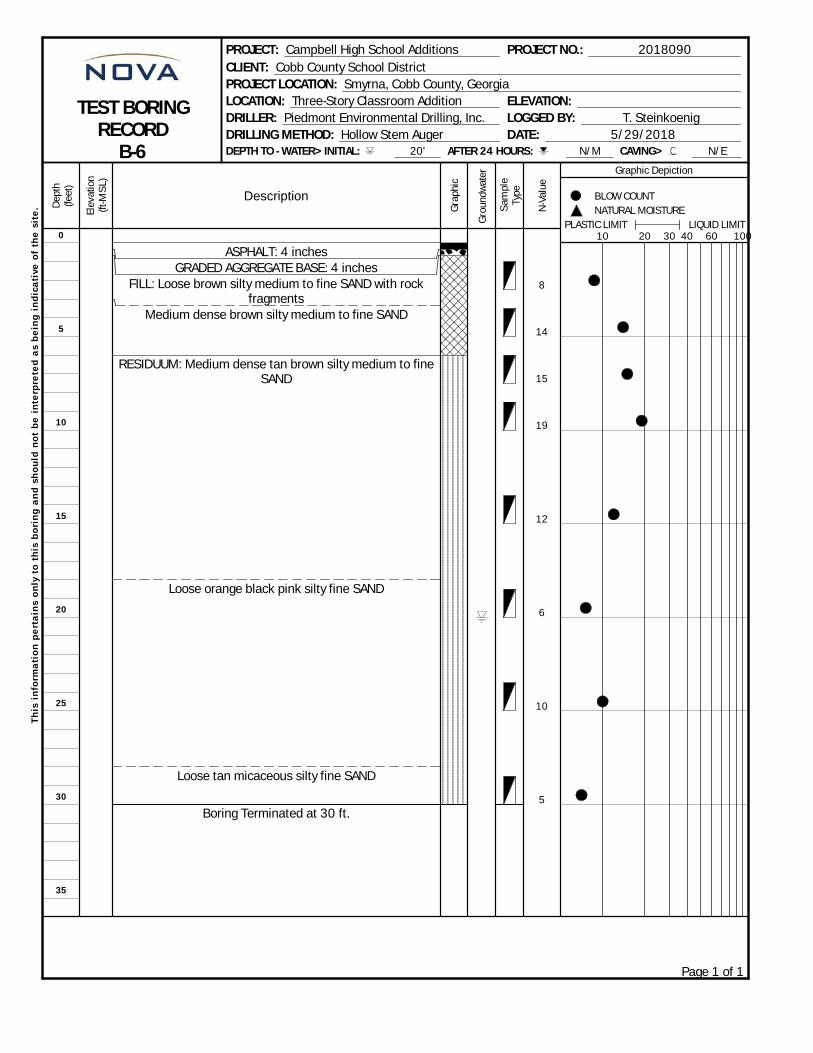
0
5
10
15
20
25
30
35
ASPHALT: 4 inchesGRADED AGGREGATE BASE: 4 inches
FILL: Loose brown silty medium to fine SAND with rockfragments
Medium dense brown silty medium to fine SAND
RESIDUUM: Medium dense tan brown silty medium to fineSAND
Loose orange black pink silty fine SAND
Loose tan micaceous silty fine SAND
Boring Terminated at 30 ft.
8
14
15
19
12
6
10
5
PROJECT: Campbell High School Additions PROJECT NO.: 2018090
CLIENT: Cobb County School District
PROJECT LOCATION: Smyrna, Cobb County, Georgia
TEST BORINGRECORD
B-6
LOCATION: Three-Story Classroom Addition ELEVATION:
DRILLER: Piedmont Environmental Drilling, Inc. LOGGED BY: T. Steinkoenig
DRILLING METHOD: Hollow Stem Auger DATE: 5/29/2018DEPTH TO - WATER> INITIAL: 20' AFTER 24 HOURS: N/M CAVING> N/E
De
pth
(fe
et)
Ele
vati
on
(ft-
MS
L)
Description
Gra
ph
ic
Gro
un
dw
ate
r
Sa
mp
leTy
pe
N-V
alu
e
Graphic Depiction
10 20 30 40 60 100PLASTIC LIMIT LIQUID LIMIT
NATURAL MOISTURE
BLOW COUNT
Th
is i
nfo
rma
tio
n p
ert
ain
s o
nly
to
th
is b
ori
ng
an
d s
ho
uld
no
t b
e i
nte
rpre
ted
as
be
ing
in
dic
ati
ve
of
the
sit
e.
Page 1 of 1
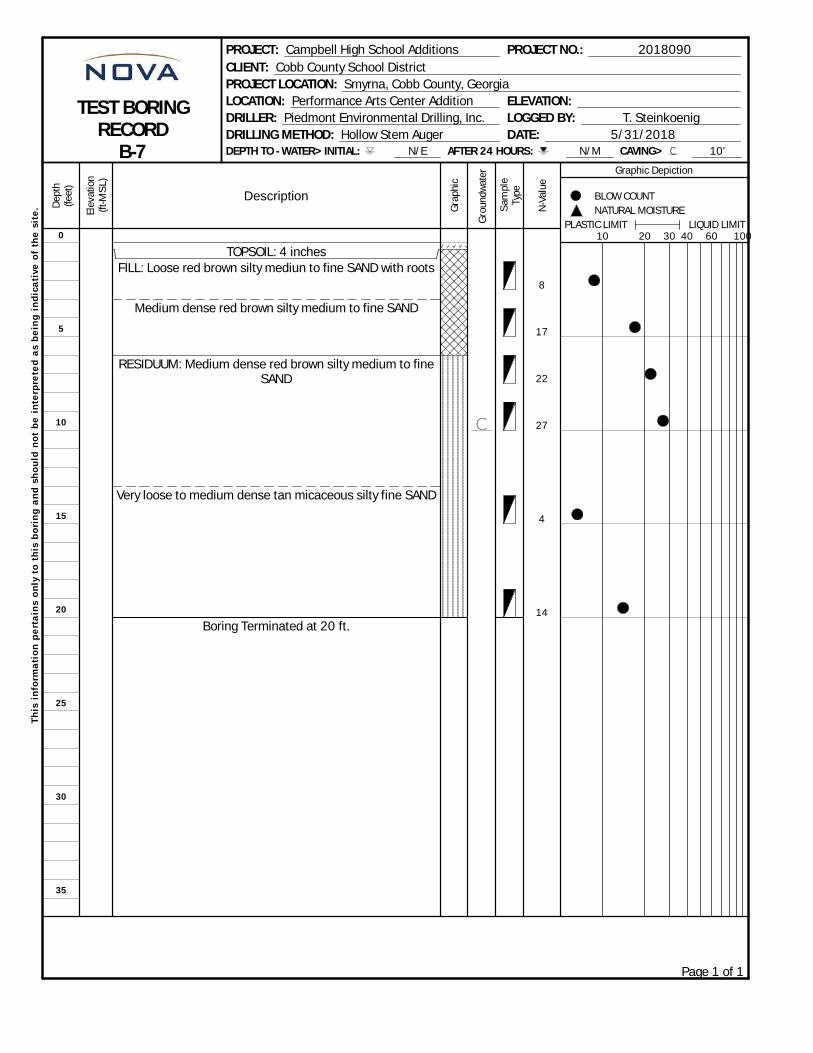
0
5
10
15
20
25
30
35
TOPSOIL: 4 inchesFILL: Loose red brown silty mediun to fine SAND with roots
Medium dense red brown silty medium to fine SAND
RESIDUUM: Medium dense red brown silty medium to fineSAND
Very loose to medium dense tan micaceous silty fine SAND
Boring Terminated at 20 ft.
8
17
22
27
4
14
PROJECT: Campbell High School Additions PROJECT NO.: 2018090
CLIENT: Cobb County School District
PROJECT LOCATION: Smyrna, Cobb County, Georgia
TEST BORINGRECORD
B-7
LOCATION: Performance Arts Center Addition ELEVATION:
DRILLER: Piedmont Environmental Drilling, Inc. LOGGED BY: T. Steinkoenig
DRILLING METHOD: Hollow Stem Auger DATE: 5/31/2018DEPTH TO - WATER> INITIAL: N/E AFTER 24 HOURS: N/M CAVING> 10'
De
pth
(fe
et)
Ele
vati
on
(ft-
MS
L)
Description
Gra
ph
ic
Gro
un
dw
ate
r
Sa
mp
leTy
pe
N-V
alu
e
Graphic Depiction
10 20 30 40 60 100PLASTIC LIMIT LIQUID LIMIT
NATURAL MOISTURE
BLOW COUNT
Th
is i
nfo
rma
tio
n p
ert
ain
s o
nly
to
th
is b
ori
ng
an
d s
ho
uld
no
t b
e i
nte
rpre
ted
as
be
ing
in
dic
ati
ve
of
the
sit
e.
Page 1 of 1

0
5
10
15
20
25
30
35
ASPHALT: 4 inchesGRADED AGGREGATE BASE: 4 inches
FILL: Loose red brown orange silty medium to fine SAND
Loose dark gray clayey fine SAND
RESIDUUM: Medium dense light gray clayey fine SAND
Tan gray white silty medium to fine SAND
Boring Terminated at 25 ft.
9
5
6
8
8
14
23
PROJECT: Campbell High School Additions PROJECT NO.: 2018090
CLIENT: Cobb County School District
PROJECT LOCATION: Smyrna, Cobb County, Georgia
TEST BORINGRECORD
B-8
LOCATION: Performance Arts Center Addition ELEVATION:
DRILLER: Piedmont Environmental Drilling, Inc. LOGGED BY: T. Steinkoenig
DRILLING METHOD: Hollow Stem Auger DATE: 5/30/2018DEPTH TO - WATER> INITIAL: 18' AFTER 24 HOURS: N/M CAVING> N/E
De
pth
(fe
et)
Ele
vati
on
(ft-
MS
L)
Description
Gra
ph
ic
Gro
un
dw
ate
r
Sa
mp
leTy
pe
N-V
alu
e
Graphic Depiction
10 20 30 40 60 100PLASTIC LIMIT LIQUID LIMIT
NATURAL MOISTURE
BLOW COUNT
Th
is i
nfo
rma
tio
n p
ert
ain
s o
nly
to
th
is b
ori
ng
an
d s
ho
uld
no
t b
e i
nte
rpre
ted
as
be
ing
in
dic
ati
ve
of
the
sit
e.
Page 1 of 1

0
5
10
15
20
25
30
35
ASPHALT: 4 inchesGRADED AGGREGATE BASE: 5 inches
FILL: Loose to medium dense brown silty medium to fineSAND
RESIDUUM: Medium dense light gray clayey fine SAND withrock fragments
Loose tan gray micaceous silty fine SAND
Boring Terminated at 20 ft.
9
14
6
9
18
10
PROJECT: Campbell High School Additions PROJECT NO.: 2018090
CLIENT: Cobb County School District
PROJECT LOCATION: Smyrna, Cobb County, Georgia
TEST BORINGRECORD
B-9
LOCATION: Performance Arts Center Addition ELEVATION:
DRILLER: Piedmont Environmental Drilling, Inc. LOGGED BY: T. Steinkoenig
DRILLING METHOD: Hollow Stem Auger DATE: 5/30/2018DEPTH TO - WATER> INITIAL: 15' AFTER 24 HOURS: N/M CAVING> N/E
De
pth
(fe
et)
Ele
vati
on
(ft-
MS
L)
Description
Gra
ph
ic
Gro
un
dw
ate
r
Sa
mp
leTy
pe
N-V
alu
e
Graphic Depiction
10 20 30 40 60 100PLASTIC LIMIT LIQUID LIMIT
NATURAL MOISTURE
BLOW COUNT
Th
is i
nfo
rma
tio
n p
ert
ain
s o
nly
to
th
is b
ori
ng
an
d s
ho
uld
no
t b
e i
nte
rpre
ted
as
be
ing
in
dic
ati
ve
of
the
sit
e.
Page 1 of 1

0
5
10
15
20
25
30
35
ASPHALT: 4 inchesGRADED AGGREGATE BASE: 4 inches
FILL: Loose to medium dense orange brown tan siltymedium to fine SAND
Loose tan brown clayey fine SAND
RESIDUUM: Medium dense gray orange clayey fine SAND
Loose to medium dense orange tan silty fine SAND
Boring Terminated at 20 ft.
8
16
10
21
7
13
PROJECT: Campbell High School Additions PROJECT NO.: 2018090
CLIENT: Cobb County School District
PROJECT LOCATION: Smyrna, Cobb County, Georgia
TEST BORINGRECORD
B-10
LOCATION: Performance Arts Center Addition ELEVATION:
DRILLER: Piedmont Environmental Drilling, Inc. LOGGED BY: T. Steinkoenig
DRILLING METHOD: Hollow Stem Auger DATE: 5/30/2018DEPTH TO - WATER> INITIAL: N/E AFTER 24 HOURS: N/M CAVING> 13'
De
pth
(fe
et)
Ele
vati
on
(ft-
MS
L)
Description
Gra
ph
ic
Gro
un
dw
ate
r
Sa
mp
leTy
pe
N-V
alu
e
Graphic Depiction
10 20 30 40 60 100PLASTIC LIMIT LIQUID LIMIT
NATURAL MOISTURE
BLOW COUNT
Th
is i
nfo
rma
tio
n p
ert
ain
s o
nly
to
th
is b
ori
ng
an
d s
ho
uld
no
t b
e i
nte
rpre
ted
as
be
ing
in
dic
ati
ve
of
the
sit
e.
Page 1 of 1

0
5
10
15
20
25
30
35
ASPHALT 4 inchesGRADED AGGREGATE BASE: 5 inches
FILL: Loose red brown silty medium to fine SAND
Medium dense red brown silty medium to fine SAND withrock fragments
Loose red brown silty medium to fine SAND
Loose gray clayey medium to fine SAND
ALLUVIUM: Loose dark gray clayey fine SAND
RESIDUUM: Very loose light brown micaceous silty fineSAND
Boring Terminated at 30 ft.
8
12
12
9
8
10
8
4
PROJECT: Campbell High School Additions PROJECT NO.: 2018090
CLIENT: Cobb County School District
PROJECT LOCATION: Smyrna, Cobb County, Georgia
TEST BORINGRECORD
B-11
LOCATION: Performance Arts Center Addition ELEVATION:
DRILLER: Piedmont Environmental Drilling, Inc. LOGGED BY: T. Steinkoenig
DRILLING METHOD: Hollow Stem Auger DATE: 5/30/2018DEPTH TO - WATER> INITIAL: 20' AFTER 24 HOURS: N/M CAVING> N/E
De
pth
(fe
et)
Ele
vati
on
(ft-
MS
L)
Description
Gra
ph
ic
Gro
un
dw
ate
r
Sa
mp
leTy
pe
N-V
alu
e
Graphic Depiction
10 20 30 40 60 100PLASTIC LIMIT LIQUID LIMIT
NATURAL MOISTURE
BLOW COUNT
Th
is i
nfo
rma
tio
n p
ert
ain
s o
nly
to
th
is b
ori
ng
an
d s
ho
uld
no
t b
e i
nte
rpre
ted
as
be
ing
in
dic
ati
ve
of
the
sit
e.
Page 1 of 1
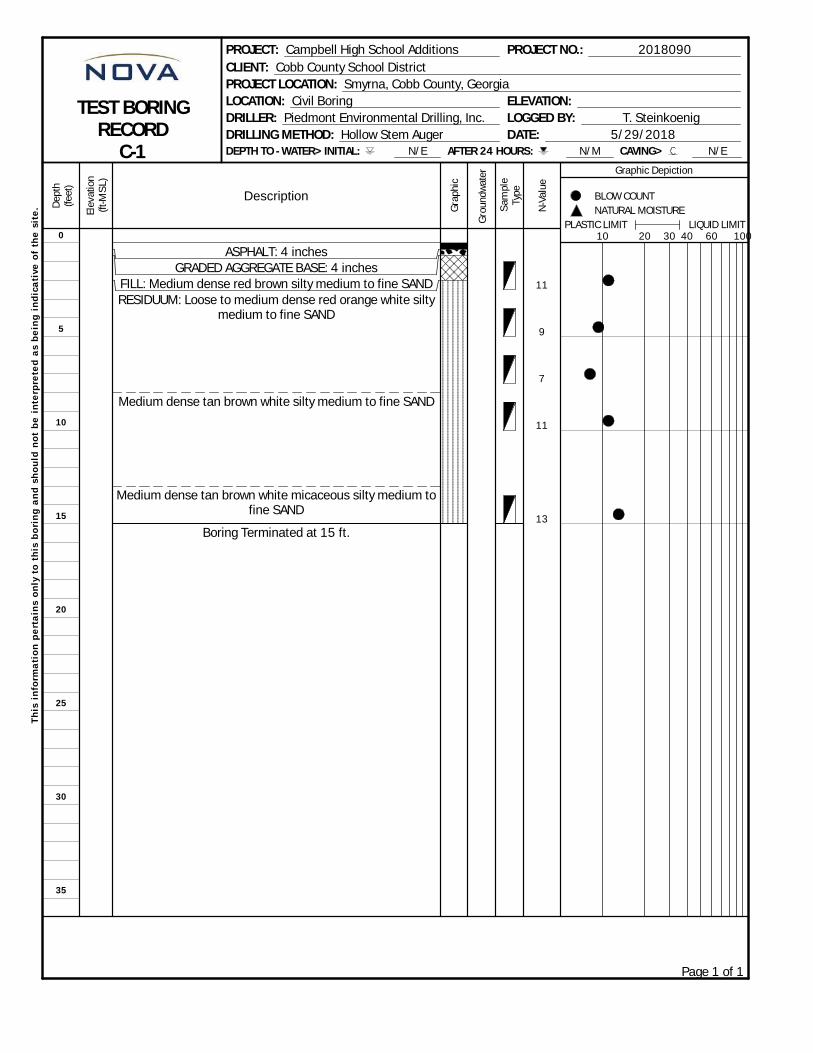
0
5
10
15
20
25
30
35
ASPHALT: 4 inchesGRADED AGGREGATE BASE: 4 inches
FILL: Medium dense red brown silty medium to fine SANDRESIDUUM: Loose to medium dense red orange white silty
medium to fine SAND
Medium dense tan brown white silty medium to fine SAND
Medium dense tan brown white micaceous silty medium tofine SAND
Boring Terminated at 15 ft.
11
9
7
11
13
PROJECT: Campbell High School Additions PROJECT NO.: 2018090
CLIENT: Cobb County School District
PROJECT LOCATION: Smyrna, Cobb County, Georgia
TEST BORINGRECORD
C-1
LOCATION: Civil Boring ELEVATION:
DRILLER: Piedmont Environmental Drilling, Inc. LOGGED BY: T. Steinkoenig
DRILLING METHOD: Hollow Stem Auger DATE: 5/29/2018DEPTH TO - WATER> INITIAL: N/E AFTER 24 HOURS: N/M CAVING> N/E
De
pth
(fe
et)
Ele
vati
on
(ft-
MS
L)
Description
Gra
ph
ic
Gro
un
dw
ate
r
Sa
mp
leTy
pe
N-V
alu
e
Graphic Depiction
10 20 30 40 60 100PLASTIC LIMIT LIQUID LIMIT
NATURAL MOISTURE
BLOW COUNT
Th
is i
nfo
rma
tio
n p
ert
ain
s o
nly
to
th
is b
ori
ng
an
d s
ho
uld
no
t b
e i
nte
rpre
ted
as
be
ing
in
dic
ati
ve
of
the
sit
e.
Page 1 of 1
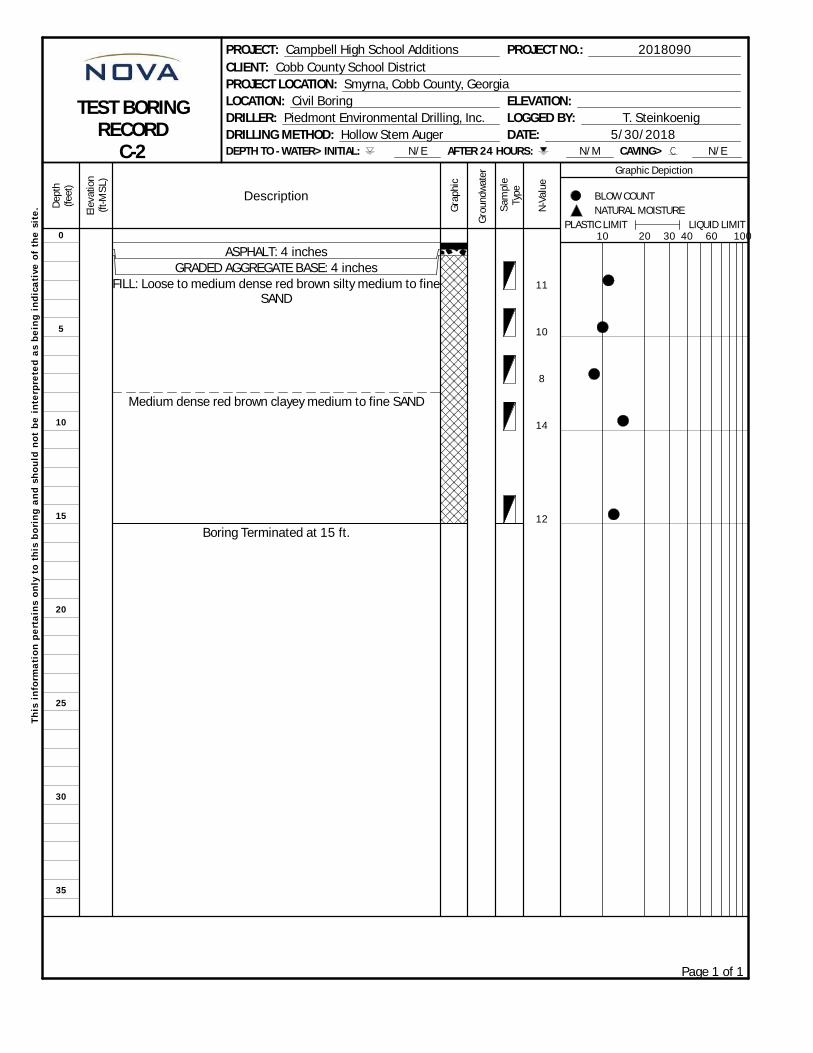
0
5
10
15
20
25
30
35
ASPHALT: 4 inchesGRADED AGGREGATE BASE: 4 inches
FILL: Loose to medium dense red brown silty medium to fineSAND
Medium dense red brown clayey medium to fine SAND
Boring Terminated at 15 ft.
11
10
8
14
12
PROJECT: Campbell High School Additions PROJECT NO.: 2018090
CLIENT: Cobb County School District
PROJECT LOCATION: Smyrna, Cobb County, Georgia
TEST BORINGRECORD
C-2
LOCATION: Civil Boring ELEVATION:
DRILLER: Piedmont Environmental Drilling, Inc. LOGGED BY: T. Steinkoenig
DRILLING METHOD: Hollow Stem Auger DATE: 5/30/2018DEPTH TO - WATER> INITIAL: N/E AFTER 24 HOURS: N/M CAVING> N/E
De
pth
(fe
et)
Ele
vati
on
(ft-
MS
L)
Description
Gra
ph
ic
Gro
un
dw
ate
r
Sa
mp
leTy
pe
N-V
alu
e
Graphic Depiction
10 20 30 40 60 100PLASTIC LIMIT LIQUID LIMIT
NATURAL MOISTURE
BLOW COUNT
Th
is i
nfo
rma
tio
n p
ert
ain
s o
nly
to
th
is b
ori
ng
an
d s
ho
uld
no
t b
e i
nte
rpre
ted
as
be
ing
in
dic
ati
ve
of
the
sit
e.
Page 1 of 1

0
5
10
15
20
25
30
35
TOPSOIL: 4 inchesFILL: Medium dense brown silty medium to fine SAND
Loose to medium dense brown clayey medium to fine SAND
Loose brown silty medium to fine SAND
ALLUVIUM: Loose gray clayey fine SAND
Boring Terminated at 15 ft.
12
9
14
10
4
PROJECT: Campbell High School Additions PROJECT NO.: 2018090
CLIENT: Cobb County School District
PROJECT LOCATION: Smyrna, Cobb County, Georgia
TEST BORINGRECORD
C-3
LOCATION: Civil Boring ELEVATION:
DRILLER: Piedmont Environmental Drilling, Inc. LOGGED BY: T. Steinkoenig
DRILLING METHOD: Hollow Stem Auger DATE: 5/31/2018DEPTH TO - WATER> INITIAL: 13' AFTER 24 HOURS: N/M CAVING> N/E
De
pth
(fe
et)
Ele
vati
on
(ft-
MS
L)
Description
Gra
ph
ic
Gro
un
dw
ate
r
Sa
mp
leTy
pe
N-V
alu
e
Graphic Depiction
10 20 30 40 60 100PLASTIC LIMIT LIQUID LIMIT
NATURAL MOISTURE
BLOW COUNT
Th
is i
nfo
rma
tio
n p
ert
ain
s o
nly
to
th
is b
ori
ng
an
d s
ho
uld
no
t b
e i
nte
rpre
ted
as
be
ing
in
dic
ati
ve
of
the
sit
e.
Page 1 of 1
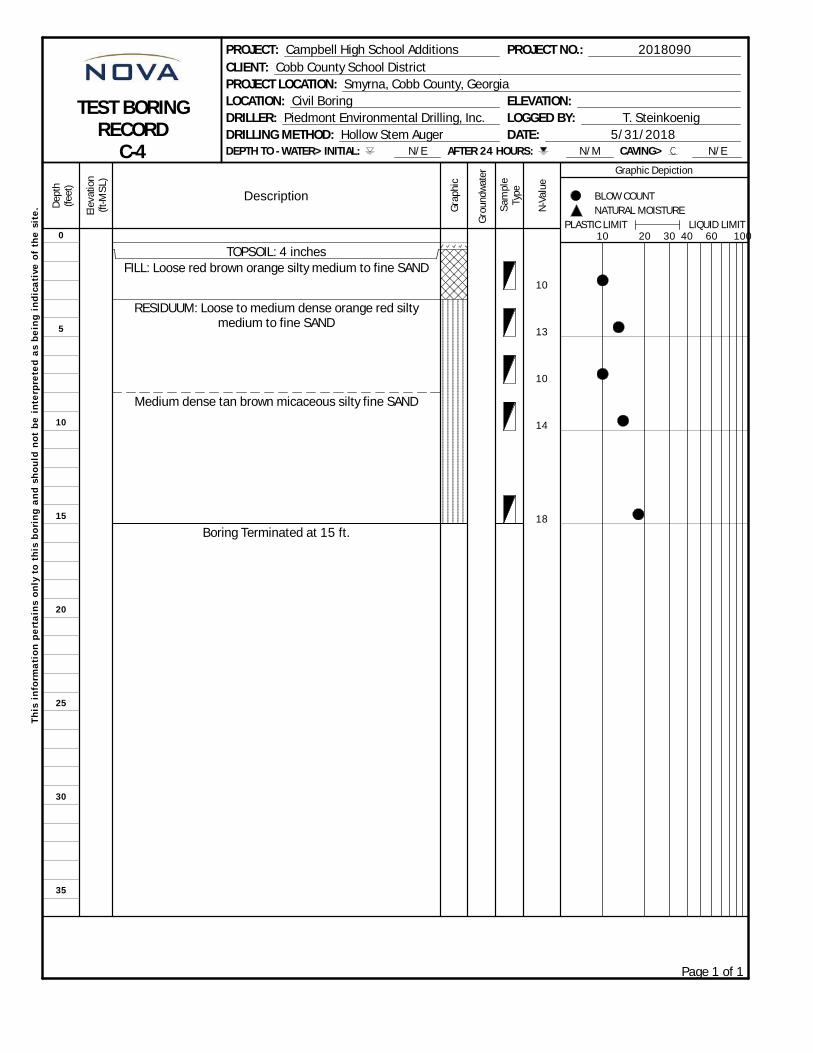
0
5
10
15
20
25
30
35
TOPSOIL: 4 inchesFILL: Loose red brown orange silty medium to fine SAND
RESIDUUM: Loose to medium dense orange red siltymedium to fine SAND
Medium dense tan brown micaceous silty fine SAND
Boring Terminated at 15 ft.
10
13
10
14
18
PROJECT: Campbell High School Additions PROJECT NO.: 2018090
CLIENT: Cobb County School District
PROJECT LOCATION: Smyrna, Cobb County, Georgia
TEST BORINGRECORD
C-4
LOCATION: Civil Boring ELEVATION:
DRILLER: Piedmont Environmental Drilling, Inc. LOGGED BY: T. Steinkoenig
DRILLING METHOD: Hollow Stem Auger DATE: 5/31/2018DEPTH TO - WATER> INITIAL: N/E AFTER 24 HOURS: N/M CAVING> N/E
De
pth
(fe
et)
Ele
vati
on
(ft-
MS
L)
Description
Gra
ph
ic
Gro
un
dw
ate
r
Sa
mp
leTy
pe
N-V
alu
e
Graphic Depiction
10 20 30 40 60 100PLASTIC LIMIT LIQUID LIMIT
NATURAL MOISTURE
BLOW COUNT
Th
is i
nfo
rma
tio
n p
ert
ain
s o
nly
to
th
is b
ori
ng
an
d s
ho
uld
no
t b
e i
nte
rpre
ted
as
be
ing
in
dic
ati
ve
of
the
sit
e.
Page 1 of 1
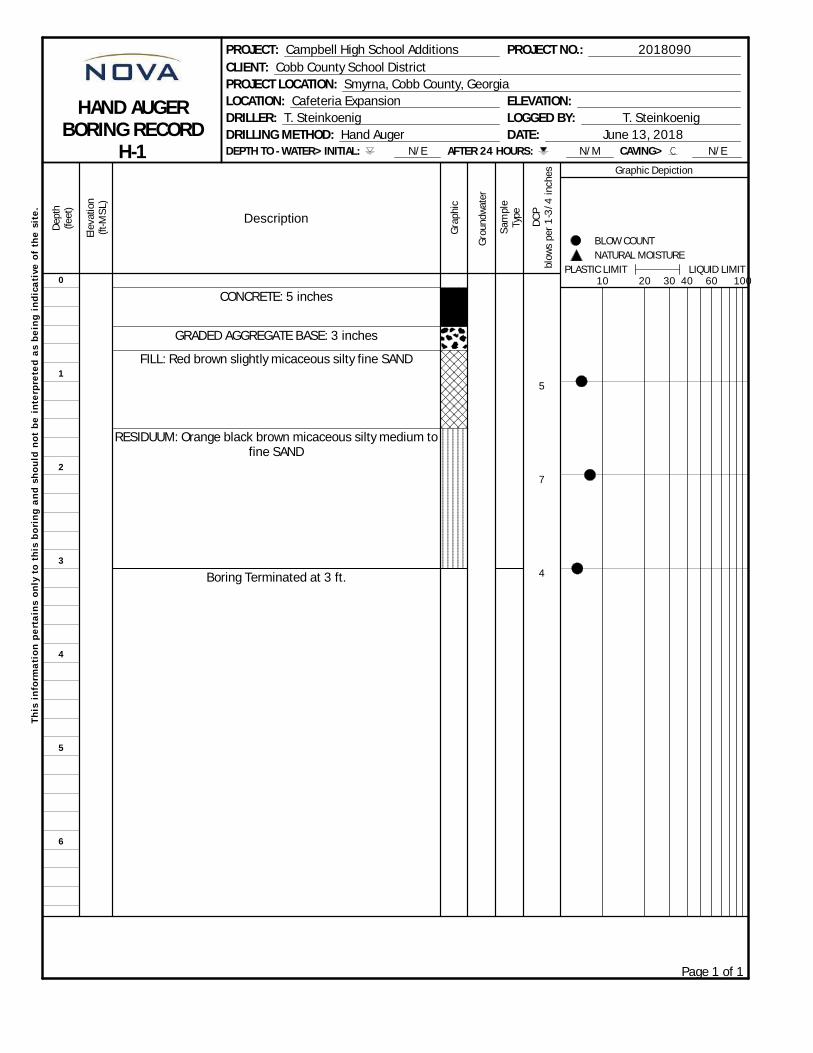
0
1
2
3
4
5
6
CONCRETE: 5 inches
GRADED AGGREGATE BASE: 3 inches
FILL: Red brown slightly micaceous silty fine SAND
RESIDUUM: Orange black brown micaceous silty medium tofine SAND
Boring Terminated at 3 ft.
5
7
4
PROJECT: Campbell High School Additions PROJECT NO.: 2018090
CLIENT: Cobb County School District
PROJECT LOCATION: Smyrna, Cobb County, Georgia
HAND AUGERBORING RECORD
H-1
LOCATION: Cafeteria Expansion ELEVATION:
DRILLER: T. Steinkoenig LOGGED BY: T. Steinkoenig
DRILLING METHOD: Hand Auger DATE: June 13, 2018DEPTH TO - WATER> INITIAL: N/E AFTER 24 HOURS: N/M CAVING> N/E
De
pth
(fe
et)
Ele
vati
on
(ft-
MS
L)
Description
Gra
ph
ic
Gro
un
dw
ate
r
Sa
mp
leTy
pe
DC
Pb
low
s p
er
1-3
/4 in
che
s Graphic Depiction
10 20 30 40 60 100PLASTIC LIMIT LIQUID LIMIT
NATURAL MOISTURE
BLOW COUNT
Th
is i
nfo
rma
tio
n p
ert
ain
s o
nly
to
th
is b
ori
ng
an
d s
ho
uld
no
t b
e i
nte
rpre
ted
as
be
ing
in
dic
ati
ve
of
the
sit
e.
Page 1 of 1

0
1
2
3
4
5
6
CONCRETE: 5 inches
GRADED AGGREGATE BASE: 1 inchFILL: Red brown silty medium to fine SAND; trace root
fragments
RESIDUUM: Tan slightly micaceous silty fine SAND
Boring Terminated at 5 ft.
6
4
5
6
5
PROJECT: Campbell High School Additions PROJECT NO.: 2018090
CLIENT: Cobb County School District
PROJECT LOCATION: Smyrna, Cobb County, Georgia
HAND AUGERBORING RECORD
H-2
LOCATION: Cafeteria Expansion ELEVATION:
DRILLER: T. Steinkoenig LOGGED BY: T. Steinkoenig
DRILLING METHOD: Hand Auger DATE: June 13, 2018DEPTH TO - WATER> INITIAL: N/E AFTER 24 HOURS: N/M CAVING> N/E
De
pth
(fe
et)
Ele
vati
on
(ft-
MS
L)
Description
Gra
ph
ic
Gro
un
dw
ate
r
Sa
mp
leTy
pe
DC
Pb
low
s p
er
1-3
/4 in
che
s Graphic Depiction
10 20 30 40 60 100PLASTIC LIMIT LIQUID LIMIT
NATURAL MOISTURE
BLOW COUNT
Th
is i
nfo
rma
tio
n p
ert
ain
s o
nly
to
th
is b
ori
ng
an
d s
ho
uld
no
t b
e i
nte
rpre
ted
as
be
ing
in
dic
ati
ve
of
the
sit
e.
Page 1 of 1

0
1
2
3
4
5
6
CONCRETE: 5 inches
GRADED AGGREGATE BASE: 6 inches
FILL: Red brown micaceous fine sandy SILT
RESIDUUM: Black pink brown micaceous silty fine SAND
Boring Terminated at 3 ft.
5
4
7
PROJECT: Campbell High School Additions PROJECT NO.: 2018090
CLIENT: Cobb County School District
PROJECT LOCATION: Smyrna, Cobb County, Georgia
HAND AUGERBORING RECORD
H-3
LOCATION: Cafeteria Expansion ELEVATION:
DRILLER: T. Steinkoenig LOGGED BY: T. Steinkoenig
DRILLING METHOD: Hand Auger DATE: June 13, 2018DEPTH TO - WATER> INITIAL: N/E AFTER 24 HOURS: N/M CAVING> N/E
De
pth
(fe
et)
Ele
vati
on
(ft-
MS
L)
Description
Gra
ph
ic
Gro
un
dw
ate
r
Sa
mp
leTy
pe
DC
Pb
low
s p
er
1-3
/4 in
che
s Graphic Depiction
10 20 30 40 60 100PLASTIC LIMIT LIQUID LIMIT
NATURAL MOISTURE
BLOW COUNT
Th
is i
nfo
rma
tio
n p
ert
ain
s o
nly
to
th
is b
ori
ng
an
d s
ho
uld
no
t b
e i
nte
rpre
ted
as
be
ing
in
dic
ati
ve
of
the
sit
e.
Page 1 of 1

0
5
10
15
20
25
30
35
ASPHALT: 4 inchesGRADED AGGREGATE BASE: 6 inches
FILL: Medium dense to loose red brown slightly micaceoussilty medium to fine SAND
Loose brown red slightly micaceous silty fine SAND
Loose red brown slightly micaceous clayey fine SAND
ALLUVIUM: Loose gray silty medium to fine SAND with woodfragments; wet
RESIDUUM: Loose tan brown slightly micaceous silty fineSAND; wet
Boring Terminated at 30 ft.
13
8
8
8
8
5
7
7
PROJECT: Campbell High School Additions PROJECT NO.: 2018090
CLIENT: Cobb County School District
PROJECT LOCATION: Smyrna, Cobb County, Georgia
TEST BORINGRECORD
N-1
LOCATION: Campbell High School ELEVATION:
DRILLER: Piedmont Environmental Drilling, Inc. LOGGED BY: D. Noll
DRILLING METHOD: Hollow Stem Auger DATE: 9/6/19DEPTH TO - WATER> INITIAL: N/E AFTER 24 HOURS: N/M CAVING> 10'
De
pth
(fe
et)
Ele
vati
on
(ft-
MS
L)
Description
Gra
ph
ic
Gro
un
dw
ate
r
Sa
mp
leTy
pe
N-V
alu
e
Graphic Depiction
10 20 30 40 60 100PLASTIC LIMIT LIQUID LIMIT
NATURAL MOISTURE
BLOW COUNT
Th
is i
nfo
rma
tio
n p
ert
ain
s o
nly
to
th
is b
ori
ng
an
d s
ho
uld
no
t b
e i
nte
rpre
ted
as
be
ing
in
dic
ati
ve
of
the
sit
e.
Page 1 of 1

0
5
10
15
20
25
30
35
ASPHALT: 6 inchesGRADED AGGREGATE BASE: 5 inches
FILL: Loose brown clayey medium to fine SAND
Medium dense to loose brown gray slightly micaceous siltyfine SAND
Loose gray red clayey medium to fine SAND
RESIDUUM: Loose to medium dense gray tan slightlymicaceous silty fine SAND
Boring Terminated at 35 ft.
9
12
6
7
5
6
6
6
11
PROJECT: Campbell High School Additions PROJECT NO.: 2018090
CLIENT: Cobb County School District
PROJECT LOCATION: Smyrna, Cobb County, Georgia
TEST BORINGRECORD
N-2
LOCATION: Campbell High School ELEVATION:
DRILLER: Piedmont Environmental Drilling, Inc. LOGGED BY: D. Noll
DRILLING METHOD: Hollow Stem Auger DATE: 9/6/19DEPTH TO - WATER> INITIAL: 19' AFTER 24 HOURS: N/M CAVING>
De
pth
(fe
et)
Ele
vati
on
(ft-
MS
L)
Description
Gra
ph
ic
Gro
un
dw
ate
r
Sa
mp
leTy
pe
N-V
alu
e
Graphic Depiction
10 20 30 40 60 100PLASTIC LIMIT LIQUID LIMIT
NATURAL MOISTURE
BLOW COUNT
Th
is i
nfo
rma
tio
n p
ert
ain
s o
nly
to
th
is b
ori
ng
an
d s
ho
uld
no
t b
e i
nte
rpre
ted
as
be
ing
in
dic
ati
ve
of
the
sit
e.
Page 1 of 1
APPENDIX C
QUALIFICATIONS OF RECOMMENDATIONS

QUALIFICATIONS OF RECOMMENDATIONS
The findings, conclusions and recommendations presented in this report represent our
professional opinions concerning subsurface conditions at the site. The opinions presented
are relative to the dates of our site work and should not be relied on to represent conditions
at later dates or at locations not explored. The opinions included herein are based on
information provided to us, the data obtained at specific locations during the study and our
past experience. If additional information becomes available that might impact our
geotechnical opinions, it will be necessary for NOVA to review the information, reassess the
potential concerns, and re-evaluate our conclusions and recommendations.
Regardless of the thoroughness of a geotechnical exploration, there is the possibility that
conditions between borings will differ from those encountered at specific boring locations,
that conditions are not as anticipated by the designers and/or the contractors, or that either
natural events or the construction process have altered the subsurface conditions. These
variations are an inherent risk associated with subsurface conditions in this region and the
approximate methods used to obtain the data. These variations may not be apparent until
construction.
The professional opinions presented in this geotechnical report are not final. Field observations
and foundation installation monitoring by the geotechnical engineer, as well as soil density
testing and other quality assurance functions associated with site earthwork and foundation
construction, are an extension of this report. Therefore, NOVA should be retained by the owner
to observe all earthwork and foundation construction to document that the conditions
anticipated in this study actually exist, and to finalize or amend our conclusions and
recommendations. NOVA is not responsible or liable for the conclusions and recommendations
presented in this report if NOVA does not perform these observation and testing services.
This report is intended for the sole use of Cobb County School District only. The scope of work
performed during this study was developed for purposes specifically intended by Cobb County
School District and may not satisfy other users’ requirements. Use of this report or the findings,
conclusions or recommendations by others will be at the sole risk of the user. NOVA is not
responsible or liable for the interpretation by others of the data in this report, nor their
conclusions, recommendations or opinions.
Our professional services have been performed, our findings obtained, our conclusions derived
and our recommendations prepared in accordance with generally accepted geotechnical
engineering principles and practices in the State of Georgia. This warranty is in lieu of all other
statements or warranties, either expressed or implied.

Geotechnical-Engineering ReportImportant Information about This
Subsurface problems are a principal cause of construction delays, cost overruns, claims, and disputes.
While you cannot eliminate all such risks, you can manage them. The following information is provided to help.
The Geoprofessional Business Association (GBA) has prepared this advisory to help you – assumedly a client representative – interpret and apply this geotechnical-engineering report as effectively as possible. In that way, clients can benefit from a lowered exposure to the subsurface problems that, for decades, have been a principal cause of construction delays, cost overruns, claims, and disputes. If you have questions or want more information about any of the issues discussed below, contact your GBA-member geotechnical engineer. Active involvement in the Geoprofessional Business Association exposes geotechnical engineers to a wide array of risk-confrontation techniques that can be of genuine benefit for everyone involved with a construction project.
Geotechnical-Engineering Services Are Performed for Specific Purposes, Persons, and ProjectsGeotechnical engineers structure their services to meet the specific needs of their clients. A geotechnical-engineering study conducted for a given civil engineer will not likely meet the needs of a civil-works constructor or even a different civil engineer. Because each geotechnical-engineering study is unique, each geotechnical-engineering report is unique, prepared solely for the client. Those who rely on a geotechnical-engineering report prepared for a different client can be seriously misled. No one except authorized client representatives should rely on this geotechnical-engineering report without first conferring with the geotechnical engineer who prepared it. And no one – not even you – should apply this report for any purpose or project except the one originally contemplated.
Read this Report in FullCostly problems have occurred because those relying on a geotechnical-engineering report did not read it in its entirety. Do not rely on an executive summary. Do not read selected elements only. Read this report in full.
You Need to Inform Your Geotechnical Engineer about ChangeYour geotechnical engineer considered unique, project-specific factors when designing the study behind this report and developing the confirmation-dependent recommendations the report conveys. A few typical factors include: • the client’s goals, objectives, budget, schedule, and risk-management preferences; • the general nature of the structure involved, its size, configuration, and performance criteria; • the structure’s location and orientation on the site; and • other planned or existing site improvements, such as retaining walls, access roads, parking lots, and underground utilities.
Typical changes that could erode the reliability of this report include those that affect:• the site’s size or shape;• the function of the proposed structure, as when it’s changed from a parking garage to an office building, or from a light-industrial plant to a refrigerated warehouse;• the elevation, configuration, location, orientation, or weight of the proposed structure;• the composition of the design team; or• project ownership.
As a general rule, always inform your geotechnical engineer of project changes – even minor ones – and request an assessment of their impact. The geotechnical engineer who prepared this report cannot accept responsibility or liability for problems that arise because the geotechnical engineer was not informed about developments the engineer otherwise would have considered.
This Report May Not Be ReliableDo not rely on this report if your geotechnical engineer prepared it:• for a different client;• for a different project;• for a different site (that may or may not include all or a portion of the original site); or • before important events occurred at the site or adjacent to it; e.g., man-made events like construction or environmental remediation, or natural events like floods, droughts, earthquakes, or groundwater fluctuations.
Note, too, that it could be unwise to rely on a geotechnical-engineering report whose reliability may have been affected by the passage of time, because of factors like changed subsurface conditions; new or modified codes, standards, or regulations; or new techniques or tools. If your geotechnical engineer has not indicated an “apply-by” date on the report, ask what it should be, and, in general, if you are the least bit uncertain about the continued reliability of this report, contact your geotechnical engineer before applying it. A minor amount of additional testing or analysis – if any is required at all – could prevent major problems.
Most of the “Findings” Related in This Report Are Professional OpinionsBefore construction begins, geotechnical engineers explore a site’s subsurface through various sampling and testing procedures. Geotechnical engineers can observe actual subsurface conditions only at those specific locations where sampling and testing were performed. The data derived from that sampling and testing were reviewed by your geotechnical engineer, who then applied professional judgment to form opinions about subsurface conditions throughout the site. Actual sitewide-subsurface conditions may differ – maybe significantly – from those indicated in this report. Confront that risk by retaining your geotechnical engineer to serve on the design team from project start to project finish, so the individual can provide informed guidance quickly, whenever needed.

This Report’s Recommendations Are Confirmation-DependentThe recommendations included in this report – including any options or alternatives – are confirmation-dependent. In other words, they are not final, because the geotechnical engineer who developed them relied heavily on judgment and opinion to do so. Your geotechnical engineer can finalize the recommendations only after observing actual subsurface conditions revealed during construction. If through observation your geotechnical engineer confirms that the conditions assumed to exist actually do exist, the recommendations can be relied upon, assuming no other changes have occurred. The geotechnical engineer who prepared this report cannot assume responsibility or liability for confirmation-dependent recommendations if you fail to retain that engineer to perform construction observation.
This Report Could Be MisinterpretedOther design professionals’ misinterpretation of geotechnical-engineering reports has resulted in costly problems. Confront that risk by having your geotechnical engineer serve as a full-time member of the design team, to: • confer with other design-team members, • help develop specifications, • review pertinent elements of other design professionals’ plans and specifications, and • be on hand quickly whenever geotechnical-engineering guidance is needed. You should also confront the risk of constructors misinterpreting this report. Do so by retaining your geotechnical engineer to participate in prebid and preconstruction conferences and to perform construction observation.
Give Constructors a Complete Report and GuidanceSome owners and design professionals mistakenly believe they can shift unanticipated-subsurface-conditions liability to constructors by limiting the information they provide for bid preparation. To help prevent the costly, contentious problems this practice has caused, include the complete geotechnical-engineering report, along with any attachments or appendices, with your contract documents, but be certain to note conspicuously that you’ve included the material for informational purposes only. To avoid misunderstanding, you may also want to note that “informational purposes” means constructors have no right to rely on the interpretations, opinions, conclusions, or recommendations in the report, but they may rely on the factual data relative to the specific times, locations, and depths/elevations referenced. Be certain that constructors know they may learn about specific project requirements, including options selected from the report, only from the design drawings and specifications. Remind constructors that they may
perform their own studies if they want to, and be sure to allow enough time to permit them to do so. Only then might you be in a position to give constructors the information available to you, while requiring them to at least share some of the financial responsibilities stemming from unanticipated conditions. Conducting prebid and preconstruction conferences can also be valuable in this respect.
Read Responsibility Provisions CloselySome client representatives, design professionals, and constructors do not realize that geotechnical engineering is far less exact than other engineering disciplines. That lack of understanding has nurtured unrealistic expectations that have resulted in disappointments, delays, cost overruns, claims, and disputes. To confront that risk, geotechnical engineers commonly include explanatory provisions in their reports. Sometimes labeled “limitations,” many of these provisions indicate where geotechnical engineers’ responsibilities begin and end, to help others recognize their own responsibilities and risks. Read these provisions closely. Ask questions. Your geotechnical engineer should respond fully and frankly.
Geoenvironmental Concerns Are Not CoveredThe personnel, equipment, and techniques used to perform an environmental study – e.g., a “phase-one” or “phase-two” environmental site assessment – differ significantly from those used to perform a geotechnical-engineering study. For that reason, a geotechnical-engineering report does not usually relate any environmental findings, conclusions, or recommendations; e.g., about the likelihood of encountering underground storage tanks or regulated contaminants. Unanticipated subsurface environmental problems have led to project failures. If you have not yet obtained your own environmental information, ask your geotechnical consultant for risk-management guidance. As a general rule, do not rely on an environmental report prepared for a different client, site, or project, or that is more than six months old.
Obtain Professional Assistance to Deal with Moisture Infiltration and MoldWhile your geotechnical engineer may have addressed groundwater, water infiltration, or similar issues in this report, none of the engineer’s services were designed, conducted, or intended to prevent uncontrolled migration of moisture – including water vapor – from the soil through building slabs and walls and into the building interior, where it can cause mold growth and material-performance deficiencies. Accordingly, proper implementation of the geotechnical engineer’s recommendations will not of itself be sufficient to prevent moisture infiltration. Confront the risk of moisture infiltration by including building-envelope or mold specialists on the design team. Geotechnical engineers are not building-envelope or mold specialists.
Copyright 2016 by Geoprofessional Business Association (GBA). Duplication, reproduction, or copying of this document, in whole or in part, by any means whatsoever, is strictly prohibited, except with GBA’s specific written permission. Excerpting, quoting, or otherwise extracting wording from this document is permitted only with the express written permission of GBA, and only for purposes of scholarly research or book review. Only members of GBA may use this document or its wording as a complement to or as an element of a report of any
kind. Any other firm, individual, or other entity that so uses this document without being a GBA member could be committing negligent
Telephone: 301/565-2733e-mail: [email protected] www.geoprofessional.org