geotechnical engineering design report
TRANSCRIPT

APPENDIX A
Geotechnical Engineering Design
Report

Geotechnical Engineering Design Report
701 Dexter Avenue North Seattle, Washington Prepared for Alexandria Real Estate Equities, Inc. April 23, 2019 19437-00


19437-00 April 23, 2019
Contents
PROJECT DESCRIPTION 1
SITE CONDITIONS 1
SOIL AND GROUNDWATER CONDITIONS 2 Soil Conditions 3 Groundwater Conditions 3
Seismic Setting 5 Surface Rupture 5 Liquefaction and Subsidence 5 Lateral Spreading 5 Landslides 5
GEOTECHNICAL ENGINEERING CONSIDERATIONS AND RECOMMENDATIONS 6 Support of Excavation 7
Right-of-Way Considerations 8 Soil Nail Recommendations 8 Lateral Soil Pressures for Design of Temporary Soldier Pile and Lagging Walls 9 Surcharge Pressures on Shoring 9 Soldier Pile Design 9 Lagging Design 10 Underpinning Design 10 Tieback Design 10
Existing Building Demolition 11 Lateral Earth Pressures 12
Permanent Subgrade Wall Design 12 Earth Pressures 12 Seismic Earth Pressure on Walls 13 Surcharge Pressures on Walls 13
Foundation Support 13 Mat Foundation 13 Spread Footings 14 Foundation Resistance to Lateral Loads 14
Groundwater Control 15 Construction Dewatering 15 Permanent Drainage 15
GEOTECHNICAL RECOMMENDATIONS FOR CONSTRUCTION 16
ii | Contents
19437-00 April 23, 2019
Soldier Pile Installation 16 Lagging Installation 17 Tieback Installation 17 Tieback Anchor Testing Program 18
Verification Tests 18 Proof Tests 19
Shoring Monitoring Program 20 Pre-Construction Survey 20 Construction Survey 20 Post-Construction Survey 21
Mat Foundation Construction 21 Earthwork Recommendations 21
Site Preparation and Grading 21 Structural Fill 22 Temporary Cuts 22
RECOMMENDATIONS FOR CONTINUING GEOTECHNICAL SERVICES 23
REFERENCES 24
TABLES Table 1 – Groundwater Level Readings 4 Table 2 – Slug Test Results 4 Table 3 – 2015 IBC Seismic Design Parameters 6 Table 4 – Soil Nail Design Parameters 9 Table 5 – Existing Shallow Foundation Lateral Resistance Parameters 12 Table 6 – Soil Equivalent Fluid Unit Weights for Walls Backfilled with Structural Fill 13 Table 7 – Foundation Passive Resistance to Lateral Loads 14 Table 8 – Tieback Verification Test Schedule 18 Table 9 – Tieback Proof Test Schedule 19
FIGURES 1 Vicinity Map 2 Site and Exploration Plan 3 Generalized Subsurface Cross Section A-A’ 4 Generalized Subsurface Cross Section B-B’ 5 Temporary and Permanent Lateral Earth Pressures for Excavation 6 Lateral Earth Pressures on Adjacent Shoring Due to Surcharge Pressures

Contents | iii
19437-00 April 23, 2019
ATTACHMENT #1 Preliminary Dewatering Assessment and Slug Test Results
APPENDIX A Field Exploration Methods and Analysis
APPENDIX B Laboratory Testing Program
APPENDIX C Historical Explorations

19437-00 April 23, 2019
Geotechnical Engineering Design Report
701 Dexter Avenue North Seattle, Washington This report presents our geotechnical engineering design recommendations for the proposed 10-story mixed-use building with three levels of below-grade parking located at 701 Dexter Avenue North in Seattle, Washington.
Our scope of work for this study included:
Reviewing existing nearby site data and reports; Completing subsurface explorations and laboratory testing; Completing geotechnical engineering design analysis; Providing geotechnical conclusions and recommendations; and Preparing this report.
We completed this work in general accordance with our proposal dated January 23, 2019. This report is for the exclusive use of Alexandria Real Estate Equities, Inc. (ARE) and their Contractors and Consultants for specific application to this project and site. We completed this work in accordance with generally accepted geotechnical engineering practices for the nature and conditions of the work completed in the same or similar localities, at the time the work was performed. We make no other warranty, express or implied.
PROJECT DESCRIPTION We understand that ARE has acquired the property at 701 Dexter Avenue North and plans to demolish the existing building and construct a new 10-story mixed-use building with three levels of below-grade parking. The finished floor level of the lowest basement is approximately Elevation 29 feet (NAVD 88), per the conceptual drawings. The bottom of the excavation will likely be around Elevation 24 feet (assuming a foundation thickness of 5 feet). The existing building, of which the footprint is set back from the site property line, is a four-story reinforced concrete building with a partial below-grade parking level. With the removal of the existing building, the new development will extend to the property extents. Development of site-specific response spectra should not be required. A geotechnical report for a previous iteration of development at the site was prepared by GeoEngineers (2017). Based on our discussion with Coughlin Porter Lundeen, the project structural engineer, we understand that structural loading will consist of resultant pressures on the order of 12 kips per square foot (ksf).
SITE CONDITIONS The project site is located on the southern portion of the block bounded by State Route 99/Aurora Avenue on the west, Valley Street on the north, Dexter Avenue North on the east, and Roy Street on the south, as shown on Figure 1. On the northern half of the site block, there is an existing six-story

2 | 701 Dexter Avenue North
19437-00 April 23, 2019
apartment building (717 Dexter Avenue North/Europa Apartments) and 712 Aurora Avenue North, where there are plans to develop a new 15-story residential building. The 712 Aurora Avenue North (Tarragon property) will be constructing a three-level basement with the lowest finished floor at Elevation 29 feet (nearly matching the planned 701 Dexter basement level).The site is currently occupied by a four-story reinforced concrete building with a partial below-grade parking level matching the Dexter Street grades; on the western third of the site is a parking level matching the Aurora Avenue grades. The partial below-grade parking level is one-story tall with exposed column bays; this level is paved with asphalt and slopes up from the Dexter Street grade to the western extent of the structure, where a rockery wall retains the adjacent parking lot on the site. We understand that the plans for the existing building show that it is supported on shallow-spread footings.
The site grades slope down towards the southeast, varying from about Elevation 78 feet at the northwestern corner to about Elevation 58 feet at the southeastern corner, with the rockery wall generally separating the grades on the western third and eastern two-thirds of the site. Based on the proposed basement configuration, excavations on the order of 35 to 50 feet will be required to construct the new below-grade parking levels. The surrounding streets contain numerous buried utilities, including, but not limited to, storm drain, sanitary sewer, gas, water, electric, and telecommunications fiber. There is also an underground Seattle City Light vault in the southwestern corner of the site. As conceptually shown, the project will need to either relocate the vault or have the below-grade accommodate the vault. The geotechnical report for the original development of the 701 Dexter site (Shannon & Wilson, 1980) indicates that there was a former commercial building along the Aurora side of the site, along with several rockery walls along Roy Street and intermittently throughout the site. Remnants of prior development will likely be encountered during construction.
SOIL AND GROUNDWATER CONDITIONS Our understanding of the site subsurface conditions is based on borings and laboratory analysis performed by Hart Crowser for this project, historical explorations at and near the site, and our experience during construction of projects within the vicinity. We drilled four borings (designated HC-B1 through HC-B4) at the site between February 26 and March 1, 2019. The drill depths for HC-B1 and HC-B2 were on the order of 60.3 feet, and the drill depths for HC-B3 and HC-B4 were on the order of 85.5 feet. Borings HC-B1, HC-B2, and HC-B3 were converted into monitoring wells. Subsurface conditions interpreted from explorations at discrete locations on the site and soil properties inferred from the field and laboratory tests formed the basis of the geotechnical recommendations in this report. The nature and extent of variations between explorations may not become evident until additional explorations are performed or construction begins. If variations are encountered, it may be necessary to reevaluate the recommendations made in this report.
The boring logs by Hart Crowser are provided in Appendix A and the laboratory analysis by Hart Crowser is in Appendix B. Applicable historical logs of explorations and laboratory results are provided in Appendix C. Generalized soil and groundwater conditions are provided below.

701 Dexter Avenue North | 3
19437-00 April 23, 2019
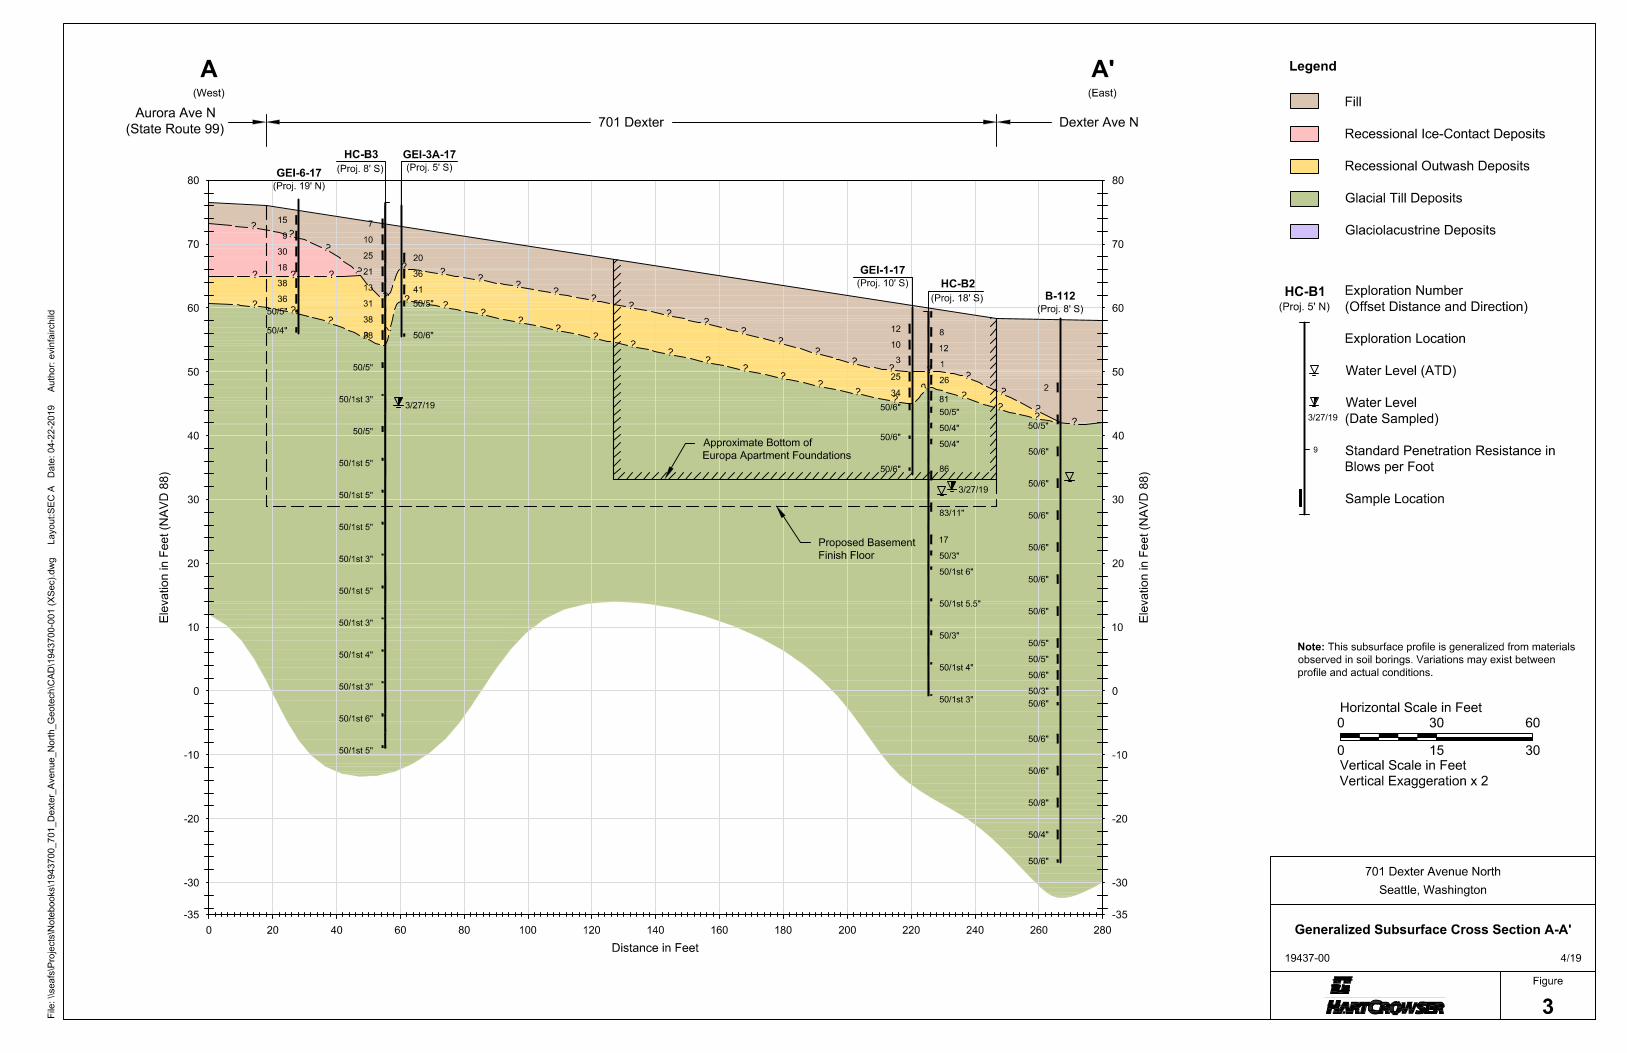
Soil Conditions In general, the site is underlain by a layer of fill over native soils, which vary in age and composition. Figures 3 and 4 illustrate the general subsurface conditions at the site. The locations of the profiles are shown on Figure 2. The fill primarily consists of medium dense to dense sand with varying amounts of silt and gravel in addition to some silt and clay. The fill thickness varies between 0 and 15 feet and increases in thickness across the site from the northwestern corner to the southeastern corner. Beneath the fill, the subsurface conditions consist of either glacially consolidated Glacial Till Deposits and Recessional Outwash Deposits, or Recessional Ice-Contact Deposits, which are not glacially consolidated. The Recessional Ice-Contact Deposits observed in borings HC-B2 and HC-B4 consist of medium dense sand. This is underlain by a layer of Recessional Outwash Deposits (observed in borings HC-B2 through HC-B4), which generally consist of dense to very dense silty sand. Glacial Till Deposits underly the Recessional Outwash sands in borings HC-B2 through HC-B4, and the fill in HC-B1. The Glacial Till deposits consist of very dense sands and hard silts. In Boring HC-B1, the Till was underlain by Glaciolacustrine Deposits consisting of hard lean clay at a depth of 53 feet. Although not encountered during our investigation, boulders have been observed in glacially consolidated soils and may be present at the site.
Groundwater Conditions Groundwater has been extensively studied in the South Lake Union area and has been measured and mapped during construction of adjacent and nearby projects. The elevation of the water table is heavily influenced by the level of Lake Union. It is likely that the static groundwater table will be encountered at an elevation of approximately 16.75 to 18.75 feet (corresponding to 20 to 22 feet, U.S. Army Corps of Engineers vertical datum) and will fluctuate a few feet annually as the level of the lake changes due to seasonal controls in lake level by the U.S. Army Corps of Engineers at the Ballard Locks.
During our investigation, we installed three monitoring wells in borings HC-B1 through HC-B3. On March 27, 2019, we observed groundwater levels, as shown in Table 1. Existing groundwater levels in the area ranged between Elevation 38 and 46 feet. These borings indicate the presence of perched groundwater; therefore, we expect multiple zones of perched groundwater to be sitting on the Glacial Till deposits above the regional groundwater table and seepage throughout the subsurface, particularly where more granular zones are encountered. At the adjacent 700 Dexter Avenue North site, groundwater was observed at depth between 15 and 50 feet bgs, or about Elevation 30 feet.

4 | 701 Dexter Avenue North
19437-00 April 23, 2019
Table 1 – Groundwater Level Readings
Exploration
Approximate Surface
Elevation (feet, NAVD 88)
Date of Reading
Approximate Depth to Water
(feet)
Approximate Groundwater
Elevation (feet, NAVD 88)
Groundwater Observations
HC-B1 58
2/28/2019 22.8 35.2 ATD
3/27/2019 23.1 34.9 RIP
HC-B2 59.5
2/27/2019 28.7 20.8 ATD
3/27/2019 26.3 33.2 RIP
4/1/2019 25.5 34.0 RIP
HC-B3 76.5
2/28/2019 52 24.5 ATD
3/27/2019 31.8 44.7 RIP
4/1/2019 27.0 49.5 RIP
HC-B4 76 3/4/2019 36 40 ATD
Notes: ATD = “At time of Drilling”, RIP = “Read in Piezometer” Groundwater may fluctuate because of variations in rainfall, temperature, season, and other factors. Subsurface conditions interpreted from explorations at discrete locations on the site and the soil properties inferred from the field and laboratory tests formed the basis of the geotechnical recommendations in this report. The nature and extent of variations between explorations may not become evident until additional explorations are performed or construction begins. If variations are encountered, we may need to reevaluate the recommendations in this report.
Hydraulic Conductivity Slug tests were performed in monitoring wells HC-B1 through HC-B3 in March 2019 to estimate the hydraulic conductivity of the subsurface soils. Slug tests are performed by rapidly inserting or removing a solid PVC rod into a well and measuring the recovery of the water levels during the test. A more detailed test description and the results are in Attachment 1.
The slug test results are summarized in Table 2 in terms of average hydraulic conductivity. As mentioned in the memorandum (Attachment 1), this hydraulic conductivity is typical for sand (Freeze and Cherry 1979).
Table 2 – Slug Test Results
Well Name Average Hydraulic Conductivity
centimeters/second feet/day HC-B1 1.0x10⁻⁴ 0.28
HC-B2 1.6x10⁻⁵ 0.04
HC-B3 6.0x10⁻⁵ 0.17

701 Dexter Avenue North | 5
19437-00 April 23, 2019
SEISMIC CONSIDERATIONS
Seismic Setting The seismicity of western Washington is dominated by the Cascadia Subduction Zone, where the offshore Juan de Fuca plate subducts beneath the continental North American plate. Three main types of earthquakes are typically associated with subduction zone environments: crustal, intraplate, and interplate earthquakes. Seismic records in the Puget Sound area clearly indicate a distinct shallow zone of crustal seismicity, the Seattle Fault, which may have surficial expressions and can extend to depths of 25 to 30 kilometers (km). A deeper zone is associated with the subducting Juan de Fuca plate and produces intraplate earthquakes at depths of 40 to 70 km beneath the Puget Sound region (e.g., the 1949, 1965, and 2001 earthquakes) and interplate earthquakes at shallow depths near the Washington coast (e.g., the 1700 earthquake with an approximate magnitude of 9.0).
Surface Rupture The northernmost splay of the Seattle Fault exists approximately 5 km (3.1 miles) south of the site. There is a remote potential for surface rupture at the site from a new splay of the Seattle Fault; however, this hazard is very low based on the Seattle Fault’s 3,000-year recurrence interval, the large number of possible locations for surface rupture, and the chance that the fault would not produce surface rupture in this segment of the fault.
Liquefaction and Subsidence Liquefaction is caused by a rapid increase in pore-water pressure that reduces the effective stress between soil particles, resulting in sudden loss of shear strength in the soil. Granular soils that rely on inter-particle friction for shear strength are susceptible to liquefaction under the excess pore pressure buildup during strong ground shaking. Liquefaction can cause ground settlement, bearing capacity failure, and lateral spreading. However, the soils encountered below the groundwater levels are sufficiently dense to resist liquefaction during a major earthquake, and we, therefore, judge that the potential for liquefaction at the site is low.
Lateral Spreading Lateral spreading is typically associated with lateral movement on sloping ground caused by liquefaction or a reduction of shear strength of soils within or under the slope. Given the low liquefaction hazard at the site, we judge that the potential for lateral spreading is also low.
Landslides We reviewed the City’s Environmentally Critical Area (ECA) Ordinance and found that no critical area issues, such as previous landslide or steep slope, currently exist at the site. The risk of landslide during an earthquake is considered low for this site.
Seismic Design Parameters Our geotechnical seismic design study is being prepared and will be submitted separately. That document will provide a recommended response spectrum for the risk-targeted maximum considered

6 | 701 Dexter Avenue North
19437-00 April 23, 2019
earthquake (MCER) and the Service Level Earthquake (SLE). Table 3 provides 2015 International Building Code (IBC) seismic design parameters for the site latitude and longitude and the soil site class. The parameters were obtained from the USGS U.S. Seismic Design Maps web application (http://earthquake.usgs.gov/designmaps/us/application.php) accessed on March 27, 2019.
The basis of seismic design for the is the MCER, which is used to determine spectral response accelerations. The peak ground acceleration (PGA) is determined using the maximum considered earthquake geometric mean (MCEG). The MCER ground motion response accelerations are defined for the most severe earthquake considered by IBC 2012, determined for the orientation that results in the largest maximum response to horizontal ground motions, and adjusted for the targeted risk. The geometric mean PGA corresponding to MCEG is defined for the most severe earthquake without adjustment for the targeted risk. The most severe earthquake considered by the IBC has a 2 percent probability of exceedance in 50 years, corresponding to a 2,475-year return period.
The mapped response spectra are based on Site Class B (rock) conditions. Seismic parameters are adjusted based on the actual site conditions, generalized as the soil site class. IBC 2015 defines the design spectral acceleration parameters at short periods (SS), and at the one-second period (S1) as two-thirds of the corresponding site-class-adjusted MCER parameters (SMS and SM1). Similarly, ASCE 7-10 requires MCEG peak ground acceleration adjusted for site effects (PGAM) to be used for evaluation of liquefaction, lateral spreading, seismic settlements, and other soil-related issues.
Table 3 – 2015 IBC Seismic Design Parameters
Parameter Value Latitude 47.626
Longitude -122.343
Site Class C
Risk Category I, II, III
Spectral Response Acceleration at Short Periods, SS 1.338 g
Spectral Response Acceleration at 1-Second Periods, S1 0.519 g
Mapped MCE Geometric Mean Peak Ground Acceleration, PGA 0.545 g
Seismic Coefficient, Fa 1.0
Seismic Coefficient, Fv 1.3
Seismic Coefficient, FPGA 1.0
GEOTECHNICAL ENGINEERING CONSIDERATIONS AND RECOMMENDATIONS Our recommendations are based on our current understanding of the project and the subsurface conditions interpreted from explorations at and near the site by others. If the nature or location of the facilities is different than we have assumed, we should be notified so we can review, change, and/or confirm our recommendations. The primary geotechnical considerations for this project include:

701 Dexter Avenue North | 7
19437-00 April 23, 2019
Based on the proposed lowest finished floor elevations provided to us and our interpretation of the general subsurface conditions, the excavation will expose native glacial soils. The native glacial soils are suitable for bearing support. The building may be supported on shallow foundations consisting of spread footings, mat foundation, or a combination of both.
A temporary shoring system will be required to support the excavation during building construction. An easement will have to be obtained from the City for installation of shoring elements along Dexter Avenue North and Roy Street. Adjacent to Aurora Avenue North (SR-99), an easement from Washington State Department of Transportation (WSDOT) will need to be obtained. We understand that the Tarragon development to the northwest will begin construction prior to this project, and that the project team plans to coordinate the shoring along the common property line using reciprocal easement agreements. At this time, it is unclear which project will commence first. The sequencing of the project starts will determine which project needs tiebacks, and which one will follow and can de-tension those tiebacks as the second excavation extends down. Due to the sensitive nature of the Europa Apartments on the northeast, as well as the northwest to southeast groundwater gradient, a tied-back solider beam and lagging system is likely more appropriate for the project support of excavation. However, a hybrid approach with soil nailing along Roy Street and Dexter Street may also be considered. The Europa Apartments will also need to either be underpinned or the shoring system designed to accommodate its loading. If the building is not underpinned, then the shoring soldier piles adjacent to the building will likely need to be installed on the 701 Dexter property. This approach would reduce the below-grade footprint of the planned development.
Based on our measurements of groundwater levels in our monitoring wells, as well as our understanding of the dewatering activities in the site vicinity, we expect that some perched water will be present during construction. The temporary and permanent drainage design will need to account for perched water conditions. While groundwater level will fluctuate due to variations in rainfall, temperature, season, lake level, and other factors, the regional groundwater table is expected to remain below the bottom of the building floor slab. Detailed recommendations are presented herein.
Support of Excavation The proposed development will include excavations on the order of 35 to 50 feet around the building perimeter and will require shoring. Typical shoring systems include either 1) tied-back soldier beam and lagging, or 2) soil nailing. These types of shoring systems will require easements where the shoring elements extend into adjacent rights of way. Internal bracing will be required where encroachment agreements cannot be obtained. The soils to be retained by the shoring consist of both the weaker fill and Recessional Ice-Contact Deposits, as well as the more competent Recessional Outwash and Glacial Till Deposits. The shallower Recessional Ice-Contact deposits are likely more permeable than the underlying glacially overridden soils, and it may be challenging to dewater these soils at the contact with the more competent, finer-grained soils. This, along with the sensitive nature of the existing and future buildings along the north, will likely preclude the use of soil nailing along the west and north

8 | 701 Dexter Avenue North
19437-00 April 23, 2019
sides of the project. We have provided recommendations for design and construction of tied-back soldier beam and lagging as well as soil nailing below.
As previously mentioned, the adjacent Europa Apartments building extends three levels below grade. We understand the excavation for that development was supported by soil nailing with vertical elements under the existing 701 Dexter building. Because the proposed excavation will extend deeper than the Europa Apartment foundations, the excavation will likely encounter the abandoned soil nails. The design of the soldier pile/underpinning and tieback system should consider the locations of the abandoned soil nails to reduce the risk of encountering these potential obstructions during shoring installation. However, the contractor should plan to encounter these elements during installation and mass excavation.
Shoring must be designed by a professional structural engineer registered in the State of Washington. We also recommend that we review the geotechnical aspects of the shoring design before construction. It is not the purpose of this report to provide specific criteria for the contractor’s construction means and methods. The shoring contractor should be responsible for verifying actual ground conditions and determining the construction methods and procedures needed to install an appropriate shoring system.
Right-of-Way Considerations Shoring elements will extend into city rights-of-way along Roy Street on the south and Dexter Avenue North. Along Aurora Avenue North/SR-99 on the west, shoring elements will extend into WSDOT right of way. Temporary shoring elements can extend into public rights-of-way, but tiebacks must be destressed and solider piles must be cut off when no longer needed for wall stability. Without easements, tiebacks below the streets cannot extend beyond public city right-of-way, limiting tieback lengths. Private right-of-way exists to the north of the site (the Europa Apartments and future 712 Aurora Avenue N). We understand that a right-of-way agreement will be obtained for this side of the site.
Soil Nail Recommendations A major consideration for soil nail feasibility is the ability of the exposed soil face to stand up without raveling or excessive overbreak. In addition, excavating during wet or very dry weather can reduce the standup time and may require changing construction methods and/or nail spacing. The fill material and Recessional Ice-Contact Deposits encountered across the site may be unstable and we recommend installing vertical elements and/or flash coating to maintain face stability during excavation and nail installation. Also, the contact between the weaker fill/Recessional Outwash Deposits and the Recessional Outwash/Glacial Till deposits will likely be challenging to dewater. This may require wellpoints installed through the shoring face or wells installed behind the shoring wall to eliminate groundwater seepage during excavation.
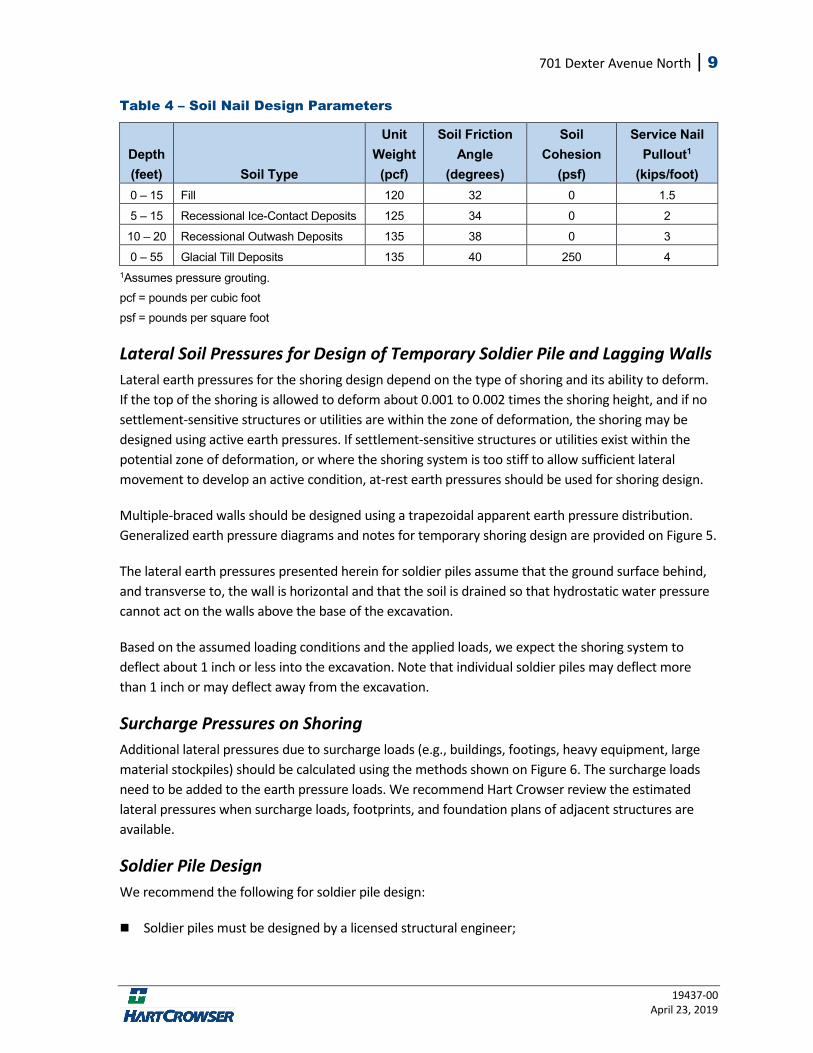
We recommend the soil parameters in Table 4 for soil nail design. Final nail adhesion should be determined by the shoring designer and contractor based on the planned installation method(s) and verified with pullout tests conducted before shoring production.
701 Dexter Avenue North | 9
19437-00 April 23, 2019
Table 4 – Soil Nail Design Parameters
Depth (feet) Soil Type
Unit Weight
(pcf)
Soil Friction Angle
(degrees)
Soil Cohesion
(psf)
Service Nail Pullout1
(kips/foot) 0 ‒ 15 Fill 120 32 0 1.5
5 ‒ 15 Recessional Ice-Contact Deposits 125 34 0 2
10 – 20 Recessional Outwash Deposits 135 38 0 3
0 ‒ 55 Glacial Till Deposits 135 40 250 4 1Assumes pressure grouting. pcf = pounds per cubic foot psf = pounds per square foot
Lateral Soil Pressures for Design of Temporary Soldier Pile and Lagging Walls Lateral earth pressures for the shoring design depend on the type of shoring and its ability to deform. If the top of the shoring is allowed to deform about 0.001 to 0.002 times the shoring height, and if no settlement-sensitive structures or utilities are within the zone of deformation, the shoring may be designed using active earth pressures. If settlement-sensitive structures or utilities exist within the potential zone of deformation, or where the shoring system is too stiff to allow sufficient lateral movement to develop an active condition, at-rest earth pressures should be used for shoring design.
Multiple-braced walls should be designed using a trapezoidal apparent earth pressure distribution. Generalized earth pressure diagrams and notes for temporary shoring design are provided on Figure 5.
The lateral earth pressures presented herein for soldier piles assume that the ground surface behind, and transverse to, the wall is horizontal and that the soil is drained so that hydrostatic water pressure cannot act on the walls above the base of the excavation.
Based on the assumed loading conditions and the applied loads, we expect the shoring system to deflect about 1 inch or less into the excavation. Note that individual soldier piles may deflect more than 1 inch or may deflect away from the excavation.
Surcharge Pressures on Shoring Additional lateral pressures due to surcharge loads (e.g., buildings, footings, heavy equipment, large material stockpiles) should be calculated using the methods shown on Figure 6. The surcharge loads need to be added to the earth pressure loads. We recommend Hart Crowser review the estimated lateral pressures when surcharge loads, footprints, and foundation plans of adjacent structures are available.
Soldier Pile Design We recommend the following for soldier pile design:
Soldier piles must be designed by a licensed structural engineer;

10 | 701 Dexter Avenue North
19437-00 April 23, 2019
Design soldier piles for bending using a uniform loading equivalent to 80 percent of the design values and analyze for shear using total load;
To design against kickout, compute the lateral resistance using the passive pressure on Figure 5, acting over three times the diameter of the concreted shaft section or the pile spacing, whichever is less;
The embedded portion of the pile shaft should be at least 2 feet in diameter;
Embed the soldier piles at least 10 feet below the bottom of the excavation; and
These recommendations assume proper installation of the soldier piles as discussed in the “Geotechnical Recommendations for Construction” section of this report.
We recommend the allowable axial pile capacity parameters presented on Figure 5 to calculate the vertical soil capacity of the soldier piles. The values on Figure 5 include a factor of safety of 2.0. The pile side friction above the bottom of the excavation should be neglected from the pile capacity.
Lagging Design Temporary lagging should be designed in accordance with Federal Highway Administration (FHWA) Geotechnical Engineering Circular No. 4 (GEC 4; FHWA 1999), structural engineering guidelines, soil type, and local experience. FHWA recommendations for minimum lagging thickness vary with soldier pile spacing and soil category (competent, difficult, or potentially dangerous soils). For purposes of lagging design, site soils may be considered “competent.”
Underpinning Design Underpinning may be needed to support the Europa Apartment foundation loads. Because of the dense nature of the native glacial soils at the site, the use of hand-excavated underpinning piers will likely be precluded, and underpinning elements will need to consist of steel piles installed in slant-drilled shafts.
The underpinning piles should be designed to resist the vertical building loads, vertical tieback loads (if tiebacks are used), and lateral earth pressures. The lateral earth pressures acting on underpinning piles should be determined using at-rest pressures, as shown on Figure 5. Conversely, if the building is not underpinned, the shoring wall may be designed to support the loads from the shallow foundations through the addition of a lateral surcharge, in accordance with Figure 6. Once the actual foundations of these buildings have been determined (either from a review of plans at the City, or by excavating test pits adjacent to these buildings), we can assist the shoring designer with developing the distribution of the building loads onto the shoring system.
Tieback Design We recommend the tentative allowable tieback pullout values provided on Figure 5 for a typical 6-inch-diameter drilled hole with a pressure-grouted bond zone. The allowable transfer loads include a
701 Dexter Avenue North | 11
19437-00 April 23, 2019
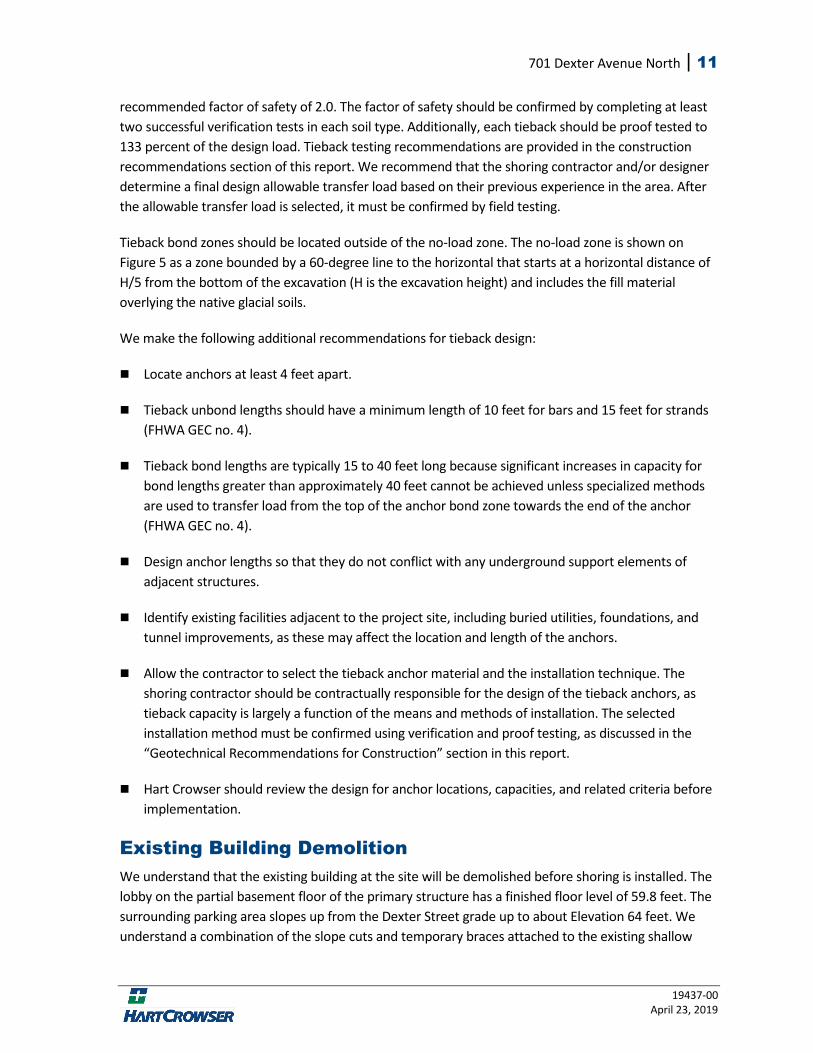
recommended factor of safety of 2.0. The factor of safety should be confirmed by completing at least two successful verification tests in each soil type. Additionally, each tieback should be proof tested to 133 percent of the design load. Tieback testing recommendations are provided in the construction recommendations section of this report. We recommend that the shoring contractor and/or designer determine a final design allowable transfer load based on their previous experience in the area. After the allowable transfer load is selected, it must be confirmed by field testing.
Tieback bond zones should be located outside of the no-load zone. The no-load zone is shown on Figure 5 as a zone bounded by a 60-degree line to the horizontal that starts at a horizontal distance of H/5 from the bottom of the excavation (H is the excavation height) and includes the fill material overlying the native glacial soils.
We make the following additional recommendations for tieback design:
Locate anchors at least 4 feet apart.
Tieback unbond lengths should have a minimum length of 10 feet for bars and 15 feet for strands (FHWA GEC no. 4).
Tieback bond lengths are typically 15 to 40 feet long because significant increases in capacity for bond lengths greater than approximately 40 feet cannot be achieved unless specialized methods are used to transfer load from the top of the anchor bond zone towards the end of the anchor (FHWA GEC no. 4).
Design anchor lengths so that they do not conflict with any underground support elements of adjacent structures.
Identify existing facilities adjacent to the project site, including buried utilities, foundations, and tunnel improvements, as these may affect the location and length of the anchors.
Allow the contractor to select the tieback anchor material and the installation technique. The shoring contractor should be contractually responsible for the design of the tieback anchors, as tieback capacity is largely a function of the means and methods of installation. The selected installation method must be confirmed using verification and proof testing, as discussed in the “Geotechnical Recommendations for Construction” section in this report.
Hart Crowser should review the design for anchor locations, capacities, and related criteria before implementation.
Existing Building Demolition We understand that the existing building at the site will be demolished before shoring is installed. The lobby on the partial basement floor of the primary structure has a finished floor level of 59.8 feet. The surrounding parking area slopes up from the Dexter Street grade up to about Elevation 64 feet. We understand a combination of the slope cuts and temporary braces attached to the existing shallow

12 | 701 Dexter Avenue North
19437-00 April 23, 2019
foundations are proposed for demolition temporary shoring. We provide recommendations for lateral earth pressures and sliding resistance of existing footings in the following section; slope cut recommendations are discussed later on in the report.
Lateral Earth Pressures We recommend calculating the loads on the existing wall and footings using the lateral earth pressures on Figure 5. Surcharges on the wall should be evaluated using Figure 6.
To design for lateral loads, we recommend using the allowable passive equivalent fluid weights and allowable coefficients of friction summarized in Table 5. Using both the passive pressure on the edge of the footing and friction along the base is appropriate unless the structure has stringent lateral movement requirements, or if soil within the passive wedge becomes disturbed.
Table 5 – Existing Shallow Foundation Lateral Resistance Parameters
Allowable Passive Equivalent Fluid Weight in pcf
Allowable Coefficient of Friction
300 0.3
Permanent Subgrade Wall Design This section, and Figures 5 and 6, provide guidance for determining the permanent subgrade wall loads.
Earth Pressures Permanent subsurface walls constructed adjacent to soldier pile shoring should be designed using the same earth pressure loads and distributions that were used for shoring design, including any permanent surcharge loads. Note that the earth pressure diagrams shown in this report are generalized and do not show the final earth pressure used for shoring design. The structural engineer designing the permanent walls must reference the earth pressures determined by the shoring designer to design the permanent walls.
Permanent walls that are backfilled should be designed using a triangular earth pressure distribution. For typical granular fill soil, active and at-rest pressures may be determined using the equivalent fluid unit weights in Table 6. Note that the equivalent fluid density does not include any surface loading conditions or loading from groundwater hydrostatic pressure; also, the ground surface behind the wall is assumed to be horizontal transverse to the wall alignment. Walls without permanent drainage must be designed for full hydrostatic water pressure.
The use of active and passive pressure is appropriate if the wall is allowed to yield a minimum 0.001 times the wall height. For a non-yielding wall, at-rest pressures should be used.

701 Dexter Avenue North | 13
19437-00 April 23, 2019
Table 6 – Soil Equivalent Fluid Unit Weights for Walls Backfilled with Structural Fill
Soil Type Parameter Value in pcf
Structural Fill
Active Earth Pressure 35
At-Rest Earth Pressure 55
Passive Earth Pressure 300*
*Note: includes a factor of safety of 1.5. pcf = pounds per cubic foot
Seismic Earth Pressure on Walls As shown on Figure 5, lateral earth pressures based on the design earthquake can be assumed as uniform pressures in pounds per square foot of 7H for the shoring walls supporting the city streets and alley (where H is the height of the wall in feet). The seismic earth pressure should be applied as a uniform load from the top of the wall to the bottom of the excavation. This seismic earth pressure is calculated using the PGA values based on mapped site parameters from ASCE 7-10 for Site Class C.
Surcharge Pressures on Walls The design of the permanent basement wall should include permanent surcharges in the calculation. Surcharges should include traffic loads, adjacent building foundations and floor slabs, or any other permanent features and should be calculated using the equations on Figure 6.
We recommend Hart Crowser review or complete the estimated surcharge loads when surcharge loads, footprints, and foundation plans of adjacent structures are available.
Foundation Support Based on the results of our subsurface explorations, we expect that the proposed building subgrade will be within the undisturbed, native glacial soils. The design of the mat foundation will require an iterative process between Hart Crowser and Coughlin Porter Lundeen to develop the appropriate soil modulus values to design the mat foundation reinforcement. The foundation may also be designed as shallow-spread footings. Our recommendations for the design and construction of shallow foundations are provided below.
Mat Foundation For a mat foundation bearing in the native, undisturbed Glacial Till Deposits, we recommend a maximum allowable bearing pressure of 14 ksf. These allowable bearing pressures are net values and include a factor of safety of 2.0 for dead plus live loading. Allowable bearing pressures may be increased by up to one-third for wind or seismic loads.
Based on the preliminary structural information, we recommend a vertical coefficient of subgrade reaction moduli of 160 kips per cubic foot (kcf) for the Glacially Overridden deposits. The subgrade modulus values are a function of foundation stiffness, magnitude of load, subgrade stiffness, and

14 | 701 Dexter Avenue North
19437-00 April 23, 2019
location of applied load(s) to the foundation. As such, the recommended values are preliminary and will need to be confirmed or revised based on interaction between Hart Crowser and CPL.
We expect the native load-bearing soil to generally behave elastically, with settlement occurring within the first few months of the application of the building loads. We expect that mat foundation settlement will be on the order of 3/4 to 1 inch under static loading. Differential settlement across the mat footprint will be on the order of 1/2 to 3/4 inches. Settlement of the foundation will vary as a function of the size and stiffness of the foundation, the mat loading, and the elevation of the subgrade.
Spread Footings For spread footings, the allowable bearing pressures generally increase with increased footing width. We recommend a maximum allowable bearing pressure of up to 12 ksf for footings bearing in Glacial Till Deposits. This allowable bearing pressure is a net value and includes a factor of safety of 2.0 for dead plus live loading. Allowable bearing pressures may be increased by up to one-third for wind or seismic loads. For footings constructed in accordance with the recommendations provided, we anticipate settlement will be on the order of 3/4 inch.
Footings should be founded outside of an imaginary 1H:1V plane projected upward from the bottom edge of adjacent footings or utility trenches.
Foundation Resistance to Lateral Loads Shallow foundation resistance to lateral loads is from passive soil resistance against the side(s) of the footing and/or frictional resistance along the base of the footing. For passive resistance to lateral loads, we recommend applying passive equivalent fluid pressure and sliding resistance using the values in Table 7. The equivalent fluid pressure should be applied using triangular pressure distribution, ignoring the passive resistance 2 feet below the adjacent ground surface. A factor of safety of 1.5 has been applied to these values.
Table 7 – Foundation Passive Resistance to Lateral Loads
Soil Type Allowable Passive Equivalent Fluid Density
Allowable Coefficient of Friction
Undisturbed, dense, native soils 400 pcf 0.32
Structural fill 300 pcf 0.30
*Foundation concrete must be placed directly against undisturbed native soils.
Foundation Construction Based on the subsurface information, we expect that building foundations will bear on the undisturbed hard to very dense native soils. Local areas of weaker/softer soils may be encountered that may require overexcavation to allow placing the high bearing pressure foundations. We expect the maximum depth of overexcavation to be less than 2 feet in most areas. Lean concrete should be used as backfill materials where the design allowable bearing pressure exceeds 8 ksf.

701 Dexter Avenue North | 15
19437-00 April 23, 2019
We recommend placing a 2- to 4-inch-thick layer of lean concrete at the bottom of foundation excavations to protect the subgrade during wet weather construction. The lean concrete should be placed immediately after excavation.
Groundwater Control
Construction Dewatering Water collected and discharged during construction will include surface water from precipitation, perched water, and process water from construction activities. There is a potential risk that sand zones could produce more water than is evident during this investigation. The contractor should be prepared to control groundwater inflow using dewatering wells or well points within the excavated material as necessary. Groundwater should be maintained at a level at least 2 feet below the bottom of the excavation.
Where there is minor seepage, we do not expect it to cause soil stability problems or compromise the foundation subgrade. In the unlikely event that seepage is sufficient to cause soil materials to flow into the excavation, additional dewatering measures may be warranted. Note that during the soldier pile installations, we should be able to map water-bearing soils and assess dewatering needs before the excavation encounters the water.
The amount of water discharged from the site depends on many factors, including design and operation of any dewatering system, the excavation depth and extent, and the variability in soil and groundwater properties. Note that rainfall, surface water, and groundwater from adjacent utility trenches can significantly increase short-term water discharge rates. Also, the time of year and nearby construction dewatering activities can affect groundwater flows. See Attachment 1 for a discussion of construction dewatering.
Permanent Drainage Permanent drainage is governed by the City of Seattle Stormwater Manual (January 2016), which restricts the allowable flows into the storm drain or combined sewer system. In our experience, groundwater flows up to about 15 gallons per minute (gpm) and can typically be disposed of without discharge fees. However, higher flows may not be allowed to discharge and may require a discharge fee and groundwater detention. We estimate that groundwater discharge rates for permanent conditions draining to the finished floor elevation of 29 feet will be on the order of 5 to 10 gpm. This estimate will need to be revisited following monitoring throughout the rainy season. Hart Crowser should also review the final basement configuration and foundation thicknesses and check that they are consistent with the design assumptions provided in Attachment 1.
Our permanent drainage recommendations are intended to prevent buildup of hydrostatic pressures against subgrade walls. However, seepage and wall dampness may still occur. We recommend the design team consider waterproofing below Elevation 49 feet for occupied or finished spaces, for spaces that are sensitive to moisture (e.g. elevator shafts), and for aesthetic purposes, if desired.

16 | 701 Dexter Avenue North
19437-00 April 23, 2019
We recommend installing full-face drainage board (e.g., Miradrain 6100) between the shoring and permanent wall from the ground surface to the full depth of the wall. The purpose of the drainage board is to prevent the buildup of hydrostatic groundwater pressure caused by surface water infiltration or perched water above the water table. The drainage board should be connected to a collector pipe near the base of the wall and discharged into a sump. The use of full-face drainage board will reduce the likelihood of seepage and/or water accumulation at the face of the permanent wall, there is still potential for these conditions to occur. If these conditions are of concern, these areas should consider waterproofing and the design team should engage a waterproofing specialist.
Perimeter drains should be installed near the base of the perimeter wall foundations. The perimeter drains should be a perforated pipe with a diameter of at least 4 inches and should be surrounded by 6 inches of drainage material. All drainage pipes should be sloped to drain.
Additional consultation between Hart Crowser and the design team may be needed to fully develop the permanent drainage design.
GEOTECHNICAL RECOMMENDATIONS FOR CONSTRUCTION
Soldier Pile Installation We recommend the following for construction of soldier piles:
Conditions such as caving soil and groundwater can loosen soil at the bottom of the soldier pile borehole and reduce bearing capacity in the zone of disturbed soil. Tieback de-tensioning and shoring failure could occur if bearing capacity is inadequate and soldier piles settle under the vertical component of the inclined tieback load. We recommend that a Hart Crowser representative closely monitor soldier pile installation for these conditions so that construction methods can be adjusted accordingly to prevent softening or excessive disturbance of the soil at the bottom of the soldier piles.
The contractor should be prepared to case the soldier pile holes where loose soils or groundwater seepage could cause loss of ground during drilling. Fill soils and wet sandy soils can be especially prone to caving and may require casing. The actual need for casing should be determined in the field at the time of installation.
The contractor should tremie concrete to the bottom of soldier pile holes. Neither lean mix nor controlled density fill should be end-dumped through water or slurry.
Drilling mud should not be used unless reviewed and approved by the geotechnical and structural engineer.

701 Dexter Avenue North | 17
19437-00 April 23, 2019
Soldier pile shoring construction may be difficult if cobbles or loose sand and gravel are encountered in the excavation. If these conditions are encountered, substantial soil raveling could occur. The contractor should be prepared to control these conditions.
Hart Crowser should review any soldier piles that deflect more than 1/2 inch to try to identify the cause of the deflection and to determine whether remedial measures are required.
Lagging Installation We recommend the following for lagging installation:
Prompt and careful installation of lagging, particularly in areas of seepage and loose soil, is important to maintain the integrity of the excavation. The contractor should be prepared to place lagging in small vertical increments as the soil conditions require and should also be prepared to backfill voids caused by ground loss behind the shoring system. The proper installation should be the responsibility of the shoring contractor to prevent soil failure, sloughing, and loss of ground, and to provide safe working conditions.
Backfill voids greater than 1 inch using sand, pea gravel, or a porous slurry. Backfill the void spaces progressively as the excavation deepens. The backfill must not allow potential hydrostatic pressure buildup behind the wall. Drainage behind the wall must be maintained or hydrostatic water pressure should be added to the recommended lateral earth pressures.
Tieback Installation We recommend the following for tieback installation:
Pump structural grout into the anchor zone using a grout hose or tremie hose placed at the bottom of the anchor.
Fill the portion of the tieback in the no-load zone with a non-cohesive mixture of sand-pozzolan-water or equivalent; or, install a bond breaker such as plastic sheathing or a PVC pipe around the tieback within the no-load zone.
Grout and backfill tiebacks immediately after placing the anchor. Do not leave anchor holes open overnight to prevent collapse of the holes, ground loss, and surface subsidence.
Take care not to mine out large cavities in granular soil.
Maintain continuous cutting return if using pneumatic drilling techniques so that air pressure is not channeled to nearby utility vaults, corridors, or subgrade slabs, which may damage such structures.
During tieback drilling, wet or saturated zones may be encountered, and caving or blow-in could occur. Solid flight augers should not be used for tieback installation. We recommend a smooth-cased tieback installation method (such as a Klemm type rig) be used.

18 | 701 Dexter Avenue North
19437-00 April 23, 2019
The tiebacks will be tested to confirm the appropriateness of the anchor design values and to verify that a suitable installation is achieved. The recommended procedures for verification and proof testing are presented below.
Tieback Anchor Testing Program The tieback anchor testing program should include verification testing of select tiebacks and proof testing of all production tiebacks. We recommend that tieback testing be done in general accordance with the recommendations in the publication Recommendations for Prestressed Rock and Soil Anchors by the Post Tensioning Institute (PTI 2014) and the recommendations below.
Verification Tests We recommend a minimum of one verification (performance) test per soil type and at least two total before installation of the production anchors in each layer to validate the design pullout value. Hart Crowser will work with the contractor to select the testing locations. Additional verification tests may be required when creep susceptibility is suspected or when varying ground conditions are encountered.
Verification tiebacks should be installed by the same methods, personnel, material, and equipment as the production tiebacks; deviations may require additional verification testing, as determined by the engineer. If different types of equipment or installation methods are used, at least two successful verification tests should be performed for each installation method and each soil type.
Verification tests load the tieback to 200 percent of the design load (DL) and include a 60-minute hold time at 150 percent of the design load. The tieback design loads will be on the shoring drawings. The tieback load should not exceed 80 percent of the steel’s ultimate tensile strength. Verification test tiebacks should be incrementally loaded and unloaded using the schedule in Table 8. Unloading should be completed for each load increment down to the alignment load, with each reload increment held until a stable deflection is obtained.
Table 8 – Tieback Verification Test Schedule
Load Level Hold Time Alignment Load Until Stable
0.25*DL 10 minutes
0.5*DL 10 minutes
0.75*DL 10 minutes
1.0*DL 10 minutes
1.25DL 10 minutes
1.5*DL 60 minutes
1.75*DL 10 minutes
2.0*DL 10 minutes
701 Dexter Avenue North | 19
19437-00 April 23, 2019
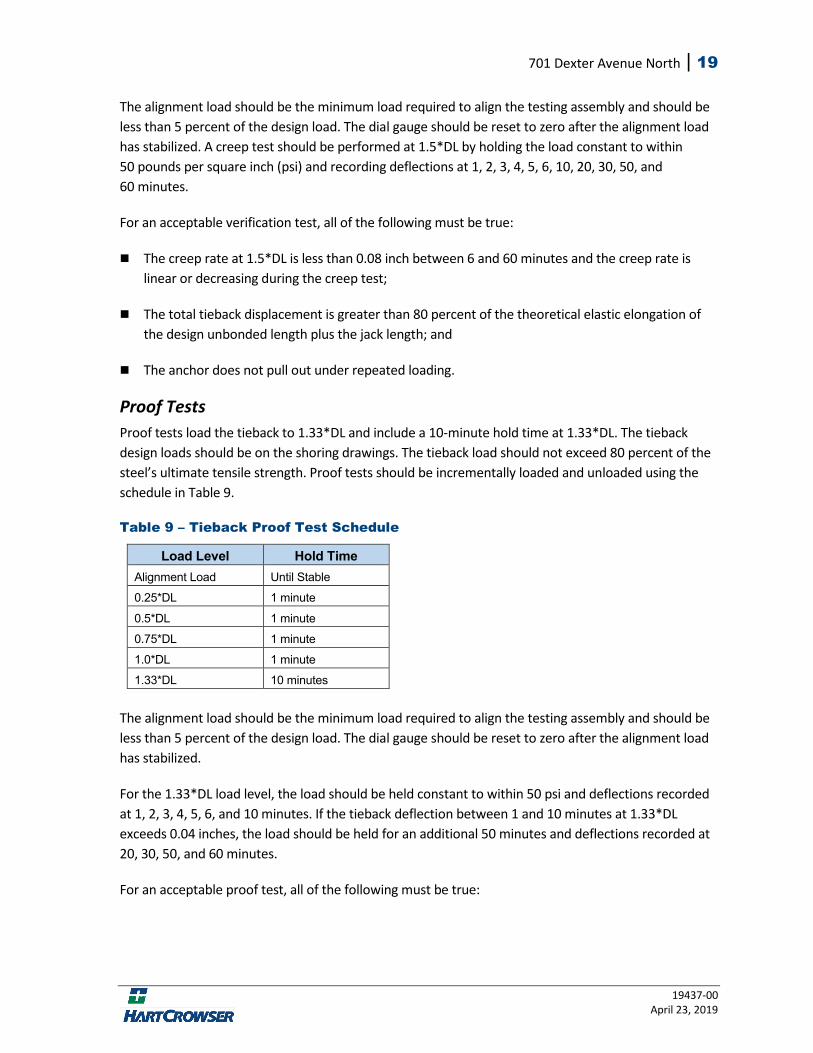
The alignment load should be the minimum load required to align the testing assembly and should be less than 5 percent of the design load. The dial gauge should be reset to zero after the alignment load has stabilized. A creep test should be performed at 1.5*DL by holding the load constant to within 50 pounds per square inch (psi) and recording deflections at 1, 2, 3, 4, 5, 6, 10, 20, 30, 50, and 60 minutes.
For an acceptable verification test, all of the following must be true:
The creep rate at 1.5*DL is less than 0.08 inch between 6 and 60 minutes and the creep rate is linear or decreasing during the creep test;
The total tieback displacement is greater than 80 percent of the theoretical elastic elongation of the design unbonded length plus the jack length; and
The anchor does not pull out under repeated loading.
Proof Tests Proof tests load the tieback to 1.33*DL and include a 10-minute hold time at 1.33*DL. The tieback design loads should be on the shoring drawings. The tieback load should not exceed 80 percent of the steel’s ultimate tensile strength. Proof tests should be incrementally loaded and unloaded using the schedule in Table 9.
Table 9 – Tieback Proof Test Schedule
Load Level Hold Time Alignment Load Until Stable
0.25*DL 1 minute
0.5*DL 1 minute
0.75*DL 1 minute
1.0*DL 1 minute
1.33*DL 10 minutes The alignment load should be the minimum load required to align the testing assembly and should be less than 5 percent of the design load. The dial gauge should be reset to zero after the alignment load has stabilized.
For the 1.33*DL load level, the load should be held constant to within 50 psi and deflections recorded at 1, 2, 3, 4, 5, 6, and 10 minutes. If the tieback deflection between 1 and 10 minutes at 1.33*DL exceeds 0.04 inches, the load should be held for an additional 50 minutes and deflections recorded at 20, 30, 50, and 60 minutes.
For an acceptable proof test, all of the following must be true:

20 | 701 Dexter Avenue North
19437-00 April 23, 2019
The creep rate at 1.33*DL is less than 0.04 inches between 1 and 10 minutes or less than 0.08 inches between 6 and 60 minutes and the creep rate is linear or decreasing during the creep test;
The total tieback displacement is greater than 80 percent of the theoretical elastic elongation of the design unbonded length plus the jack length; and
The anchor does not pull out under repeated loading.
Shoring Monitoring Program A shoring monitoring program is recommended to provide early warning of the potential need for remedial measures if the shoring does not perform as expected. The monitoring program should include a pre-construction survey, periodic surveys during construction, inclinometer installations, and a post-construction survey.
Pre-Construction Survey A pre-construction survey documents the condition of existing streets, utilities, and buildings. The survey should include video and/or photographic documentation. The size and location of existing cracks in streets and buildings should receive special attention and may be monitored with a crack gauge.
Construction Survey We recommend optical surveys of horizontal and vertical movement of: (1) the surface of the adjacent streets, (2) utilities adjacent to the site, (3) buildings adjacent to the site, and (4) the shoring system itself.
For monitoring of adjacent improvements, establish two reference lines adjacent to the excavation at horizontal distances back from the excavation face of about 1/3*H and H, where H is the final excavation height. Typically, these lines will be established near the curb line and across the street from the excavation face. Monitoring of utilities should be coordinated with the utility owner. Survey points on adjacent buildings can be set either at the base, on the roof, or on some other convenient point of the buildings, and should include tiltmeters with several months of automated baseline recordings. Shoring monitoring should include optical surveys of vertical and horizontal movement at the top of every other soldier pile, and every tieback on every other soldier pile.
Optical surveys should have an accuracy of at least 0.005 foot, in both the vertical and horizontal directions. All reference points on the ground surface should be installed and baselined before excavation begins.
The frequency of measurements will depend on the results of previous measurements and the rate of construction. Measurements on the external points should be taken twice a week through construction until below-grade structural elements (floors, decks, columns, etc.) are completed, or as specified by the shoring designer and geotechnical engineer. Readings at the top of soldier piles should

701 Dexter Avenue North | 21
19437-00 April 23, 2019
also be taken at least twice a week during this time. We recommend the owner hire an independent surveyor to perform the survey at least twice per week with the other reading taken by the contractor or contractor’s surveyor.
All monitoring data should be submitted to Hart Crowser for weekly review.
Post-Construction Survey A post-construction survey includes reviewing the pre-construction survey and comparing it to post-construction conditions. The survey should include video and/or photographic documentation. Special attention should be given to changes in the number, size, and location of cracks in streets and buildings.
Mat Foundation Construction Hart Crowser must observe exposed subgrades before mat construction to confirm design assumptions about subsurface conditions and subgrade preparation.
The exposed subgrade should be carefully prepared and protected before concrete placement. Considering the high allowable bearing pressures, any loosening of the materials during construction could result in more settlement and poor mat performance. It is important that foundation excavations be cleaned of loose or disturbed soil before placing any concrete and that there is no standing water in any foundation excavation. These conditions should be observed by our representative.
The foundation settlement estimated herein assumes that careful preparation and protection of the exposed subgrade will occur before concrete placement. Before placing concrete for footings, subgrade soil should be in a very dense, non-yielding condition. Any disturbed soil should be removed.
We recommend placing a 2- to 4-inch-thick lean or structural concrete slab to protect subgrade soils from being softened by water or construction activities after it is exposed. Concrete may only be placed over very dense, non-yielding soil after the subgrade has been checked by Hart Crowser.
Lean mix concrete shall be in accordance with 2011 City of Seattle Standard Specifications Section 6-02.3(2)D. Lean concrete shall contain between 145 and 200 pounds of cement per cubic yard and have a maximum water-to-cement ratio of 2.
Earthwork Recommendations
Site Preparation and Grading We recommend all site grading, paving, and any utility trenching be conducted during relatively dry weather conditions.
It may be necessary to relocate or abandon some utilities. Excavation of these utility lines will probably occur through fill. Abandoned underground utilities should be removed or completely grouted. Ends of

22 | 701 Dexter Avenue North
19437-00 April 23, 2019
remaining abandoned utility lines should be sealed to prevent piping of soil or water into the pipe. Soft or loose backfill should be removed, and excavations should be backfilled with structural fill. Coordination with the utility agency is generally required.
Structural Fill Backfill placed within the building area or below paved areas should be considered structural fill. We make the following recommendations for structural fill:
For imported soil to be used as structural fill, use a clean, well-graded sand or sand and gravel with less than 5 percent by weight passing the U.S. No. 200 mesh sieve (based on the minus 3/4-inch fraction). Compaction of soil containing more than about 5 percent fines may be difficult if the material is wet or becomes wet during rainy weather. (Note that we do not think the excavated soils from the site will be suitable for reuse as structural fill.)
Place and compact all structural fill in lifts with a loose thickness no greater than 10 inches. For hand-operated “jumping jack” compactors, loose lifts should not exceed 6 inches. For small vibrating plate/sled compactors, loose lifts should not exceed 3 inches.
Compact all structural fill to at least 95 percent of the modified Proctor maximum dry density (as determined by ASTM D 1557 test procedure).
Control the moisture content of the fill to within 2 percent of the optimum moisture. Optimum moisture is the moisture content corresponding to the maximum Proctor dry density.
In wet subgrade areas, clean material with a gravel content of at least 30 to 35 percent may be necessary. Gravel is material coarser than a U.S. No. 4 sieve.
Before filling begins, provide samples of the structural and drainage fill for laboratory testing. Laboratory testing will include a Proctor test and gradation for structural fill and a gradation for drainage fill. Field testing with a nuclear density gauge uses the maximum dry density determined from a Proctor test, so it is important to complete the laboratory testing as soon as possible, in order to not delay backfilling.
The fill soils and undisturbed native soil have high fines content (soil fraction passing the U.S. No. 200 sieve, such as silt and clay) and are highly moisture sensitive. While the native soil is suitable for structural fill near its optimum moisture content, we do not recommend using on-site soils as structural fill during the wet weather season. The contractor should prepare to use this material as structural fill at their own risk and have a contingency plan in case the soil becomes too wet to meet the acceptance criteria for structural fill.
Temporary Cuts Because of the variables involved, actual slope grades required for stability in temporary cut areas can only be estimated before construction. We recommend that stability of the temporary slopes used for construction be the sole responsibility of the contractor, since the contractor is in control of the
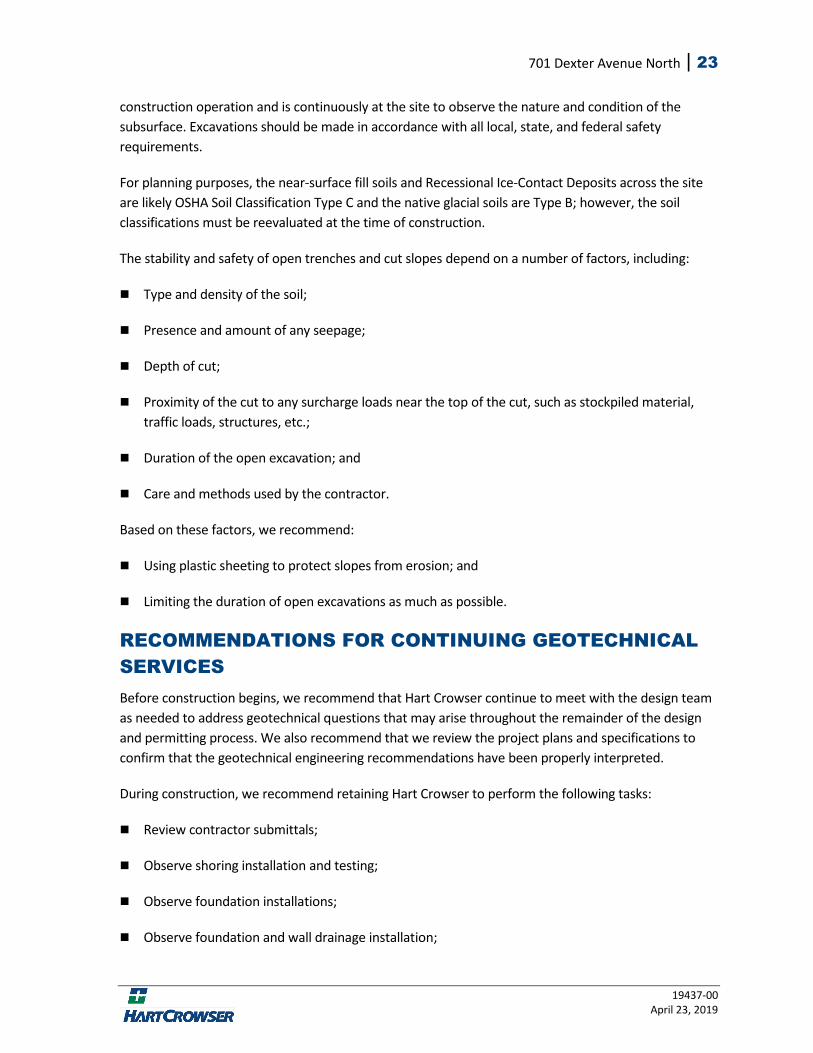
701 Dexter Avenue North | 23
19437-00 April 23, 2019
construction operation and is continuously at the site to observe the nature and condition of the subsurface. Excavations should be made in accordance with all local, state, and federal safety requirements.
For planning purposes, the near-surface fill soils and Recessional Ice-Contact Deposits across the site are likely OSHA Soil Classification Type C and the native glacial soils are Type B; however, the soil classifications must be reevaluated at the time of construction.
The stability and safety of open trenches and cut slopes depend on a number of factors, including:
Type and density of the soil;
Presence and amount of any seepage;
Depth of cut;
Proximity of the cut to any surcharge loads near the top of the cut, such as stockpiled material, traffic loads, structures, etc.;
Duration of the open excavation; and
Care and methods used by the contractor.
Based on these factors, we recommend:
Using plastic sheeting to protect slopes from erosion; and
Limiting the duration of open excavations as much as possible.
RECOMMENDATIONS FOR CONTINUING GEOTECHNICAL SERVICES Before construction begins, we recommend that Hart Crowser continue to meet with the design team as needed to address geotechnical questions that may arise throughout the remainder of the design and permitting process. We also recommend that we review the project plans and specifications to confirm that the geotechnical engineering recommendations have been properly interpreted.
During construction, we recommend retaining Hart Crowser to perform the following tasks:
Review contractor submittals;
Observe shoring installation and testing;
Observe foundation installations;
Observe foundation and wall drainage installation;

24 | 701 Dexter Avenue North
19437-00 April 23, 2019
Provide other observations as required by the City of Seattle;
Attend meetings as needed; and
Provide geotechnical engineering support as needed during construction.
REFERENCES Freeze, R.A. and J.A. Cherry 1979. Groundwater. Prentice-Hall, Englewood Cliffs, New Jersey.
GeoEngineers (2017). Geotechnical Engineering Services, 701 Dexter Building Renovation, Seattle, Washington. October 19.
Otto Roseneau & Associates Inc. (2012). Geotechnical Engineering Report, Temporary Shoring Design, 700 Dexter Avenue North, Seattle, Washington, King County Parcel #2249000285.” April 15.
Post Tensioning Institute (PTI) (2014). PTI DC35.1-14 Recommendations for Prestressed Rock and Soil Anchors, Fourth Edition. Post Tensioning Institute.
Shannon & Wilson, Inc. (2007). Alaskan Way Viaduct & Seawall Replacement Project, Geotechnical and Environmental Data Report, Aurora Section, Washington). January.
Terra Associates, Inc. (2011) “Geotechnical Report, 700 Dexter Avenue, Seattle, Washington.” May 30.
\\seafs\Projects\Notebooks\1943700_701_Dexter_Avenue_North_Geotech\Deliverables\Reports\Geotechnical Design Report\701 Dexter Avenue North - Geotechnical Design Report.docx

Doc
umen
t Pat
h: L
:\Not
eboo
ks\1
9437
00_7
01_D
exte
r_Av
enue
_Nor
th_G
eote
ch\G
IS\1
9437
00-A
B (V
Map
).mxd
Dat
e: 4
/1/2
019
Use
r Nam
e: e
vinf
airc
hild
0 2,000 4,0001,000Feet
Project Location
Seattle
WASHINGTON
Oregon
Idaho
Canada
Sources: Esri, HERE, Garmin, USGS, Intermap, INCREMENT P, NRCan, Esri Japan, METI, Esri China (Hong Kong), Esri Korea, Esri (Thailand),NGCC, © OpenStreetMap contributors, and the GIS User Community
NNote: Feature locations are approximate.
701 Dexter Avenue NorthSeattle, Washington
Vicinity Map19437-00 4/19
Figure
1

Doc
umen
t Pat
h: L
:\Not
eboo
ks\1
9437
00_7
01_D
exte
r_A
venu
e_N
orth
_Geo
tech
\GIS
\194
3700
-AC
(SP
lan)
.mxd
Dat
e: 4
/2/2
019
Use
r Nam
e: e
riclin
dqui
st
!!
!!
!!
!!
!!
!!
!!
+U
""""
!!
!!
!!
!!
!!
""
""
+U>
+U>+U>
!#(
A A'
B' B
GEI-1-17
GEI-2-17
GEI-3A-17
GEI-4-17
GEI-5-17
GEI-6-17
B-112
AB-5
B-1 B-2
TB-303
TB-304
TB-305TB-309
B-337
TB-1
TB-2
B-416B-438
HC-B1
HC-B2HC-B3
HC-B4
AUR
OR
A AV
E N
ROY ST
VALLEY ST
DEX
TER
AVE
N
N
Note: Feature locations are approximate.
0 60 12030Feet
701 Dexter Avenue NorthSeattle, Washington
Site and Exploration Plan19437-00 4/19
Figure
2
Source: Aerial photograph provided by Hexagon Imagery Program Data.
Legend!#( Boring (Hart Crowser 2019)
+U> Monitoring Well (Hart Crowser 2019)
!! Boring (GeoEngineers 2017)
!! Boring (Terra Associates 2011)
+U Monitoring Well (Shannon & Wilson 2005)
"" Boring (Shannon and Wilson 1980)
Boring (Pacific Testing Laboratories 1974)
"" Boring (Shannon and Wilson 1971)
!! Boring (City of Seattle Dept. of Engineering 1970)
Cross Section
Elevation in F
eet (N
AV
D 88)
Elevation in F
eet (N
AV
D 88)
Distance in Feet
-35
-30
-20
-10
0
10
20
30
40
50
60
70
80
-35
-30
-20
-10
0
10
20
30
40
50
60
70
80
0 20 40 60 80 100 120 140 160 180 200 220 240 260 280
GEI-3A-17
(Proj. 5' S)
GEI-6-17
(Proj. 19' N)
GEI-1-17
(Proj. 10' S)
B-112
(Proj. 8' S)
?
?
?
?
?
?
?
?
?
?
?
?
?
?
?
?
?
?
?
?
?
?
?
?
?
?
?
?
?
?
?
?
?
?
?
?
?
?
?
?
?
?
?
?
?
?
?
8
12
1
26
81
50/5"
50/4"
50/4"
86
83/11"
17
50/3"
50/1st 6"
50/1st 5.5"
50/3"
50/1st 4"
50/1st 3"
HC-B2
(Proj. 18' S)
7
10
25
21
13
31
38
88
50/5"
50/1st 3"
50/5"
50/1st 5"
50/1st 5"
50/1st 5"
50/1st 3"
50/1st 5"
50/1st 3"
50/1st 4"
50/1st 3"
50/1st 6"
50/1st 5"
HC-B3
(Proj. 8' S)
12
10
3
25
34
50/6"
50/6"
50/6"
20
36
41
50/5"
50/6"
15
9
30
18
38
36
50/5"
50/4"
2
50/5"
50/6"
50/6"
50/6"
50/6"
50/6"
50/6"
50/5"
50/6"
50/6"
50/6"
50/6"
50/8"
50/6"
50/5"
50/3"
50/4"
? ? ?
3/27/19
3/27/19
Figure
19437-00 4/19
Seattle, Washington
701 Dexter Avenue North
3
Generalized Subsurface Cross Section A-A'
File: \\seafs\P
rojects\N
otebooks\1943700_701_D
exter_A
venue_N
orth_G
eotech\C
AD
\1943700-001 (X
Sec).dw
g Layout:S
EC
A
D
ate: 04-22-2019 A
uthor: evinfairchild
Vertical Scale in Feet
Horizontal Scale in Feet
60300
0 15 30
Vertical Exaggeration x 2
A
(West)
A'
(East)
Approximate Bottom of
Europa Apartment Foundations
Proposed Basement
Finish Floor
Legend
Fill
Recessional Ice-Contact Deposits
Recessional Outwash Deposits
Glacial Till Deposits
Glaciolacustrine Deposits
Exploration Number
(Offset Distance and Direction)
Exploration Location
Water Level (ATD)
Water Level
(Date Sampled)
Standard Penetration Resistance in
Blows per Foot
Sample Location
HC-B1
(Proj. 5' N)
9
Note: This subsurface profile is generalized from materials
observed in soil borings. Variations may exist between
profile and actual conditions.
701 Dexter Dexter Ave N
Aurora Ave N
(State Route 99)
3/27/19

Elevation in F
eet (N
AV
D 88)
Elevation in F
eet (N
AV
D 88)
Distance in Feet
-20
-10
0
10
20
30
40
50
60
70
80
-20
-10
0
10
20
30
40
50
60
70
80
0 20 40 60 80 100 120 140 160 180 200 220 240 260 280 297
50/5"
/6.5"
50/6"
76
50/4.5"
50/4"
50/1st 6"
50/1st 6"
50/3"
50/1st 5"
50/4"
50/1st 5"
50/1st 4"
50/1st 3.5"
HC-B1
(Proj. 24' S)
17
16
26
29
19
32
36
50/6"
43
50/4"
50/4"
86/10"
50/1st 6"
50/1st 3"
50/1st 3"
50/1st 6"
50/1st 5"
50/1st 4"
50/1st 5"
50/1st 4"
HC-B4
(Proj. 0')
ATD
? ?
?
?
?
?
?
TB-303
(Proj. 16' N)
GEI-2-17
(Proj. 7' S)
GEI-5-17
(Proj. 6' N)
GEI-4-17
(Proj. 17' S)
??
?
?
?
?
?
?
?
?
?
?
?
?
?
?
?
?
?
? ?
?
?
?
?
50/4"
50/5"
50/5"
12
12
20
16
15
22
34
50/4"
67
10
17
23
37
50
47
50/4"
47
50/4.5"
50/5.5"
50/5"
50/3"
50/3.5"
94/10"
50/3"
50/1"
50/3.5"
70/6"
?
?
?
?
? ??
?
?
?
?
?
?
??
?
?
?
3/27/19
Figure
19437-00 4/19
Seattle, Washington
701 Dexter Avenue North
4
Generalized Subsurface Cross Section B-B'
File: \\seafs\P
rojects\N
otebooks\1943700_701_D
exter_A
venue_N
orth_G
eotech\C
AD
\1943700-001 (X
Sec).dw
g Layout:S
EC
B
D
ate: 04-22-2019 A
uthor: evinfairchild
Vertical Scale in Feet
Horizontal Scale in Feet
60300
0 15 30
Vertical Exaggeration x 2
B
(East)
B'
(West)
Proposed Basement
Finish Floor
Note: This subsurface profile is generalized from materials
observed in soil borings. Variations may exist between
profile and actual conditions.
701 Dexter
Aurora Ave N
(State Route 99)
Dexter Ave N
Legend
Fill
Recessional Ice-Contact Deposits
Recessional Outwash Deposits
Glacial Till Deposits
Glaciolacustrine Deposits
Exploration Number
(Offset Distance and Direction)
Exploration Location
Water Level (ATD)
Water Level
(Date Sampled)
Standard Penetration Resistance in
Blows per Foot
Sample Location
HC-B1
(Proj. 5' N)
9
3/27/19

Figure
19437-00 4/19
Seattle, Washington
701 Dexter Avenue North
5
Temporary and Permanent Lateral Earth
Pressures for Excavation
File
: L
:\N
ote
bo
oks\1
94
37
00
_7
01
_D
exte
r_
Ave
nu
e_
No
rth
_G
eo
te
ch
\C
AD
\1
94
37
00
-0
02
(E
PD
).d
wg
L
ayo
ut:A
ga
in
stS
ho
r2
D
ate
: 0
4-2
3-2
01
9 A
uth
or: e
riclin
dq
uist
Notes:
1. Determine depth of embedment (D) by
moment equilibrium of lateral soil pressures
about point A. Neglect moment resistance of
soldier pile member at point A. D must also be
sufficient to provide necessary vertical capacity.
Minimum embedment depth D of 10 feet.
2. Apparent pressure assumed to act over pile
spacing.
3. Passive pressures assumed to act over 3 times
the grouted soldier pile diameter or the pile
spacing, whichever is smaller. Passive
pressures include Factor of Safety of about 1.5.
4. All dimensions in feet.
5. Do not use these design criteria for design of
any other type of shoring wall.
6. Diagram assumes walls are fully drained,
removing potential for hydrostatic pressure.
7. Apply dynamic load to permanent wall only.
8. Additional surcharges from footings, large
stockpiles, heavy equipment, etc., must be
added to these pressures.
9. Diagrams are not to scale.
NOT TO SCALE
q
s
= 250 psf (Traffic & Temporary Loads)
Recommended Values of M
Adjacent to City Streets
22H
At-Rest Conditions Against Existing Buildings
28H
D (FT)
2'
Base of Excavation
Ground Surface
(Elevation Varies)
Locate All
Anchors Behind
this Line
NO LOAD ZONE
Tieback
Anchor (Typ.)
20°±5°
Typical
60°
2/3 H
1
H/4
0.3q
s
(psf)
2/3 H
n+1
H
1
A
H
n+1
P
(psf)
Apparent Earth Pressures
400*D
Dynamic Inertial
Increment
Z*H
H
(FT)
Assum
ed H
inge at A
P =
M*H
H -
1
3
H
1
-
1
3
H
n+1
B. Vertical Capacity of Soldier Pile
D (FT)
(qa)
B (FT)
Base of Excavation
(fs)
2'
(fs)
Allowable
Friction
(qa)
Allowable
End Bearing
A. Lateral Soil Pressures for Soldier Pile Wall with Multiple Levels of Tiebacks/Bracing
C. Tentative Anchor Pullout
Resistance
For design purposes, use allowable load transfer (adhesion):
Fill 1.0 ksf
Recessional Ice-Contact Deposits
and Recessional Outwash Deposits 1.5 ksf
Till Deposits 2.5 ksf
Dynamic Inertial Increment, Z*H
Walls adjacent to city streets, alleys, and buildings
7H
Recessional Outwash
Till Deposits
Traffic Temporary
Loads
1.5 ksf ≤ 30 ksf
5D
B
2 ksf ≤ 30 ksf
5D
B

Figure
19437-00
4/19
Seattle, W
ashington
701 D
exter A
venue N
orth
6
Su
rc
harg
e P
re
ssu
re
s D
ete
rm
in
atio
n o
f L
ateral
Pre
ss
ure
A
ctin
g o
n A
dja
cen
t S
ho
rin
g
File: L:\Notebooks\1943700_701_Dexter_Avenue_North_Geotech\CAD\1943700-002 (EPD).dwg Layout:AdjShor Date: 04-01-2019 Author: evinfairchild
A. Strip Footing
Cross Section View
B(1). Small Isolated Footing
Cross Section View
Notes:
1. Lateral pressures from adjacent structures should be added to lateral pressures on Figure 5.
2. Wall footings acting other than parallel to the excavation can be treated as series of discrete point
loads, using Diagram B.
3. Contact Hart Crowser for surcharge recommendations, if necessary.
Ground Surface
C. Continuous Wall Footing
Parallel to Excavation
Cross Section View
d
D
αq
β/2
β
σ
h
σ
h
=K*0.64q(β-sinβcos2α)
Base of
Excavation
Definition and Units
Q Footing Load in Pounds
D Excavation Depth below Footing in Feet
d Depth to Base of Footing in Feet
σ
h
Lateral Soil Pressure in PSF
q Unit Loading Pressure in PSF
q' Footing Load in Pounds per Foot
α, β Radians
K
1
Conditions
0.35
Active earth pressure on a flexible wall (e.g., shoring)
0.5
At-rest conditons, where surcharge loads exist prior to
excavation
1.0
At-rest conditions, where surcharge loads are applied
after construction on permanent wall
Ground Surface
Ground Surface
d
D
d
D
z=
nD
z=
nD
Base of
Excavation
σ
h
σ
h
q'
x=mD
Q
x=mD
(For m>0.4)
σ
h
=K
1
(For m≤ 0.4)
σ
h
=K
1
1.77Q m²n²
D² (m²+n²
)³
0.28Q n²
D² (0.16+n²)³
Line Load
Pressure
(For m>0.4)
σ
h
=K
1
(For m≤ 0.4)
σ
h
=K
1
1.28q' m²n
D (m²+n²)²
q' 0.2 n
D (0.16+n²)²
B(2). Plan View
α
σ
h
σ
h
Q
mD
σ
h
=σ
h
cos² (1.1α)
Base of
Excavation
19437-00 April 23, 2019
ATTACHMENT 1 Preliminary Dewatering Assessment and Slug Test
Results

3131 Elliott Avenue, Suite 600 Seattle, Washington 98121 Tel 206.324.9530
MEMORANDUM DATE: April 18, 2019 TO: Ms. Maggie Capelle – Alexandria Real Estate Equities, Inc. FROM: Angie Goodwin, LHG
Roy Jensen, LHG and Julie Wukelic
RE: Dewatering Assessment and Slug Test Results 701 Dexter Avenue North 19437-00 This memorandum presents our assessment to support construction dewatering and permanent drainage design during redevelopment of the 701 Dexter Avenue North project site (Site) in Seattle, Washington. Our hydrogeology assessment is based on our review of exploration logs, aquifer testing, historical aquifer testing of the site and surrounding sites, grain size analysis completed at the site, our discussions with the project team, and our experience with similar projects.
We understand that Alexandria Real Estate Equities, Inc. (AREE) has acquired the property and plans to demolish the existing building and construct a new 10-story mixed-use building with three levels of below-grade parking. The finished floor level of the lowest basement is at approximately an elevation of 29 feet (NAVD 88), per the conceptual drawings. The bottom of the excavation will be at approximately an elevation of 24 feet (assuming a foundation thickness of 5 feet). With the removal of the existing building, the new development will extend to the property limits.
Subsurface Conditions Our understanding of the subsurface conditions is based on historical reports for the Site and surrounding sites. The reports reviewed are the following:
Draft Geotechnical Report, 700 Dexter Avenue by Terra Associates, Inc., dated July 28, 2017.
Geotechnical Engineering Services, 701 Dexter Building Renovation by GeoEngineers, dated October 19, 2017.

Alexandria Real Estate Equities, Inc. 19437-00 April 18, 2019 Page 2
Final Interim Action Work Plan, American Linen Supply Co – Dexter Avenue Site, 700 Dexter Avenue North by PES Environmental, Inc, dated August 2018.
Additional review of subsurface conditions is provided in the preliminary geotechnical engineering memorandum prepared by Hart Crowser, dated February 12, 2019.
Environmental Concerns
The property across the street to the east of the Site is the Former American Linen Supply Company, which has documented soil and groundwater contamination of chlorinated solvents, petroleum, and benzene, toluene, ethylbenzene, and xylene (BTEX). American Linen was formerly an industrial laundry that used dry cleaning solvents and is the source of a significant environmental release to groundwater in the South Lake Union area. Contaminated groundwater has migrated from the American Linen site to the east/southeast/south of the property, in the direction of groundwater flow. However, groundwater flow can change locally and there is evidence of this at other project sites in the South Lake Union area, which is likely caused by the major property development in the area with temporary and permanent dewatering.
Soil
In general, the soils observed in the explorations at the Site consist of the following soil units, described in the order they were encountered from the ground surface down.
Fill – fill materials were encountered to depths ranging from about 0 to 15 feet below ground surface (bgs) in the northern portion of the site. The fill material ranges in consistency from loose to medium dense and generally consists of sand with varying amounts of silt and gravel as well as soft to stiff silt with varying amounts of sand and occasional gravel.
Recessional Ice-Contact Deposits – recent deposits that are non-glacially consolidated. The Ice-Contact soils consist of medium dense sand to depths of 5 to 15 feet. These soils should be relatively more permeable than the underlying glacially consolidated soils.
Recessional Outwash Deposits – non-glacially consolidated sand and gravel, encountered at depths from 10 to 20 feet bgs. These soils are typically dense to very dense.
Glacial Till Deposits – glacial till was encountered below the non-glacially consolidated soils and the Advance Outwash soils to depths of 55 to 81 feet. Consists of very dense sands and hard silts.
Glaciolacustrine Deposits – Only encountered in boring HC-B1 at a depth of 53 feet, consisting of hard lean clay. This material should not be encountered during the excavation.
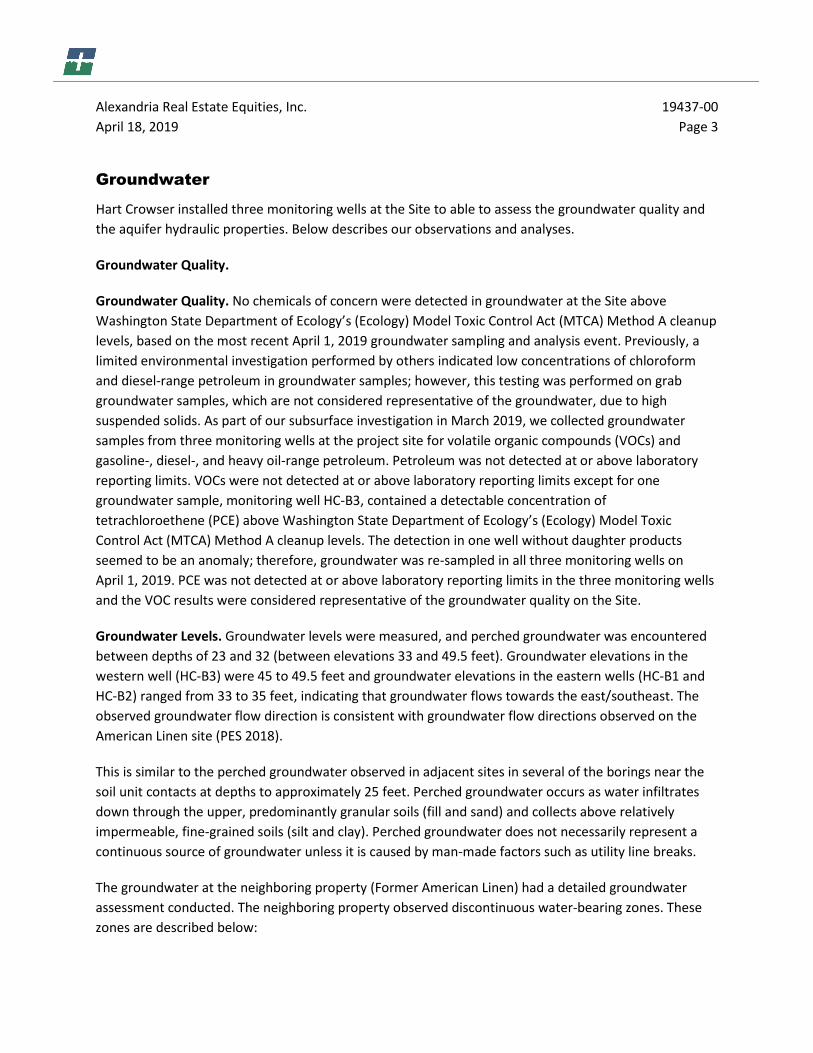
Alexandria Real Estate Equities, Inc. 19437-00 April 18, 2019 Page 3
Groundwater
Hart Crowser installed three monitoring wells at the Site to able to assess the groundwater quality and the aquifer hydraulic properties. Below describes our observations and analyses.
Groundwater Quality.
Groundwater Quality. No chemicals of concern were detected in groundwater at the Site above Washington State Department of Ecology’s (Ecology) Model Toxic Control Act (MTCA) Method A cleanup levels, based on the most recent April 1, 2019 groundwater sampling and analysis event. Previously, a limited environmental investigation performed by others indicated low concentrations of chloroform and diesel-range petroleum in groundwater samples; however, this testing was performed on grab groundwater samples, which are not considered representative of the groundwater, due to high suspended solids. As part of our subsurface investigation in March 2019, we collected groundwater samples from three monitoring wells at the project site for volatile organic compounds (VOCs) and gasoline-, diesel-, and heavy oil-range petroleum. Petroleum was not detected at or above laboratory reporting limits. VOCs were not detected at or above laboratory reporting limits except for one groundwater sample, monitoring well HC-B3, contained a detectable concentration of tetrachloroethene (PCE) above Washington State Department of Ecology’s (Ecology) Model Toxic Control Act (MTCA) Method A cleanup levels. The detection in one well without daughter products seemed to be an anomaly; therefore, groundwater was re-sampled in all three monitoring wells on April 1, 2019. PCE was not detected at or above laboratory reporting limits in the three monitoring wells and the VOC results were considered representative of the groundwater quality on the Site.
Groundwater Levels. Groundwater levels were measured, and perched groundwater was encountered between depths of 23 and 32 (between elevations 33 and 49.5 feet). Groundwater elevations in the western well (HC-B3) were 45 to 49.5 feet and groundwater elevations in the eastern wells (HC-B1 and HC-B2) ranged from 33 to 35 feet, indicating that groundwater flows towards the east/southeast. The observed groundwater flow direction is consistent with groundwater flow directions observed on the American Linen site (PES 2018).
This is similar to the perched groundwater observed in adjacent sites in several of the borings near the soil unit contacts at depths to approximately 25 feet. Perched groundwater occurs as water infiltrates down through the upper, predominantly granular soils (fill and sand) and collects above relatively impermeable, fine-grained soils (silt and clay). Perched groundwater does not necessarily represent a continuous source of groundwater unless it is caused by man-made factors such as utility line breaks.
The groundwater at the neighboring property (Former American Linen) had a detailed groundwater assessment conducted. The neighboring property observed discontinuous water-bearing zones. These zones are described below:

Alexandria Real Estate Equities, Inc. 19437-00 April 18, 2019 Page 4
Shallow Zone is an unconfined water-bearing zone in the fill, recent non-glacially consolidated deposits, and upper portion of the glacial till. The representative Shallow Zone elevation is above 20 feet (approximately 35 to 60 feet below 701 Dexter site grades).
Intermediate A and B Zones are a dense to very dense, semi-confined to confined water-bearing zone in the glacial till. The representative Intermediate A and B Zone elevations are between 20 and –45 feet (approximately 60 to 125 feet below 701 Dexter site grades).
Deep Zone is a deeper, very dense confined water-bearing zone in the outwash deposits (found beneath the glacial till). The representative Deep Zone elevation is between –45 and –100 feet (approximately 125 to 180 feet below 701 Dexter site grades).
Three monitoring wells (RMW-5, MW-112, MW-138) are located in the right-of-way adjacent to the 701 Dexter project site. RMW-5 is screened in the Shallow Zone with groundwater elevations ranging from 24.3 to 39 feet. Well MW-112 is screened in the Intermediate B Zone and had a groundwater elevation ranging from 15 to 21 feet. MW-138 is screened in the Deep Zone with groundwater elevation measured at elevation 12.28 feet. As the bottom of the excavation at the project site is anticipated to be at about an elevation of 24 feet, we anticipate that the excavation will encounter the Shallow Zone.
Groundwater levels (perched and otherwise) should be expected to fluctuate seasonally. Groundwater levels at the American Linen site vary seasonally by as much as 8 feet (PES 2018).
Aquifer Testing and Results
Site Aquifer Test. Slug tests were performed in monitoring well HC-B1, HC-B2, and HC-B3 in March 2019 to estimate the hydraulic conductivity of the subsurface soils. Slug tests are performed by rapidly inserting or removing a solid PVC rod into a well and measuring the recovery of the water levels during the tests.
Hydraulic conductivities determined from slug tests range from 1. x 10-5 to 1 x 10⁻⁴ centimeters per second (cm/sec) [0.03 to 0.28 feet/day]. The results of the falling and rising head tests compare favorably. This hydraulic conductivity range is typical for silty sand (Freeze and Cherry 1979). The results of slug testing are in Attachment 1A.
Historical Aquifer Test. At the former American Linen site, hydraulic conductivities were estimated using slug tests on the Intermediate A and B, and Deep Zones. The lithologies in the wells ranged from clay to gravel. The hydraulic conductivity of silty sands and clays ranged from 1.9 x 10⁻⁵ cm/sec and 4.3 x 10⁻⁴ cm/sec, which is within the range of results for silty sand at the Site.
A geotechnical report for the former American Linen (Terra Associates, dated July 28, 2017) recommended using hydraulic conductivity of 8 feet/day (3 x 10⁻³ cm/sec) based on grain size for the

Alexandria Real Estate Equities, Inc. 19437-00 April 18, 2019 Page 5
temporary dewatering design. The recommended hydraulic conductivity is extremely high for silty glacial soils present at the Site.
Dewatering Review The proposed construction excavations are expected to extend below the groundwater table and shoring and dewatering will be required to provide a stable excavation and minimize dewatering induced settlement. The following assumptions were used in evaluating dewatering requirements.
The construction area requiring temporary dewatering is approximately 120 feet by 225 feet (27,000 square feet).
The excavation for the building will extend to depths of 35 to 50 feet, based on the varying ground surface elevations.
The bottom of the construction excavation will be at an elevation of 24 feet.
The measured groundwater elevation across the Site varies from 33 to 49.5 feet.
The dewatering goal during construction will be to drain shallow groundwater to a depth of 2 feet below the excavation, or an elevation of 22 feet.
The goal of a permeant drainage system will be to drain shallow groundwater to a depth at the top of the slab, or an elevation of 29 feet.
The hydraulic conductivity of glacial silty sand unit was based on the results of slug testing supplemented by grain size analysis and our experience with similar units. The hydraulic conductivity was estimated to be 1 x 10⁻⁴ cm/sec (0.28 feet/day).
A steady-state groundwater flow model using MODFLOW was developed to provide planning-level estimates of dewatering required to maintain groundwater below the construction excavations and volumes of water required to maintain a permanent drainage system.
Temporary dewatering and permeant drainage were simulated using the Drain package in MODFLOW. A series of drain cells, corresponding to the footprint of each excavation was assigned in the model. To simulate dewatering conditions, the drain cells were assigned a groundwater elevation.
Dewatering Recommendations Temporary construction dewatering is required when excavations are completed below the water
table to maintain dry and stable working conditions in the bottom of the excavations. We

Alexandria Real Estate Equities, Inc. 19437-00 April 18, 2019 Page 6
recommend that the groundwater be lowered at least 2 feet below the bottom of the excavation. The amount of water generated during dewatering will depend on the hydraulic conductivity of the water-bearing soils. Because the soils with low hydraulic conductivity will be encountered in the excavation, we expect a relatively low volume of water will be generated to dewater the excavations.
Underground utility corridors can act as preferential pathways, thus increasing the dewatering discharges rates. Discharge will be higher in the winter and early spring months and low during summer and early fall months.
We estimate that steady-state construction dewatering rates will vary from 10 to 30 gallons per minute (gpm), depending on the excavation location, size, and depth, dewatering method, schedule, and soil conditions.
We expect that construction dewatering can be managed using sumps and pumps (i.e. passive dewatering). However, should the subsurface and seasonal conditions require, there may be some level of active temporary dewatering necessary using vacuum well points.
Since the adjacent site to the east has documented groundwater contamination, it is important to assess the site-specific aquifer properties that will help determine if the off-site groundwater contamination would migrate to the Site during dewatering. However, based on the anticipated subsurface conditions and hydrogeologic conditions for the planned excavation, we expect the potential for migration of contamination to be low.
The actual dewatering methods and schedule will be selected by the construction contractor. The contractor should use a qualified licensed hydrogeologist to design the dewatering system. An experienced dewatering contractor should be retained by the general contractor to install and operate the dewatering system. The dewatering plan should be reviewed by Hart Crowser prior to implementing the plan.
We estimate that a permanent drainage system designed to collect groundwater above elevation 29 feet will discharge from 5 to 15 gpm.
Attachments: A1 – Slug Testing Results
\\seafs\Projects\Notebooks\1943700_701_Dexter_Avenue_North_Geotech\Deliverables\Reports\Geotechnical Design Report\Attachment 1\Hydro Assessment April 2019\Hydro Assessment Memo.docx

3131 Elliott Avenue, Suite 600 Seattle, Washington 98121 206.324.9530
MEMORANDUM DATE: April 2, 2019 TO: Project File FROM: Mike Shaljian Roy Jensen, LHG RE: Slug Testing Results
701 Dexter North Seattle, Washington 19437-00 This technical memorandum presents the results of slug testing that was conducted for the proposed development at 701 Dexter Avenue in Seattle, Washington. Slug tests were performed to determine hydraulic conductivity of the formation.
Slug Testing Slug tests are performed by suddenly inserting or removing a solid PVC rod in a well and measuring the recovery of the water levels during the test. A test conducted by the insertion of the PVC rod into the well is referred to as a falling head test and the following removal of the rods is called a rising head test. The water level data generated from the tests were analyzed using the commercial software AquiferWin32 Version 5 (Environmental Simulations, Inc., 2017). The slug test analysis is based on the Bouwer and Rice method (Bouwer and Rice 1976; Bouwer 1989) to obtain an estimated value of hydraulic conductivity of the aquifer.
Slug Testing Results
Slug testing was conducted in wells HC-B1, HC-B2, and HC-B3 on March 21-22, 2019. A summary of monitoring well construction details is provided in Table 1. Shallow soils at the project site consist of poorly graded sand with silt and gravel, poorly graded sand with silt, and silty sand. The wells were screened in the stratigraphic units summarized below:
HC-B1: Upper 4 feet of screened interval consists of silty sand; lower 6 feet consists of sand with silt. HC-B2: Upper 5 feet of screened interval consists of silty sand with gravel; lower 5 feet consists of
silty sand.
701 Dexter North 19437-00 April 2, 2019 Page 2
HC-B3: All of 10 feet screened interval consists of silty sand with gravel.
A summary of slug testing results is provided in Table 2. A hydrograph of HC-B1, HC-B2, and HC-B3 during slug testing is provided in Figures 1 through 3. Two sets of falling and rising head tests were performed on each well, but technical difficulties were encountered at HC-B2 and HC-B3, with only one valid test cycle produced for each of these wells. Representative slug test plots for HC-B1, HC-B2, and HC-B3 are provided in Figures 4 through 6. The results of the falling and rising head tests compare favorably. Hydraulic conductivities determined from slug tests range from 1 x 10⁻⁵ to 1 x 10⁻⁴ centimeters/second (0.03 to 0.28 feet/day). This hydraulic conductivity range is typical for silty sand (Freeze and Cherry 1979).
References Bouwer, H. 1989. The Bouwer and Rice Slug Test – An Update. Ground Water 27(3): 304-309.
Bouwer, H. and R.C. Rice. 1976. A Slug Test for Determining Hydraulic Conductivity of Unconfined Aquifers with Completely or Partially Penetrating Wells. Water Resources Research 12(3): 423-428.
Environmental Simulations, Inc 2017. Guide to Using AquiferWin32 Version 5.
Freeze, R.A. and J.A. Cherry. 1979. Groundwater. Prentice-Hall, Englewood Cliffs, New Jersey.
Attachments: Table 1 – Monitoring Well Construction Summary Table 2 – Summary of Slug Test Results Figure 1 – HC-B1 and HC-B2 Hydrographs Figure 2 ‒ HC-B3 Hydrograph Figure 3 – HC-B1 Representative Slug Test Results Figure 4 – HC-B2 Representative Slug Test Results Figure 5 – HC-B3 Representative Slug Test Results \\seafs\Projects\Notebooks\1943700_701_Dexter_Avenue_North_Geotech\Deliverables\Reports\Geotechnical Design Report\Attachment 1\Slug Test Memo\701 Dexter Slug Test Memo 040219.docx

Table 1 - Monitoring Well Construction Summary
Well ID HC-B1 HC-B2 HC-B3Boring Depth in Feet 60 60 80Well Depth in Feet 40 44 62Screen Interval Depth in Feet 30-40 34-44 52-62Depth to Sediment in Feet (1) 40.1 43.2 60.6Depth to Water in Feet (1) 23.09 26.31 31.77Saturated Thickness in Feet 17.01 16.89 28.83Screened Interval Soil Description SM, SP-SM SM SM
Notes:
(1) Depth to sediment and depth to water measurements were made on March 27th, 2019
SM = Silty sand, Silty sand with gravel
SP-SM = Poorly graded sand with silt
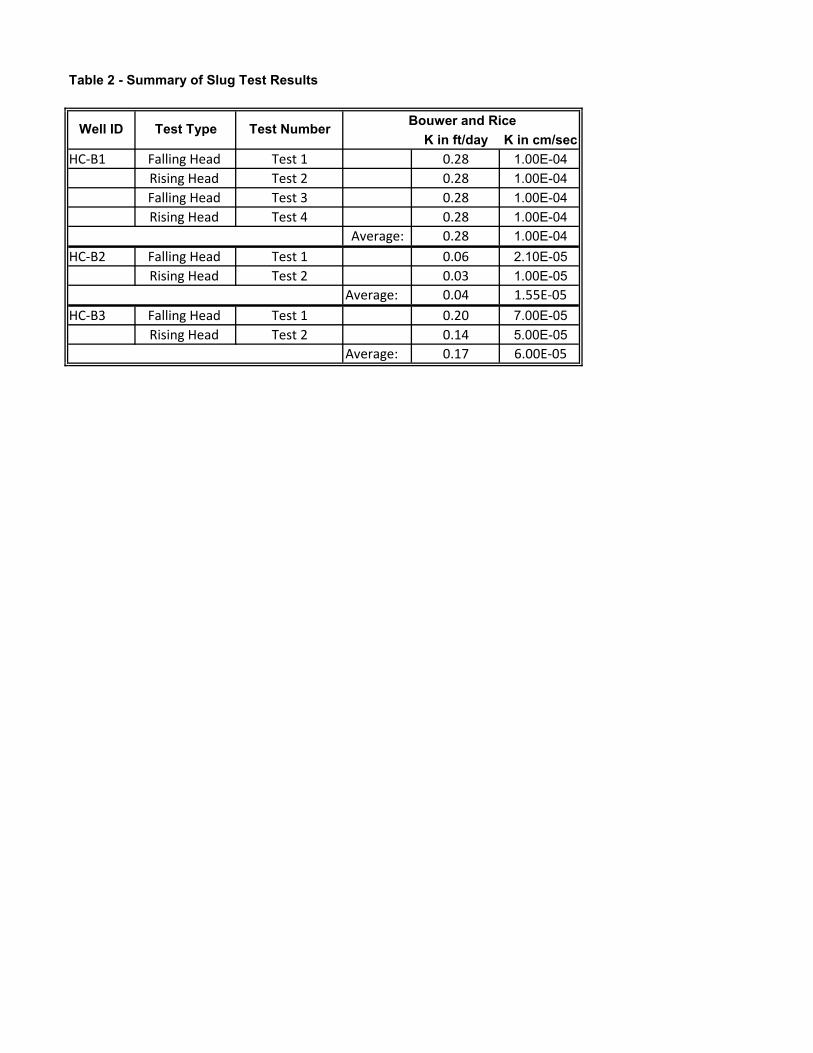
Table 2 - Summary of Slug Test Results
K in ft/day K in cm/secHC-B1 Falling Head Test 1 0.28 1.00E-04
Rising Head Test 2 0.28 1.00E-04Falling Head Test 3 0.28 1.00E-04Rising Head Test 4 0.28 1.00E-04
Average: 0.28 1.00E-04HC-B2 Falling Head Test 1 0.06 2.10E-05
Rising Head Test 2 0.03 1.00E-05Average: 0.04 1.55E-05
HC-B3 Falling Head Test 1 0.20 7.00E-05Rising Head Test 2 0.14 5.00E-05
Average: 0.17 6.00E-05
Well ID Test Type Test Number Bouwer and Rice
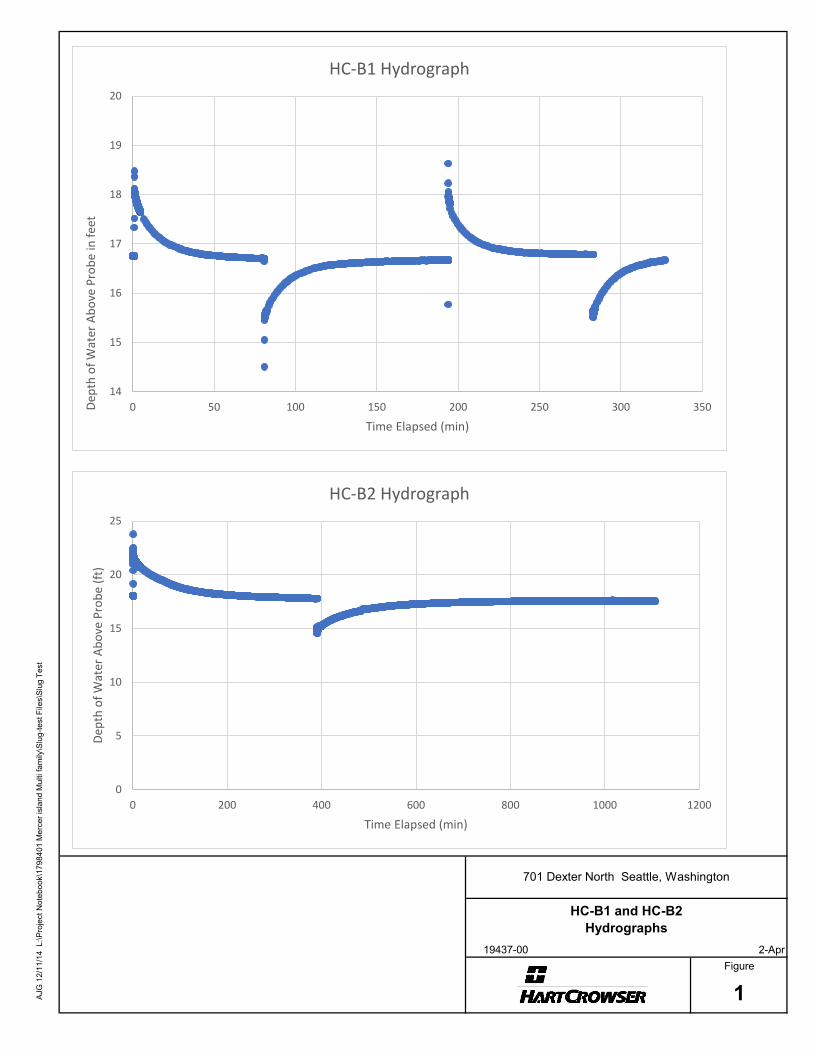
19437-00 2-AprFigure
701 Dexter North Seattle, Washington
HC-B1 and HC-B2 Hydrographs
1AJG
12/
11/1
4 L
:\Pro
ject
Not
eboo
k\17
9840
1 M
erce
r isl
and
Mul
ti fa
mily
\Slu
g-te
st F
iles\
Slug
Tes
t
14
15
16
17
18
19
20
0 50 100 150 200 250 300 350Dept
h of
Wat
er A
bove
Pro
be in
feet
Time Elapsed (min)
HC-B1 Hydrograph
0
5
10
15
20
25
0 200 400 600 800 1000 1200
Dept
h of
Wat
er A
bove
Pro
be (f
t)
Time Elapsed (min)
HC-B2 Hydrograph

19437-00 2-AprFigure
701 Dexter North Seattle, Washington
HC-B3 Hydrographs
2AJG
12/
11/1
4 L
:\Pro
ject
Not
eboo
k\17
9840
1 M
erce
r isl
and
Mul
ti fa
mily
\Slu
g-te
st F
iles\
Slug
Tes
t
0
2
4
6
8
10
12
14
16
18
0 50 100 150 200 250
Dept
h of
Wat
er A
bove
Pro
be in
Fee
t
Time Elapsed (min)
HC-B3 Hydrograph

19437-00 2-AprFigure
701 Dexter North Seattle, Washington
HC-B1 Representative Slug Tests
3AJG
12/
11/1
4 L
:\Pro
ject
Not
eboo
k\17
9840
1 M
erce
r isl
and
Mul
ti fa
mily
\Slu
g-te
st F
iles\
Slug
Tes
t
HC-B1 Falling Head Test 1
100
101
0.0 20.0 40.0 60.0 80.0 100.0
Displa
ceme
nt (ft)
Time (sec) Hydraulic Conductivity 1.0e-004 cm/sec
HC-B1 Rising Head Test 2
100
101
0.0 20.0 40.0 60.0 80.0 100.0
Disp
lacem
ent (f
t)
Time (sec) Hydraulic Conductivity 1.0e-004 cm/sec

19437-00 2-AprFigure
701 Dexter North Seattle, Washington
HC-B2 Representative Slug Tests
4AJG
12/
11/1
4 L
:\Pro
ject
Not
eboo
k\17
9840
1 M
erce
r isl
and
Mul
ti fa
mily
\Slu
g-te
st F
iles\
Slug
Tes
t
HC-B2 Falling Head Test 1
100
101
0.0 40.2 80.4 120.6 160.8 201.0
Displa
ceme
nt (ft)
Time Elapsed (sec) Hydraulic Conductivity 2.1e-005 cm/sec
HC-B2 Rising Head Test 2
100
101
0.0 100.0 200.0 300.0 400.0 500.0
Disp
lacem
ent (
ft)
Time Elapsed (sec) Hydraulic Conductivity 1.0e-005 cm/sec

19437-00 2-AprFigure
701 Dexter North Seattle, Washington
HC-B3 Representative Slug Tests
5AJG
12/
11/1
4 L
:\Pro
ject
Not
eboo
k\17
9840
1 M
erce
r isl
and
Mul
ti fa
mily
\Slu
g-te
st F
iles\
Slug
Tes
t
HC-B3 Falling Head Test 1
100
101
0.0 100.0 200.0 300.0 400.0 500.0
Displa
ceme
nt (ft)
Time Elapsed (sec) Hydraulic Conductivity 7.0e-005 cm/sec
HC-B3 Rising Head Test 2
100
101
0.0 100.0 200.0 300.0 400.0 500.0
Disp
lacem
ent (
ft)
Time Elapsed (sec) Hydraulic Conductivity 5.0e-005 cm/sec

19437-00 April 23, 2019
APPENDIX A Field Exploration Methods and Analysis
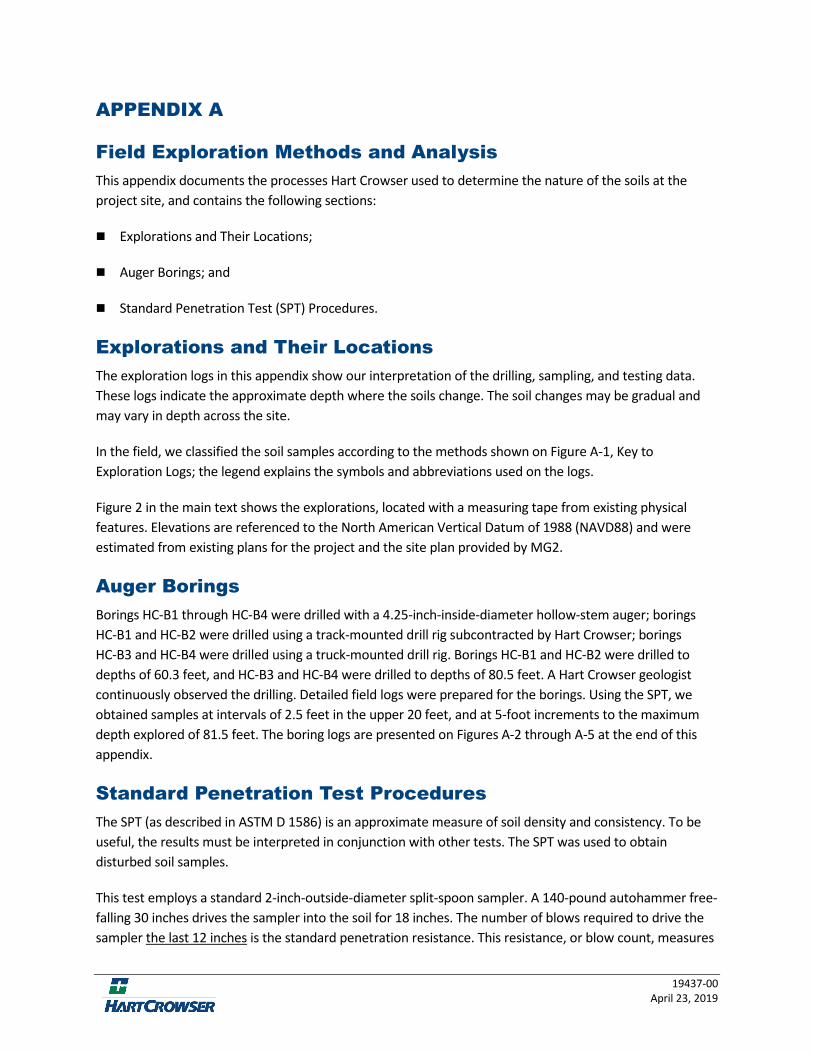
19437-00 April 23, 2019
APPENDIX A
Field Exploration Methods and Analysis This appendix documents the processes Hart Crowser used to determine the nature of the soils at the project site, and contains the following sections:
Explorations and Their Locations;
Auger Borings; and
Standard Penetration Test (SPT) Procedures.
Explorations and Their Locations The exploration logs in this appendix show our interpretation of the drilling, sampling, and testing data. These logs indicate the approximate depth where the soils change. The soil changes may be gradual and may vary in depth across the site.
In the field, we classified the soil samples according to the methods shown on Figure A-1, Key to Exploration Logs; the legend explains the symbols and abbreviations used on the logs.
Figure 2 in the main text shows the explorations, located with a measuring tape from existing physical features. Elevations are referenced to the North American Vertical Datum of 1988 (NAVD88) and were estimated from existing plans for the project and the site plan provided by MG2.
Auger Borings Borings HC-B1 through HC-B4 were drilled with a 4.25-inch-inside-diameter hollow-stem auger; borings HC-B1 and HC-B2 were drilled using a track-mounted drill rig subcontracted by Hart Crowser; borings HC-B3 and HC-B4 were drilled using a truck-mounted drill rig. Borings HC-B1 and HC-B2 were drilled to depths of 60.3 feet, and HC-B3 and HC-B4 were drilled to depths of 80.5 feet. A Hart Crowser geologist continuously observed the drilling. Detailed field logs were prepared for the borings. Using the SPT, we obtained samples at intervals of 2.5 feet in the upper 20 feet, and at 5-foot increments to the maximum depth explored of 81.5 feet. The boring logs are presented on Figures A-2 through A-5 at the end of this appendix.
Standard Penetration Test Procedures The SPT (as described in ASTM D 1586) is an approximate measure of soil density and consistency. To be useful, the results must be interpreted in conjunction with other tests. The SPT was used to obtain disturbed soil samples.
This test employs a standard 2-inch-outside-diameter split-spoon sampler. A 140-pound autohammer free-falling 30 inches drives the sampler into the soil for 18 inches. The number of blows required to drive the sampler the last 12 inches is the standard penetration resistance. This resistance, or blow count, measures

A-2 | 701 Dexter Avenue North
19437-00 April 23, 2019
the relative density of granular soils and the consistency of cohesive soils. The blow counts are plotted on the boring logs at their respective sample depths.
Soil samples were recovered from the split-spoon sampler, field classified, placed into watertight jars, and taken to Hart Crowser’s laboratory for further testing.
In the Event of Hard Driving Occasionally, very dense materials preclude driving the total 18-inch sample. When this happens, the penetration resistance is entered on logs as follows:
Penetration less than 6 inches. The log indicates the total number of blows over the number of inches of penetration.
Penetration greater than 6 inches. The blow count noted on the log is the sum of the total number of blows completed after the first 6 inches of penetration. This sum is expressed over the number of inches driven that exceed the first 6 inches. The number of blows needed to drive the first 6 inches is not reported. For example, a blow count series of 12 blows for 6 inches, 30 blows for 6 inches, and 50 (the maximum number of blows counted within a 6-inch increment for SPT) for 3 inches would be recorded as 80/9.
Monitoring Well Installations Monitoring wells were installed in Borings HC-B1, HC-B2, and HC-B3 to allow long-term water level monitoring at the site. Two-inch-diameter Schedule 40 PVC riser pipe and 2-inch-diameter 0.020-inch machine-slotted screen were used for the well casings and screens. The well screen and casing riser were lowered down through the hollow-stem auger. As the auger was withdrawn, No. 10/20 silica sand was placed in the annular space from the base of the boring to approximately 2 to 3 feet above the top of the well screen.
Well seals were constructed by placing bentonite chips in the annular space on top of the filter sand to within 1 foot of ground surface. The remaining annular space was backfilled with concrete to complete the surface seal. For security, the monitoring wells were completed with a flush-mounted steel monument set in concrete. The monitoring well construction details are illustrated on the boring logs.
The monitoring wells were installed in accordance with Washington State Department of Ecology regulations.

Figure A-1Project:
Location:
Project No.:
701 Dexter
Seattle, WA
19437-00
Key to
Exploration Logs Sheet 1 of 1
Organic Soil; Organic Soil with Sand orGravel; Sandy or Gravelly Organic Soil
OL/OH
CHFat Clay; Fat Clay with Sand or
Gravel; Sandy or Gravelly Fat Clay
Lean Clay; Lean Clay with Sand orGravel; Sandy or Gravelly Lean Clay
CL
Clays
Organics
Highly Organic(>50% organic material)
(based on Atterberg Limits)Silty Clay Silty Clay; Silty Clay with Sand or Gravel;
Gravelly or Sandy Silty Clay
Sand, Gravel
TraceFewCobbles, Boulders
TraceFewLittleSome
Minor Constituents
<55 - 15
<55 - 1015 - 2530 - 45
Liquid Limit (LL)Water Content (WC)Plastic Limit (PL)
3.0" O.D. Split Spoon
SignalCable
VibratingWirePiezometer(VP)
Moisture
DryMoistWet
Absence of moisture, dusty, dry to the touchDamp but no visible waterVisible free water, usually soil is below water table
Cuttings
05
1131
Very looseLoose
Medium denseDense
Very dense
tototototo
>30
totototo
>50
4103050
Very softSoft
Medium stiffStiff
Very stiffHard
0259
16
148
1530
Well Symbols
Sample Description
Relative Density/Consistency
Soil density/consistency in borings is related primarily to the standardpenetration resistance (N). Soil density/consistency in test pits and probes isestimated based on visual observation and is presented parenthetically onthe logs.
N(Blows/Foot)
SILT or CLAY
Consistency
SAND or GRAVEL
Relative DensityN
(Blows/Foot)
Slough
Estimated Percentage
Well Tip or Slotted Screen
CleanGravels
Gravels
Sands withfew Fines
Sands
Sands withFines
(>12% fines)
1.5" I.D. Split Spoon Core Run
Groundwater Indicators
Soil Test Symbols
Sonic Core
Thin-walled SamplerModified CaliforniaSampler
Grab
Sample Symbols
Groundwater Level on Date or At Time of Drilling (ATD)
Groundwater Level on Date Measured in Piezometer
Groundwater Seepage (Test Pits)
Identification of soils in this report is based on visual field and laboratory observations which include density/consistency, moisture condition,grain size, and plasticity estimates and should not be construed to imply field nor laboratory testing unless presented herein. ASTM D 2488visual-manual identification methods were used as a guide. Where laboratory testing confirmed visual-manual identifications, then ASTM D2487 was used to classify the soils.
Gravels withFines
Elastic Silt; Elastic Silt with Sand orGravel; Sandy or Gravelly Elastic Silt
(5-12% fines)
(>12% fines)
Poorly Graded Gravel with Clay;Poorly Graded Gravel with Clay and Sand
Graph
GW-GM
Symbols
GW
GW-GC
GC
SW
SP
SW-SM
SW-SC
SP-SM
SP-SC
SM
SC
ML
MH
(<5% fines)
Poorly Graded Sand with Clay;Poorly Graded Sand with Clay and Gravel
Typical
Descriptions
Well-Graded Gravel;Well-Graded Gravel with Sand
Poorly Graded Gravel;Poorly Graded Gravel with Sand
Clayey Gravel;Clayey Gravel with Sand
%FAL
CACAUCCAUECBRCIDCCIUCCK0DCCK0DSSCK0UCCK0UECRSCNDSSDTGSHYDILCNK0CNkckfMDOCOTPPIDPPSGTRSTVUCUUCVSWC
Percent Passing No. 200 SieveAtterberg Limits (%)
Chemical AnalysisConsolidated Anisotropic Undrained CompressionConsolidated Anisotropic Undrained ExtensionCalifornia Bearing RatioConsolidated Drained Isotropic Triaxial CompressionConsolidated Isotropic Undrained CompressionConsolidated Drained k0 Triaxial CompressionConsolidated k0 Undrained Direct Simple ShearConsolidated k0 Undrained CompressionConsolidated k0 Undrained ExtensionConstant Rate of Strain ConsolidationDirect Simple ShearIn Situ DensityGrain Size ClassificationHydrometerIncremental Load Consolidationk0 ConsolidationConstant Head PermeabilityFalling Head PermeabilityMoisture Density RelationshipOrganic ContentTests by OthersPressuremeterPhotoionization Detector ReadingPocket PenetrometerSpecific GravityTorsional Ring ShearTorvaneUnconfined CompressionUnconsolidated Undrained Triaxial CompressionVane ShearWater Content (%)
Sand Pack
MonumentSurface Seal
Bentonite Seal
Well Casing
Well-Graded Sand;Well-Graded Sand with Gravel
Poorly Graded Sand;Poorly Graded Sand with Gravel
Silty Sand;Silty Sand with Gravel
Silty Gravel;Silty Gravel with Sand
PT
CL-ML
Clayey Sand;Clayey Sand with Gravel
Silt; Silt with Sand or Gravel;Sandy or Gravelly Silt
Fine GrainedSoils
More than 50%of Material
Passing No. 200Sieve
Silts
Well-Graded Gravel with Silt;Well-Graded Gravel with Silt and Sand
Well-Graded Gravel with Clay;Well-Graded Gravel with Clay and Sand
Poorly Graded Gravel with Silt;Poorly Graded Gravel with Silt and Sand
Sandand
SandySoils
More than50% of Coarse
FractionPassing No. 4
Sieve
Graveland
GravellySoils
More than50% of Coarse
FractionRetained onNo. 4 Sieve
CoarseGrained
Soils
More than 50%of Material
Retained onNo. 200 Sieve
GP
GP-GM
GP-GC
GM
Major Divisions
Well-Graded Sand with SiltWell-Graded Sand with Silt and Gravel
(<5% fines)
Well-Graded Sand with Clay;Well-Graded Sand with Clay and Gravel
Poorly Graded Sand with Silt;Poorly Graded Sand with Silt and Gravel
(5-12% fines)
USCS
USCS Soil Classification Chart (ASTM D 2487)
Peat - Decomposing Vegetation -Fibrous to Amorphous Texture
KE
Y T
O E
XP
LO
GS
(S
OIL
ON
LY
) -
J:\
GIN
T\H
C_
LIB
RA
RY
.GL
B -
3/1
5/1
9 1
4:0
5 -
L:\
NO
TE
BO
OK
S\1
94
37
00
_7
01
_D
EX
TE
R_
AV
EN
UE
_N
OR
TH
_G
EO
TE
CH
\FIE
LD
DA
TA
\PE
RM
_G
INT
FIL
ES
\19
43
70
0-B
L.G
PJ -
kzl

<0.1
<0.1
<0.1
<0.1
<0.1
<0.1
<0.1
<0.1
<0.1
<0.1
<0.1
<0.1
S-1PID, No odor,
no sheen
S-2PID, No odor,
no sheen
S-3PID, No odor,
no sheen
S-4PID, No odor,
no sheen
S-5PID, No odor,
no sheen
S-6PID, No odor,
no sheen
S-7PID, No odor,
no sheen
S-8PID, No odor,
no sheen
S-9PID, No odor,
no sheen
S-10PID, No odor,
no sheen
S-11GS, PID,
WC, No odor,no sheen
S-12GS, PID,
WC, No odor,no sheen
S-13
11
in.
12
.5in
.
1
2in
.
1
6in
.
1
1in
.
1
0in
.
5
in.
6in
.
9
in.
850
2150
2850
133442
2650
4050
50
50
4050
3 inches of Asphalt pavement.
POORLY GRADED SAND WITH SILT AND GRAVEL(SP-SM), moist, brown. [FILL]
SILTY SAND (SM), moist, brown. [FILL]
POORLY GRADED SAND WITH SILT (SP-SM), moist, brown,few gravel. [FILL]
SILTY SAND (SM), very dense, moist, brown to gray-brown,few gravel. [GLACIAL TILL DEPOSITS]
POORLY GRADED SAND WITH SILT (SP-SM), very dense,moist, brown, few gravel. [GLACIAL TILL DEPOSITS]
WELL-GRADED GRAVEL WITH SILT AND SAND (GW-GM),very dense, moist, brown. [GLACIAL TILL DEPOSITS]
POORLY GRADED SAND WITH SILT AND GRAVEL(SP-SM), very dense, moist, brown. [GLACIAL TILLDEPOSITS]
SILTY SAND (SM), very dense, moist, brown, few gravel.[GLACIAL TILL DEPOSITS]
Becomes brown to red-brown.
SILTY SAND WITH GRAVEL (SM), very dense, moist, brownto red-brown. [GLACIAL TILL DEPOSITS]
Grades to brown to gray-brown, coarse gravel.
SILTY SAND (SM), very dense, moist, gray, few fine to coarsegravel. [GLACIAL TILL DEPOSITS]
POORLY GRADED SAND WITH SILT (SP-SM), very dense,wet, gray, few gravel. [GLACIAL TILL DEPOSITS]
ATD
3/2
7/2
019
Sample Data
HC-B1
Boring Log
Date Started: 2/28/19
Logged by: M. Shaljian Drilling Method: Hollow Stem Auger
Hammer Type: Auto-hammer
Total Depth: 60.3 feet
Rig Model/Type: CME-75 / Truck-mounted drill rig
Drilling Contractor/Crew: Holt Services, Inc. / Kyle
10 20 30 40
Hammer Drop Height (inches): 30Hammer Weight (pounds): 140
WC (%)
Hole Diameter: 8.25 inches
Measured Hammer Efficiency (%): NAVertical Datum: NAVD 88
Horizontal Datum:
Ground Surface Elevation: 58 feet
Depth to Groundwater: 22.8 feet
Well Tag ID: BLI-191 Location and ground surface elevations are
approximate.
Comments:
Location: Lat: 47.625610 Long: -122.342630
Checked by: J. Jacobe
Date Completed: 3/1/19
Casing Diameter:
Sheet 1 of 2
Figure A-2Project:
Location:
Project No.:
701 Dexter
Seattle, WA
19437-00
General Notes:
1. Refer to Figure A-1 for explanation of descriptions and symbols.
2. Material descriptions and stratum lines are interpretive and actual changes may be gradual. Solid stratum lines indicate distinct contact between material strata or geologic
units. Dashed stratum lines indicate gradual or approximate change between material strata or geologic units.
3. USCS designations are based on visual-manual identification (ASTM D 2488) unless otherwise supported by laboratory testing (ASTM D 2487).
4. Groundwater level, if indicated, is at time of drilling/excavation (ATD) or for date specified. Level may vary with time.
Depth
(fe
et)
Ele
vation (
feet)
Depth
(fe
et)
Le
ng
th (
inch
es)
PID Gra
phic
Log
NumberTestsR
eco
ve
ry
Typ
e
Blo
w C
ount
SPT N Value
MaterialDescription
Fines Content (%)
HC
BO
RIN
G L
OG
- J
:\G
INT
\HC
_L
IBR
AR
Y.G
LB
- 4
/2/1
9 1
0:2
2 -
L:\
NO
TE
BO
OK
S\1
94
37
00
_7
01
_D
EX
TE
R_
AV
EN
UE
_N
OR
TH
_G
EO
TE
CH
\FIE
LD
DA
TA
\PE
RM
_G
INT
FIL
ES
\19
43
70
0-B
L.G
PJ -
kzl
Wate
r Level
Well
Constr
uction
6
6
6
11
13
12
18
11
10
6
6
9
0
5
10
15
20
25
30
35
55
50
45
40
35
30
25
20
0
5
10
15
20
25
30
35
50/5"
/6.5"
50/6"
76
50/4.5"
50/4"
50/1st 6"
50/1st 6"
50/3"
23
29

<0.1
<0.1
PID, No odor,no sheen
S-14S-15
S-16GS, WC
S-17
S-18PID, No odor,
no sheen
10
in.
10
in.
5in
.
4
in.
3.5
in.
50
4550
50
50
50
POORLY GRADED SAND WITH SILT (SP-SM), very dense,wet, gray, few gravel. [GLACIAL TILL DEPOSITS] (continued)
SILT WITH SAND (ML), hard, moist, gray, trace gravel, ironoxide staining. [GLACIAL TILL DEPOSITS]
POORLY GRADED SAND WITH SILT (SP-SM), very dense,moist, gray, few gravel. [GLACIAL TILL DEPOSITS]
SILTY SAND WITH GRAVEL (SM), very dense, moist to wet,gray-brown. [GLACIAL TILL DEPOSITS]
LEAN CLAY WITH SAND (CL), hard, wet, gray, few gravel.[GLACIOLACUSTRINE DEPOSITS]
Bottom of Borehole at 60.3 feet.
Sample Data
HC-B1
Boring Log
Date Started: 2/28/19
Logged by: M. Shaljian Drilling Method: Hollow Stem Auger
Hammer Type: Auto-hammer
Total Depth: 60.3 feet
Rig Model/Type: CME-75 / Truck-mounted drill rig
Drilling Contractor/Crew: Holt Services, Inc. / Kyle
10 20 30 40
Hammer Drop Height (inches): 30Hammer Weight (pounds): 140
WC (%)
Hole Diameter: 8.25 inches
Measured Hammer Efficiency (%): NAVertical Datum: NAVD 88
Horizontal Datum:
Ground Surface Elevation: 58 feet
Depth to Groundwater: 22.8 feet
Well Tag ID: BLI-191 Location and ground surface elevations are
approximate.
Comments:
Location: Lat: 47.625610 Long: -122.342630
Checked by: J. Jacobe
Date Completed: 3/1/19
Casing Diameter:
Sheet 2 of 2
Figure A-2Project:
Location:
Project No.:
701 Dexter
Seattle, WA
19437-00
General Notes:
1. Refer to Figure A-1 for explanation of descriptions and symbols.
2. Material descriptions and stratum lines are interpretive and actual changes may be gradual. Solid stratum lines indicate distinct contact between material strata or geologic
units. Dashed stratum lines indicate gradual or approximate change between material strata or geologic units.
3. USCS designations are based on visual-manual identification (ASTM D 2488) unless otherwise supported by laboratory testing (ASTM D 2487).
4. Groundwater level, if indicated, is at time of drilling/excavation (ATD) or for date specified. Level may vary with time.
Depth
(fe
et)
Ele
vation (
feet)
Depth
(fe
et)
Le
ng
th (
inch
es)
PID Gra
phic
Log
NumberTestsR
eco
ve
ry
Typ
e
Blo
w C
ount
SPT N Value
MaterialDescription
Fines Content (%)
HC
BO
RIN
G L
OG
- J
:\G
INT
\HC
_L
IBR
AR
Y.G
LB
- 4
/2/1
9 1
0:2
2 -
L:\
NO
TE
BO
OK
S\1
94
37
00
_7
01
_D
EX
TE
R_
AV
EN
UE
_N
OR
TH
_G
EO
TE
CH
\FIE
LD
DA
TA
\PE
RM
_G
INT
FIL
ES
\19
43
70
0-B
L.G
PJ -
kzl
Wate
r Level
Well
Constr
uction
5
10
5
4
4
40
45
50
55
60
65
70
75
15
10
50
-5-1
0-1
5-2
0
40
45
50
55
60
65
70
75
50/1st 5"
50/4"
50/1st 5"
50/1st 4"
50/1st 3.5"
24

<0.1
<0.1
<0.1
<0.1
<0.1
<0.1
<0.1
<0.1
<0.1
<0.1
<0.1
<0.1
<0.1
S-1PID, No odor,
no sheen
S-2PID, No odor,
no sheen
S-3PID, No odor,
no sheen
S-4AL, PID, No
odor, nosheen
S-5PID, No odor,
no sheen
S-6PID, No odor,
no sheen
S-7PID, No odor,
no sheen
S-8PID, No odor,
no sheen
S-9PID, No odor,
no sheen
S-10GS, PID,
WC, No odor,no sheen
S-11PID, No odor,
no sheen
S-12GS, PID,
WC, No odor,no sheen
S-13PID, No odor,
no sheen
S-14
18
in.
2in
.
1
8in
.
1
8in
.
1
8in
.
7
in.
10
in.
10
in.
18
in.
11
in.
13
in.
9in
.
344
566
001
101214
213744
1150
4650
4350
193650
253350
22107
1850
3 inches of Concrete Pavement.
POORLY GRADED SAND WITH SILT AND GRAVEL(SP-SM), moist, brown. [FILL]
SILTY SAND (SM), loose, moist, brown to red-brown, fewgravel, fine to coarse sand, iron oxide staining, organic odor.[FILL]
Grades to medium dense, some roots.
SILTY CLAY WITH SAND (CL-ML), very soft, moist, gray, fewgravel. [FILL]
SILTY SAND WITH GRAVEL (SM), medium dense, moist,gray-brown, iron oxide staining. [RECESSIONAL ICECONTACT DEPOSIT]
POORLY GRADED GRAVEL WITH SILT AND SAND(GP-GM), very dense, moist, gray. [ADVANCE OUTWASHDEPOSITS]
POORLY GRADED SAND WITH SILT AND GRAVEL(SP-SM), very dense, moist, gray. [ADVANCE OUTWASHDEPOSITS]
SILTY SAND WITH GRAVEL (SM), very dense, moist, brown.[ADVANCE OUTWASH DEPOSITS]
POORLY GRADED GRAVEL WITH SILT AND SAND(GP-GM), very dense, moist, gray, angular gravel. [ADVANCEOUTWASH DEPOSITS]
SILTY SAND (SM), very dense, moist, gray. [GLACIAL TILLDEPOSITS]
SILT WITH SAND (ML), hard, moist, gray, few subroundedgravel. [GLACIAL TILL DEPOSITS]
SILTY SAND (SM), very dense, wet, gray. [GLACIAL TILLDEPOSITS]
SILTY SAND WITH GRAVEL (SM), medium dense, wet, gray.[GLACIAL TILL DEPOSITS]
Becomes very dense.
ATD
3/2
7/2
019
Sample Data
HC-B2
Boring Log
Date Started: 2/26/19
Logged by: N. Jones Drilling Method: Hollow Stem Auger
Hammer Type: Auto-hammer
Total Depth: 60.3 feet
Rig Model/Type: CME-75 / Truck-mounted drill rig
Drilling Contractor/Crew: Holt Services, Inc. / Kyle & Austin
10 20 30 40
Hammer Drop Height (inches): 30Hammer Weight (pounds): 140
WC (%)
Hole Diameter: 8.25 inches
Measured Hammer Efficiency (%): NAVertical Datum: NAVD 88
Horizontal Datum:
Ground Surface Elevation: 59.5 feet
Depth to Groundwater: 28.7 feet
Well Tag ID: BLI-192 Location and ground surface elevations are
approximate.
Comments:
Location: Lat: 47.625820 Long: -122.342610
Checked by: J. Jacobe
Date Completed: 2/27/19
Casing Diameter:
Sheet 1 of 2
Figure A-3Project:
Location:
Project No.:
701 Dexter
Seattle, WA
19437-00
General Notes:
1. Refer to Figure A-1 for explanation of descriptions and symbols.
2. Material descriptions and stratum lines are interpretive and actual changes may be gradual. Solid stratum lines indicate distinct contact between material strata or geologic
units. Dashed stratum lines indicate gradual or approximate change between material strata or geologic units.
3. USCS designations are based on visual-manual identification (ASTM D 2488) unless otherwise supported by laboratory testing (ASTM D 2487).
4. Groundwater level, if indicated, is at time of drilling/excavation (ATD) or for date specified. Level may vary with time.
Depth
(fe
et)
Ele
vation (
feet)
Depth
(fe
et)
PL LL
Le
ng
th (
inch
es)
PID Gra
phic
Log
NumberTestsR
eco
ve
ry
Typ
e
Blo
w C
ount
SPT N Value
MaterialDescription
Fines Content (%)
HC
BO
RIN
G L
OG
- J
:\G
INT
\HC
_L
IBR
AR
Y.G
LB
- 4
/2/1
9 1
0:2
2 -
L:\
NO
TE
BO
OK
S\1
94
37
00
_7
01
_D
EX
TE
R_
AV
EN
UE
_N
OR
TH
_G
EO
TE
CH
\FIE
LD
DA
TA
\PE
RM
_G
INT
FIL
ES
\19
43
70
0-B
L.G
PJ -
kzl
Wate
r Level
Well
Constr
uction
12
18
18
18
18
18
11
10
10
18
17
18
9
0
5
10
15
20
25
30
35
55
50
45
40
35
30
25
20
0
5
10
15
20
25
30
35
8
12
1
26
81
50/5"
50/4"
50/4"
86
83/11"
17
50/3"
48
31

<0.1
<0.1
PID, No odor,no sheen
S-15PID, No odor,
no sheen
S-16GS, WC
S-17GS, WC
S-18
6in
.
5
in.
9in
.
4
in.
3in
.
50
50
4050
50
50
SILTY SAND (SM), very dense, moist, gray, few subangulargravel. [GLACIAL TILL DEPOSITS] (continued)
SILTY SAND WITH GRAVEL (SM), very dense, moist, gray.[GLACIAL TILL DEPOSITS]
SILTY SAND (SM), very dense, moist, gray. [GLACIAL TILLDEPOSITS]
Bottom of Borehole at 60.3 feet.
Sample Data
HC-B2
Boring Log
Date Started: 2/26/19
Logged by: N. Jones Drilling Method: Hollow Stem Auger
Hammer Type: Auto-hammer
Total Depth: 60.3 feet
Rig Model/Type: CME-75 / Truck-mounted drill rig
Drilling Contractor/Crew: Holt Services, Inc. / Kyle & Austin
10 20 30 40
Hammer Drop Height (inches): 30Hammer Weight (pounds): 140
WC (%)
Hole Diameter: 8.25 inches
Measured Hammer Efficiency (%): NAVertical Datum: NAVD 88
Horizontal Datum:
Ground Surface Elevation: 59.5 feet
Depth to Groundwater: 28.7 feet
Well Tag ID: BLI-192 Location and ground surface elevations are
approximate.
Comments:
Location: Lat: 47.625820 Long: -122.342610
Checked by: J. Jacobe
Date Completed: 2/27/19
Casing Diameter:
Sheet 2 of 2
Figure A-3Project:
Location:
Project No.:
701 Dexter
Seattle, WA
19437-00
General Notes:
1. Refer to Figure A-1 for explanation of descriptions and symbols.
2. Material descriptions and stratum lines are interpretive and actual changes may be gradual. Solid stratum lines indicate distinct contact between material strata or geologic
units. Dashed stratum lines indicate gradual or approximate change between material strata or geologic units.
3. USCS designations are based on visual-manual identification (ASTM D 2488) unless otherwise supported by laboratory testing (ASTM D 2487).
4. Groundwater level, if indicated, is at time of drilling/excavation (ATD) or for date specified. Level may vary with time.
Depth
(fe
et)
Ele
vation (
feet)
Depth
(fe
et)
PL LL
Le
ng
th (
inch
es)
PID Gra
phic
Log
NumberTestsR
eco
ve
ry
Typ
e
Blo
w C
ount
SPT N Value
MaterialDescription
Fines Content (%)
HC
BO
RIN
G L
OG
- J
:\G
INT
\HC
_L
IBR
AR
Y.G
LB
- 4
/2/1
9 1
0:2
2 -
L:\
NO
TE
BO
OK
S\1
94
37
00
_7
01
_D
EX
TE
R_
AV
EN
UE
_N
OR
TH
_G
EO
TE
CH
\FIE
LD
DA
TA
\PE
RM
_G
INT
FIL
ES
\19
43
70
0-B
L.G
PJ -
kzl
Wate
r Level
Well
Constr
uction
6
6
9
4
3
40
45
50
55
60
65
70
75
15
10
50
-5-1
0-1
5-2
0
40
45
50
55
60
65
70
75
50/1st 6"
50/1st 5.5"
50/3"
50/1st 4"
50/1st 3"
20
45

<0.1
<0.1
<0.1
<0.1
<0.1
<0.1
<0.1
<0.1
<0.1
S-1PID, No odor,
no sheen
S-2PID, No odor,
no sheen
S-3
S-4PID, No odor,
no sheen
S-5PID, No odor,
no sheen
S-6PID, No odor,
no sheen
S-7PID, No odor,
no sheen
S-8PID, No odor,
no sheen
S-9GS, PID,
WC, No odor,no sheen
S-10
S-11GS, PID,
WC, No odor,no sheen
S-12
18
in.
18
in.
0in
.
1
8in
.
1
8in
.
1
8in
.
1
8in
.
1
8in
.
1
1in
.
0
in.
11
in.
134
755
7916
5813
367
131615
71523
133949
3050
50
3150
3 inches of Asphaltic pavement.
SANDY LEAN CLAY WITH GRAVEL (CL), medium stiff,moist, gray-brown, few organics. [FILL]
Grades to stiff, with iron oxide staining.
Grades to very stiff.
SILTY SAND WITH GRAVEL (SM), medium dense, moist,gray-brown, fine to medium sand. [FILL]
SANDY SILT (ML), stiff, moist, gray-brown. [FILL]
WELL-GRADED GRAVEL WITH SAND (GW), dense, moist,gray-brown, trace silt. [ADVANCE OUTWASH DEPOSITS]
POORLY GRADED SAND WITH SILT AND GRAVEL(SP-SM), dense, moist, brown, fine to medium sand.[ADVANCE OUTWASH DEPOSITS]
Grades to very dense.
SILTY SAND (SM), very dense, moist, light brown. [GLACIALTILL DEPOSITS]
Cobble in sampler.
Fine to coarse sand.
3/2
7/2
019
Sample Data
HC-B3
Boring Log
Date Started: 2/28/19
Logged by: N. Jones Drilling Method: Hollow Stem Auger
Hammer Type: Auto-hammer
Total Depth: 85.5 feet
Rig Model/Type: CME-85 / Truck-mounted drill rig
Drilling Contractor/Crew: Holt Services, Inc. / John B.
10 20 30 40
Hammer Drop Height (inches): 30Hammer Weight (pounds): 140
WC (%)
Hole Diameter: 8.25 inches
Measured Hammer Efficiency (%): NAVertical Datum: NAVD 88
Horizontal Datum:
Ground Surface Elevation: 76.5 feet
Depth to Groundwater: 31.8 feet
Well Tag ID: BLI-194 Location and ground surface elevations are
approximate.
Comments:
Location: Lat: 47.625790 Long: -122.343300
Checked by: J. Jacobe
Date Completed: 2/28/19
Casing Diameter:
Sheet 1 of 3
Figure A-4Project:
Location:
Project No.:
701 Dexter
Seattle, WA
19437-00
General Notes:
1. Refer to Figure A-1 for explanation of descriptions and symbols.
2. Material descriptions and stratum lines are interpretive and actual changes may be gradual. Solid stratum lines indicate distinct contact between material strata or geologic
units. Dashed stratum lines indicate gradual or approximate change between material strata or geologic units.
3. USCS designations are based on visual-manual identification (ASTM D 2488) unless otherwise supported by laboratory testing (ASTM D 2487).
4. Groundwater level, if indicated, is at time of drilling/excavation (ATD) or for date specified. Level may vary with time.
Depth
(fe
et)
Ele
vation (
feet)
Depth
(fe
et)
Le
ng
th (
inch
es)
PID Gra
phic
Log
NumberTestsR
eco
ve
ry
Typ
e
Blo
w C
ount
SPT N Value
MaterialDescription
Fines Content (%)
HC
BO
RIN
G L
OG
- J
:\G
INT
\HC
_L
IBR
AR
Y.G
LB
- 4
/2/1
9 1
0:2
2 -
L:\
NO
TE
BO
OK
S\1
94
37
00
_7
01
_D
EX
TE
R_
AV
EN
UE
_N
OR
TH
_G
EO
TE
CH
\FIE
LD
DA
TA
\PE
RM
_G
INT
FIL
ES
\19
43
70
0-B
L.G
PJ -
kzl
Wate
r Level
Well
Constr
uction
18
18
18
18
18
18
18
18
11
3
11
0
5
10
15
20
25
30
35
75
70
65
60
55
50
45
40
0
5
10
15
20
25
30
35
7
10
25
21
13
31
38
88
50/5"
50/1st 3"
50/5"
36
23

<0.1
<0.1
<0.1
PID, No odor,no sheen
S-13PID, No odor,
no sheen
S-14GS, PID,
WC, No odor,no sheen
S-15
S-16
S-17GS, WC
S-18
S-19
5in
.
5
in.
5in
.
0
in.
5in
.
3
in.
4in
.
3
in.
50
50
50
50
50
50
50
50
SILTY SAND (SM), very dense, moist, light brown. [GLACIALTILL DEPOSITS] (continued)Grades to light gray.
SILTY SAND WITH GRAVEL (SM), very dense, moist, gray,fine to medium sand.
Grades to with iron oxide staining, fine to coarse sand.
Grades to fine to medium sand.
SILTY SAND (SM), very dense, moist, gray, fine sand.[GLACIAL TILL DEPOSITS]
SILTY SAND WITH GRAVEL (SM), very dense, moist, gray,fine sand. [GLACIAL TILL DEPOSITS]
Grades to fine to coarse sand.
Sample Data
HC-B3
Boring Log
Date Started: 2/28/19
Logged by: N. Jones Drilling Method: Hollow Stem Auger
Hammer Type: Auto-hammer
Total Depth: 85.5 feet
Rig Model/Type: CME-85 / Truck-mounted drill rig
Drilling Contractor/Crew: Holt Services, Inc. / John B.
10 20 30 40
Hammer Drop Height (inches): 30Hammer Weight (pounds): 140
WC (%)
Hole Diameter: 8.25 inches
Measured Hammer Efficiency (%): NAVertical Datum: NAVD 88
Horizontal Datum:
Ground Surface Elevation: 76.5 feet
Depth to Groundwater: 31.8 feet
Well Tag ID: BLI-194 Location and ground surface elevations are
approximate.
Comments:
Location: Lat: 47.625790 Long: -122.343300
Checked by: J. Jacobe
Date Completed: 2/28/19
Casing Diameter:
Sheet 2 of 3
Figure A-4Project:
Location:
Project No.:
701 Dexter
Seattle, WA
19437-00
General Notes:
1. Refer to Figure A-1 for explanation of descriptions and symbols.
2. Material descriptions and stratum lines are interpretive and actual changes may be gradual. Solid stratum lines indicate distinct contact between material strata or geologic
units. Dashed stratum lines indicate gradual or approximate change between material strata or geologic units.
3. USCS designations are based on visual-manual identification (ASTM D 2488) unless otherwise supported by laboratory testing (ASTM D 2487).
4. Groundwater level, if indicated, is at time of drilling/excavation (ATD) or for date specified. Level may vary with time.
Depth
(fe
et)
Ele
vation (
feet)
Depth
(fe
et)
Le
ng
th (
inch
es)
PID Gra
phic
Log
NumberTestsR
eco
ve
ry
Typ
e
Blo
w C
ount
SPT N Value
MaterialDescription
Fines Content (%)
HC
BO
RIN
G L
OG
- J
:\G
INT
\HC
_L
IBR
AR
Y.G
LB
- 4
/2/1
9 1
0:2
2 -
L:\
NO
TE
BO
OK
S\1
94
37
00
_7
01
_D
EX
TE
R_
AV
EN
UE
_N
OR
TH
_G
EO
TE
CH
\FIE
LD
DA
TA
\PE
RM
_G
INT
FIL
ES
\19
43
70
0-B
L.G
PJ -
kzl
Wate
r Level
Well
Constr
uction
5
5
5
3
5
3
4
3
40
45
50
55
60
65
70
75
35
30
25
20
15
10
50
40
45
50
55
60
65
70
75
50/1st 5"
50/1st 5"
50/1st 5"
50/1st 3"
50/1st 5"
50/1st 3"
50/1st 4"
50/1st 3"
22
31

S-20GS, WC
S-21GS, WC
6in
.
5
in.
50
50
SILTY SAND WITH GRAVEL (SM), very dense, moist, gray,fine sand. [GLACIAL TILL DEPOSITS] (continued)
SILT WITH SAND (ML), hard, moist, gray, few gravel.[GLACIAL TILL DEPOSITS]
Bottom of Borehole at 85.5 feet.
Sample Data
HC-B3
Boring Log
Date Started: 2/28/19
Logged by: N. Jones Drilling Method: Hollow Stem Auger
Hammer Type: Auto-hammer
Total Depth: 85.5 feet
Rig Model/Type: CME-85 / Truck-mounted drill rig
Drilling Contractor/Crew: Holt Services, Inc. / John B.
10 20 30 40
Hammer Drop Height (inches): 30Hammer Weight (pounds): 140
WC (%)
Hole Diameter: 8.25 inches
Measured Hammer Efficiency (%): NAVertical Datum: NAVD 88
Horizontal Datum:
Ground Surface Elevation: 76.5 feet
Depth to Groundwater: 31.8 feet
Well Tag ID: BLI-194 Location and ground surface elevations are
approximate.
Comments:
Location: Lat: 47.625790 Long: -122.343300
Checked by: J. Jacobe
Date Completed: 2/28/19
Casing Diameter:
Sheet 3 of 3
Figure A-4Project:
Location:
Project No.:
701 Dexter
Seattle, WA
19437-00
General Notes:
1. Refer to Figure A-1 for explanation of descriptions and symbols.
2. Material descriptions and stratum lines are interpretive and actual changes may be gradual. Solid stratum lines indicate distinct contact between material strata or geologic
units. Dashed stratum lines indicate gradual or approximate change between material strata or geologic units.
3. USCS designations are based on visual-manual identification (ASTM D 2488) unless otherwise supported by laboratory testing (ASTM D 2487).
4. Groundwater level, if indicated, is at time of drilling/excavation (ATD) or for date specified. Level may vary with time.
Depth
(fe
et)
Ele
vation (
feet)
Depth
(fe
et)
Le
ng
th (
inch
es)
PID Gra
phic
Log
NumberTestsR
eco
ve
ry
Typ
e
Blo
w C
ount
SPT N Value
MaterialDescription
Fines Content (%)
HC
BO
RIN
G L
OG
- J
:\G
INT
\HC
_L
IBR
AR
Y.G
LB
- 4
/2/1
9 1
0:2
2 -
L:\
NO
TE
BO
OK
S\1
94
37
00
_7
01
_D
EX
TE
R_
AV
EN
UE
_N
OR
TH
_G
EO
TE
CH
\FIE
LD
DA
TA
\PE
RM
_G
INT
FIL
ES
\19
43
70
0-B
L.G
PJ -
kzl
Wate
r Level
Well
Constr
uction
6
5
80
85
90
95
100
105
110
115
-5-1
0-1
5-2
0-2
5-3
0-3
5-4
0
80
85
90
95
100
105
110
115
50/1st 6"
50/1st 5"
22
79

<0.1
<0.1
<0.1
<0.1
<0.1
<0.1
<0.1
<0.1
<0.1
<0.1
<0.1
S-1PID, No odor,
no sheen
S-2PID, No odor,
no sheen
S-3PID, No odor,
no sheen
S-4PID, No odor,
no sheen
S-5PID, No odor,
no sheen
S-6PID, No odor,
no sheen
S-7PID, No odor,
no sheen
S-8PID, No odor,
no sheen
S-9AL, GS, PID,WC, No odor,
no sheen
S-10GS, PID,
WC, No odor,no sheen
S-11PID, No odor,
no sheen
18
in.
18
in.
18
in.
18
in.
18
in.
18
in.
15
in.
12
in.
18
in.
10
in.
10
in.
3710
479
91214
101316
4811
131517
151719
2750
121429
2350
3050
3 inches of Asphaltic pavement.
SANDY SILT WITH GRAVEL (ML), stiff, moist, gray-brown, iron oxidestaining. [FILL]
SILT WITH SAND (ML), very stiff, moist, gray-brown. [RECESSIONALICE CONTACT DEPOSIT]
Grades to sandy.
SILTY SAND (SM), medium dense, moist, gray-brown, few gravel, finegrained sand. [RECESSIONAL ICE CONTACT DEPOSIT]
Becomes moist to wet, fine to medium grained sand.
POORLY GRADED SAND WITH GRAVEL (SP), dense, moist,gray-brown, fine to medium grained sand. [ADVANCE OUTWASHDEPOSITS]
Grades to trace silt.
SILTY SAND WITH GRAVEL (SM), very dense, moist, gray-brown.[GLACIAL TILL DEPOSITS]
SILT WITH SAND (ML), hard, moist, gray-brown, nonplastic, ironoxide staining. [GLACIAL TILL DEPOSITS]
SILTY SAND WITH GRAVEL (SM), very dense, moist, gray.[GLACIAL TILL DEPOSITS]
Sample Data
HC-B4
Boring Log
Date Started: 3/1/19
Logged by: N. Jones Drilling Method: Hollow Stem Auger
Hammer Type: Auto-hammer
Total Depth: 85.5 feet
Rig Model/Type: CME-85 / Truck-mounted drill rig
Drilling Contractor/Crew: Holt Services, Inc. / John B.
10 20 30 40
Hammer Drop Height (inches): 30Hammer Weight (pounds): 140
WC (%)
Hole Diameter: 8.25 inches
Measured Hammer Efficiency (%): NAVertical Datum: NAVD 88
Horizontal Datum:
Ground Surface Elevation: 76 feet
Depth to Groundwater: Not Identified
Location and ground surface elevations are approximate.Comments:
Location: Lat: 47.625540 Long: -122.343870
Checked by: J. Jacobe
Date Completed: 3/1/19
Casing Diameter: NA
Sheet 1 of 3
Figure A-5Project:
Location:
Project No.:
701 Dexter
Seattle, WA
19437-00
General Notes:
1. Refer to Figure A-1 for explanation of descriptions and symbols.
2. Material descriptions and stratum lines are interpretive and actual changes may be gradual. Solid stratum lines indicate distinct contact between material strata or geologic
units. Dashed stratum lines indicate gradual or approximate change between material strata or geologic units.
3. USCS designations are based on visual-manual identification (ASTM D 2488) unless otherwise supported by laboratory testing (ASTM D 2487).
4. Groundwater level, if indicated, is at time of drilling/excavation (ATD) or for date specified. Level may vary with time.
Depth
(fe
et)
Ele
vation (
feet)
Depth
(fe
et)
PL LL
Le
ng
th (
inch
es)
PID Gra
phic
Log
NumberTestsR
eco
ve
ry
Typ
e
Blo
w C
ount
SPT N Value
MaterialDescription
Fines Content (%)
HC
BO
RIN
G L
OG
- J
:\G
INT
\HC
_L
IBR
AR
Y.G
LB
- 4
/2/1
9 1
0:2
2 -
L:\
NO
TE
BO
OK
S\1
94
37
00
_7
01
_D
EX
TE
R_
AV
EN
UE
_N
OR
TH
_G
EO
TE
CH
\FIE
LD
DA
TA
\PE
RM
_G
INT
FIL
ES
\19
43
70
0-B
L.G
PJ -
kzl
18
18
18
18
18
18
18
12
18
10
10
0
5
10
15
20
25
30
35
75
70
65
60
55
50
45
40
0
5
10
15
20
25
30
35
17
16
26
29
19
32
36
50/6"
43
50/4"
50/4"
85
21

2
3.7
3.2
5.1
4.9
3.8
2.5
S-12PID, No odor,
no sheen
S-13PID, No odor,
no sheen
S-14GS, PID,
WC, No odor,no sheen
S-15PID, No odor,
no sheen
S-16PID, No odor,
no sheen
S-17PID, No odor,
no sheen
S-18PID, No odor,
no sheen
S-20
16
in.
6in
.
3
in.
3in
.
6
in.
5in
.
4
in.
333650
50
50
50
50
50
50
SILTY SAND WITH GRAVEL (SM), very dense, moist, gray.[GLACIAL TILL DEPOSITS] (continued)
SILTY SAND (SM), very dense, moist, light gray. [GLACIAL TILLDEPOSITS]
Grades to gray.
Sample Data
HC-B4
Boring Log
Date Started: 3/1/19
Logged by: N. Jones Drilling Method: Hollow Stem Auger
Hammer Type: Auto-hammer
Total Depth: 85.5 feet
Rig Model/Type: CME-85 / Truck-mounted drill rig
Drilling Contractor/Crew: Holt Services, Inc. / John B.
10 20 30 40
Hammer Drop Height (inches): 30Hammer Weight (pounds): 140
WC (%)
Hole Diameter: 8.25 inches
Measured Hammer Efficiency (%): NAVertical Datum: NAVD 88
Horizontal Datum:
Ground Surface Elevation: 76 feet
Depth to Groundwater: Not Identified
Location and ground surface elevations are approximate.Comments:
Location: Lat: 47.625540 Long: -122.343870
Checked by: J. Jacobe
Date Completed: 3/1/19
Casing Diameter: NA
Sheet 2 of 3
Figure A-5Project:
Location:
Project No.:
701 Dexter
Seattle, WA
19437-00
General Notes:
1. Refer to Figure A-1 for explanation of descriptions and symbols.
2. Material descriptions and stratum lines are interpretive and actual changes may be gradual. Solid stratum lines indicate distinct contact between material strata or geologic
units. Dashed stratum lines indicate gradual or approximate change between material strata or geologic units.
3. USCS designations are based on visual-manual identification (ASTM D 2488) unless otherwise supported by laboratory testing (ASTM D 2487).
4. Groundwater level, if indicated, is at time of drilling/excavation (ATD) or for date specified. Level may vary with time.
Depth
(fe
et)
Ele
vation (
feet)
Depth
(fe
et)
PL LL
Le
ng
th (
inch
es)
PID Gra
phic
Log
NumberTestsR
eco
ve
ry
Typ
e
Blo
w C
ount
SPT N Value
MaterialDescription
Fines Content (%)
HC
BO
RIN
G L
OG
- J
:\G
INT
\HC
_L
IBR
AR
Y.G
LB
- 4
/2/1
9 1
0:2
2 -
L:\
NO
TE
BO
OK
S\1
94
37
00
_7
01
_D
EX
TE
R_
AV
EN
UE
_N
OR
TH
_G
EO
TE
CH
\FIE
LD
DA
TA
\PE
RM
_G
INT
FIL
ES
\19
43
70
0-B
L.G
PJ -
kzl
16
6
3
3
6
5
4
40
45
50
55
60
65
70
75
35
30
25
20
15
10
50
40
45
50
55
60
65
70
75
86/10"
50/1st 6"
50/1st 3"
50/1st 3"
50/1st 6"
50/1st 5"
50/1st 4"
24

4.8
3.2
PID, No odor,no sheen
S-21PID, No odor,
no sheen
5in
.
4
in.
50
50
SILTY SAND (SM), very dense, moist, gray. [GLACIAL TILLDEPOSITS]
Bottom of Borehole at 85.5 feet.
Sample Data
HC-B4
Boring Log
Date Started: 3/1/19
Logged by: N. Jones Drilling Method: Hollow Stem Auger
Hammer Type: Auto-hammer
Total Depth: 85.5 feet
Rig Model/Type: CME-85 / Truck-mounted drill rig
Drilling Contractor/Crew: Holt Services, Inc. / John B.
10 20 30 40
Hammer Drop Height (inches): 30Hammer Weight (pounds): 140
WC (%)
Hole Diameter: 8.25 inches
Measured Hammer Efficiency (%): NAVertical Datum: NAVD 88
Horizontal Datum:
Ground Surface Elevation: 76 feet
Depth to Groundwater: Not Identified
Location and ground surface elevations are approximate.Comments:
Location: Lat: 47.625540 Long: -122.343870
Checked by: J. Jacobe
Date Completed: 3/1/19
Casing Diameter: NA
Sheet 3 of 3
Figure A-5Project:
Location:
Project No.:
701 Dexter
Seattle, WA
19437-00
General Notes:
1. Refer to Figure A-1 for explanation of descriptions and symbols.
2. Material descriptions and stratum lines are interpretive and actual changes may be gradual. Solid stratum lines indicate distinct contact between material strata or geologic
units. Dashed stratum lines indicate gradual or approximate change between material strata or geologic units.
3. USCS designations are based on visual-manual identification (ASTM D 2488) unless otherwise supported by laboratory testing (ASTM D 2487).
4. Groundwater level, if indicated, is at time of drilling/excavation (ATD) or for date specified. Level may vary with time.
Depth
(fe
et)
Ele
vation (
feet)
Depth
(fe
et)
PL LL
Le
ng
th (
inch
es)
PID Gra
phic
Log
NumberTestsR
eco
ve
ry
Typ
e
Blo
w C
ount
SPT N Value
MaterialDescription
Fines Content (%)
HC
BO
RIN
G L
OG
- J
:\G
INT
\HC
_L
IBR
AR
Y.G
LB
- 4
/2/1
9 1
0:2
2 -
L:\
NO
TE
BO
OK
S\1
94
37
00
_7
01
_D
EX
TE
R_
AV
EN
UE
_N
OR
TH
_G
EO
TE
CH
\FIE
LD
DA
TA
\PE
RM
_G
INT
FIL
ES
\19
43
70
0-B
L.G
PJ -
kzl
5
4
80
85
90
95
100
105
110
115
-5-1
0-1
5-2
0-2
5-3
0-3
5-4
0
80
85
90
95
100
105
110
115
50/1st 5"
50/1st 4"

19437-00 April 23, 2019
APPENDIX B Laboratory Testing Program
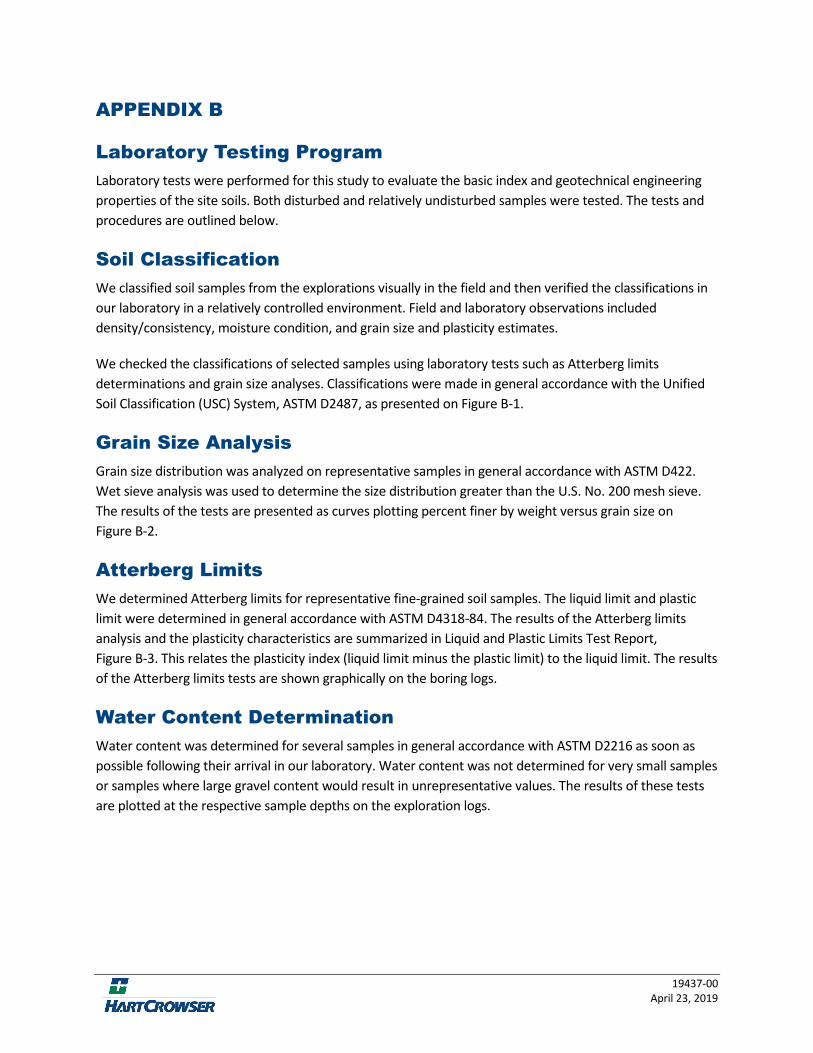
19437-00 April 23, 2019
APPENDIX B
Laboratory Testing Program Laboratory tests were performed for this study to evaluate the basic index and geotechnical engineering properties of the site soils. Both disturbed and relatively undisturbed samples were tested. The tests and procedures are outlined below.
Soil Classification We classified soil samples from the explorations visually in the field and then verified the classifications in our laboratory in a relatively controlled environment. Field and laboratory observations included density/consistency, moisture condition, and grain size and plasticity estimates.
We checked the classifications of selected samples using laboratory tests such as Atterberg limits determinations and grain size analyses. Classifications were made in general accordance with the Unified Soil Classification (USC) System, ASTM D2487, as presented on Figure B-1.
Grain Size Analysis Grain size distribution was analyzed on representative samples in general accordance with ASTM D422. Wet sieve analysis was used to determine the size distribution greater than the U.S. No. 200 mesh sieve. The results of the tests are presented as curves plotting percent finer by weight versus grain size on Figure B-2.
Atterberg Limits We determined Atterberg limits for representative fine-grained soil samples. The liquid limit and plastic limit were determined in general accordance with ASTM D4318-84. The results of the Atterberg limits analysis and the plasticity characteristics are summarized in Liquid and Plastic Limits Test Report, Figure B-3. This relates the plasticity index (liquid limit minus the plastic limit) to the liquid limit. The results of the Atterberg limits tests are shown graphically on the boring logs.
Water Content Determination Water content was determined for several samples in general accordance with ASTM D2216 as soon as possible following their arrival in our laboratory. Water content was not determined for very small samples or samples where large gravel content would result in unrepresentative values. The results of these tests are plotted at the respective sample depths on the exploration logs.

Figure B-1Project:Location:Project No.:
701 Dexter Avenue NorthSeattle, WA 19437-00
Unified SoilClassification(USC) System
Coarse-Grained Soils
Coarse-Grained Soils > 50% Larger than No. 200 Sieve
GRAVEL with 5% < Fines <12%
For clean sands and gravels:
D10, D30, D60 are particle diameters for which 10, 30, and 60 percent, respectively, of the soil mass are finer.
GRAVEL with >12% Fines
GRAVEL with 5% Fines GW
GC and SC Atterberg limits above A line with PI > 7
GM
GW-GM GW-GC GP-GM
Fine-Grained Soils
Soil Grain Size
GP-GC
GC
GP
GRAVEL > 50% Coarse Fraction Larger than No. 4 Sieve SAND > 50% Coarse Fraction Smaller than No. 4 Sieve
SAND with 5% Fines
SAND with > 12% Fines
SAND with 5% < Fines <12% SW-SM SW-SC
SM
SW SP
SC
SP-SCSP-SM
D10 x D60
(D30)2
< 3_1 <_ & D10
D60 where> 4 for GW> 6 for SW otherwise GP or SP
For sands and gravels with fines:
GM and SM Atterberg limits below A line with PI < 4
Fine-Grained Soils > 50% smaller than No. 200 Sieve
Soils with Liquid Limit < 50% Soils with Liquid Limit > 50%
SILT CLAY ORGANIC SILT CLAY ORGANIC PEAT
PTOHCHMHOLCLML
COBBLES
(D30)2
D10 x D60
D60
D10Cc = Cu =
Sheet 1 of 1
GRAVEL SAND SILT and CLAY
Fine-Grained SoilsCoarse-Grained Soils
Grain Size in Millimeters
Number of Mesh per Inch(US Standard) Grain Size in MillimetersSize of Opening in Inches
12 10
300
200
100 80 60 40 30 .2 .1 .08
. 06
.04
.03
.02
.01
.008
. 006
.004
.003
.002
.001
.001
.002
.003
.004
.006
. 008
.01
.02
.03
.04
.06
41/4
3/8
1/2
5/8
3/4
11-1/
2
2346
20 10 8 6 4 3 2 1 .8 .6 .4 .3
200
100
604020
50
40
30
20
10
0 20 40 60 80 10090
60
0
50
Liquid Limit
Pla
stic
ity In
dex
74
70503010
60
40
30
20
10
0
CH
MH or OHCL
ML or OL
CL-ML
A Line
U Line
KE
Y T
O G
RA
PH
RE
PO
RT
S -
F:\G
INT
\HC
_LIB
RA
RY
.GLB

Depth: 7.5 to 9.0 feet
Depth: 25.0 to 26.5 feet
Remarks:
USCS
Non-plastic, rapid dilantancy
LL PL PILocation and Description
6
NP
MC%
NT
25
-#200
NT
85
Source: HC-B2
Source: HC-B4
40
30
20
10
Sample No.: S-4
Sample No.: S-9
Liquid Limit,Plastic Limit, andPlasticity Index
CL-ML
ML
SILTY CLAY
SILT WITH SAND
50
30
7
4
70 90 110
60
50
Dashed line indicates the approximateupper limit boundary for natural soils
10LIQUID LIMIT
PLA
ST
ICIT
Y I
ND
EX
16
NP
22
NP
Figure B-2Project:Location:Project No.:
701 DexterSeattle, WA 19437-00 Sheet 1 of 1
HC
AT
TE
RB
ER
G L
IMIT
S -
J:\G
INT
\HC
_LIB
RA
RY
.GLB
- 3
/26/
19 0
9:27
- L
:\NO
TE
BO
OK
S\1
9437
00_7
01_D
EX
TE
R_A
VE
NU
E_N
OR
TH
_GE
OT
EC
H\F
IELD
DA
TA
\PE
RM
_GIN
T F
ILE
S\1
9437
00_B
L.G
PJ
- hc
lab
CH or OH
ML or OL MH or OH
CL or OL
CL-ML CL-ML

0
5
10
15
20
25
30
35
40
45
50
55
60
65
70
75
80
85
90
95
100
0.0010.010.1110100
#200
#140
#100
#60
#30
#40
#20
#10
#4
PE
RC
EN
T F
INE
R
3 2 1-1/
2
3/4
1/2
3/8
6 1
Particle-SizeAnalysis
% Sand
D30LL PI D85 D60 D50
0.828
0.414
0.531
0.387
0.259
0.327
0.146
0.146
D15 D10 Cc Cu
GRAIN SIZE - mm
% Silt % Clay
27.6
20.2
22.3
% Gravel
0.0
0.0
0.0
% Cobbles
Remarks:
5
14
10
USCSMC%
49.2
49.2
55.9
16.922
8.560
8.470
23.2
30.6
21.8
SM
SM
SM
U.S. SIEVE OPENING IN INCHES U.S. SIEVE NUMBERS HYDROMETER
Sheet 1 of 1
Figure B-3
Source: HC-B1
Source: HC-B2
Source: HC-B3
Sample No.: S-11
Sample No.: S-12
Sample No.: S-14
Depth: 30.0 to 30.5
Depth: 35.0 to 36.5
Depth: 50.0 to 50.4
Location and Description
Project:Location:Project No.:
701 DexterSeattle, WA 19437-00
SILTY SAND WITH GRAVEL
SILTY SAND WITH GRAVEL
SILTY SAND WITH GRAVEL
coarseCOBBLES
GRAVEL
finemediumfinecoarse
SANDSILT OR CLAY
HC
GR
AIN
SIZ
E -
J:\G
INT
\HC
_LIB
RA
RY
.GLB
- 3
/26/
19
09:2
6 -
L:\N
OT
EB
OO
KS
\194
3700
_70
1_D
EX
TE
R_A
VE
NU
E_N
OR
TH
_GE
OT
EC
H\F
IELD
DA
TA
\PE
RM
_GIN
T F
ILE
S\1
9437
00_B
L.G
PJ
- hc
lab

HC-B1 S-1 0.5
HC-B1 S-2 3.0
HC-B1 S-3 5.0
HC-B1 S-4 7.5
HC-B1 S-5 10.0
HC-B1 S-6 12.5
HC-B1 S-7 15.0
HC-B1 S-8 17.5
HC-B1 S-9 20.0
HC-B1 S-10 25.0
HC-B1 S-11 30.0 27.6 49.2 23.2 5.3 SM SILTY SAND WITH GRAVEL
HC-B1 S-12 35.0 15.7 55.2 29.1 7.7 SM SILTY SAND WITH GRAVEL
HC-B1 S-13 40.0
HC-B1 S-14 45.0
HC-B1 S-15 45.5
HC-B1 S-16 50.0 18.8 57.3 23.8 8.2 SM SILTY SAND WITH GRAVEL
HC-B1 S-17 55.0
HC-B1 S-18 60.0
HC-B2 S-1 0.0
HC-B2 S-2 2.5
HC-B2 S-3 5.0
HC-B2 S-4 7.5 22 16 CL-ML silty clay
HC-B2 S-5 10.0
HC-B2 S-6 12.5
HC-B2 S-7 15.0
HC-B2 S-8 17.5
HC-B2 S-9 20.0
HC-B2 S-10 25.0 5.6 46.2 48.2 10.5 SM SILTY SAND
HC-B2 S-11 30.0
HC-B2 S-12 35.0 20.2 49.2 30.6 14.4 SM SILTY SAND WITH GRAVEL
HC-B2 S-13 37.5
HC-B2 S-14 40.0
HC-B2 S-15 45.0
HC-B2 S-16 50.0 19.7 59.9 20.4 11.7 SM SILTY SAND WITH GRAVEL
HC-B2 S-17 55.0 7.2 48.0 44.8 12.4 SM SILTY SAND
HC-B2 S-18 60.0
HC-B3 S-1 2.5
HC-B3 S-2 5.0
HC-B3 S-3 7.5
HC-B3 S-4 10.0
HC-B3 S-5 12.5
HC-B3 S-6 15.0
HC-B3 S-7 17.5
TABLE B-1: SUMMARY OF LABORATORY RESULTS
USCSGroup
SymbolSoil DescriptionLiquid
LimitPlasticLimit
WaterContent
(%)Borehole DepthSample
ID % Fines% Sand% Gravel
PROJECT LOCATION Seattle, WAPROJECT NUMBER 1943700
PROJECT NAME 701 Dexter
SE
LEC
T S
UM
MA
RY
WIT
H D
ES
C M
OD
01 -
GIN
T S
TD
US
LA
B.G
DT
- 3
/26
/19
09:
29 -
L:\
NO
TE
BO
OK
S\1
9437
00_7
01_
DE
XT
ER
_AV
EN
UE
_NO
RT
H_G
EO
TE
CH
\FIE
LD D
AT
A\P
ER
M_G
INT
FIL
ES
\194
3700
_BL.
GP
J

HC-B3 S-8 20.0
HC-B3 S-9 25.0 5.6 58.1 36.3 12.8 SM SILTY SAND
HC-B3 S-10 30.0
HC-B3 S-11 35.0 9.9 66.7 23.4 10.0 SM SILTY SAND
HC-B3 S-12 40.0
HC-B3 S-13 45.0
HC-B3 S-14 50.0 22.3 55.9 21.8 10.0 SM SILTY SAND WITH GRAVEL
HC-B3 S-15 55.0
HC-B3 S-16 60.0
HC-B3 S-17 65.0 10.5 58.2 31.3 7.2 SM SILTY SAND
HC-B3 S-18 70.0
HC-B3 S-19 75.0
HC-B3 S-20 80.0 37.6 40.4 22.0 6.2 SM SILTY SAND WITH GRAVEL
HC-B3 S-21 85.0 1.2 19.6 79.2 16.8 ML SILT WITH SAND
HC-B4 S-1 2.5
HC-B4 S-2 5.0
HC-B4 S-3 7.5
HC-B4 S-4 10.0
HC-B4 S-5 12.5
HC-B4 S-6 15.0
HC-B4 S-7 17.5
HC-B4 S-8 20.0
HC-B4 S-9 25.0 1.7 13.3 85.0 NP NP 24.8 ML SILT WITH SAND
HC-B4 S-10 30.0 37.0 42.0 21.0 5.6 SM SILTY SAND WITH GRAVEL
HC-B4 S-11 35.0
HC-B4 S-12 40.0
HC-B4 S-13 45.0
HC-B4 S-14 50.0 6.4 69.4 24.1 11.3 SM SILTY SAND
HC-B4 S-15 55.0
HC-B4 S-16 60.0
HC-B4 S-17 65.0
HC-B4 S-18 70.0
HC-B4 S-20 80.0
HC-B4 S-21 85.0
TABLE B-1: SUMMARY OF LABORATORY RESULTS
USCSGroup
SymbolSoil DescriptionLiquid
LimitPlasticLimit
WaterContent
(%)Borehole DepthSample
ID % Fines% Sand% Gravel
PROJECT LOCATION Seattle, WAPROJECT NUMBER 1943700
PROJECT NAME 701 Dexter
SE
LEC
T S
UM
MA
RY
WIT
H D
ES
C M
OD
01 -
GIN
T S
TD
US
LA
B.G
DT
- 3
/26
/19
09:
29 -
L:\
NO
TE
BO
OK
S\1
9437
00_7
01_
DE
XT
ER
_AV
EN
UE
_NO
RT
H_G
EO
TE
CH
\FIE
LD D
AT
A\P
ER
M_G
INT
FIL
ES
\194
3700
_BL.
GP
J

19437-00 April 23, 2019
APPENDIX C Historical Explorations

19437-00 April 23, 2019
APPENDIX C HISTORICAL EXPLORATIONS We reviewed historical borings and associated laboratory testing to gain an understanding of the subsurface conditions in the sit vicinity. These exploration logs and associated laboratory test results are included in this appendix as follows:
GeoEngineers (2017). Geotechnical Engineering Services, 701 Dexter Building Renovation, Seattle, Washington.” October 19.
Otto Roseneau & Associates Inc. Geotechnical Engineering Report, Temporary Shoring Design, 700 Dexter Avenue North, Seattle, Washington, King County Parcel #2249000285.” April 15.
Shannon & Wilson, Inc. (2007). Alaskan Way Viaduct & Seawall Replacement Project, Geotechnical and Environmental Data Report, Aurora Section, Washington). January.
Terra Associates, Inc. “Geotechnical Report, 700 Dexter Avenue, Seattle, Washington.” May 30.
Logs and test reports by others are included as they were produced by others for reference only and Hart Crowser is not responsible for the accuracy or completeness of the information presented in the logs. Approximate locations of the explorations by others are shown on Figure 2 in the main text; actual locations may differ from those shown.


l . \ l
r~--~ -· -~~ -~-~--.--~-- ~---· -- ... SEATTLE ENGINEERING bEPARTMENT
MATERIALS LABORATORY cs 7 .241
LOG. OF TEST BORING
DATE 4:-1 - f ._ /t) HOLE No.":s'0 3 (. 'Z2.)
GRD. ELEV.-----PROJECT GA:~ rfu;-a-w A q LOCATION..0'1.:rt;?"'E;,/2 ,i:1/C, t: fl_oy S.t: 'Jb t (IJ ct ~ , G3 ' Al L. £..oy ")f
~ :;
DESCRIPTION OF MATERIAL SlRATA DEPTH SAMPLE BLOW STD. WATER
NO. COUNT PEN. LEVEL COMPOSITION CONSISTENCY MOISTURE COLOR
~ -
I -
-I~
- f I~ 1/,
~ t) 44 ~ ',L. ~i ..-'I L -,..I) 'S ~ k\ \} ,;/Gf..?!V~ ·'._ ": ., ·\ ."£- .~-
~01s1 ... l l,J -,-:. i'.~ -.:..·"';i''/·.~::,,.~ ~ }'f;
~ - -t ),. ; . ...-,.. '-A"('f;i~
'• ..... "'
~~ -
- , I .· II
l~ ~l.\, )
11::; - ra !s-5 IX X. ~o-t ftllJ•M6!) <U .. N~H\..Jf) iJ!t'i '1''f rrlo,6, /- :l ~) ,_., }1,wrG i Ii...\ ! , I
~~ (>J /(:.Jl.A \/~ I.. +- '>~,- ,. f1,, ~ :a..J
-
-
i~ - ,,... II
f~ - I 5.,1 ( 18 .x.. -«;Do+ l"'!'.!11) 1.\1 t1..,: i\u r~ t!· I\ ~A \J,D Vt:::>·-~ c,t4~ 5'"- S'O .:;:.:~,AA(..i i~0\.:$1
a "" .~. tt ~A~'"'D ~,-A 1-uJe ,;,ii ,...,J. .L 1,
1 -ta.( '$l !.. ~!.A,;~,: " + c./1..A I/" L,,.
--
+ -~ - I~ ~ 1/1 ~~ ~ X SD-t ,, ~A>JD l/- Vt:11.Y G..tr\<.l 2o- n-.,o e ~ L .,..\), [,V ,11~1~ t-.o ... ,""'~-r fitt)1.s;-
'--J Ol'r ~\( >let~ C'lilt .... ILTY ~J-07\ -0 I>!.~:-.,.; M.:.. " . ,:;: .
-1 W~ 4 - . <fl I ~ )
4-z.--
}~ t: ~ ..,,... X, 5bt 71:),:) ~II t11J~•~~ .._,,.,...., '"Sill.JD ~G,}..y y\#) I;,... l!A~ ~- '.,,,hi I),' ~
~I L-i ~t,S..- G.~ -i,$ I.. -
8or"" +11~11..-r~ 9}~}) -..,:;,kdr,,Uf!•., 11 /.. r) ;s.
II I I Cd ,.j() -a, ,· /
t -j - Ir ~
44 50 -..a:. .~-:. I?.\\ ('II.,.~ ~)ilJ b "'f'G.l1t11C!. VI> 11 ... r
Gil.A~ ]' en- 2. l ~-· c.~~hk,. M-a\5i ~ .
h1S\1 ~\Lt l• !\ ll
-INSPECTOR
~ ;t·· .•
fl' .. _:_,·:~
,;•
;
r-~~
... '

cs 7.241
DATE i -I - 70
SEATTLE ENGINEERING DEPARTMENT
MATERIALS. LABORATORY
LOG OF TEST BORING
HOLE NO.
GRD. ELEV.------PROJECT ~ 4 ¢ )L..::S C ~ el';~
LOCATION D"'*'-reA... A:vt~. r ~~ ":r· ?(/ w ~ 2) ,~}\.,' ":;3 I N l. 0·1 I \
DESCRIPTION OF MATERIAL SlRATA DEPTH SAMPLE
NO. BLOW
COUNT STD. 1--------------~------~-----l PEN.
WATER LEVEL
COMPOSITION CONSISTENCY MOISTURE COLOR
'h,·i._ .. _, _, ,: ~ 1
:: ;J, .~ .... rc·· n 1;·:, , .; ':" :,L .. ~ .. . .•. ,~. . (
-
-
-
-
-
-
-I ..
J' 18 X X )i+ _<;1UJl)y b)LT ~,rbl:-1~~ \J~ll....,
,.. i"\'¥',~~t'1' ,>L;; !<; r
-
-
-
--
-
-
-
--
INSPECTOR 4 c +J-
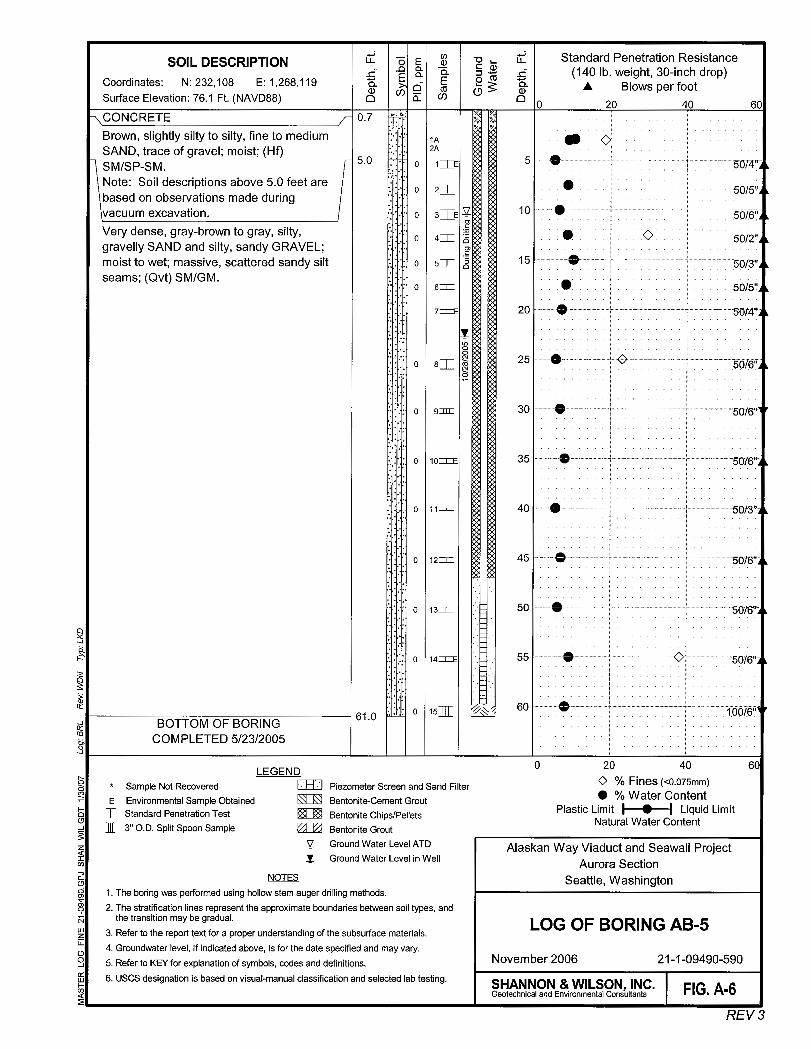

---.-
.,~t·i
·i ·,-..
. --·----
--.
..,~t~1,11
.. c.,f:
.;,,~
T ,.
I . ,
'·.
. , .
, ...
-
.. n > -m ;;
~ El
I • ,~ ..
M
Q
~
0 f--'
0 ),,-
1,
1 •
w
·N
:; -0
:i •
.o
g
•• 1
:1 . :•
-
•• ·-
;;;
g~
m
0
:·'
en
H
·-;;:
f ! ]I
~ ;:!
l 1!
F' -m I
' ,f
',!r
,.'
• 1•
! 'f
t, 1\"
·j!
I •
'
if-i,
•L
le"
.,, ..
,
I 1
' •
•,11
~ •• ,\
;~ f
, !.f
~ 'j
~
I ."
! •
' !
"' 0 -< ... ....
:0
,..., ..... ·-.. !1 ·-» ..
:;:a
-.
., C
, I:!
i;
;-,
. =~·
' 4
'I l
, ....
! ::
1·,:,
.... . ll
~m,~
.. ~
m
·= -~ -, m Q• ... ~= I . .. i='
·=
"'
:-
0 r
i 0
.....
§~
tJ
i;; !ii
. .
.. "'
=" ~P
' =
m
~::;
=,-
~i
j:!!
=i
"' ~ I • t
rl.,
• l
••• •
:1~1t
--
·i
n •;
' ;
'J
'' ,,
-;:-.~~
;• 0f
f I
' ,,
CJ)
Cl ~ ... ;;
m
n g -~ ~ n ;: - "' = ;:: 0 ;;
n
AURO
RA A
VENU
E •
-----1
---
,• '
DEXT
ER A
V£HU
£
• , , -0 !'"
:;;
n • =
C,
a 0 ... - -~ n m - I~
X ;;
n • > -...
,. :: - E - -n :! · - n
•
. - ! l
•

;...
.- I •. .1 .
I
I I I I I I I I ~ '
I ;•
I · ·-I ,.r_· .... ~::..r~ I "!p:'.-
·, ... •i I·" I r--;-:-.... ... - ... ~'*--~~
- > -j ...........
I . I I I
~
SOIL DES~TION
a.rt.a. Ehnll••• 13D. D FEET (ASSUIIED DlTUII)
.:
"' ... ::: a
N U P]ll U nu Tuy laase ti laasa, mottl1d £UY-brawn and rad-brawn, silty SAND 11th I trac1 af 1raY1l ta ira,111,, scatterad burnt woad debris and slit lnpents (Fill)'
DlnH, 1ny-bru1n, sll tJ, I ina SAND, clean, 14
filll lo odium SAND and fin• sandy SILT, with t6 I ran sta iiled lay1rs. ·
D1nse, 1ray-brawn, cr1,ellJ, silty SlND 1itb scatt1r1d iron stains (leath1r1d Till)
"-~~~~~~~~~~~~~~~---t 2D YHJ danse, 1raY-lH01n, silty, 1nnlly, fine ta 11dl ... SANB (Till)
BOTTOII Of 8011.INli %3. I CDIIPlETED 10/29/80
....
-~ ~
, .......... ~---·-:.--· ---
itiifi~ittC~efi~t:::~t!~lr\'_:_?.·I{:~ . .... _ ...... : ,
-~.
l~ft~~:-\~i~·/.D~~~t~tf ~}X:)(rt\J~:; ...~ .. "'i:'
.,·;· ...
I 2·0.0. Ip 11 t ., ...... ,1. 13•1.D. I-In wtl I , .. ,1s
• SHpl1 ••• r1cnu•d
Alltrbu1 Ll•l 11;
LEGEND
.'J.. .;.- ~· ; .·--~ . .
~
llquidll•il
N1tuf1• •~t,r c111l•nt
PIHtlc 11•11
r ,., .......... . 1111, ln11
Pl 1u•1ttr !Ip
p s-, • • paohed
, ..... , .• :: .... Z' -~ ~ ~ . ;-.~=.. == ',,.. ... "' ••a
·; M • 1.L
11.IIIIAII ,1.nuu• 111 llfUCl (141 Ii. ••I 1111. Ja"'fn,}
Allns ,., IHI
211 41 1G
1! 2I 3I 41 5I sI 1I •I
0 I - ·• • • • •' • •
t ~ • I I I • •
=1-.··:: ::: : ~ -. -. .. ,, ..... 5~@·--·---
• • ' • • - • • I ···· -- · . ...... .
.... ' .. ~ -.
... ~ " 4 ... . .. . ... · ...... . ... .. .... . ··::: • : :
t•••••4•1 ·------- · ......... .. , ... ... ... ( ;'l:. ; · : : ::1, .. --· __ ___ . ................ .
I I I I t • • .. • I••••.,•• i, I • • 0 •"" • • •
0 • I I .e ,0. I ............ .......... , ....... , ...... 11
~ ~ : : : : : : : ,1
I' •• t ......
• II I • a.•• I .. i ....... .
10Ff .... ... · ::: : : : ..... LIHHtH
15
&I .... _::: :• . ... ..... ... ..... 25 1- .------ 1 ........ , . . --· · .. 1
---'' =i
·.'
' ---- -· .-.
.-
tf! ... . . .. ~ ..... . .. .. -- ... ----.. -......... .. .............
1 ..... - - - -.................
:::-::: ~ ~ -1: :.:~ :~: ~: ......... .. "' -. -.. -....
::::::: ::1;: :: :: : :: .::;·-:, 1,~
: : : : :: : : ; 1 : : : : : : : : : I : : : : : : : : :
::: : :::::1 ::: ::::::1 ;;; ; ;:; ::
: : :: ~ ; : : ; I : : : 7 =:: : : I ~: : :: : : : : .... -. - -.-. -. -.....
••• - "I• - •• ............. I·• ,...,.. ~ " - - • -
f •. • •• --- . --·-· .. ...... _ ........
.. . . ..- ....... . .... ............
. "' . . "' .. ". . ... -~ .... .. ....
.. -.. ----.. ......... . ' ... ·- ... - -. ~ ... I .. ., '"'· • • • . •. . . . . ..... . . -. -. ...... .. .. .... .. .. • .. 1 . --......... -.... . ...... . .. ......... - -... · · . · -· ---1 · ..... · ... I . . . . ...... . . . . . .. -.. .. ·-
& • 0 a.••. 1-4 ... -... - ... --:::::::-~:, :~-:~:;::: ~ -. ~ . -.. . .. - ~ .... . .
II tO . 211 H • ll l•i.r IHIHl
IEXTER OFFICE BUILOIIIC SEATTLE. llSKIN&TDI
LO& OF' BllRlJC B-2 NOYEIIBER 198B l-378M1
.-o·rf :. fh , ,1r·• •• n c-u ' , o"J1 H rr••· , ep n -••" ' HH· .. ,,. , .... , ... , . t ;iu.tu1..111·la1 bltwttn Hi I typn ond th• lrtul tho may ~• lfldual. SHlMlllll l·IILSH. INC. lFIG A-2
IIITlc•• • IIIC&L 11:11•1uL ,,.... •
I I I I I I I I I I I I . .; .. - : . .
I I I I
I • I
I I ~
SOIL DESC.TIDN - '
bt hc1 El eutl •1t: 13 l. 8 FEET C ASSUMED IU TUI) L J.SPilll I Stiff, mattled 1ra)'-brosn. fine sandy SILT, 1itb • trac1 af 1r1,el and fine burnt 1uad dabris
.:
~ :; -D.2
l (FIII) IU Medium danse, 1ray-Dtnn, silty SANO 11th scattered 1rn1I. ·
I Dense, 1ray-brawn, l1yar1d sri ty SAND, sandy I 7 SILT ind sll&htly silty, 1rawelJy S~NI.
Yery stiff, 1r1y-bro1n, fine sandy SILT 11th lD scattered coarse s1nd. 1ra,el and thin. clea~ • fine sand lenses.
m .;I STAIIIHD ,nruun•- 111111a.1:1;
"':...-. -; (140 111. ••I 1111. Ja"'fres> . ... =~ ~ ,6.llewa HI IHt . - . :: =· = 11 20_ .i1 1G
iI 2I 31 •I 5I
= n ; 1:: ::~:: ::
-Cl
r: 5b.--~r-t ... "' ... ""' ~
-~ -.. . ~ ..... ... . .. .. . .. . .t .. - - 11 - - - • .... , .,.,. . ...... . . ...... .. ... .
, ... -,.._ ........ . . ....... ... -- • • • ,; • I • r .. .. ,.. • ,.lo - ..
11 • •-tt••• · ; • :: : ::
.. .. -.... . --.. ~ .... . + • .- • - ... - •• ~ ....... .. . . - -- - .. . -. ... .-.. ., ·--··
e ,a ... ~::.;: =~ ~ : ~ :::;::; - .... .. . 1M • - - - . • - .. . - -~ ··--- .. - . .. . . ... . .. ;: ; -; : ..... : : . . . . . . . . ..
I pu aI hry d1nse, 1ray-bra.n. silty, .1rnelly, fln1
0 15 . - - . • . • • .. '. • • • . : ~Jr/8.": : . z. -
ta 11111diu. SAND (lilaclal Till) lI I ~ ;;;; ' -...
80TTOI OF. BUR 1116 27. 9 8 :C
Q
COIPlfTEB ID/29/30
__ , ... .... .:: ... ·-· .·
-·~t
I z•a.D. ., 11 t •P• ..... , 1,
:[ 3•a.D. tbla .. 11 1upl1
• l••Ph n•t r•c1uer1d
Ul•rbtrl Ll•I ta:
~
Llq,ld 11•11
M1t•r•I ••t•r
"""tic llell
LEGEND
Clft I •nt
r l•ptnlul• 1nl
lttu ltul
rtuo.111 1 tip
p SHp It PU~td
101 3 3
~: :: : : ~ ! ..... ~ -.. ... ; ... , .. :)q~·~ 201 .::~::~:1~::::::;: 1 ·-·-- ~- 1 ... ,. ..... . .... ... . . ... .... .
- .. --------......... ::5jj)5·~ ~ -. - -. -- -.. :.: : ~: .. :
25 I : : : : : : : 1 • .... -- .• . -· ••• t ..... ... " j -- ·· 1
.
1 ·.; -:: : : - ;
.. --- -... -· •• • •• I -• - • . ... " ......... . -~ ...... -. - ....... - -- ~
'I • ,._ • r • • • - ... -------.... • - • I ... • • . .. . .. -. -.. - ... • - • I • • • ..........
. :-: : ; ;; : ; I ;: ::::::: - .... · 1 ... --· 1 · ---- --......... .............. , ......... _._, ......... •.4.~ ... ----- ··- -- ----- -- .. -- .. ...... ~ .....
1::::::::;
.. -·· .... ; .. . ............ .. --... -... --
. ... -·-. --. .............. .... . ...... __ .... .. : ~: ::: Z·: : . -----· - . -......... .
: :-:·:-•l:.::
--......... -· -• ~······ &·-~ -·----·· ----- -1····-····· ......... .... ..,_ .. .,;. .. ... . ........ - -- -- ····· ·· ······ --- --• ---........ ... ~ - ........•
a 11 1h: ~ •• ,,•U• f •JLU•I
DEXTER OFFICE BUILDIMC SEATTLE, llSRINGTOI·
j.OG .OF BORING B"'1 NDVEIIIER 1980 1-37811-111
l!IH~ Thll tUHlll u UH ! IH I , ,1, 11umt I • • H ll' • • •l.11.11 11 , ~u11.b1in
bet•••n ,,ti typ11 end th• tra111itlan ••, b• ir1duat. 1' SIIAIIIH l·IIUON. IIIC. l FIG A-1 utnnucu cusuuur• •

- :; !;l ~i :iii .. ~ ll
,.
.. _
E·i
:·
,._
"'"
' a
'1 .. :
---,. ~
- ..
...... I'
!'!
,,. ...
;:;
... Cl' ...
... "~
~
~~ -a
.... •
u-.
g:
:go
... •
a ~
......
~~ n
]~' ,.., --~
~
O:Q
... c
~
--M
.,
.~
.... ....
s ... l't'i
a ... F
,.. ...
--" .. ,. .. ..
-.ta
;;
~
=-.,, - ..I:
I •
·~~
(' ·
~~
ur r·
)
I (
•
,m1P
ur
i I
J'.J:
I ' I
• ""
'Ii"'
n1p1
fq i l
I
1 •
• I
I
i
-
• I I '
1'
f! ir •r
-iJ
.
----
\
• f
'Il
l
fU
-1 If
r
~ii
,~.-i
._J•f
!11
• l
J, f?.
+~
1•.
• "1
H;
:u
u·
..: I
·1i;
';: 5
•. it
"·
i,!f
i
~~
I i
. .
-I
I,
i*
tWU
I
=
Ii
I •
J ii
t1; ~
~-~ ...
·= •
5.!
• . ,.~
~!:..-
.· .. · .. · .. · .. · .. ·.
,:.·.·.·.·
:•i
i,, .
• ·,
I
fl .H.
: i;!
11 ;a
=.;
! -
ii•
• •
, ~~
i !i
,. "
-=:
• '"t
::::--
-"'-1
'~"""
'';.;...
.;+-"
'··.;..;·
.;..;·.;
..;··1-
-:...
:· ·:...
,....i;.
;,.... _
_ '-•
---1
~..:.
--
·L i.
liiJl
I i ~
I :~ !
:.:,
,
· &
'I
.~
' ill
;~
. ,1
~1 •
t.
•...
"
"'
.:::
: ~
ii I,
.:
"
II
; I"
.~
,
il!!
----
--...
..,
~:::r
: .•.
r :
f 1
~ 7
f f
r r ·
I•; il
• i:
i-
l · ·-t
i i~5
It .•
I .•
:~u i r
1 .·{ ,
n i ·-~ n If ff
FiP~
.. ,
i tut
111m
111-,
l,1
z •
• . ;
II!••
'"ll
•----·
· ·-
· ...
,,
' . :
.:
.... .
.:
..
~ .. :: .
. ••..
. "
... ···
··•1
, ·~
iz
'.
: •.
:I! • :
"
: :
t! •
::
~ ~ 1
j ~
: : :
~ 'I
I I
t ~ •
• ~ ~
~
I'
• •.
; ~
r:: ~;
i _:
.L .. L
Li
. :
:~::
ii-. -
-1-.:
..:..-
+-,
/....,,.;...
.i.~~
l,: :
.. -
; ,
. I
1 : ,
~' :
" t.
J • •.
. ll
'-
----
..L
...-
l..-
:-:·_·:
·_J".
" .
t jl-
' I
'I I
I •
...
.. _
....
. .P
,Ii
.. .,
}!
!J f i!!
F rJ
i j i
. .._ h
=
.f
='i
tl u
h
f'
,. . ; I
!I I i
·-! ~
II
.•. ~ 5
·~ l
iii ~~
e.
i i
~
f
.. JI!
II
IJI~
11
--·-
----
--· -
-
. .
--
--..
',!-
•
• • •

Measured groundwater level in exploration,well, or piezometer
Measured free product in well or piezometer
Distinct contact between soil strata
Approximate contact between soil strata
Contact between geologic units
SYMBOLS TYPICALDESCRIPTIONS
GW
GP
SW
SP
SM
FINEGRAINED
SOILS
SILTS ANDCLAYS
NOTE: Multiple symbols are used to indicate borderline or dual soil classifications
MORE THAN 50%RETAINED ONNO. 200 SIEVE
MORE THAN 50%PASSING
NO. 200 SIEVE
GRAVELAND
GRAVELLYSOILS
SC
LIQUID LIMITLESS THAN 50
(APPRECIABLE AMOUNTOF FINES)
(APPRECIABLE AMOUNTOF FINES)
COARSEGRAINED
SOILS
MAJOR DIVISIONSGRAPH LETTER
GM
GC
ML
CL
OL
SILTS ANDCLAYS
SANDS WITHFINES
SANDAND
SANDYSOILS
MH
CH
OH
PT
(LITTLE OR NO FINES)
CLEAN SANDS
GRAVELS WITHFINES
CLEAN GRAVELS
(LITTLE OR NO FINES)
WELL-GRADED GRAVELS, GRAVEL -SAND MIXTURES
CLAYEY GRAVELS, GRAVEL - SAND -CLAY MIXTURES
WELL-GRADED SANDS, GRAVELLYSANDS
POORLY-GRADED SANDS, GRAVELLYSAND
SILTY SANDS, SAND - SILT MIXTURES
CLAYEY SANDS, SAND - CLAYMIXTURES
INORGANIC SILTS, ROCK FLOUR,CLAYEY SILTS WITH SLIGHTPLASTICITY
INORGANIC CLAYS OF LOW TOMEDIUM PLASTICITY, GRAVELLYCLAYS, SANDY CLAYS, SILTY CLAYS,LEAN CLAYS
ORGANIC SILTS AND ORGANIC SILTYCLAYS OF LOW PLASTICITY
INORGANIC SILTS, MICACEOUS ORDIATOMACEOUS SILTY SOILS
INORGANIC CLAYS OF HIGHPLASTICITY
ORGANIC CLAYS AND SILTS OFMEDIUM TO HIGH PLASTICITY
PEAT, HUMUS, SWAMP SOILS WITHHIGH ORGANIC CONTENTSHIGHLY ORGANIC SOILS
SOIL CLASSIFICATION CHART
MORE THAN 50%OF COARSE
FRACTION RETAINEDON NO. 4 SIEVE
MORE THAN 50%OF COARSE
FRACTION PASSINGON NO. 4 SIEVE
SILTY GRAVELS, GRAVEL - SAND -SILT MIXTURES
POORLY-GRADED GRAVELS,GRAVEL - SAND MIXTURES
LIQUID LIMIT GREATERTHAN 50
Figure A-1
Continuous Coring
Bulk or grab
Direct-Push
Piston
Shelby tube
Standard Penetration Test (SPT)
2.4-inch I.D. split barrel
Contact between soil of the same geologicunit
Material Description Contact
Graphic Log Contact
NOTE: The reader must refer to the discussion in the report text and the logs of explorations for a proper understanding of subsurface conditions.Descriptions on the logs apply only at the specific exploration locations and at the time the explorations were made; they are not warranted to berepresentative of subsurface conditions at other locations or times.
Groundwater Contact
Key to Exploration Logs
Sampler Symbol Descriptions
ADDITIONAL MATERIAL SYMBOLS
NSSSMSHS
No Visible SheenSlight SheenModerate SheenHeavy Sheen
Sheen Classification
SYMBOLS
Asphalt Concrete
Cement Concrete
Crushed Rock/Quarry Spalls
Topsoil
GRAPH LETTER
AC
CC
SOD Sod/Forest Duff
CR
DESCRIPTIONSTYPICAL
TS
Laboratory / Field Tests%F%GALCACPCSDDDSHAMCMDMohsOCPMPIPPSATXUCVS
Percent finesPercent gravelAtterberg limitsChemical analysisLaboratory compaction test Consolidation testDry densityDirect shearHydrometer analysisMoisture contentMoisture content and dry densityMohs hardness scaleOrganic contentPermeability or hydraulic conductivity Plasticity indexPocket penetrometerSieve analysisTriaxial compressionUnconfined compressionVane shear
Blowcount is recorded for driven samplers as the number ofblows required to advance sampler 12 inches (or distance noted).See exploration log for hammer weight and drop.
"P" indicates sampler pushed using the weight of the drill rig.
"WOH" indicates sampler pushed using the weight of thehammer.
Rev 02/2017

4010
1
2
3
4
5
6
7
8%F
AC
GP
SM
ML
SM
SM
3½ inches asphalt concrete pavement4 inches crushed gravel base course
Brown silty fine to medium sand with occasional gravel(loose to medium dense, moist) (fill)
Gray sandy silt (soft, wet)
Gray silty fine to medium sand, oxidation staining(medium dense to dense, moist) (recent deposits)
Gray silty fine to medium sand with occasional gravel(very dense, moist) (glacially consolidated soils)
15
18
18
18
18
12
6
6
12
10
3
25
34
50/6"
50/6"
50/6"
Notes:
2/11/2017 2/11/2017 25.5CDLJDB Geologic Drill Exploration, Inc. Hollow-stem Auger
Mini Track MT55DrillingEquipmentRope & Cathead
WA State Plane NorthNAD83 (feet)
1268272231923
60NAVD88
Easting (X)Northing (Y)
Surface Elevation (ft)Vertical Datum
DrilledStart End Total
Depth (ft)Logged ByChecked By
HammerData
SystemDatum
Driller DrillingMethod
Groundwater not observed at time of exploration
Note: See Figure A-1 for explanation of symbols.Coordinates Data Source: Horizontal approximated based on Topographic Survey, Vertical approximated based on Site Survey and Building Construction Plans
Sheet 1 of 1Project Number:
Project Location:
Project:
Seattle, Washington
9061-016-00
Log of Boring GEI-1-17701 Dexter Building Renovation
Figure A-2
Dat
e:1
0/1
8/1
7 P
ath:
W:\
PRO
JEC
TS\9
\90
61
01
6\G
INT\
90
61
01
60
0.G
PJ D
BLi
brar
y/Li
brar
y:G
EOEN
GIN
EER
S_D
F_S
TD_U
S_2
01
7.G
LB/G
EI8
_GEO
TEC
H_S
TAN
DAR
D_%
F_N
O_G
W
Fine
sC
onte
nt (%
)
Moi
stur
eC
onte
nt (%
) REMARKS
Elev
atio
n (f
eet)
55
50
45
40
35
Dep
th (f
eet)
0
5
10
15
20
25
Inte
rval
Gra
phic
Log
FIELD DATA
Sam
ple
Nam
eTe
stin
g
Col
lect
ed S
ampl
e
Gro
upC
lass
ifica
tion MATERIAL
DESCRIPTION
Rec
over
ed (i
n)
Blo
ws/
foot

328
No sample at 2½ feet; wanted to confirm noconcrete
Driller noted hard drilling
1
2%F
3
AC
GP
SM
3 inches asphalt concrete pavement3 inches crushed gravel base course
Gray silty fine to medium sand with occasional gravel(very dense, moist) (glacially consolidated soils)
10
5
5
50/4"
50/5"
50/5"
Notes:
2/11/2017 2/11/2017 10.5CDLJDB Geologic Drill Exploration, Inc. Hollow-stem Auger
Mini Track MT55DrillingEquipmentRope & Cathead
WA State Plane NorthNAD83 (feet)
1268254231834
62NAVD88
Easting (X)Northing (Y)
Surface Elevation (ft)Vertical Datum
DrilledStart End Total
Depth (ft)Logged ByChecked By
HammerData
SystemDatum
Driller DrillingMethod
Groundwater not observed at time of exploration
Note: See Figure A-1 for explanation of symbols.Coordinates Data Source: Horizontal approximated based on Topographic Survey, Vertical approximated based on Site Survey and Building Construction Plans
Sheet 1 of 1Project Number:
Project Location:
Project:
Seattle, Washington
9061-016-00
Log of Boring GEI-2-17701 Dexter Building Renovation
Figure A-3
Dat
e:1
0/1
8/1
7 P
ath:
W:\
PRO
JEC
TS\9
\90
61
01
6\G
INT\
90
61
01
60
0.G
PJ D
BLi
brar
y/Li
brar
y:G
EOEN
GIN
EER
S_D
F_S
TD_U
S_2
01
7.G
LB/G
EI8
_GEO
TEC
H_S
TAN
DAR
D_%
F_N
O_G
W
Fine
sC
onte
nt (%
)
Moi
stur
eC
onte
nt (%
) REMARKS
Elev
atio
n (f
eet)
60
55
Dep
th (f
eet)
0
5
10
Inte
rval
Gra
phic
Log
FIELD DATA
Sam
ple
Nam
eTe
stin
g
Col
lect
ed S
ampl
e
Gro
upC
lass
ifica
tion MATERIAL
DESCRIPTION
Rec
over
ed (i
n)
Blo
ws/
foot

*Blow count overstated, possibly due to brickdebris
Concrete encountered at 7 feet; assumedadjacent footing
1
2
AC
SM
3 inches asphalt concrete pavementBrown silty fine to medium sand, brick debris (medium
dense, moist) (fill)
18
18
36*
23
Notes:
2/11/2017 2/11/2017 7CDLJDB Geologic Drill Exploration, Inc. Hollow-stem Auger
Mini Track MT55DrillingEquipmentRope & Cathead
WA State Plane NorthNAD83 (feet)
1268110231922
76NAVD88
Easting (X)Northing (Y)
Surface Elevation (ft)Vertical Datum
DrilledStart End Total
Depth (ft)Logged ByChecked By
HammerData
SystemDatum
Driller DrillingMethod
Groundwater not observed at time of exploration
Note: See Figure A-1 for explanation of symbols.Coordinates Data Source: Horizontal approximated based on Topographic Survey, Vertical approximated based on Topographic Survey
Sheet 1 of 1Project Number:
Project Location:
Project:
Seattle, Washington
9061-016-00
Log of Boring GEI-3-17701 Dexter Building Renovation
Figure A-4
Dat
e:1
0/1
8/1
7 P
ath:
W:\
PRO
JEC
TS\9
\90
61
01
6\G
INT\
90
61
01
60
0.G
PJ D
BLi
brar
y/Li
brar
y:G
EOEN
GIN
EER
S_D
F_S
TD_U
S_2
01
7.G
LB/G
EI8
_GEO
TEC
H_S
TAN
DAR
D_%
F_N
O_G
W
Fine
sC
onte
nt (%
)
Moi
stur
eC
onte
nt (%
) REMARKS
Elev
atio
n (f
eet)
75
70
Dep
th (f
eet)
0
5
Inte
rval
Gra
phic
Log
FIELD DATA
Sam
ple
Nam
eTe
stin
g
Col
lect
ed S
ampl
e
Gro
upC
lass
ifica
tion MATERIAL
DESCRIPTION
Rec
over
ed (i
n)
Blo
ws/
foot

248
Reference Boring GEI-3-17 for soil inupper 7 feet of boring
1
2
3%F
4
5
AC
SM
SM
SM
SM
3 inches asphalt concrete pavementNo sampling in upper 7 feet
Gray silty fine to medium sand with occasional gravel(medium dense, moist) (fill)
Gray silty fine to medium sand with occasional gravel(dense, moist) (recent deposits)
Gray silty fine to medium sand with occasional gravel,till-like (very dense, moist) (glacially consolidatedsoils)
18
18
18
11
6
20
36
41
50/5"
50/6"
Notes:
2/11/2017 2/11/2017 20.5CDLJDB Geologic Drill Exploration, Inc. Hollow-stem Auger
Mini Track MT55DrillingEquipmentRope & Cathead
WA State Plane NorthNAD83 (feet)
1268106231921
76NAVD88
Easting (X)Northing (Y)
Surface Elevation (ft)Vertical Datum
DrilledStart End Total
Depth (ft)Logged ByChecked By
HammerData
SystemDatum
Driller DrillingMethod
Groundwater not observed at time of exploration
Note: See Figure A-1 for explanation of symbols.Coordinates Data Source: Horizontal approximated based on Topographic Survey, Vertical approximated based on Topographic Survey
Sheet 1 of 1Project Number:
Project Location:
Project:
Seattle, Washington
9061-016-00
Log of Boring GEI-3A-17701 Dexter Building Renovation
Figure A-5
Dat
e:1
0/1
8/1
7 P
ath:
W:\
PRO
JEC
TS\9
\90
61
01
6\G
INT\
90
61
01
60
0.G
PJ D
BLi
brar
y/Li
brar
y:G
EOEN
GIN
EER
S_D
F_S
TD_U
S_2
01
7.G
LB/G
EI8
_GEO
TEC
H_S
TAN
DAR
D_%
F_N
O_G
W
Fine
sC
onte
nt (%
)
Moi
stur
eC
onte
nt (%
) REMARKS
Elev
atio
n (f
eet)
75
70
65
60
Dep
th (f
eet)
0
5
10
15
20
Inte
rval
Gra
phic
Log
FIELD DATA
Sam
ple
Nam
eTe
stin
g
Col
lect
ed S
ampl
e
Gro
upC
lass
ifica
tion MATERIAL
DESCRIPTION
Rec
over
ed (i
n)
Blo
ws/
foot

92
36
29
13
Driller noted water on rods at 24 feet
1
2SA
3
4
5
6%F
7
8
9
SM
ML
ML
SM
SM
3 inches asphalt concrete pavementBrown silty fine to medium sand with occasional gravel
(medium dense, moist) (fill)
Brown silt with occasional sand (stiff, moist) (recentdeposits)
Brown sandy silt (stiff to very stiff, moist)
Sand content increases
Brown silty fine to medium sand with gravel (mediumdense, moist)
Gray silty fine to medium sand with gravel (dense tovery dense, moist to wet) (glacially consolidatedsoils)
Grades to with occasional gravel
Grades to without gravel
6
18
18
18
18
18
10
10
18
12
12
20
16
15
22
34
50/4"
67
Notes:
2/11/2017 2/11/2017 26.5CDLJDB Geologic Drill Exploration, Inc. Hollow-stem Auger
Mini Track MT55DrillingEquipmentRope & Cathead
WA State Plane NorthNAD83 (feet)
1268069231851
77NAVD88
Easting (X)Northing (Y)
Surface Elevation (ft)Vertical Datum
DrilledStart End Total
Depth (ft)Logged ByChecked By
HammerData
SystemDatum
Driller DrillingMethod
Groundwater not observed at time of exploration
Note: See Figure A-1 for explanation of symbols.Coordinates Data Source: Horizontal approximated based on Topographic Survey, Vertical approximated based on Topographic Survey
Sheet 1 of 1Project Number:
Project Location:
Project:
Seattle, Washington
9061-016-00
Log of Boring GEI-4-17701 Dexter Building Renovation
Figure A-6
Dat
e:1
0/1
8/1
7 P
ath:
W:\
PRO
JEC
TS\9
\90
61
01
6\G
INT\
90
61
01
60
0.G
PJ D
BLi
brar
y/Li
brar
y:G
EOEN
GIN
EER
S_D
F_S
TD_U
S_2
01
7.G
LB/G
EI8
_GEO
TEC
H_S
TAN
DAR
D_%
F_N
O_G
W
Fine
sC
onte
nt (%
)
Moi
stur
eC
onte
nt (%
) REMARKS
Elev
atio
n (f
eet)
75
70
65
60
55
Dep
th (f
eet)
0
5
10
15
20
25
Inte
rval
Gra
phic
Log
FIELD DATA
Sam
ple
Nam
eTe
stin
g
Col
lect
ed S
ampl
e
Gro
upC
lass
ifica
tion MATERIAL
DESCRIPTION
Rec
over
ed (i
n)
Blo
ws/
foot

14
27
5
8
Wet sample
1
2
3
4SA
5
6
7%F
8
AC
GP
ML
ML
ML
SM
3 inches asphalt concrete pavement3 inches crushed gravel base course
Brown sandy silt (stiff, moist) (recent deposits)
Brown silt with sand (very stiff, moist)
Brown sandy silt with occasional gravel (very stiff,moist)
Gray silty fine to medium sand gravel (dense to verydense, moist) (glacially consolidated soils)
Grades to with occasional gravel
Becomes wet
12
18
18
12
12
16
10
16
10
17
23
37
50
47
50/4"
47
Notes:
2/11/2017 2/11/2017 26.5CDLJDB Geologic Drill Exploration, Inc. Hollow-stem Auger
Mini Track MT55DrillingEquipmentRope & Cathead
WA State Plane NorthNAD83 (feet)
1268097231833
75NAVD88
Easting (X)Northing (Y)
Surface Elevation (ft)Vertical Datum
DrilledStart End Total
Depth (ft)Logged ByChecked By
HammerData
SystemDatum
Driller DrillingMethod
Groundwater not observed at time of exploration
Note: See Figure A-1 for explanation of symbols.Coordinates Data Source: Horizontal approximated based on Topographic Survey, Vertical approximated based on Topographic Survey
Sheet 1 of 1Project Number:
Project Location:
Project:
Seattle, Washington
9061-016-00
Log of Boring GEI-5-17701 Dexter Building Renovation
Figure A-7
Dat
e:1
0/1
8/1
7 P
ath:
W:\
PRO
JEC
TS\9
\90
61
01
6\G
INT\
90
61
01
60
0.G
PJ D
BLi
brar
y/Li
brar
y:G
EOEN
GIN
EER
S_D
F_S
TD_U
S_2
01
7.G
LB/G
EI8
_GEO
TEC
H_S
TAN
DAR
D_%
F_N
O_G
W
Fine
sC
onte
nt (%
)
Moi
stur
eC
onte
nt (%
) REMARKS
Elev
atio
n (f
eet)
70
65
60
55
50
Dep
th (f
eet)
0
5
10
15
20
25
Inte
rval
Gra
phic
Log
FIELD DATA
Sam
ple
Nam
eTe
stin
g
Col
lect
ed S
ampl
e
Gro
upC
lass
ifica
tion MATERIAL
DESCRIPTION
Rec
over
ed (i
n)
Blo
ws/
foot
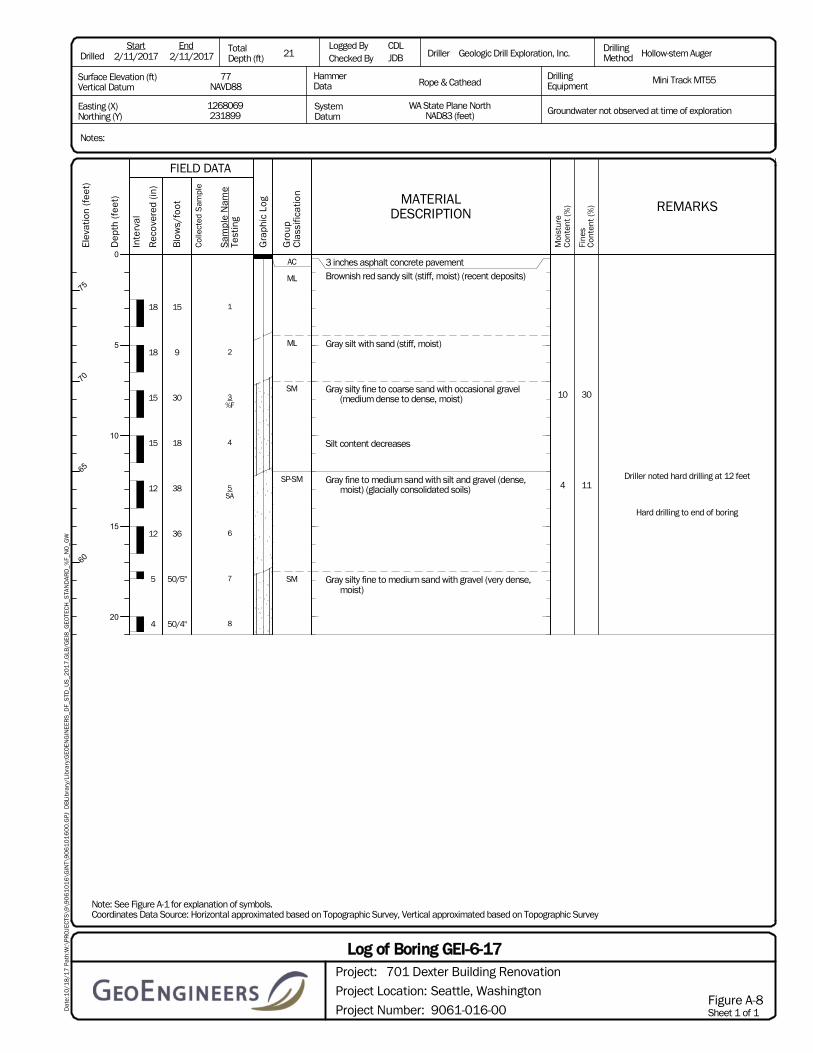
30
11
10
4Driller noted hard drilling at 12 feet
Hard drilling to end of boring
1
2
3%F
4
5SA
6
7
8
AC
ML
ML
SM
SP-SM
SM
3 inches asphalt concrete pavementBrownish red sandy silt (stiff, moist) (recent deposits)
Gray silt with sand (stiff, moist)
Gray silty fine to coarse sand with occasional gravel(medium dense to dense, moist)
Silt content decreases
Gray fine to medium sand with silt and gravel (dense,moist) (glacially consolidated soils)
Gray silty fine to medium sand with gravel (very dense,moist)
18
18
15
15
12
12
5
4
15
9
30
18
38
36
50/5"
50/4"
Notes:
2/11/2017 2/11/2017 21CDLJDB Geologic Drill Exploration, Inc. Hollow-stem Auger
Mini Track MT55DrillingEquipmentRope & Cathead
WA State Plane NorthNAD83 (feet)
1268069231899
77NAVD88
Easting (X)Northing (Y)
Surface Elevation (ft)Vertical Datum
DrilledStart End Total
Depth (ft)Logged ByChecked By
HammerData
SystemDatum
Driller DrillingMethod
Groundwater not observed at time of exploration
Note: See Figure A-1 for explanation of symbols.Coordinates Data Source: Horizontal approximated based on Topographic Survey, Vertical approximated based on Topographic Survey
Sheet 1 of 1Project Number:
Project Location:
Project:
Seattle, Washington
9061-016-00
Log of Boring GEI-6-17701 Dexter Building Renovation
Figure A-8
Dat
e:1
0/1
8/1
7 P
ath:
W:\
PRO
JEC
TS\9
\90
61
01
6\G
INT\
90
61
01
60
0.G
PJ D
BLi
brar
y/Li
brar
y:G
EOEN
GIN
EER
S_D
F_S
TD_U
S_2
01
7.G
LB/G
EI8
_GEO
TEC
H_S
TAN
DAR
D_%
F_N
O_G
W
Fine
sC
onte
nt (%
)
Moi
stur
eC
onte
nt (%
) REMARKS
Elev
atio
n (f
eet)
75
70
65
60
Dep
th (f
eet)
0
5
10
15
20
Inte
rval
Gra
phic
Log
FIELD DATA
Sam
ple
Nam
eTe
stin
g
Col
lect
ed S
ampl
e
Gro
upC
lass
ifica
tion MATERIAL
DESCRIPTION
Rec
over
ed (i
n)
Blo
ws/
foot

APPENDIX B Laboratory Testing

October 19, 2017 | Page B-1 File No. 9061-016-00
APPENDIX B LABORATORY TESTING
Soil samples obtained from the explorations were transported to GeoEngineers’ laboratory and evaluated to confirm or modify field classifications, as well as to evaluate engineering properties of the soil samples. Representative samples were selected for laboratory testing consisting of moisture content, percent fines determination, and sieve analyses. The tests were performed in general accordance with test methods of the American Society for Testing and Materials (ASTM) or other applicable procedures.
Moisture Content
Moisture content tests were completed in general accordance with ASTM D 2216 for representative samples obtained from the explorations. The results of these tests are presented on the exploration logs in Appendix A at the depths at which the samples were obtained.
Percent Passing U.S. No. 200 Sieve (%F)
Selected samples were “washed” through the U.S. No. 200 mesh sieve to estimate the relative percentages of coarse- and fine-grained particles in the soil. The percent passing value represents the percentage by weight of the sample finer than the U.S. No. 200 sieve. These tests were conducted to verify field descriptions and to estimate the fines content for analysis purposes. The tests were conducted in accordance with ASTM D 1140, and the results are shown on the exploration logs in Appendix A at the respective sample depths.
Sieve Analyses
Sieve analyses were performed on selected samples in general accordance with ASTM D 6913 and C 136. The wet sieve analysis method was used to determine the percentage of soil greater than the U.S. No. 200 mesh sieve. The results of the sieve analyses were plotted, were classified in general accordance with the Unified Soil Classification System (USCS) and are presented in Figure B-1.

0
10
20
30
40
50
60
70
80
90
100
0.0010.010.11101001000
PE
RC
EN
T P
AS
SIN
G B
Y W
EIG
HT
GRAIN SIZE IN MILLIMETERS
U.S. STANDARD SIEVE SIZE
SANDSILT OR CLAYCOBBLES
GRAVEL
COARSE MEDIUM FINECOARSE FINE
Boring Number
Depth
(feet) Soil Description
GEI-4
GEI-5
GEI-6
5
10
12.5
Silt with occasional sand (ML)
Silty fine to medium sand with gravel (SM)
Fine to coarse sand with silt and gravel (SP-SM)
Symbol
Moisture
(%)
29.1
4.8
4.4
3/8”3” 1.5” #4 #10 #20 #40 #60 #1003/4”
Fig
ure
B-1
Sie
ve A
na
lysis
Re
su
lts
70
1 D
exte
r Bu
ildin
g R
en
ova
tion
Se
attle
, Wa
sh
ingto
n
9061-016-00 Date Exported: 02/22/17
Note: This report may not be reproduced, except in full, without written approval of GeoEngineers, Inc. Test results are applicable only to the specific sample on which they were
performed, and should not be interpreted as representative of any other samples obtained at other times, depths or locations, or generated by separate operations or processes.
The grain size analysis results were obtained in general accordance with ASTM D 6913.
#200