giving or getting?
TRANSCRIPT

1
Giving or Getting?New York’s Balance of Payments with the Federal Government
January 2021
Laura Schultz
2021 REPORT

2
ABOUT THE AUTHOR
Laura Schultz is executive director of research at the Rockefeller Institute of Government

3
State Capitol, Albany, NY 12224│www.budget.ny.gov
ANDREW M. CUOMO Governor
ROBERT F. MUJICA JR. Director of the Budget
January 2021
The global pandemic and our nation’s response to it has reignited the discussion of the role of the Federal government and states. In the spring, New York State was blindsided by COVID-19 as the Federal government left states to fend for themselves and failed to stop 3 million travelers from Europe from entering New York City-area airports and others.
As the pandemic took its toll on our public health, it also battered our economy leaving state budgets at historically distressed levels, perhaps no more so than New York State’s, which thanks to Federal negligence was the global epicenter of the pandemic before New York State led the nation with its response, bent the curve, and achieved one of the lowest infection rates in the nation. Yet despite promises, the Federal government has failed to deliver promised funding to offset these revenue losses that are due entirely to the pandemic.
More than ever, the current crisis requires informed evidence-based analysis on how Federal tax dollars have been distributed. The Division of the Budget collaborated with the Rockefeller Institute of Government on the research and publication of this report to inform how policies in Washington are impacting the state revenues and New Yorkers.
At a time when some in Washington say states should go bankrupt rather than receive Federal funding to support them through one of the worst economic downturns in our nation’s history, New York’s position – once again – as the nation’s top donor state is stark.
As the report shows, New York’s residents and businesses in 2019 sent $22.8 billion more to the Federal government than they got back in return -- a shortfall larger than that of the second and third-ranked state combined. While New York is the single largest net contributor to the Federal government, 42 states get back more from the Federal government than they send. New York’s worst-in-the-nation rank remains the same since Senator Daniel Patrick Moynihan released his annual “Fisc” report.
New York’s historically outsized contribution to Federal spending programs has helped ensure resources are available when hurricanes strike, fires sweep through neighborhoods, and floods wash out roads and bridges. It’s time for the Federal government to support us in our time of need so New York as producer of 8% of the national Gross Domestic Product can lead the nation’s recovery. We continue to hold

4
- 2 -
State Capitol, Albany, NY 12224│www.budget.ny.gov
out hope that new leadership in Washington will deliver the funding New York State desperately needs.
Our appreciation goes out to the Rockefeller Institute of Government, which has been providing rigorous and thorough analysis for nearly four decades, informing policymakers and the citizens they represent.
This analysis clarifies where we stand today and informs future decisions. Sincerely, Robert F. Mujica, Jr. Director of the Budget

5
Executive Summary In its fourth annual analysis, the Rockefeller Institute of Government has estimated the distribution of Federal budget receipts and expenditures across the United States. This report examines where Federal funds are generated and spent, the balance of payments differential that exists between the states, the primary explanations for those differences, and how those gaps change over time.
This annual analysis is designed to aid policymakers as they continue to discuss whether there is too much redistribution or too little, and the impact of those redistribution decisions on states. The Rockefeller Institute estimated detailed revenue and spending data for Federal fiscal year (FFY) 2018 and developed a preliminary data series for FFY 2019. This report presents a national analysis while paying close attention to New York.
The findings based on this analysis are clear: New York’s residents and businesses continue to contribute more in taxes than the state receives back in Federal spending. Key findings from this year’s report include:
• Over five years, New York taxpayers have given $142.6 billion more to the federal government than they have received back in federal spending, the most of any state.
• Preliminary analysis of 2019 data indicate that at -$22.8 billion, New York maintains its five-year trend as having the least favorable balance of payments of any state in the nation.
• New York’s shortfall in 2019 is larger than that of second-ranked New Jersey (-$10.3 billion) and third-ranked Massachusetts (-$9.9 billion) combined. California and Connecticut round out the list of the top five states with the least favorable balances.

6
-$22.8 billion
Preliminary Analysis of New York 2019 data indicates:
IN 2019, NATIONAL BOP GREW BY
NY BOP GREW BY ONLY
$173
NEW YORK’S PER CAPITA BALANCE OF PAYMENTS:
-$1,172 NEW YORK RANKED THIRD TO LAST
PER CAPITA
48th
NEW YORK’S SHORTFALLIS LARGER THAN
New Jersey — -$10.3 billion
Massachusetts — -$9.9 billion COMBINED
and
US PER CAPITA BALANCE OF PAYMENTS:
$2,412NEW YORKERS PAY
MORE THAN THE NATIONAL AVERAGE
$3,584$386
NEW YORK’S BALANCE OF PAYMENTS
THE LEAST FAVORABLE
IN THE NATION
>
>

7
• The New York State per capita balance of payments, -$1,172, continues to rank as one of the least favorable in the nation. New York’s negative per capita balance of payments is less than all but Connecticut (-$1,614) and Massachusetts (-$1,439).
• The Federal per capita balance of payments in 2019 is $2,412 - a net positive to citizens of these states. New Yorkers pay $3,584 more than this average.
Last year’s report provided a preliminary analysis of the impact of the Federal Tax Cuts and Jobs Acts of 2017 (TCJA). The TCJA partially shifted revenue collection from corporate income tax to individual income taxes. The share of Federal revenue generated from individual income taxes grew from 50.3 percent in 2017 to 53.0 percent in 2018 and was 51.9 percent in 2019. The preliminary 2018 analysis was based on the most current data sets available at the time: the 2017 Internal Revenue Service’s Statistics of Income series and the final FFY 2018 Federal data from the 2020 Budget of the U.S. Government. While the approach showed the impacts of the shift from corporate to individual income taxes, it did not provide insights into how the TCJA shifted the relative individual income tax burdens among the states.
This year’s analysis revised the preliminary analysis by using the 2018 Statistics of Income series. Between 2017 and 2018, New York’s share of individual income tax burden grew from 8.9 to 9.1 percent. The 0.2 percentage point growth was the second highest after California. This was the primary factor in the downward revision of the 2018 balance of payments estimate from -$22.0 billion to -$26.3 billion.
As the overall distribution of tax burdens and Federal budget spending across the nation changes over time, understanding how these changes impact the states provides critically important information when evaluating the fairness and appropriateness of proposed changes in fiscal policy.
IntroductionIn FFY 2019, the Federal government spent approximately $4.4 trillion, an increase of 8.3 percent from the 2018 fiscal year. This level of spending was supported by nearly $3.5 trillion in revenue, an increase of 4.0 percent from 2018. Spending in FFY 2018 totaled $4.1 trillion, supporting revenues were $3.3 trillion.
Revenue collected by the Federal government, Federal spending in the states, and the difference between these two in each state is the subject of this report. This “balance of payments” (BOP) analysis provides a look at the effects of Federal economic redistribution policies on states. This report offers a focus on New York and its standing relative to other states.
Some states receive far more in Federal spending than their residents and businesses pay through taxes, while other states give far more than they get. The Federal system concentrates grants and funding to states with the highest poverty rates among their residents. Federal grants support programs of aid for the needy (Medicaid, Supplemental Nutrition Assistance Program, Temporary Assistance for Needy Families, etc.) Payments to individuals under the Social Security and Medicare programs are disproportionately concentrated in states with larger elderly populations. States with

8
large defense contracting sectors and more military bases receive more Federal defense spending. Federal wages are disproportionately concentrated in states with a large Federal employment presence.
On the other side, revenue is generated primarily from taxes, the most significant of which are the personal income and employment taxes, which accounted for 90 percent of allocable Federal revenue in 2019. Logically, this Federal revenue is raised disproportionately from residents of states with more high-income individuals who pay taxes at the highest rates under the progressive Federal income tax structure.
Our analysis provides states and policymakers with clear information about how Federal spending and revenue burdens are distributed among states. While there are understandable reasons why some states receive more than they give and vice versa, it is important to have solid information—and thus a better understanding—about how Federal spending and revenue are distributed among the states. This information gives policymakers insight into the magnitude of gaps in each state’s balance of payments, aiding in decisions about whether current and proposed distributions are fair and appropriate.
This report provides an estimate of the 2019 balance of payments based on available preliminary data. It also revises the previously released 2018 preliminary analysis, reflecting actual receipts and expenditures for that year and other updates in source data.
The analysis consists of two steps:
1. Federal receipts and expenditures from the Federal Budget are distributed into major categories and subcategories, all adding up to Federal budget totals.
2. Subcategory totals are allocated to states and US territories based on agency data documenting geographic distributions or appropriate proxies.
Data identifying the geographic source of receipts and location of spending were collected from relevant agencies wherever possible. Where complete data on the distribution of receipts and expenditures were not available, proxies were developed based on all available data. The appendix details the full methodology and presents revisions to last year’s estimates.
The results for New York State are stark: the state’s negative balance of payments for 2019 of -$22.8 billion ranks it the worst in the nation. In fact, New York’s gap in 2019 is larger than that of the next two states—New Jersey (-$10.3 billion) and Massachusetts (-$9.9 billion)—combined. This worst-in-the-nation rank remains the same since this analysis was first estimated in this series in 2016.
The picture does not improve greatly controlling for population: New York’s per capita negative balance of payments of -$1,172 ranks the state as third-worst in the nation in 2019.
This report presents more detailed comparisons to other states and the national average, and examines factors that drive New York’s negative balance of payments.
The results for New York State are stark: the state’s negative balance of payments for 2019 of -$22.8 billion ranks it the worst in the nation.

9
New York’s Balance of Payments: Preliminary Estimate for Federal Fiscal Year 2019 In 2019, New York taxpayers contributed approximately $22.8 billion more in revenue to the Federal government than the state received back in Federal spending (Table 1). New York’s negative balance of payments remains the largest of any state in the nation.
Calculating the balance of payments per capita controls for a state’s population. New York does not fare much better even by this measure: the state’s 2019 per capita balance of payments of -$1,172 is the third-worst balance of payments in the country. In sharp contrast, the national average per capita balance of payments was positive at $2,413 per person.
TABLE 1. Receipts, Expenditures, and Balance of Payments, FFY 2019Total Balance of Payments
New YorkAverage of All States
New York Difference from
Average
Balance of payments ($ millions) (22,798) 15,989 (38,786)
Rank among 50 states 50
Per Capita Balance of Payments
New York US AverageNY Minus
Average
Balance of payments (dollars per person) (1,172) 2,412 (3,584)
Rank among 50 states 48
Per Capita Receipts and Expenditures
Receipts (dollars per person) 13,343 9,944 3,399
Expenditures (dollars per person) 12,171 12,356 (185)
Federal spending received per dollar of taxes paid 0.91 1.24 (0.33)
SOURCE: Rockefeller Institute of Government analysis of data from the Budget of the U.S. Government, Fiscal Year 2021, from Federal agencies, and other sources. See methodology appendix for details.
NOTES: Calculations are based on preliminary data and are subject to change when final data are released.

10
What Drives New York’s Negative Balance of Payments?New York’s consistently negative balance of payments is driven primarily by the disproportionate amount of Federal taxes paid, rather than relatively lower Federal spending received: payments from New York residents and businesses to the Federal government were $13,343 per capita in 2019, $3,399 higher than the national average. Further per capita Federal spending in New York was $185 lower than the US average, increasing its negative balance of payments gap. The magnitude of the revenue difference is the obvious primary driver in the state’s negative balance. The Tax Cuts and Jobs Act of 2017 worsened New York’s imbalance. The tax changes increased the Federal reliance on income taxes and limits on itemized deductions for state and local taxes and mortgage interest negatively impacted residents in states that rely on property taxes for revenue generation and have high property values.
Table 2 provides a detailed breakdown of New York’s per capita balance of payments and comparison with the national average. The table also provides details on New York’s rank compared to other states. A state-by-state analysis can be found in the next section (Tables 3 and 4).
TABLE 2. New York’s Per Capita Balance of Payments with the Federal Government in FFY 2019Estimates of per capita federal receipts, expenditures, and balance of payments (Only includes amounts deemed allocable to states)
New York United States
New York Minus US
NY Indexed to US=100
NY Rank Among
50 States
Balance of payments (expenditures minus revenue) (1,172) 2,412 (3,584) 48
Ratio: Outlays to receipts 0.91 1.24
Revenue 13,343 9,944 3,399 134 3
Individual income tax 8,037 5,161 2,876 156 3
Employment taxes 4,012 3,739 273 107 16
Corporate income tax 949 694 255 137 3
Excise taxes 250 300 (50) 83 50
Estate and gift taxes 95 50 45 190 2
Expenditures 12,171 12,356 (185) 99 26
Direct payments for individuals 7,419 7,672 (253) 97 40
Grants 3,482 2,145 1,337 162 4
Contracts and procurement 905 1,706 (801) 53 31
Wages 365 833 (468) 44 44
SOURCE: Rockefeller Institute of Government analysis of data from the Budget of the U.S. Government, Fiscal Year 2021; from Federal agencies, and other sources. See methodology appendix for details.

11
Federal individual income taxes account for $2,876, or 85 percent, of the $3,399 difference between New York’s Federal taxes per capita and the US average. New York ranks third among the fifty states in per capita income tax, with many high-income taxpayers in the highest Federal tax brackets.1 Higher levels of employment taxes and corporate income taxes—reflecting New York’s higher average wages and higher income from capital—plus estate and gift taxes account for another $523 of the balance.
On the spending side, Federal grants per capita are 62 percent higher than the national average in New York, driven by Medicaid and other social programs. At the same time, however, procurement and Federal wages are only 53 percent of the national per capita average, and direct payments for programs such as Social Security and Medicare are close to equal to the national average. Taken together, Federal spending in New York per capita is $185 lower than the national average.
Per capita revenue from New Yorkers to the Federal budget was third highest in the nation in 2019, while Federal expenditure in New York was twenty-sixth. As noted earlier, the net result is that New York’s overall per capita balance of payments ranked third worst (48 out of 50 states) and the worst in the nation in terms of absolute dollars.
FIGURE 1. New York: Revenues and Expenditures
SOURCE: Rockefeller Institute of Government.
$7,419
$3,482
$905 $365
$(8,037)
$(4,012)
$(949)$(250) $(95)
$(1,172)
$(10,000)
$(8,000)
$(6,000)
$(4,000)
$(2,000)
$-
$2,000
$4,000
$6,000
$8,000
$10,000
DirectPayments
Grants Contracts Wages IndividualIncome Tax
EmploymentTax
CorporateIncome Tax
ExciseTaxes
Estate andGift Taxes
Total

12
The Balance of Payments Across the States The annual balance of payments in any given state is influenced by a number of factors. A state that has a disproportionately large percentage of high-income earners (such as New York) will inherently pay more in Federal personal income taxes. A state with a similar income distribution may also have high tax payments but could have this side of the balance of payment equation offset by higher Federal government spending. This is the case in Virginia, a relatively high-income state but one with disproportionately high spending on Federal employees, DC-area agencies and government contractors. Other states, such as New Mexico, have lower income levels but high levels of Federal spending due to large government and military facilities in the region. Structural issues such as these that are not subject to dramatic annual shifts serve to keep a state relatively consistent from year to year in its national ranking in a balance of payments analysis. Meanwhile, other issues, such as timing of Federal expenditures for large initiatives, may be large enough to impact a state’s ranking for a given year even though it is temporary in nature.
Forty-two states have a positive balance of payments with the Federal government for 2019, each receiving more Federal spending than taxpayers remitted in Federal taxes and other Federal revenues.2 New York is one of the eight states that had a negative balance of payments in 2019. While its negative per capita balance of payments improved by $173 since 2018, this was a significantly smaller improvement than the $386 positive increase in the national average over that same time period. Figure 2 presents the 50-state balance of payments in Federal fiscal year 2019 (see Tables 3 and 4 for state-by-state details).
FIGURE 2. Per Capita Balance of Payments, FFY 2019
SOURCE: Rockefeller Institute of Government.
> Explore this data with our interactive dashboard at rockinst.org/bop

13
TABLE 3. Estimated Distribution of Federal Receipts and Expenditures by State, FFY 2019(millions of dollars)
State Receipts ExpendituresBalance of Payments
Expenditure per Dollar of Receipts
Virginia 89,890 201,674 111,785 2.24
Kentucky 33,477 96,706 63,229 2.89
Florida 215,842 266,841 50,999 1.24
Maryland 66,747 116,689 49,942 1.75
Ohio 99,332 141,337 42,004 1.42
Pennsylvania 128,031 169,548 41,516 1.32
North Carolina 86,690 122,127 35,437 1.41
Alabama 35,759 68,791 33,033 1.92
Arizona 58,031 88,938 30,907 1.53
South Carolina 39,860 68,068 28,209 1.71
Tennessee 57,517 85,574 28,057 1.49
Georgia 89,207 114,022 24,814 1.28
Michigan 89,154 113,317 24,163 1.27
Missouri 52,226 75,775 23,550 1.45
Louisiana 35,315 56,394 21,080 1.60
Mississippi 19,135 39,989 20,853 2.09
Texas 267,237 286,751 19,514 1.07
Oklahoma 30,429 48,781 18,353 1.60
Indiana 55,782 72,240 16,458 1.30
New Mexico 14,912 29,966 15,054 2.01
Arkansas 22,284 36,652 14,368 1.64
West Virginia 11,999 25,764 13,765 2.15
Oregon 38,813 50,134 11,320 1.29
Hawaii 12,853 21,512 8,659 1.67
Alaska 6,930 14,351 7,421 2.07
Wisconsin 54,808 61,954 7,146 1.13
Idaho 13,871 20,931 7,060 1.51
Maine 11,253 17,578 6,325 1.56
Kansas 26,616 32,909 6,294 1.24
Iowa 27,632 32,339 4,707 1.17
Montana 9,618 14,130 4,512 1.47
Illinois 138,100 142,430 4,330 1.03
Delaware 9,037 13,208 4,171 1.46
Nevada 30,030 33,779 3,749 1.12
Rhode Island 10,495 13,890 3,395 1.32
Vermont 6,000 8,486 2,486 1.41
New Hampshire 15,488 17,341 1,853 1.12
South Dakota 8,668 10,469 1,802 1.21
Wyoming 6,419 8,037 1,618 1.25
North Dakota 7,744 8,969 1,224 1.16
Nebraska 18,936 19,705 769 1.04
Washington 88,082 88,424 342 1.00
Utah 26,694 26,277 (416) 0.98
Colorado 62,030 60,655 (1,374) 0.98
Minnesota 60,116 58,220 (1,896) 0.97
Connecticut 52,000 46,246 (5,754) 0.89
California 459,794 453,141 (6,653) 0.99
Massachusetts 97,003 87,084 (9,919) 0.90
New Jersey 115,623 105,289 (10,334) 0.91
New York 259,573 236,775 (22,798) 0.91
SOURCE: Rockefeller Institute of Government analysis of data from the Budget of the U.S. Government Fiscal Year 2021, from Federal agencies, and other sources. See methodology appendix for details.
14
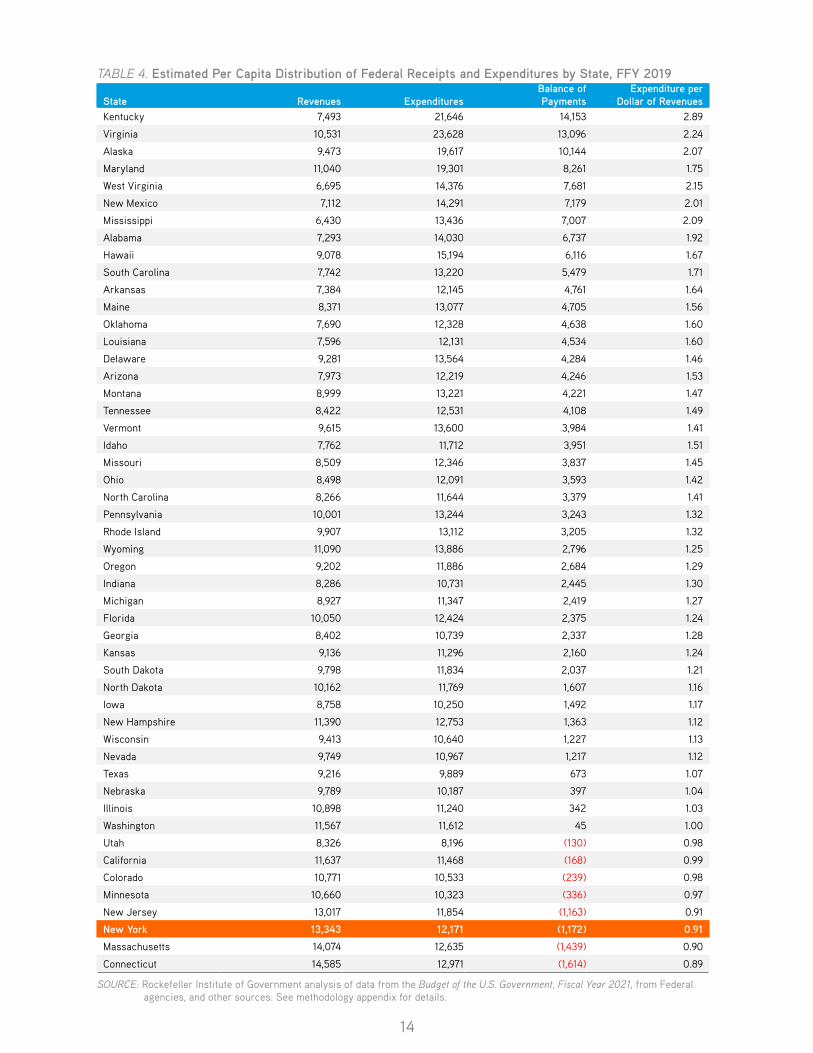
TABLE 4. Estimated Per Capita Distribution of Federal Receipts and Expenditures by State, FFY 2019
State Revenues ExpendituresBalance of Payments
Expenditure per Dollar of Revenues
Kentucky 7,493 21,646 14,153 2.89
Virginia 10,531 23,628 13,096 2.24
Alaska 9,473 19,617 10,144 2.07
Maryland 11,040 19,301 8,261 1.75
West Virginia 6,695 14,376 7,681 2.15
New Mexico 7,112 14,291 7,179 2.01
Mississippi 6,430 13,436 7,007 2.09
Alabama 7,293 14,030 6,737 1.92
Hawaii 9,078 15,194 6,116 1.67
South Carolina 7,742 13,220 5,479 1.71
Arkansas 7,384 12,145 4,761 1.64
Maine 8,371 13,077 4,705 1.56
Oklahoma 7,690 12,328 4,638 1.60
Louisiana 7,596 12,131 4,534 1.60
Delaware 9,281 13,564 4,284 1.46
Arizona 7,973 12,219 4,246 1.53
Montana 8,999 13,221 4,221 1.47
Tennessee 8,422 12,531 4,108 1.49
Vermont 9,615 13,600 3,984 1.41
Idaho 7,762 11,712 3,951 1.51
Missouri 8,509 12,346 3,837 1.45
Ohio 8,498 12,091 3,593 1.42
North Carolina 8,266 11,644 3,379 1.41
Pennsylvania 10,001 13,244 3,243 1.32
Rhode Island 9,907 13,112 3,205 1.32
Wyoming 11,090 13,886 2,796 1.25
Oregon 9,202 11,886 2,684 1.29
Indiana 8,286 10,731 2,445 1.30
Michigan 8,927 11,347 2,419 1.27
Florida 10,050 12,424 2,375 1.24
Georgia 8,402 10,739 2,337 1.28
Kansas 9,136 11,296 2,160 1.24
South Dakota 9,798 11,834 2,037 1.21
North Dakota 10,162 11,769 1,607 1.16
Iowa 8,758 10,250 1,492 1.17
New Hampshire 11,390 12,753 1,363 1.12
Wisconsin 9,413 10,640 1,227 1.13
Nevada 9,749 10,967 1,217 1.12
Texas 9,216 9,889 673 1.07
Nebraska 9,789 10,187 397 1.04
Illinois 10,898 11,240 342 1.03
Washington 11,567 11,612 45 1.00
Utah 8,326 8,196 (130) 0.98
California 11,637 11,468 (168) 0.99
Colorado 10,771 10,533 (239) 0.98
Minnesota 10,660 10,323 (336) 0.97
New Jersey 13,017 11,854 (1,163) 0.91
New York 13,343 12,171 (1,172) 0.91
Massachusetts 14,074 12,635 (1,439) 0.90
Connecticut 14,585 12,971 (1,614) 0.89
SOURCE: Rockefeller Institute of Government analysis of data from the Budget of the U.S. Government, Fiscal Year 2021, from Federal agencies, and other sources. See methodology appendix for details.

15
Receipts
On one side of the balance of payments calculation is the amount a state pays in taxes to the Federal government. Figure 3 shows payment of Federal taxes and receipts per person by state in FFY 2019. The darker blue states have the highest Federal tax payments and the lighter blue states have the lowest payments (New York is in the darkest-blue group). States paying the highest Federal taxes per capita tend to have high per capita incomes.
Expenditures
The other side of the balance of payments equation is Federal spending. Figure 4 shows Federal expenditures per capita, by state, in FFY 2019. The darker green states have the highest Federal spending per capita. Virginia and Maryland are adjacent to the District of Columbia and have disproportionate amounts of Federal wages and procurement spending. Kentucky benefits from federal contracts. Other dark states have relatively high poverty and receive considerable Federal spending under Medicaid and other social welfare programs. New York is a lighter green, only slightly below the US average.
FIGURE 3. Per Capita Receipts, FFY 2019
SOURCE: Rockefeller Institute of Government.

16
Figure 5 shows each state’s position relative to other states for per capita expenditures and receipts combined. The dashed lines indicate the national average for FFY 2019. As illustrated, New York’s per capita contribution is higher than the US average, while Federal spending is slightly below. Other states are high or low for various reasons: the outliers Maryland and Virginia, for example, both have dramatically higher Federal spending per capita than the average state, as they are near the physical headquarters for most of the Federal government and have significantly disproportionate Federal spending for procurement and Federal wages.
FIGURE 4. Per Capita Federal Expenditures, FFY 2019
SOURCE: Rockefeller Institute of Government.

17
A Closer Look at the Top-Five and Bottom-Five StatesTable 5 shows the per capita balance of payments for the top-five and bottom-five states, and each state’s difference from the United States average. It also includes a breakdown of expenditures and receipts. In FFY 2019, Kentucky’s per capita balance of payments is the most favorable in the country at $14,153, which is $11,741 above the national average of $2,412 per capita. Kentucky displaced Virginia for the top spot this year. Connecticut’s is the worst, at -$1,614. Connecticut’s per capita balance of payments is $4,026 below the national average.
All of the top-five states benefited from higher-than-average levels of Federal spending. Kentucky, Alaska, and West Virginia also benefitted from lower-than-average tax burdens. Three of the bottom-five states received lower-than-average Federal spending. The bulk of their negative balances is driven by their significantly higher-than-average tax payments. The residents of New Jersey, New York, Massachusetts, and Connecticut contributed at least $3,000 more per capita in taxes than the national average.
FIGURE 5. Federal Receipts and Expenditures Per Capita, FFY 2019
SOURCE: Rockefeller Institute of Government.
NOTE: Dashed lines are US averages.
Low Tax, High Spend High Tax, High Spend
Low Tax, Low Spend High Tax, Low Spend

18
Expenditures
The four major categories of Federal spending examined and used in the balance of payments calculations are:
• direct payments for individuals under programs such as Social Security and Medicare;
• Federal grants to state and local governments;
• contracts and other Federal procurement; and
• wages of Federal workers.
Table 6 shows per capita Federal expenditures by major category for the states with the highest and lowest per capita expenditures.
In 2019, direct payments for individuals constituted 62.1 percent of total Federal expenditures. As a result, this one category has the potential for the greatest influence on the expenditure side of the balance of payments calculation. Social Security and Medicare constitute nearly three-quarters of direct payments and spending under these programs is closely linked to states’ elderly populations. The demographic make-ups of states are stable, insulating direct payments from annual variability. Variations in the three other expenditure categories—grants, contracts, and wages—have a significant impact on determining which states have the highest and lowest total per capita expenditures.
TABLE 5. Total Balance of Payments: Top-Five and Bottom-Five States, FFY 2019
Total Balance of Payments Total Expenditures Total Receipts
StatePer Capita
TotalState
Minus USPer Capita
TotalState
Minus USPer Capita
TotalState
Minus US
Kentucky 14,153 11,741 21,646 9,290 7,493 (2,451)
Virginia 13,096 10,684 23,628 11,272 10,531 587
Alaska 10,144 7,732 19,617 7,261 9,473 (471)
Maryland 8,261 5,849 19,301 6,945 11,040 1,096
West Virginia 7,681 5,269 14,376 2,020 6,695 (3,249)
United States 2,412 0 12,356 0 9,944 0
Minnesota (336) (2,748) 10,323 (2,033) 10,660 716
New Jersey (1,163) (3,575) 11,854 (502) 13,017 3,073
New York (1,172) (3,584) 12,171 (185) 13,343 3,399
Massachusetts (1,439) (3,851) 12,635 279 14,074 4,130
Connecticut (1,614) (4,026) 12,971 615 14,585 4,641
SOURCE: Rockefeller Institute of Government analysis of data from the Budget of the U.S. Government, Fiscal Year 2021, from Federal agencies, and other sources. See methodology appendix for details.

19
Grants to state and local governments is the second-largest category of Federal expenditures next to direct payments. The biggest component of these grants is for Medicaid. Other significant components include Federal highway spending, safety net programs such as Temporary Assistance for Needy Families, and Federal education grants. Participation—or not—in the Medicaid expansion program appears to have a significant impact on the per capita total Federal spending in this category.
The final two expenditure categories, contracts and wages, show significant variation and are an important factor in determining which states end up with the highest or lowest per capita spending totals. Virginia and Maryland had the first and third highest per capita contracts total due to their proximity to Washington, DC.
Proximity to Washington also contributes to the high concentration of Federal employees in Maryland and Virginia. Hawaii and Alaska, with large military and Federal research installations, also had high per capita Federal wage totals.
TABLE 6: Total Expenditures: Top-Five and Bottom-Five States, FFY 2019(New York included at the bottom of the table for reference)
Total Spending Direct Payments Grants Contracts Wages
State
Per Capita
Total
State Minus
US
Per Capita
Total
State Minus
US
Per Capita
Total
State Minus
US
Per Capita
Total
State Minus
US
Per Capita
Total
State Minus
US
Virginia 23,628 11,272 8,494 822 1,351 (794) 10,920 9,214 2,863 2,029
Kentucky 21,646 9,290 8,361 689 2,843 698 9,468 7,762 974 141
Alaska 19,617 7,261 6,680 (992) 4,859 2,714 4,564 2,858 3,514 2,681
Maryland 19,301 6,945 8,550 878 2,129 (16) 5,520 3,814 3,102 2,269
Hawaii 15,194 2,838 8,415 743 2,111 (34) 590 (1,115) 4,078 3,244
US—Average 12,356 7,672 2,145 1,706 833
Minnesota 10,323 (2,033) 7,033 (639) 2,218 73 723 (983) 350 (484)
Iowa 10,250 (2,106) 7,530 (142) 1,942 (203) 469 (1,237) 309 (524)
Nebraska 10,187 (2,169) 7,481 (191) 1,522 (623) 431 (1,275) 753 (80)
Texas 9,889 (2,467) 6,431 (1,241) 1,626 (519) 1,143 (563) 690 (144)
Utah 8,196 (4,160) 5,427 (2,245) 1,352 (793) 498 (1,207) 919 85
New York 12,171 (185) 7,419 (253) 3,482 1,337 905 (801) 365 (468)
SOURCE: Rockefeller Institute of Government analysis of data from the Budget of the U.S. Government, Fiscal Year 2021, from Federal agencies, and other sources. See methodology appendix for details.

20
Receipts
Table 7 shows per capita Federal receipts in 2019 by major category for the states with the five highest and five lowest per capita receipts.
Individual income taxes are the largest source of receipts paid to the Federal government. These taxes account for 51.9 percent of total Federal revenues in 2019. A state’s individual income tax obligation has the greatest impact in determining which have relatively high or low per capita receipts. Payroll taxes are the next most significant determinant, accounting for 37.6 percent of the total Federal revenues. Together these two categories account for 89.5 percent of the Federal per capita receipts. Corporate income and excise taxes account for 10.5 percent, on average, of the US total and do not greatly affect a state’s balance of payments.
TABLE 7. Total Receipts: Top-Five and Bottom-Five States, FFY 2019
Total ReceiptsIndividual Income
Taxes Payroll TaxesCorporate Income
TaxesExcise and Other
Taxes
State
Per Capita
Total
State Minus
US
Per Capita
Total
State Minus
US
Per Capita
Total
State Minus
US
Per Capita
Total
State Minus
US
Per Capita
Total
State Minus
US
Connecticut 14,585 4,641 8,999 3,839 4,141 402 1,057 363 388 38
Massachusetts 14,074 4,130 8,669 3,508 4,111 372 944 250 349 (1)
New York 13,343 3,399 8,037 2,876 4,012 273 949 255 345 (5)
New Jersey 13,017 3,073 7,602 2,441 4,216 476 842 148 358 8
California 11,637 1,693 6,822 1,661 3,591 (148) 865 171 359 9
US—Average 9,944 5,161 3,739 694 350
Arkansas 7,384 (2,560) 3,002 (2,159) 3,510 (230) 541 (153) 332 (18)
Alabama 7,293 (2,651) 3,002 (2,158) 3,479 (260) 466 (228) 345 (5)
New Mexico 7,112 (2,832) 2,889 (2,271) 3,354 (386) 484 (210) 385 35
West Virginia 6,695 (3,249) 2,534 (2,627) 3,439 (300) 397 (297) 326 (24)
Mississippi 6,430 (3,514) 2,243 (2,917) 3,428 (311) 397 (297) 361 11
SOURCE: Rockefeller Institute of Government analysis of data from the Budget of the U.S. Government, Fiscal Year 2021, from Federal agencies, and other sources. See methodology appendix for details.

21
New York’s Balance of Payments: Emerging TrendsThis report provides five years of estimates for New York’s balance of payments, from Federal fiscal years 2015 through 2019. New York’s position as last in the country in terms of total balance of payments remains unchanged and for each of the five years New York’s negative balance of payments is almost equal to the sum of the next two (forty-eighth and forty-ninth) lowest-ranked states. Table 8 shows the balance of payments, receipts, and expenditures since 2015 with a focus on New York. Tables 8A and 8B provide the balance of payments and per capita values for each state for the most recent five years.
New York’s annual per capita Federal tax burden has grown by $726 since 2015. To compare, the Federal government collected $540 more per person in 2019 than it did in 2015. In 2019, New York’s excess burden, the difference between New York’s per capita balance of payments and the Federal average, reached its highest levels in five years. Since 2015, the national per capita balance of payments has improved by $1,094 and New York’s balance of payments has improved by only $1,079.

22
TABLE 8. New York’s Balance of Payments: 2015-19
2015 Revised
2016 Revised
2017 Revised
2018 Revised
2019 Preliminary
Five Year Total
Five Year
Average
New York’s Balance of Payments ($ millions)
Balance of Payments (44,607) (24,925) (23,972) (26,284) (22,798) (142,585) (28,517)
Receipts 250,063 237,873 245,019 250,759 259,573 1,243,287 248,657
Expenditures 205,456 212,948 221,047 224,475 236,775 1,100,702 220,140
Per Capita
New York
Balance of Payments (2,251) (1,269) (1,224) (1,345) (1,172) (7,260) (1,452)
Receipts 12,617 12,111 12,507 12,832 13,343 63,410 12,682
Expenditures 10,366 10,842 11,283 11,487 12,171 56,149 11,230
United States
Balance of Payments 1,318 1,760 1,896 2,026 2,412 9,411 1,882
Receipts 9,404 9,384 9,565 9,582 9,944 47,879 9,576
Expenditures 10,722 11,143 11,461 11,608 12,356 57,290 11,458
New York’s Excess Burden 3,568 3,029 3,120 3,371 3,584 16,672 3,334
SOURCE: Rockefeller Institute of Government analysis of data from the Budget of the U.S. Government, Fiscal Year 2021, from Federal agencies, and other sources. See methodology appendix for details.

23
TABLE 8A. Five Year Balance of PaymentsBalance of Payments ($ millions)
Five Year Total Five Year AverageState 2015 2016 2017 2018 2019
New York (44,606) (24,925) (23,972) (26,284) (22,798) (142,585) (28,517)
New Jersey (29,666) (16,646) (13,576) (13,835) (10,334) (84,058) (16,812)
Massachusetts (15,697) (11,916) (12,169) (11,391) (9,919) (61,093) (12,219)
California (28,877) 2,385 3,647 (13,084) (6,653) (42,582) (8,516)
Connecticut (7,695) (10,879) (8,620) (7,673) (5,754) (40,621) (8,124)
Illinois (16,432) (4,902) (247) 763 4,330 (16,488) (3,298)
Colorado (2,146) (1,346) (1,181) (1,280) (1,374) (7,327) (1,465)
Washington (1,124) (2,880) (969) (1,778) 342 (6,410) (1,282)
Utah 168 (1,387) (574) (888) (416) (3,097) (619)
Nebraska (758) (1,015) (235) 453 769 (787) (157)
New Hampshire (1,280) (268) 107 810 1,853 1,222 244
North Dakota (739) 185 619 782 1,224 2,071 414
Minnesota (5,928) 5,309 7,801 (1,598) (1,896) 3,688 738
Wyoming 132 966 940 1,118 1,618 4,774 955
South Dakota 585 506 1,124 1,608 1,802 5,626 1,125
Vermont 1,897 1,739 1,976 2,127 2,486 10,225 2,045
Nevada 3,362 1,022 1,714 1,622 3,749 11,470 2,294
Rhode Island 2,469 2,192 2,650 2,766 3,395 13,472 2,694
Delaware 2,009 2,601 3,174 3,335 4,171 15,290 3,058
Iowa 3,048 2,740 2,693 4,131 4,707 17,318 3,464
Montana 3,063 3,060 3,589 3,888 4,512 18,112 3,622
Wisconsin 1,192 1,830 3,620 5,756 7,146 19,545 3,909
Kansas 3,061 2,597 6,238 5,640 6,294 23,831 4,766
Idaho 4,593 4,476 4,707 5,790 7,060 26,626 5,325
Alaska 3,199 5,373 6,558 6,917 7,421 29,468 5,894
Maine 6,609 6,161 6,609 6,576 6,325 32,280 6,456
Hawaii 7,878 7,745 7,504 7,764 8,659 39,550 7,910
Oregon 7,355 7,449 8,726 9,226 11,320 44,076 8,815
Texas 3,441 13,941 2,863 20,274 19,514 60,034 12,007
West Virginia 13,130 12,241 13,129 12,849 13,765 65,114 13,023
Arkansas 13,623 12,525 12,660 13,337 14,368 66,513 13,303
Indiana 12,820 11,790 13,703 14,514 16,458 69,284 13,857
Oklahoma 12,084 15,026 15,887 15,981 18,353 77,330 15,466
New Mexico 17,374 17,048 16,722 16,883 15,054 83,080 16,616
Louisiana 14,732 14,636 19,000 19,685 21,080 89,133 17,827
Mississippi 19,869 16,689 18,957 18,793 20,853 95,161 19,032
Georgia 21,848 18,842 18,918 20,714 24,814 105,135 21,027
Michigan 19,967 19,338 21,359 21,567 24,163 106,394 21,279
Tennessee 18,555 18,465 20,854 25,165 28,057 111,095 22,219
Missouri 20,432 20,936 23,800 24,052 23,550 112,769 22,554
South Carolina 22,097 20,624 21,983 23,164 28,209 116,076 23,215
Arizona 23,806 24,455 28,643 29,317 30,907 137,129 27,426
North Carolina 29,340 27,149 31,352 33,003 35,437 156,281 31,256
Ohio 25,500 26,478 31,546 32,829 42,004 158,357 31,671
Pennsylvania 19,308 29,025 33,241 35,578 41,516 158,669 31,734
Alabama 30,477 30,878 31,074 36,132 33,033 161,594 32,319
Florida 34,306 40,746 22,450 35,557 50,999 184,059 36,812
Maryland 35,128 38,454 43,675 43,463 49,942 210,663 42,133
Kentucky 26,399 37,751 38,386 46,072 63,229 211,837 42,367
Virginia 52,791 86,984 90,776 97,513 111,785 439,849 87,970

24
TABLE 8B. Five Year Per Capita Balance of PaymentsBalance of Payments
Five Year Difference
from US
Five Year Average
Difference from USState 2015 2016 2017 2018 2019
Five Year Total
Five Year Average
Connecticut (2,141) (3,040) (2,412) (2,148) (1,614) (11,355) (2,271) (20,766) (4,153)
New Jersey (3,311) (1,876) (1,527) (1,553) (1,163) (9,431) (1,886) (18,842) (3,768)
Massachusetts (2,310) (1,746) (1,773) (1,650) (1,439) (8,919) (1,784) (18,330) (3,666)
New York (2,251) (1,269) (1,224) (1,345) (1,172) (7,260) (1,452) (16,672) (3,334)Colorado (394) (243) (210) (225) (239) (1,311) (262) (10,723) (2,145)
Illinois (1,278) (382) (19) 60 342 (1,277) (255) (10,689) (2,138)
California (740) 61 93 (331) (168) (1,086) (217) (10,497) (2,099)
Utah 56 (456) (185) (281) (130) (995) (199) (10,407) (2,081)
Washington (157) (395) (130) (236) 45 (874) (175) (10,285) (2,057)
Nebraska (401) (533) (122) 235 397 (424) (85) (9,835) (1,967)
Minnesota (1,081) 961 1,401 (285) (336) 660 132 (8,752) (1,750)
New Hampshire (962) (200) 79 597 1,363 878 176 (8,534) (1,707)
Texas 125 499 101 706 673 2,105 421 (7,307) (1,461)
North Dakota (979) 245 820 1,029 1,607 2,721 544 (6,690) (1,338)
Wisconsin 207 317 625 990 1,227 3,367 673 (6,045) (1,209)
Nevada 1,166 350 577 535 1,217 3,845 769 (5,567) (1,113)
Iowa 977 875 857 1,309 1,492 5,509 1,102 (3,902) (780)
South Dakota 685 587 1,288 1,823 2,037 6,419 1,284 (2,993) (599)
Kansas 1,053 892 2,143 1,937 2,160 8,186 1,637 (1,225) (245)
Wyoming 225 1,653 1,624 1,935 2,796 8,232 1,646 (1,179) (236)
Florida 1,693 1,975 1,070 1,669 2,375 8,782 1,756 (630) (126)
United States 1,318 1,760 1,896 2,026 2,412 9,412 1,882 0 0
Georgia 2,142 1,828 1,817 1,969 2,337 10,093 2,019 682 136
Indiana 1,939 1,777 2,057 2,169 2,445 10,388 2,078 976 195
Oregon 1,831 1,821 2,104 2,201 2,684 10,642 2,128 1,230 246
Michigan 2,013 1,943 2,141 2,158 2,419 10,674 2,135 1,263 253
Pennsylvania 1,509 2,271 2,599 2,778 3,243 12,400 2,480 2,988 598
Rhode Island 2,338 2,074 2,508 2,616 3,205 12,741 2,548 3,329 666
Ohio 2,197 2,276 2,705 2,808 3,593 13,579 2,716 4,168 834
North Carolina 2,922 2,673 3,053 3,178 3,379 15,205 3,041 5,793 1,159
Idaho 2,784 2,660 2,738 3,301 3,951 15,434 3,087 6,022 1,204
Delaware 2,128 2,740 3,317 3,448 4,284 15,916 3,183 6,505 1,301
Vermont 3,037 2,788 3,164 3,396 3,984 16,370 3,274 6,958 1,392
Tennessee 2,815 2,779 3,108 3,717 4,108 16,528 3,306 7,116 1,423
Montana 2,979 2,940 3,408 3,660 4,221 17,208 3,442 7,796 1,559
Missouri 3,365 3,439 3,896 3,926 3,837 18,463 3,693 9,051 1,810
Louisiana 3,154 3,129 4,068 4,224 4,534 19,109 3,822 9,697 1,939
Arizona 3,500 3,521 4,064 4,088 4,246 19,418 3,884 10,007 2,001
Oklahoma 3,095 3,826 4,040 4,053 4,638 19,652 3,930 10,240 2,048
Arkansas 4,578 4,188 4,216 4,425 4,761 22,169 4,434 12,757 2,551
South Carolina 4,517 4,160 4,378 4,556 5,479 23,089 4,618 13,677 2,735
Maine 4,978 4,628 4,950 4,913 4,705 24,174 4,835 14,762 2,952
Hawaii 5,523 5,423 5,269 5,466 6,116 27,797 5,559 18,385 3,677
Mississippi 6,656 5,585 6,341 6,292 7,007 31,880 6,376 22,469 4,494
Alabama 6,283 6,347 6,374 7,392 6,737 33,133 6,627 23,722 4,744
Maryland 5,854 6,404 7,249 7,193 8,261 34,961 6,992 25,549 5,110
West Virginia 7,137 6,685 7,226 7,115 7,681 35,844 7,169 26,432 5,286
New Mexico 8,344 8,146 7,988 8,057 7,179 39,714 7,943 30,302 6,060
Alaska 4,334 7,246 8,865 9,380 10,144 39,970 7,994 30,558 6,112
Kentucky 5,970 8,506 8,618 10,311 14,153 47,558 9,512 38,146 7,629
Virginia 6,310 10,342 10,723 11,448 13,096 51,920 10,384 42,508 8,502

25
The Tax Cuts and Jobs Act and the Balance of Payments
The Federal Tax Cuts and Jobs Act (TCJA) was signed into law on December 22, 2017 and enacted significant changes to individual and corporate income tax codes. It was considered the most comprehensive reform since The Tax Reform Act of 1986. The TCJA revised the tax code in several ways that had the potential to change the distribution of tax burden across states including a shift in revenue generation from corporate to individual income taxes, increases in the standard deductions, limits on the State and Local Tax (SALT) and mortgage deductions, and changes in tax rates in several brackets. The changes were expected to redistribute more of the burden onto states with high-income filers, higher real estate values, and high property taxes.
Table 9 presents the per capita individual income tax payments from each state to the federal government for the years 2015 through 2018. A number of factors can impact the income tax receipts generated by a state over time including demographic shifts and regional economic health. For example, states with an inflow of college-educated professionals would expect to see steady growth in the per capita individual income tax payments over time. States whose economies rely on volatile industries such as energy or finance could see swings on a year-to-year basis depending on the performance of the sector.
Table 9 calculates the average annual change in per capita individual income tax payments over the three years prior to the TCJA (2015-17) and the year the TCJA (2018) was implemented. Nationally, prior to the TCJA, individual income tax revenue grew by 1 percent annually. In 2018, the per capita individual income tax grew by 5.5 percent. In every state, the changes post-TCJA were a shift from the trends prior to passage of the reform.
After TCJA, seventeen states saw an increase in per capita tax payments higher than the national average. The three most negatively impacted states, California, Nevada, and Illinois, saw double digit percentage rates almost twice the national average. New York saw the fourth largest jump in individual income taxes post-TCJA. Of the 10 states with the largest post-TCJA increases, seven ranked in the bottom 10 for per capita balance of payments. Their higher than average TCJA income tax increases only worsen their relative standing in the balance of payments calculations.
Thirty-three states saw per capita income taxes increase at a rate slower than the national average. Texas, Arkansas, and Florida all saw per capita tax payments decrease after the TCJA. Five of the least impacted states were among the 10 with the most favorable balance of payments. These states benefited from smaller than average increases in their individual income tax burden resulting in a more favorable balance of payments.

26
The COVID-19 Pandemic and the Balance of Payments
Next year’s report will present preliminary findings from Federal fiscal year 2020 covering the time period October 1, 2019 through September 30, 2020. In March and April of 2020, four laws were enacted in response to the coronavirus pandemic: P.L. 116-123, P.L. 116-127, P.L. 116-136, and P.L. 116-139. The Congressional Budget Office estimated that combined these four laws increased discretionary outlays and mandatory spending by $498 billion and $1,404 billion respectively over the next 10 years. The bulk of outlays will occur in FFYs 2020 and 2021.3 These funds have been distributed to individuals, businesses, medical providers, and state and local governments. The Congressional Budget Office also estimates the laws will result in a $502 billion decline in revenues.
TABLE 9. Per Capita Individual Income Tax Changes for Most and Least Favorable States
2015 2016 2017 2018
Pre-TCJA Annual Change
TCJA Change
BOP Rank Per
Capita (2019)
California 5,777 5,893 5,971 6,678 1.7% 11.8% 44
Nevada 4,386 4,784 4,657 5,194 3.0% 11.5% 38
Illinois 5,427 5,362 5,233 5,778 -1.8% 10.4% 41
New York 7,125 6,928 7,213 7,841 0.6% 8.7% 47
Utah 3,345 3,568 3,511 3,787 2.5% 7.9% 43
Maryland 5,410 5,543 5,426 5,843 0.1% 7.7% 4
Massachusetts 7,710 7,765 7,931 8,484 1.4% 7.0% 49
Washington 5,690 6,077 6,077 6,495 3.3% 6.9% 42
Idaho 2,893 3,050 3,047 3,252 2.6% 6.7% 20
Connecticut 8,655 8,307 8,267 8,801 -2.3% 6.5% 50
Missouri 3,624 3,703 3,551 3,776 -1.0% 6.3% 21
Oregon 3,885 4,089 4,062 4,319 2.3% 6.3% 27
US Average 4,716 4,709 4,812 5,074 1.0% 5.5%
West Virginia 2,502 2,412 2,426 2,464 -1.5% 1.6% 5
Iowa 3,574 3,602 3,539 3,583 -0.5% 1.2% 35
Mississippi 2,228 2,302 2,174 2,191 -1.2% 0.8% 7
Hawaii 3,732 3,911 3,974 4,003 3.2% 0.7% 9
Alabama 2,883 2,988 2,937 2,952 0.9% 0.5% 8
Indiana 3,370 3,496 3,422 3,437 0.8% 0.4% 28
Alaska 5,090 4,693 4,384 4,402 -7.2% 0.4% 3
Wyoming 5,748 5,023 5,419 5,422 -2.9% 0.1% 26
Texas 4,682 4,231 4,711 4,654 0.3% -1.2% 39
Arkansas 2,826 2,953 3,010 2,946 3.2% -2.1% 11
Florida 4,970 4,583 5,595 5,437 6.1% -2.8% 30
SOURCE: Rockefeller Institute of Government.

27
While the federal budget data will not be available until later in 2021, we know that Federal expenditures will be far larger than receipts in FFY 2020 and this will likely continue for FFY 2021. All states will see larger balances of payments over the next two years. It is possible that in all states, Federal expenditures in states will exceed receipts.
ConclusionIn FFY 2019, New York continued to have the greatest negative balance of payments of all states in the nation in absolute dollar terms. New York’s residents and businesses contributed $22.8 billion more in taxes to the Federal government than it received in Federal spending. Controlling for population, New York had the third-worst balance of payments in the country per capita.
In contrast, 42 states had a positive balance of payments with the Federal government in 2019, receiving more spending than their taxpayers and economy paid for Federal taxes and other Federal receipts. On average, between 2018 and 2019, the per capita US balance of payments improved by $386. New York saw an improvement of only $173.
New York’s negative balance of payments is driven primarily by Federal taxes on individual income. Total receipts paid to the Federal government in 2019 was $13,343 per capita, $3,399 higher than the national average. Individual income taxes accounted for 60 percent ($8,037) of the total per capita revenue paid, followed by payroll taxes, which constituted another 30 percent ($4,012 per capita) As a result, approximately 90 percent of the total per capita revenue New York sends to the Federal government comes from individuals through the combined impact of these two types of taxes. New York residents spending per capita was $12,171 in 2019, $185 lower than the US average.
Former New York Senator Daniel Patrick Moynihan, who highlighted balance of payments inequities throughout the 1980s and 1990s, pointed to structural issues in New York that fueled the Empire State’s imbalance between revenue sent to the Federal government and spending received. Senator Moynihan noted very high incomes among segments of the resident population combined with a progressive Federal tax system that resulted in above-average revenue generated per capita. This is compounded by low Federal spending in New York on contracts, Federal employees’ wages, and discretionary spending that more than outweighed the slightly higher-than-average spending on assistance programs such as Medicaid. These structural issues continue to worsen for New York more than thirty years later.
The evidence of the impact of the Federal tax bill on high income tax earners enacted in 2017 can be seen in analysis for 2018 and 2019. In 2020, the Federal government responded to the COVID-19 pandemic and economic fallout by allocating trillions in relief to individuals, businesses, state and local governments, and medical providers. The impact of these fiscal policies and the COVID-19 pandemic will have a significant impact on New York’s balance of payments standing for years to come. This makes the 2019 balance of payments analysis an important benchmark as we monitor the long-term fiscal impacts of these policies and events.

28
Objectives, Scope, and MethodologyThis report addresses questions of how Federal revenue and spending are distributed across states and selected other geographies. The analysis is intended to understand how much individual states, through their residents, employers, and private business contributed to the Federal budget through the payment of Federal taxes and other receipts, and how much individuals, governments, and other actors in state economies receive in Federal spending. A state’s “balance of payments” is Federal spending in a state minus revenue paid to the Federal government. A negative balance means that a state’s residents and economy pay more than they receive.
Overview
A state’s balance of payments is based on Federal receipts and expenditures that are allocated to individual states in a two-step process.
1. Federal receipts and expenditures from the Federal budget are broken down into major categories and subcategories that sum to the Federal budget totals.
2. Amounts are allocated to states and other geographic areas using data on where receipts were actually raised and where expenditures were actually spent. When actual data on the distribution of receipts and expenditures are not available, best available proxies are identified.
The approach ensures that the sum of the amounts allocated to the individual states and other geographic areas, plus a small amount of unallocable receipts or expenditures, equals the Federal budget totals. As a result, all numbers allocated to states are consistent with the Federal budget.
Geographic Scope
The primary focus of this analysis is the 50 states. Adjustments are made to account for receipts and expenditures that occur in the District of Columbia, Puerto Rico, US Territories, and other areas outside of the focus area. Where we had specific data for Puerto Rico and other territories, we used it to allocate a share of Federal spending and receipts to these areas. In cases where data were only available for the 50 states and the District of Columbia, but where we considered it highly likely that a specific revenue source or expenditure category was attributable to such an area, we allocated using the area’s proportionate share of the total population.
Estimates for these other areas are not the focus of our analysis and are not published. The removal of receipts and expenditures from these geographies is the reason the Federal budget data presented in this document do not exactly match the US Federal Budget numbers.

29
Step 1: Categorizing the Federal Budget
The primary data source for nationwide Federal spending and receipts is the Budget of the U.S. Government, Fiscal Year 2021. The document, published in February 2019, provides the most current data on US spending including final spending amounts for Federal fiscal years 2017, 2018, and 2019. The data used in this analysis is taken from the Analytical Perspectives volume and the Federal budget database that accompanies the Federal budget.4
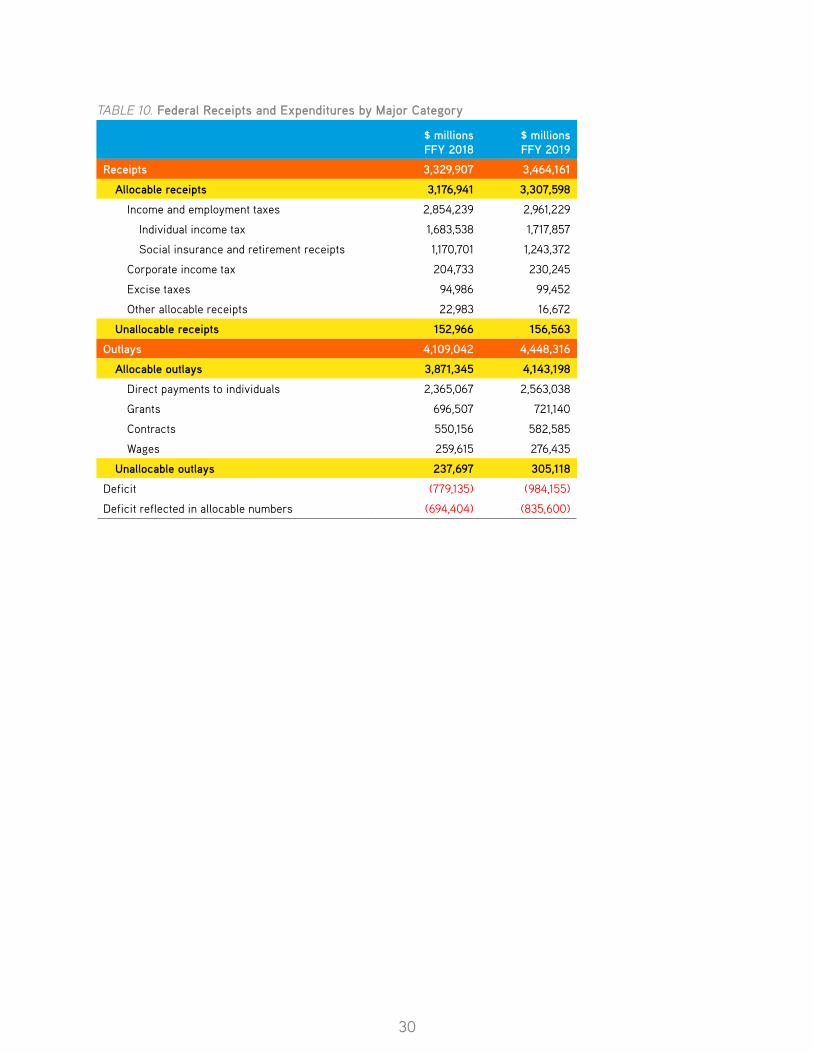
In Federal fiscal year 2019, the Federal government had receipts of $3.46 trillion and expenditures of $4.45 trillion, creating a deficit of $984 billion. Using categories generally used in the Federal budget, Federal receipts were broken down to the major categories displayed in Table 10. The categories were disaggregated further as discussed below. The tables show the preliminary amounts for FFY 2019, which is the primary year of analysis for this report. We also include revised numbers from FFY 2018 as a point of comparison.
◊ Personal income tax.◊ Employment taxes, such as
Social Security and Medicare.◊ Corporate income tax.◊ Excise taxes, such as those
on motor fuel, tobacco, and alcohol and other taxes, consisting primarily of estate and gift taxes.
Receipts:
Categories of the Federal Budget
Expenditures:◊ Direct payments for individuals,
such as Social Security and Medicare.
◊ Grants such as Medicaid and grants from the Federal Highway Trust Fund.
◊ Contractual and procurement spending.
◊ Wages and salaries of Federal workers.
30
TABLE 10. Federal Receipts and Expenditures by Major Category
$ millions FFY 2018
$ millions FFY 2019
Receipts 3,329,907 3,464,161
Allocable receipts 3,176,941 3,307,598
Income and employment taxes 2,854,239 2,961,229
Individual income tax 1,683,538 1,717,857
Social insurance and retirement receipts 1,170,701 1,243,372
Corporate income tax 204,733 230,245
Excise taxes 94,986 99,452
Other allocable receipts 22,983 16,672
Unallocable receipts 152,966 156,563
Outlays 4,109,042 4,448,316
Allocable outlays 3,871,345 4,143,198
Direct payments to individuals 2,365,067 2,563,038
Grants 696,507 721,140
Contracts 550,156 582,585
Wages 259,615 276,435
Unallocable outlays 237,697 305,118
Deficit (779,135) (984,155)
Deficit reflected in allocable numbers (694,404) (835,600)

31
Receipts Details
Table 11 and Table 12 show a breakdown of Federal receipts by major category and subcategory. The data came from the “Historical Tables” published as part of the Analytical Perspectives volume of the Federal budget for fiscal year 2021. The source table for each receipt is provided. A “calculated” indicates the value has been calculated based on other numbers in the table.
TABLE 11. Detailed Break Down of Federal Receipts$ millions FFY 2018
$ millions FFY 2019 Source
Receipts 3,329,907 3,464,161 calculated
Income and employment taxes 2,854,239 2,961,229 calculated
Individual income tax 1,683,538 1,717,857 hist2.1
Social insurance and retirement receipts 1,170,701 1,243,372 hist2.1
Employment and general retirement 1,121,155 1,197,393 hist2.4
Old-age, survivors insurance, and disability insurance
854,747 914,303 calculated
Old-age and survivors insurance (Off-Budget)
691,215 770,282 hist2.4
Disability insurance (Off-Budget) 163,532 144,021 hist2.4
Hospital insurance 260,659 277,572 hist2.4
Railroad retirement (summed) 5,749 5,518 hist2.4
Unemployment insurance (Trust Funds) 45,042 41,193 hist2.4
Other retirement (federal employees and non-federal employees)
4,473 4,757 hist2.4
Corporate income tax 204,733 230,245 hist2.1
Excise taxes 94,986 99,452 hist2.1
Transportation (trust fund) 42,613 44,111 hist2.4
Tobacco 12,861 12,457 hist2.4
Airport and airway 15,793 15,976 hist2.4
Health insurance providers 4,681 9,590 hist2.4
Alcohol 10,057 9,992 hist2.4
Other excises 8,981 7,326 calculated
Other allocable receipts 22,983 16,672 calculated
Estate and gift taxes 22,983 16,672 hist2.5
Unallocable receipts 152,966 156,563 hist2.5
Customs duties and fees 41,299 70,784 hist2.5
Federal Reserve deposits 70,750 52,793 hist2.5
All other miscellaneous receipts 40,917 32,986 hist2.5

32
The bulk of Federal receipts were generated from individual income and employment taxes. Tax expenditures that are embedded in the overall tax system, such as the mortgage interest deduction, are part of the overall tax that is allocated to the states.
A subset of receipts categories were classified as unallocable. These are monies received by the Federal government that cannot be attributed to a specific state. Unallocable Federal receipts include deposits of earnings by the Federal Reserve System (earnings beyond those needed to fund operations and other requirements) and customs payment. These represented 4.5 percent of the total receipts collected in FFY 2019. This is a standard practice in the calculation of balance of payments.
Overview of Expenditures
Expenditures were broken down into four large categories: direct payments to individuals, grants, contracts, and wages. Again, a subset of expenditure categories were also classified as unallocable, representing 6.9 percent of total expenditures in FFY 2019. Expenditures that could not be allocated to individual states include spending on international assistance programs and interest on Federal debt.
Direct payments include social security payments, retirement, education, housing, food, and other public assistance programs. Tax expenditures are treated as expenditures when they are specifically enumerated in the Federal budget. Under this treatment, some tax credits are considered direct payments. These credits include the refundable Earned Income Tax Credits and the refundable Child Tax Credit.
TABLE 12. Unallocable Federal Receipts
$ millions FFY 2018
$ millions FFY 2019 Source
Unallocable receipts 163,526 152,963 calculated
Customs duties and fees 41,299 70,784 hist2.5
Federal Reserve deposits 70,750 52,793 hist2.5
All other miscellaneous receipts 40,917 32,986 hist2.5

33
TABLE 13. Detailed Break Down of Federal Direct Payments Outlays
$ millions FFY 2018
$ millions FFY 2019 Source
Direct payments for individuals 2,365,067 2,563,038 hist11.3
Social security and railroad retirement 991,204 1,047,957 hist11.3
Social security: old age and survivors insurance 837,611 892,904 hist11.3
Social security: disability insurance 143,855 145,062 hist11.3
Railroad retirement (excl. social security) 9,738 9,991 hist11.3
Federal employees retirement and insurance 223,959 249,071 hist11.3
Civil service retirement 85,854 88,760 hist11.3
Veterans service-connected compensation 54,476 60,703 hist11.3
Military retirement 79,986 95,599 hist11.3
Other 3,643 4,009 hist11.3
Unemployment assistance 28,490 27,442 hist11.3
Medical care 844,381 925,233 hist11.3
Medicare: SMI plus HI 692,193 762,730 calculated
Medicare: supplementary medical insurance 400,054 444,297 hist11.3
Medicare: hospital insurance 292,139 318,433 hist11.3
Hospital and medical care for veterans 70,884 77,660 hist11.3
Refundable Premium Tax Credit and Cost Sharing Reductions 41,171 43,285 hist11.3
Uniformed Services retiree health care fund (TRICARE) 10,066 10,457 hist11.3
Medical care—other 30,067 31,101 calculated
Assistance to students 60,902 84,539 hist11.3
Student assistance—Department of Education and other 48,199 71,106 hist11.3
Veterans education benefits 12,703 13,433 hist11.3
Housing assistance 17,370 17,145 hist11.3
Food and nutrition assistance: 61,089 56,438 hist11.3
SNAP (formerly Food stamps) (including Puerto Rico) 61,008 56,366 hist11.3
Food and nutrition assistance—other 81 72 calculated
Public assistance and related programs: 130,628 146,836 hist11.3
Earned income tax credit 58,640 59,209 hist11.3
Supplemental security income program 47,889 53,107 hist11.3
Payment where child credit exceeds tax liability 18,597 28,898 hist11.3
Public assistance—other 5,502 5,622 calculated
All other payments for individuals: 7,044 8,377 hist11.3

34
Step 2: Allocating the Federal Budget to States and Other Geographic Areas
Federal receipts and spending are allocated to individual states using a broad array of data sources. When available, data that directly indicate where Federal receipts originated or where Federal expenditures occurred were used. Federal agency data were considered ideal and were used when available.
Receipts Allocations
Table 14 summarizes the data used to allocate Federal receipts. It also indicates the availability of the data for each year of analysis.
Individual Income Tax
Income tax receipts were allocated using income tax liability from the Statistics of Income branch of the Internal Revenue Service, for the latest tax liability year available, 2018. Final Statistics of Income data are compiled only after all extensions have expired and all returns are collected. Data were collected from “Table 2. Individual Income and Tax Data by State and Size of Adjusted Gross Income, Tax Year 2018.”5 For total liability, the following variables are summed:
TABLE 14. Federal Receipts Allocators
Source 2018 2019
Individual income tax IRS Statistics on Income YN—Sub 2018
Old-age, survivors insurance, and disability insurance
Social Security Administration OASDI Contributions
N—Sub 2017
N—Sub 2017
Hospital insuranceSocial Security Administration Hospital Insurance Contributions
N—Sub 2017
N—Sub 2017
Railroad retirement IRS Gross Collections, Table 5 Y Y
Unemployment insurance (trust funds)US DOL Unemployment Insurance Financial Transaction Summary
Y Y
Other retirement Census Population Y Y
Corporate income taxBEA Weighted average of capital and wages
Y Y
Transportation (trust fund)FHWA payments into the FHTF Highway Account
Y Y
Tobacco Census Population Y Y
Airport and airway Census Population Y Y
Health insurance providers Oliver Wyman Analysis YN—Sub 2018
Alcohol NIAA alcohol consumption Y N—Sub 2018
Other excises Census Population Y Y
Estate and Gift Taxes IRS Gross Collections, Table 5 Y Y

35
• A06500 Income tax amount;
• A85530 Additional Medicare tax; and
• A85300 Net investment income tax.
This is total income tax liability, excluding the Federal Insurance Contributions Act and the Self-Employment Contributions Act (SECA) employment taxes, which are accounted for elsewhere. The state shares from 2018 were applied for the 2018 and 2019 analysis.
Social Insurance and Retirement
Old-age, survivors insurance, and disability insurance receipts and hospital Insurance were allocated using Table 2 and Table 4, respectively, from the Social Security Administration: “Earnings and Employment Data for Workers Covered Under Social Security and Medicare, by State and County, 2017.”6 Data for 2017 were the most recent information available and they were applied for all years of analysis.
Railroad retirement tax was taken from the “Statistics of Income Gross Collections” data. The data have been published for 2019.7
Unemployment Insurance
Unemployment insurance receipts were allocated using data from the “Statistics of Income Gross Collections.”
Other Retirement
The “other retirement” category was allocated according to the population data from the US Census Bureau.
Corporate Income Tax
Corporate income tax was allocated based on the assumption that 75 percent of the burden falls on the owner of capital and 25 percent falls on wage earners. These numbers were calculated based on the US Bureau of Economic Analysis (BEA) State and Personal Income dataset. Sensitivity analysis using alternative plausible assumptions did not have a significant impact on conclusions for New York.
Excise Taxes
Receipts for transportation trust fund receipts, primarily gasoline excise taxes, were allocated based on information published by the Federal Highway Administration (FHWA), “Federal Highway Trust Fund Receipts Attributable to Highway Users in Each State.”8
Receipts for the health insurance provider excise tax were allocated using an August 2018 study by the consulting firm Oliver Wyman, Analysis of the Impacts of the ACA’s Tax on Health Insurance in 2018 and Beyond.9 The study forecasted the 2018 tax burden by state. The same values were used for 2019.
Alcohol beverage excise taxes were allocated based on analysis of consumption data from the National Institute on Alcohol Abuse and Alcoholism (NIAAA).

36
Other excise taxes, including tobacco taxes, airport and airway taxes, and a small amount of miscellaneous excise taxes, were allocated to states in proportion to the population.
Expenditure Allocations
Direct Payments
Allocators for direct programs were developed using agency data when available. When they were not, reliable third-party proxies were identified. Table 15 shows how each direct payment program was allocated to the states and the availability of data for FFYs 2018 and 2019.
Table 15. Federal Direct Payments Allocators
Source 2018 2019
Social Security and Retirement
SSA Old age and survivors insurance USASpending.gov Y Y
SSA: Disability insurance USASpending.gov Y Y
Railroad retirement BEA State Personal Income Y Y
Civil service retirement Office of Personnel Management N—Sub 2019 Y
Military retirement Statistical Report on Military Retirement Y Y
Unemployment assistance
Unemployment AssistanceUS DOL Unemployment Insurance Financial Transaction Summary
Y Y
Medical Care
Medicare: SMI plus HI BEA State Personal Income Y Y
Hospital and medical care for veteransGeographic Description of Department of Veterans Affairs Expenditures
Y Y
Refundable premium tax credit and cost sharing reductions
CMS Effectuated Enrollment data Y Y
Uniformed services retiree health care fund (TRICARE)
TRICARE Beneficiaries by location Y Y
Medical care—other Census Population Y Y
Assistance to Students
Department of Education BEA State Personal Income Y Y
Veterans education benefitsGeographic Description of Department of Veterans Affairs Expenditures
Y Y
Housing Assistance
Housing assistance Center on Budget and Policy Priorities Y Y
Food and Nutrition Assistance
Food and nutrition assistance Federal Funds Information for States Y Y
Public Assistance and Related Programs
Earned income tax credit IRS Statistics on Income Y N—Sub 2018
Supplemental security income program SSA Annual Statistical Supplement, Table 7B Y Y
Payment where child credit exceeds tax liability
IRS Statistics on Income Y N—Sub 2018

37
Social Security and Railroad Retirement
Social Security old-age and survivors insurance and disability insurance were allocated to states in accordance with the corresponding direct payment amounts included on USASpending.gov. Railroad Retirement and disability benefits were allocated to states in proportion to the corresponding component of personal income from the Bureau of Economic Analysis (Table SA35, Line 2121).
Federal Employees Retirement and Insurance
Civil service retirement expenditures were allocated to states using the table titled “Exhibit R14: Fiscal Year 2019 Annuitants on the Retirement Roll” from the Statistical Abstracts Fiscal Year 2019, Federal Employee Benefit Programs, published by the Office of Personnel Management.
Veterans’ service-connected compensation was allocated to states using Compensation and Pension data from the “General Description of Geographic Distribution of the Department of Veterans Affairs Expenditures (GDX)” published by the US Department of Veterans Affairs, Office of Policy, Planning and Preparedness, for FFYs 2017, 2018, and 2019.10
Military retirement state shares were estimated using (1) number of retired and (2) monthly payment information collected from Statistical Report on the Military Retirement System—Fiscal Year Ended September 30, 2019 published by Department of Defense, Office of the Actuary. August 2020. Data were also collected from the corresponding FFY 2017 and 2018 reports.11
State shares of other Federal employees’ retirement expenditures were allocated using the US Census Bureau population share.
Unemployment Assistance
Key data files and links:12
• ar2112.csv;
• ETHand401_4th_s02.pdf—documentation, describes data; and
• 4024c6ar2112.pdf—maps variable names to data elements.
The Department of Labor publishes monthly data on net unemployment insurance benefits (variable c54, Line 31). The value is the total of regular unemployment benefits paid to claimants. The total paid is then reduced by any refunds received from claimants and administrative banking costs incurred. Monthly data are summed to get calculate annual fiscal year spending.
Medical Care
Medicare supplementary medical insurance (SMI) plus hospital insurance (HI) was allocated using Medicare benefits data from BEA Table SA35, Line 2210. Allocations for Puerto Rico and “Unallocated” were estimated using population share.
Hospital and Medical Care for Veterans state shares were allocated using Medical care data from the general description of “General Description of Geographic Distribution of the Department of Veterans Affairs Expenditures (GDX)” published by the US

38
Department of Veterans Affairs, Office of Policy, Planning and Preparedness, for FFYs 2017, 2018, and 2019.13
The ACA refundable Premium Tax Credits used allocators based on enrollment data published in Tables 3 and 4 in the Early 2020 Effectuated Enrollment Snapshot report published by the Centers for Medicaid and Medicare Services (CMS). The source was used to create a weighted state-by-state distribution that was then used to allocate the total in the Federal budget.
The Uniformed Services Retiree Health Care Fund, also known as the US Department of Defense Medicare-Eligible Retiree Health Care Fund or “TRICARE for Life” was allocated using the number of TRICARE beneficiaries by state.14 Even though this total includes other TRICARE programs, it is a more appropriate source than the overall Census populations.
Other medical care expenditures were small and we did not find specific information for allocation. As a result, we allocated this amount using state population data from the US Census Bureau.
Assistance to Students
State shares for Department of Education expenditures were allocated using “Education and training assistance” from BEA Table SA35. Allocations for Puerto Rico and “Unallocated” were estimated using population share.
State shares for Veterans Education Benefits were allocated using education and vocational rehabilitation/employment data from the “General Description of Geographic Distribution of the Department of Veterans Affairs Expenditures (GDX).”15
Housing Assistance
We allocated housing assistance expenditures based on data on Section 8 vouchers provided in the President’s Budget. Table 14-31. Section 8 Choice Vouchers (14.871) presented spending by state for FY 2019.16 Corresponding tables were downloaded for FY 2017 and 2018.
Food and Nutrition Assistance
Food and nutrition assistance was allocated to states using Federal Funds Information for States (FFIS) grant data for CFDA code 10.551, the Supplemental Nutrition Assistance Program.
Public Assistance and Related Programs
The earned income tax credit was allocated using data from line item A59720 in the “SOI Tax Stats” provided by the Statistics of Income branch of the Internal Revenue Service, 2017.17 The refundable childcare credits were allocated from the same data set using line item A07220.
Supplemental Security Income Program expenditures were allocated using Federal SSI data from “Table 7.B7—Total Federally administered payments by state and other area, 2016.”18
State shares for all other payments for individuals were allocated using population.

39
Grants
Federal grant expenditures were broken down into detailed categories based on categorizations of grants in the public Federal budget database that accompanies the Federal budget. See Table 16 (“fedbud.db” indicates that we summarized data from the Federal budget database.)
TABLE 16. Detailed Breakdown of Federal Grants Outlays$ millions FFY 2018
$ millions FFY 2019 Source
Grants 696,507 721,140 calculated
HHS_Centers for Medicare and Medicaid Services_Grants to States for Medicaid_Health care services
389,157 409,421 fedbud.db
DOT_Federal Highway Administration_Federal-aid Highways_Ground transportation
43,305 43,768 fedbud.db
USDA_Food and Nutrition Service_Child Nutrition Programs_Food and nutrition assistance
22,803 23,247 fedbud.db
HUD_Public and Indian Housing Programs_Tenant Based Rental Assistance_Housing assistance
21,384 22,208 fedbud.db
HHS_Administration for Children and Families_Temporary Assistance for Needy Families_Other income security
16,414 15,493 fedbud.db
ED_Office of Elementary and Secondary Education_Education for the Disadvantaged_Elementary, secondary, and vocational education
15,277 16,203 fedbud.db
ED_Office of Special Education and Rehabilitative Services_Special Education_Elementary, secondary, and vocational education
12,753 12,978 fedbud.db
HHS_Administration for Children and Families_Children and Families Services Programs_Social services
10,651 11,240 fedbud.db
HHS_Centers for Medicare and Medicaid Services_Children’s Health Insurance Fund_Health care services
17,282 17,689 fedbud.db
DOT_Federal Transit Administration_Transit Formula Grants_Ground transportation
10,082 10,500 fedbud.db
HHS_other 7,008 6,296 fedbud.db
HHS_Administration for Children and Families_Payments for Foster Care and Permanency_Other income security
8,581 8,599 fedbud.db
HUD_Community Planning and Development_Community Development Fund_Community development
5,889 5,178 fedbud.db
USDA_Food and Nutrition Service_Special Supplemental Nutrition Program for Women, Infants, and Children (WIC)_Food and nutrition assistance
5,432 5,314 fedbud.db
HUD_other 5,467 5,808 fedbud.db
ED_other 4,614 4,964 fedbud.db
USDA_Food and Nutrition Service_Supplemental Nutrition Assistance Program_Food and nutrition assistance
7,485 7,100 fedbud.db
DOI_other 4,931 5,565 fedbud.db
HUD_Public and Indian Housing Programs_Public Housing Operating Fund_Housing assistance
4,382 4,458 fedbud.db
DOT_other 8,224 7,936 fedbud.db

40
TABLE 16. Detailed Breakdown of Federal Grants Outlays, continued$ millions FFY 2018
$ millions FFY 2019 Source
Grants 696,507 721,140 calculated
EPA_Environmental Protection Agency_State and Tribal Assistance Grants_Pollution control and abatement
3,566 3,826 fedbud.db
ED_Office of Elementary and Secondary Education_School Improvement Programs_Elementary, secondary, and vocational education
4,060 4,616 fedbud.db
HHS_Administration for Children and Families_Payments to States for Child Support Enforcement and Family Support Programs_Other income security
4,137 4,117 fedbud.db
USDA_other 2,123 2,599 fedbud.db
other.agency_other 8,083 9,144 fedbud.db
HHS_Administration for Children and Families_Low Income Home Energy Assistance_Other income security
3,425 3,695 fedbud.db
ED_Office of Special Education and Rehabilitative Services_Rehabilitation Services_Social services
3,093 3,119 fedbud.db
DOT_Federal Aviation Administration_Grants-in-aid for Airports (Airport and Airway Trust Fund)_Air transportation
3,036 3,303 fedbud.db
DHS_Federal Emergency Management Agency_Disaster Relief Fund_Disaster relief and insurance
9,715 6,735 fedbud.db
DHS_Federal Emergency Management Agency_State and Local Programs_Disaster relief and insurance
1,704 903 fedbud.db
HHS_Administration for Children and Families_Child Care Entitlement to States_Other income security
2,358 3,244 fedbud.db
HHS_Substance Abuse and Mental Health Services Administration_Substance Abuse and Mental Health Services Administration_Health care services
3,258 3,679 fedbud.db
DOL_Employment and Training Administration_Training and Employment Services_Training and employment
2,724 2,684 fedbud.db
HHS_Health Resources and Services Administration_Health Resources and Services_Health care services
2,821 3,009 fedbud.db
DOJ_other 1,871 2,317 fedbud.db
HHS_Administration for Children and Families_Payments to States for the Child Care and Development Block Grant_Other income security
3,526 3,906 fedbud.db
VA_other 2,061 2,050 fedbud.db
DOL_other 1,413 1,232 fedbud.db
FCC_Federal Communications Commission_Universal Service Fund_Other advancement of commerce
1,840 2,113 fedbud.db
HHS_Administration for Community Living_Aging and Disability Services Programs_Social services
1,812 1,917 fedbud.db
DOL_Employment and Training Administration_Unemployment Trust Fund_Unemployment compensation
2,951 3,038 fedbud.db
ED_Office of Innovation and Improvement_Innovation and Improvement_Elementary, secondary, and vocational education
1,044 857 fedbud.db
DOT_Federal Railroad Administration_Capital Assistance for High Speed Rail Corridors and Intercity Passenger Rail Service_Ground transportation
73 26 fedbud.db

41
TABLE 16. Detailed Breakdown of Federal Grants Outlays, continued
$ millions FFY 2018
$ millions FFY 2019 Source
Grants 696,507 721,140 calculated
DOJ_Office of Justice Programs_Crime Victims Fund_Criminal justice assistance
1,844 2,300 fedbud.db
DHS_other 2,552 2,469 fedbud.db
EPA_other 296 277 fedbud.db
Medicaid
Medicaid was allocated to the states based on the Federal share of total Medicaid expenditures reported by the states on Centers for Medicare & Medicaid Services Form 64, which reflects all state expenditures. State expenditures were calculated by summing programmatic expenditures, known as “total computable” spending, and administrative reimbursement. Data were available for FFY 2018 and allocators were applied for 2019 as well.
Federal Highway Grants
Federal highway grants were allocated using data from the Federal Funds Information for States (FFIS) for the National Highway Performance Program CFDA 20.205. FFIS data were available for FFYs 2018 and 2019.
Other Grants
Most other grants were allocated based on the most-closely corresponding FFIS grant. Where no single grant appeared to correspond closely, they were allocated based on the average allocation of grants for the Federal agency as a whole.
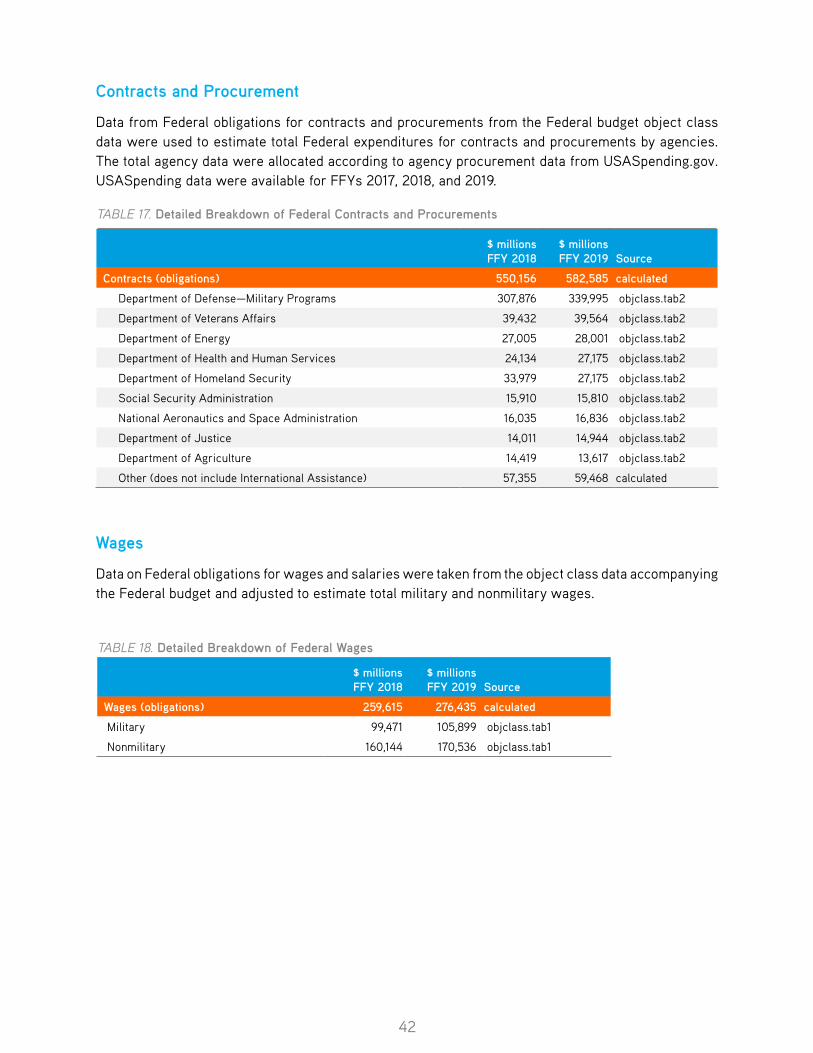
42
Contracts and Procurement
Data from Federal obligations for contracts and procurements from the Federal budget object class data were used to estimate total Federal expenditures for contracts and procurements by agencies. The total agency data were allocated according to agency procurement data from USASpending.gov. USASpending data were available for FFYs 2017, 2018, and 2019.
Wages
Data on Federal obligations for wages and salaries were taken from the object class data accompanying the Federal budget and adjusted to estimate total military and nonmilitary wages.
TABLE 17. Detailed Breakdown of Federal Contracts and Procurements
$ millions FFY 2018
$ millions FFY 2019 Source
Contracts (obligations) 550,156 582,585 calculated
Department of Defense—Military Programs 307,876 339,995 objclass.tab2
Department of Veterans Affairs 39,432 39,564 objclass.tab2
Department of Energy 27,005 28,001 objclass.tab2
Department of Health and Human Services 24,134 27,175 objclass.tab2
Department of Homeland Security 33,979 27,175 objclass.tab2
Social Security Administration 15,910 15,810 objclass.tab2
National Aeronautics and Space Administration 16,035 16,836 objclass.tab2
Department of Justice 14,011 14,944 objclass.tab2
Department of Agriculture 14,419 13,617 objclass.tab2
Other (does not include International Assistance) 57,355 59,468 calculated
TABLE 18. Detailed Breakdown of Federal Wages
$ millions FFY 2018
$ millions FFY 2019 Source
Wages (obligations) 259,615 276,435 calculated
Military 99,471 105,899 objclass.tab1
Nonmilitary 160,144 170,536 objclass.tab1

43
Military Wages
Military wages were allocated to states based on each state’s share of military wages as reported by the US Bureau of Economic Analysis Table SA7N. The share of Puerto Rico was estimated based on its population reported by the US Census Bureau. These data were available for all years of analysis.
Civilian Wages
Civilian wages in the Federal budget exclude wages of the US Postal Service. These wages were allocated to states based upon data from the non-seasonal full-time personnel in data files obtained directly from the Office of Personnel. Data were available for FFYs 2018 and 2019.
Unallocable Expenditures
A subset of expenditures categories were classified as unallocable. These are monies spent by the Federal government that cannot be attributed to a specific state. Unallocable Federal expenditures include net interest outlays and payments for international assistance programs. These represented 5.6 percent of the total expenditures collected in FFY 2018. This is a standard practice in the calculation of balance of payments.
Revisions to Estimates
The calculation of the balance of payments relies on data from over a dozen agencies and third-party suppliers. Each data set has a unique release and revision cycle. Ideally, the calculation would use final data from each of the sources, but these are not always available. Despite limitations in the availability of some source data, the Rockefeller Institute of Government and New York State Division of the Budget believe there is value in generating estimates in a timely manner even if these calculations are based on preliminary data or reasonable estimates.
TABLE 19. Unallocable Federal Outlays
$ millions FFY 2018
$ millions FFY 2019 Source
Unallocable expenditures 237,697 305,118 calculated
Net interest outlays 324,975 375,158 hist3.1
International assistance programs 58,550 57,153 objclass.tab2
Undistributed offsetting receipts (97,869) (98,192) hist3.1
Unexplained (s/b obligations/outlays difference) (47,959) (29,001) calc

44
Changes in Allocators
Tables 14 and 15 presented the allocators used and their availability for each of the Federal fiscal years studied. For datasets in which there were no data available, the values from the next closest year was used. This report utilizes the most recent IRS Statistics of Income FFY 2018, which was released in August 2020. The FFYs 2018 and 2019 balance of payments are estimated based on the distribution of individual income tax across the states in FFY 2018.
In addition to the potential lag in allocator data, many of the data sources revise their data on a regular basis. For example, the US Census Bureau publishes state population for all of the FFYs studied. But the data are updated annually and state population data will not be complete until the 2020 Census has been conducted. These revisions are generally relatively minor. These minor revisions will affect the numbers calculated year-after-year.
The following labelling convention has been developed to address revisions of calculations annually.
Preliminary estimates—Preliminary estimates are those values calculated for the immediately preceding FFY. In this report, Preliminary FFY 2019 estimates are presented. In this and future reports, preliminary estimates are calculated with final Federal budget data. Nine out of fourteen receipts allocators will be specific to the study year. Fifteen out of twenty-two of the expenditures allocators will be specific to the year.
Revised estimates—Revised estimates are updates to preliminary estimates calculated in the previous year. In this report, Revised FFY 2018 estimates are presented. These estimates integrated more recent data from the IRS, CMS and the Social Security Administration.

45
ENDNOTES

46
1 In 2018, 52.7 percent of New York’s Federal income tax liability came from individuals with an income of $500,000 or greater as compared with 40.2 percent for the same income categories nationwide.
2 Because the Federal government spent more than it raised, Federal spending in the average state was greater than Federal receipts.
3 The Budgetary Effects of Laws Enacted in Response to the 2020 Coronavirus Pandemic, March and April 2020 (Washington, DC: US Congressional Budget Office, June 2020), https://www.cbo.gov/system/files/2020-06/56403-CBO-covid-legislation.pdf.
4 See A Budget for America’s Future, Fiscal Year 2021 Budget of the U.S. Government (Washington, DC: US Government Publishing Office, February 10, 2020), https://www.govinfo.gov/features/budget-fy2021 for links to all Federal Budget documents.
5 Downloaded from https://www.irs.gov/pub/irs-soi/18in55cm.xlsx.
6 Downloaded from https://www.ssa.gov/policy/docs/statcomps/eedata_sc/2017/index.html.
7 Downloaded from: https://www.irs.gov/statistics/soi-tax-stats-gross-collections-by-type-of-tax-and-state-irs-data-book-table-5.
8 Downloaded from: https://www.fhwa.dot.gov/policyinformation/statistics/2018/.
9 Chris Carlson, Glenn Giese, and Steven Armstrong, Analysis of the Impacts of the ACA’s Tax on Health Insurance in 2020 and Later (Milwaukee: Oliver Wyman, August 28, 2018), https://health.oliverwyman.com/content/dam/oliver-wyman/blog/hls/featured-images/August2017/HIT_Impact_Report_Revised.pdf.
10 Downloaded from https://www.va.gov/vetdata/docs/GDX/GDX_FY19.xlsx.
11 Statistical Report on the Military Retirement System—Fiscal Year 2019 (Washington, DC: US Department of Defense Office of the Actuary, August 2020), https://media.defense.gov/2020/Aug/12/2002475697/-1/-1/0/MRS_STATRPT_2019_FINAL.PDF.
12 “Data Downloads,” US Department of Labor, https://oui.doleta.gov/unemploy/DataDownloads.asp.
13 Downloaded from https://www.va.gov/vetdata/docs/GDX/GDX_FY19.xlsx.
14 “Patient Numbers by State,” US Military Health System, accessed December 30, 2020, https://health.mil/I-Am-A/Media/Media-Center/Patient-Population-Statistics/Patient-Numbers-By-State.
15 Downloaded from https://www.va.gov/vetdata/docs/GDX/GDX_FY19.xlsx.
16 See A Budget for America’s Future, Fiscal Year 2021 Budget of the U.S. Government (Washington, DC: US Government Publishing Office, February 10, 2020), https://www.govinfo.gov/features/budget-fy2021.
17 Downloaded from https://www.irs.gov/pub/irs-soi/18in55cm.xlsx.
18 Annual Statistical Supplement to the Social Security Bulletin, 2016 (Washington, DC: Social Security Administration, May 2017), https://www.ssa.gov/policy/docs/statcomps/supplement/2016/.

47
ABOUT THE ROCKEFELLER INSTITUTE
Created in 1981, the Rockefeller Institute of Government is a public policy think tank providing cutting-edge, evidence-based policy. Our mission is to improve the capacities of communities, state and local governments, and the federal system to work toward genuine solutions to the nation’s problems. Through rigorous, objective, and accessible analysis and outreach, the Institute gives citizens and governments facts and tools relevant to public decisions.
Learn more at www.rockinst.org.

48
LEARN MORE
www.rockinst.org@rockefellerinst