graphical area forecast user guide - bureau of … 29 extract from vt gpwt forecast chart valid at...
TRANSCRIPT
October 2017 | Version 1.2
Graphical Area Forecast User Guide A guide for the transition from ARFORs to GAF

Graphical Area Forecast User Guide
ii
Document Control
Revision history
VERSION DATE DESCRIPTION AUTHOR
1 15 September 2017 Final version Elizabeth Heba
1.1 13 October 2017 Update to provide clarification on AIRMETs and SIGMETs
Elizabeth Heba
1.2 20 October 2017
Update to GAF samples and worked example
Additional text in Area Briefing (NAIPS) Section
Update to abbreviation examples
Ashwin Naidu
Approval for release
DATE NAME Position Signature
20 October 2017 Gordon Jackson National Manager Aviation Meteorological Services
Version number Date of issue Version 1.2
20th
October 2017
© Commonwealth of Australia 2017 This work is copyright. Apart from any use as permitted under the Copyright Act 1968, no part may be reproduced without prior written permission from the Bureau of Meteorology. Requests and inquiries concerning reproduction and rights should be addressed to the Production Manager, Communication Section, Bureau of Meteorology, GPO Box 1289, Melbourne 3001. Information regarding requests for reproduction of material from the Bureau website can be found at www.bom.gov.au/other/copyright.shtml
Graphical Area Forecast User Guide
iii
Table of Contents
1 Purpose .......................................................................................................................................... 1
2 Introduction .................................................................................................................................... 2
3 Key Changes .................................................................................................................................. 5
3.1 Changes to Domain .................................................................................................................................. 5
3.1.1 Area Forecast Boundaries ......................................................................................................................... 5
3.1.2 Area QNH Boundaries ............................................................................................................................... 6
3.2 Changes to Low Level Area Forecast Content ...................................................................................... 7
3.2.1 Validity Periods and Issue Times ............................................................................................................... 7
3.2.2 Overview .................................................................................................................................................... 8
3.2.3 Wind and Temperature Information............................................................................................................ 8
3.2.4 Weather and Visibility ................................................................................................................................. 8
3.2.5 Cloud, Icing and Turbulence ...................................................................................................................... 8
3.2.6 Freezing Level ........................................................................................................................................... 9
3.2.7 Critical Locations ........................................................................................................................................ 9
3.2.8 Weather Features ...................................................................................................................................... 9
3.2.9 Amendments and Corrections .................................................................................................................... 9
3.2.10 Product Output Format ............................................................................................................................... 9
3.2.11 Area Briefing (NAIPS) .............................................................................................................................. 10
4 Graphical Area Forecast Layout ................................................................................................ 11
4.1 Product Layout ....................................................................................................................................... 11
4.2 Header ..................................................................................................................................................... 11
4.3 Image ....................................................................................................................................................... 11
4.4 Table ........................................................................................................................................................ 12
4.5 Legend ..................................................................................................................................................... 12
4.6 Remarks .................................................................................................................................................. 12
5 Graphical Area Forecast Content .............................................................................................. 13
5.1 Times of Issuance and Periods of Validity ........................................................................................... 13
5.2 Image ....................................................................................................................................................... 13
5.3 Meteorological Information Table ......................................................................................................... 14
5.3.1 Column 1: Area ........................................................................................................................................ 15
5.3.2 Column 2: Surface Visibility and Weather ................................................................................................ 15
5.3.3 Column 3: Cloud, Icing and Turbulence ................................................................................................... 16
5.3.4 Column 4: Freezing Level ........................................................................................................................ 18
5.3.5 Use of Sub Areas ..................................................................................................................................... 19
5.4 Critical Locations ................................................................................................................................... 21
5.4.1 Weather Information................................................................................................................................. 21
5.4.2 Visibility Information ................................................................................................................................. 21
5.4.3 Cloud information ..................................................................................................................................... 22

Graphical Area Forecast User Guide
iv
5.4.4 Additional Information .............................................................................................................................. 22
5.5 GAF Worked Example ............................................................................................................................ 22
6 Changes to GAF and Corrected GAF ........................................................................................ 26
6.1 Corrections ............................................................................................................................................. 26
6.2 Corrected GAF Worked Example .......................................................................................................... 27
7 AIRMET ......................................................................................................................................... 29
7.1 Issuance .................................................................................................................................................. 29
7.2 Extension ................................................................................................................................................ 30
7.3 Cancellation ............................................................................................................................................ 30
8 Grid Point Wind and Temperature Forecasts ........................................................................... 32
8.1 Introduction ............................................................................................................................................ 32
8.2 Layout ...................................................................................................................................................... 32
8.3 Domain .................................................................................................................................................... 33
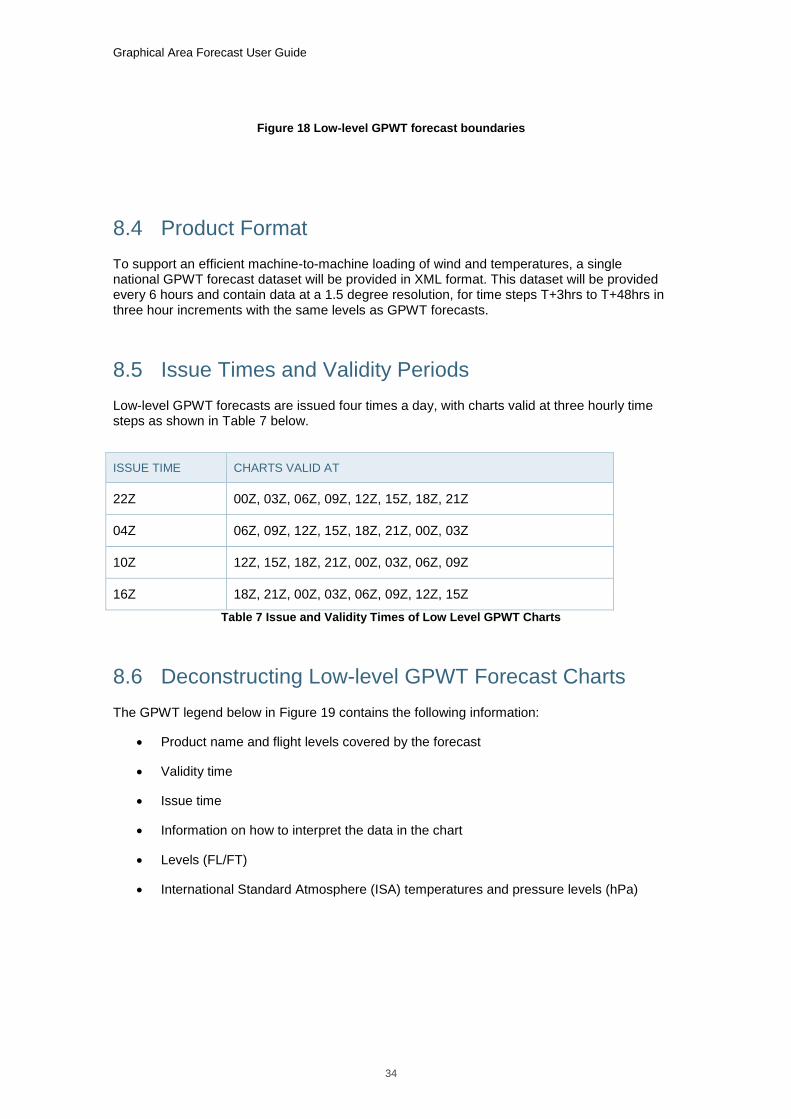
8.4 Product Format ....................................................................................................................................... 34
8.5 Issue Times and Validity Periods .......................................................................................................... 34
8.6 Deconstructing Low-level GPWT Forecast Charts .............................................................................. 34
8.7 Caveats .................................................................................................................................................... 36
APPENDIX A GAF Additional Information .................................................................................... 38
APPENDIX B Approved Abbreviations/Terms ............................................................................. 39
APPENDIX C Approved Symbols .................................................................................................. 46
APPENDIX D GAF Worked Examples ........................................................................................... 47
APPENDIX E Corrected GAF Examples ....................................................................................... 51
APPENDIX F Using GPWT Forecasts ........................................................................................... 53
APPENDIX G Using Two GPWT Forecasts ................................................................................... 55
APPENDIX H Obtaining Freezing Level ........................................................................................ 57

Graphical Area Forecast User Guide
v
List of Tables
Table 1 Comparison of GAF/GPWT and ARFOR .................................................................................................... 7
Table 2 Approved cloud amount abbreviations ..................................................................................................... 17
Table 3 Approved CB and TCU cloud amount abbreviations ................................................................................ 17
Table 4 Critical location information ....................................................................................................................... 21
Table 5 Criteria for GAF correction for an improvement in conditions ................................................................... 27
Table 6 Criteria for issuance of AIRMETs ............................................................................................................. 29
Table 7 Issue and Validity Times of Low Level GPWT Charts .............................................................................. 34
Table 8 Explanation of data box format ................................................................................................................. 35
Table 9 Approved Abbreviations and Terms ......................................................................................................... 45
Table 10 Approved symbols .................................................................................................................................. 46
Table 11 Wind and Temperature data for example flight ....................................................................................... 53
Table 12 Grid Point Wind and Temperature data for example flight from YMLT to YKII ........................................ 56
List of Figures
Figure 1 Current and Future Forecast Products ...................................................................................................... 2
Figure 2 Graphical Area Forecast for Victoria.......................................................................................................... 3
Figure 3 Grid Point Wind Temperature Forecast (VIC/TAS) .................................................................................... 4
Figure 4 Graphical Area Forecast (GAF) boundaries .............................................................................................. 5
Figure 5 Area Forecast (ARFOR) boundaries ......................................................................................................... 5
Figure 6 New Area QNH Boundaries ....................................................................................................................... 6
Figure 7 NAIPS Briefing / Area QNH Boundaries .................................................................................................. 10
Figure 8 Product Layout ........................................................................................................................................ 11
Figure 9 GAF validity and issue times ................................................................................................................... 13
Figure 10 GAF Image ............................................................................................................................................ 14
Figure 11 GAF Meteorological Information Table .................................................................................................. 15
Figure 12 Queensland South GAF ........................................................................................................................ 23
Figure 13 Corrected GAF Header .......................................................................................................................... 27
Figure 14 Victorian GAF with error ........................................................................................................................ 28
Figure 15 CORRECTED Victorian GAF ................................................................................................................ 28
Figure 16 AIRMET cancellation example .............................................................................................................. 31
Figure 17 NSW GPWT forecast ............................................................................................................................. 33
Figure 18 Low-level GPWT forecast boundaries ................................................................................................... 34
Figure 19 Low Level GPWT chart legend .............................................................................................................. 35
Figure 20 Example of grid box from GPWT chart .................................................................................................. 35
Figure 21 GPWT QLD-N example ......................................................................................................................... 37
Figure 22 GAF for Tasmania ................................................................................................................................. 47
Figure 23 GAF for Victoria ..................................................................................................................................... 49
Figure 24 Corrected QLD South GAF .................................................................................................................... 51
Figure 25 Corrected WA North GAF ...................................................................................................................... 51
Figure 26 Corrected NSW East GAF ..................................................................................................................... 52

Graphical Area Forecast User Guide
vi
Figure 27 Corrected TAS GAF .............................................................................................................................. 52
Figure 28 Example Flight ....................................................................................................................................... 53
Figure 29 Extract from VT GPWT forecast chart valid at 0600 UTC ...................................................................... 55
Figure 30 Extract from VT GPWT forecast chart valid at 0900 UTC ...................................................................... 56
Figure 31 WA South GAF ...................................................................................................................................... 57
Figure 32 WA South GPWT forecast chart ............................................................................................................ 58
Figure 33 Subset of WA South GPWT forecast chart grid boxes .......................................................................... 58
Figure 34 Mid-level SIGWX forecast chart ............................................................................................................ 59

Graphical Area Forecast User Guide
1
1 Purpose
This version of the Graphical Area Forecast (GAF) User Guide provides detailed information on
transitional changes from the current text based Area Forecast (ARFOR) to the Graphical Area
Forecast (GAF) and Grid Point Wind and Temperature (GPWT) forecast. It highlights the purpose of
these products and details information on how to interpret them.
This document also highlights the relationship of these products to other related aviation products and
services, including AIRMETs, SIGMETs, AREA QNH, Mid-Level Significant Weather (SIG WX)
forecast charts and Mid-Level GPWT forecast charts.

Graphical Area Forecast User Guide
2
2 Introduction
The Bureau of Meteorology (Bureau) currently produces Area Forecasts (ARFORs) for 28 areas across Australia. These ARFORs are provided in a text format and consist of an overview detailing the general meteorological situation followed by sections giving more detailed forecasts of various meteorological parameters. In response to aviation industry requests for more graphical products and to make practices more compliant with ICAO requirements, the Bureau in consultation with industry progressed work to review the requirements to support the implementation of Graphical Area Forecasts (GAF).
To ensure that industry requirements were met, a working group consisting of representatives from AIPA, Airservices Australia, ASAC, AOPA, CASA, Defence, GFA, HCAPA, Qantas, Qantas Link, RAAA, Rex Airlines, Sharp Airlines, VARA, Virgin Australia, general aviation flight planning application vendors (OzRunways and AvPlan) and the Bureau (Services and Meteorological Authority) have met on various occasions to make decisions on the format and the requirements. In addition to this, the Bureau met separately on a few occasions with the general aviation flight planning application vendors, including Ozrunways, AvPlan, Avsoft, Champagne, Command Software, PocketFMS, Sentient Software and Jeppesen to discuss the proposed changes and the potential impact on their systems and users. The cumbersome and antiquated text based ARFOR will be replaced with a user friendly graphical product that provides the pilot with a weather overview that is considerably easier to interpret and use.
The current ARFOR product will be replaced with two separate new products:
1. Graphical Area Forecasts (GAFs); and
2. Grid Point Wind and Temperature (GPWT) Forecasts.
GAFs will cover the airspace between the surface and 10000 feet above mean sea level (AMSL) (Figure 1), and will provide information on weather, cloud, visibility, icing, turbulence and freezing level in a graphical layout with supporting text (Figure 2). The GAF will not only be quicker and easier to interpret but will also allow greater flexibility when distinguishing between weather boundaries, and utilise automated systems. GPWT forecasts (Figure 3) will include wind speed and direction and temperature forecasts at specified heights AMSL presented in a gridded format. GAFs and GPWT forecasts will be implemented as part of the NAIPS briefing package on 9 November 2017.
Figure 1 Current and Future Forecast Products

Graphical Area Forecast User Guide
3
Figure 2 Graphical Area Forecast for Victoria

Graphical Area Forecast User Guide
4
Figure 3 Grid Point Wind Temperature Forecast (VIC/TAS)

Graphical Area Forecast User Guide
5
3 Key Changes
3.1 Changes to Domain
3.1.1 Area Forecast Boundaries
GAFs will be produced for 10 areas across Australia (Figure 4) compared to 28 areas currently (Figure 5). GAF areas will be named as NSW-E, NSW-W, NT, QLD-N, QLD-S , SA, TAS, VIC, WA-S, WA-N, instead of the area numbering format currently used.
Figure 4 Graphical Area Forecast (GAF) boundaries
Figure 5 Area Forecast (ARFOR) boundaries

Graphical Area Forecast User Guide
6
3.1.2 Area QNH Boundaries
Currently Area QNH areas are the same geographic areas as ARFOR areas. Area QNH areas will remain after the implementation of GAF on 9 November 2017 however the boundaries will be slightly adjusted to align to GAF boundaries as shown in Figure 6.
Figure 6 New Area QNH Boundaries

Graphical Area Forecast User Guide
7
3.2 Changes to Low Level Area Forecast Content
The key changes to the elements of low level area forecasts are detailed in Table 1 below.
Table 1 Comparison of GAF/GPWT and ARFOR
3.2.1 Validity Periods and Issue Times
Currently with ARFORs there are variations in commencement of validity between different states and between those times when daylight savings is or is not operating. However, the following generally applies:
No routine Area Forecast shall exceed 15 hours validity, or be less than 9 hours validity;
An Area Forecast covering daylight hours shall be available as soon as practicable in the morning;
Area Forecasts will be prepared except for those times when the air traffic volume is so low as not to justify routine issues. In these cases a flight forecast will service any individual flights; and
Preparation and issue must be completed sufficiently early to ensure reception at other offices one hour before commencement of validity.
With the introduction of GAF:
Validity times will be standardised across the country with standard validity times as follows:
o 2300Z-0500Z;
o 0500Z-1100Z;
o 1100Z-1700Z; and
o 1700Z-2300Z.
Each GAF product will be of 6 hours validity, with two consecutive products issued at each issuance time, therefore providing a forecast for a 12 hour period; and
Issued typically one hour, but no later than 30 minutes, before the start of the validity period.

Graphical Area Forecast User Guide
8
Refer to section 5.1 for further information on validity and issue times.
3.2.2 Overview
Currently the ARFOR has a written overview section that highlights areas that may inhibit safe operations for pilots and makes reference where necessary to spatial and temporal variations. The overview also refers the reader to any relevant SIGMETs. The aim of the overview is to immediately draw pilots’ attention to the weather critical to their operations.
The GAF will not have a text overview section, instead an image will graphically display weather areas that share common characteristics of weather, visibility, cloud, turbulence, icing and/or freezing level that change in a similar fashion during the period of the forecast. Also displayed on the GAF image will be significant weather features, such as troughs, fronts, low pressure systems and tropical cyclones and, if relevant, their direction and speed of movement.
3.2.3 Wind and Temperature Information
ARFORs include low-level wind and temperature data. Winds are normally given for 2000, 5000, 7000, and 10000 feet AMSL and are written across the page under height headings and with a forward slash between the direction and speed. Northern Territory and Western Australia use 3000 feet winds instead of 2000 feet winds. The temperature at 10000 feet is provided (and for other lower levels in accordance with user requirements) and is given in whole degrees Celsius following the forecast of upper wind for the level concerned. For example; 290/40 PS08, 300/50 ZERO and 300/60 MS10.
The GAF will not include low-level winds and temperature information. However, low-level winds and temperatures will be provided in Grid Point Wind and Temperature (GPWT) forecasts similar to the format currently produced for mid and high-level flights. The low-level GPWT forecast will provide wind and temperature information for vertical levels of 1000, 2000, 5000, 7000, 10000 and 14000 feet and these will be consistent and standardised nationally.
Refer to section 8 for more information on GPWT forecasts.
3.2.4 Weather and Visibility
The ARFOR has separate sections for weather and visibility information. Weather is written in either plain English or using an approved abbreviation. Visibility is in metres in increments of 100 metres up to, and including, 5000 metres (e.g. 0500M) and in whole kilometres, for example; 6KM, above 5000 metres. When visibility is forecast to be above 10 kilometres throughout the area or subdivision of the area, the word UNRESTRICTED is used.
The GAF will show weather and visibility information combined in one column of the meteorological information table. Weather will be written using only approved abbreviations and terms. Visibility will be provided in metres in increments of 100 metres when visibility is forecast to be less than 1000 metres and in increments of 1000 metres when visibility is forecast to be to be more than 1000 metres but less than 10 kilometres. Forecast visibilities of 10 kilometres or more are given as >10KM. There will also be a convention to show the best visibility within an area first, and then, if applicable, all other visibilities will be shown in descending order (refer to Figure 2).
3.2.5 Cloud, Icing and Turbulence
The ARFOR has separate sections for cloud, icing and turbulence information. Cloud is written using approved abbreviations with base and top given in feet. Icing and turbulence information is provided using approved abbreviations and reference to the levels, and if required locations are provided.
The GAF will show cloud, icing and turbulence information combined in one column of the meteorological information table. Cloud information will be displayed using approved abbreviations and terms in a format similar to the ARFOR. Turbulence and icing information will be displayed using approved terms and abbreviations, with little use of plain English.

Graphical Area Forecast User Guide
9
3.2.6 Freezing Level
The current ARFOR has a separate section for the freezing level.
The GAF will show the freezing level in a separate column in the meteorological information table.
3.2.7 Critical Locations
The current ARFOR includes forecast(s) for critical locations. The format of the critical location forecast is a mixture of plain language and TAF format making reference as necessary to visibility, weather and cloud.
The GAF will also include forecast(s) for critical locations. There will, however, be minor changes in the way the information is displayed. The forecast will make reference to the elevation of the location, and will be written in a format similar to TAFs and the remainder of the GAF, using approved terms and abbreviations only. Refer to section 5.4 for more information.
3.2.8 Weather Features
Significant fronts and tropical cyclones are included in the overview of the current ARFOR, and other synoptic features (such as troughs or ridges) may be included where this assists with defining weather areas or wind changes.
In the GAF, significant weather features such as troughs, fronts, low pressure systems and tropical cyclones will be shown on the image.
3.2.9 Amendments and Corrections
ARFORs are amended in accordance with specified criteria.
GAFs will not be amended. Advice of specified deteriorating conditions in a GAF will be in the form of an AIRMET or SIGMET (see section 7).
A “corrected” GAF is, however, issued between standard issue times for the following reasons:
1. typographical error;
2. errors such as transmitting before completion; and
3. improvement in conditions (e.g. removal of fog, TS etc.)
Corrected GAFs will include a brief description highlighting the changes in the Remarks field. Refer to Section 6 for more information.
3.2.10 Product Output Format
An ARFOR is a text product.
GAF products will be produced as low resolution monochrome Portable Network Graphics (PNG) and high resolution colour charts in PNG and Portable Document Format (PDF) formats.
In addition, the weather elements (i.e. the extent of forecast polygon, weather boundary lines, area labels, surface visibility and weather, cloud, icing, turbulence and freezing level) will be made available in Extensible Markup Language (XML) format for efficient ingestion into flight briefing applications and overlay with other information. The XML product will contain:
Polygons for each weather area with associated surface visibility and weather information;
cloud, icing , turbulence and freezing level information within the domain of the forecast area;
Lines for each front (with associated movement and where relevant);
Issue time and validity information; and
Remarks text (including forecasts for critical locations).

Graphical Area Forecast User Guide
10
3.2.11 Area Briefing (NAIPS)
The area briefing package available from Airservices via NAIPS is currently based on Area QNH and ARFOR areas. A review determined that the new GAF areas are too large for area briefing purposes.
Therefore, the GAF Working Group decided that the Area QNH areas will be retained as briefing areas in NAIPS when GAF is implemented. As NAIPS briefings will need to include GAF products, GAF and Area QNH boundaries will be aligned as shown in Figure 7. The briefing areas will be renamed as Area QNH/Briefing Areas in En Route Supplement Australia (ERSA). After GAF implementation, AREA QNH forecasts will still be displayed in the text content of each briefing page, similar to the current practice.
Figure 7 NAIPS Briefing / Area QNH Boundaries
It should be noted that when a NAIPS briefing is returned, the text content of the briefings (Area QNH, TAF, SIGMET, NOTAMs etc.) will appear first in the briefing; the images, including GAF and GPWT images and/or Mid-level SIGWX Charts (where relevant) will follow the text - it will be necessary to scroll down the web page to view these images.
Furthermore, if a pilot requests a briefing for a number of areas, all the images will displayed at the end, following the text messages.

Graphical Area Forecast User Guide
11
4 Graphical Area Forecast Layout
4.1 Product Layout
Figure 8 Product Layout
4.2 Header
The header field contains the title of the product, GAF area name, issue time, validity times (given in UTC time), validity time of any weather features and the Bureau of Meteorology logo. The word “CORRECTED” will also be included if the GAF has been corrected.
4.3 Image
The image is derived from the Airservices Planning Chart Australia (PCA) chart, with the boundary of the GAF area overlayed in black. Note, not all PCA locations can be displayed due to the size of the image. The image shows weather areas that are labelled with an alpha character (such as A, B, etc.), with alphanumeric labels (such as A1 or B1) highlighting a sub area. The green scalloped lines separate the areas and sub areas. Weather features, such as

Graphical Area Forecast User Guide
12
cold fronts, troughs, lows and Tropical Cyclones are displayed with their movement depicted using an arrow and their speed of movement given in knots.
4.4 Table
Meteorological information is provided in a tabular format, and is separated into areas. For each area, the area alpha character is displayed in the first column, surface visibility and weather is displayed in the second column, the third column displays the cloud, icing and turbulence information, and the fourth and final column details the freezing level.
4.5 Legend
The legend specifies the following:
TS/CB/TCU will always imply severe icing and severe turbulence;
CU/SC/AC will always imply moderate turbulence;
cloud above Freezing Level (CLD ABV FZLVL) will always imply moderate icing;
alerts the user to check AIRMETs, SIGMETs and NOTAMs;
highlights that critical locations on the map are marked by a different colour dot;
speed of movement of weather features, such as fronts, troughs and low pressure systems, are in knots.
the solid black line on the graphic denotes the limit of the forecast area.
4.6 Remarks
The remarks field briefly includes additional information of operational relevance, including forecasts for critical locations (NSW-E and VIC GAFs only) and information on any GAF corrections. The phone number of the duty forecaster is also provided. Except for forecasts for critical locations the remarks field is written in plain language and/or approved abbreviations.

Graphical Area Forecast User Guide
13
5 Graphical Area Forecast Content
5.1 Times of Issuance and Periods of Validity
The issue time takes the form “Issued at YYMMDDhhmm”, the validity time is in the form “Valid DDhhmm to DDhhmm” where:
YY = year, e.g. 2017 will be written 17. MM = month, e.g. May will be written 05. DD = Day of the month, e.g. the 8
th will be written 08.
hhmm = Time in hours and minutes, e.g. 0415.
Validity times are consistent for all GAFs nationally. The standard validity times are 2300Z-0500Z, 0500Z-1100Z, 1100Z-1700Z and 1700Z-2300Z. Two GAFs will be issued every 6 hours and have a validity of 6 hours each, (one +00 to +06hr GAF and one +06 to +12hr GAF) thus providing a forecast for a 12 hour period.
GAF products will typically be issued one hour, but no later than 30 minutes, before the start of the validity period of the +00 to +06hr GAF. The issuance of the +00 to +06hr GAF will replace the previously issued +06 to +12hr GAF with the same validity period as the following highlights:
Figure 9 GAF validity and issue times
5.2 Image
The image shows a map of the relevant GAF area, including a subset of PCA locations, with overlayed labelled areas and sub areas of weather boundaries (Figure 10).
The GAF will graphically display areas that share common characteristics of weather, visibility, cloud, turbulence, icing and/or freezing level that change in a similar fashion during the forecast period. Areas are labelled using an alpha character (A, B, C, etc.). While all

Graphical Area Forecast User Guide
14
endeavours are made to make the forecast clear, when forecasting for such a large area, and covering a period of six hours, some recourse to sub areas may also be necessary. An alphanumeric label, such as A1 or B1 (in bold), will be used to identify conditions that are slightly different in a sub area to that of the associated alpha character area. Green scalloped lines separate the areas and/or sub areas.
In addition, the graphic will include any relevant synoptic features, such as troughs, fronts, etc. that are responsible for the weather and, if appropriate, indication of their speed and direction of motion (see Appendix C for a list of approved weather features and symbols). The position of the feature is valid at the start time of the of the validity period. When the feature is not moving, STNR will be used. If a weather feature has not entered the GAF area at the commencement of the validity period it will not be shown on the image.
Figure 10 GAF Image
5.3 Meteorological Information Table
Meteorological information is displayed in a tabular format (Figure 11). The GAF has been designed to provide as detailed a forecast as possible in a concise form that will be readily understood by pilots. This necessarily involves the use of approved terms and abbreviations (refer to section APPENDIX B).
The vertical extent of the GAF is from the surface to 10000 feet AMSL, similar to current ARFOR, however, this is not a ceiling for weather phenomena and therefore 'ABV10000FT' will be used to indicate that the phenomenon extends through, or is above, 10000 feet.
The commencement or ending time of a weather phenomenon, and if applicable associated cloud, may be included and is indicated using FM XXZ or TL XXZ respectively, where XX is the time in UTC or Zulu (Z), for example; TS FM 05Z indicates thunderstorms are forecast from 0500Z.
Within the table, meteorological information is displayed in four columns.
The first column indicates the area labels using an alpha character such as A, B, etc.
The second column includes the surface visibility and weather information. Dotted lines are included to separate each visibility, and corresponding weather (if any), within an area and link them to the cloud, icing and turbulence section.

Graphical Area Forecast User Guide
15
The third column includes the cloud, icing and turbulence information. Dotted lines within an area also allow associated cloud, icing and/or turbulence information to be separated and clearly attributed to each visibility, and corresponding weather (if any).
The Freezing Level is displayed in the fourth column in thousands of feet, for example; 8000 feet is displayed as 8000FT. Where the freezing level is above 10000ft, 'ABV 10000FT' will be written.
Figure 11 GAF Meteorological Information Table
5.3.1 Column 1: Area
This column indicates the area, such as A, B, C etc. Please note that sub areas (eg. A1, B1) will never be referenced in this column.
5.3.2 Column 2: Surface Visibility and Weather
All weather is reported using the approved terms and abbreviations as given in APPENDIX B. It should be noted that thunderstorms will be mentioned regardless of the height of the base of any Cumulonimbus cloud (CB). The term NIL can be used when no weather is expected.

Graphical Area Forecast User Guide
16
The item with the best visibility is listed first with remaining visibilities given in descending order. For each visibility and corresponding weather (if any), the order of this information is as follows:
<visibility>M <amount> <weather>
e.g. 5000M SCT SHRA
3000M ISOL PO
The surface visibility is always included and is given:
in metres in increments of 100M when visibility is forecast to be less than 1000M;
in metres in increments of 1000M when visibility is forecast to be more than 1000M but less than 10 kilometres; and
as >10KM if forecast visibility is 10 kilometres or more.
If additional details regarding the location and timing of the phenomenon are required, then the order of information is as follows:
<visibility> <amount> <weather> <vertical extent>FT <location> <time>Z <change in amount> <timing>Z
e.g. 5000M SCT SHRA E OF YBRK/YAMB FM 03Z
8000M ISOL FU BLW 6000FT
2000M ISOL TS, OCNL FM 03Z
5.3.3 Column 3: Cloud, Icing and Turbulence
Cloud, icing and/or turbulence associated with each surface visibility and weather listed within each area is provided. When turbulence and icing is not associated with weather and/or surface visibility it will be listed last and the corresponding section of the SURFACE VIS AND WX column will be blank.
If no cloud, icing and/or turbulence is expected to affect an area this column can be left blank, or the row(s) that corresponds to the associated visibility and weather column can be left blank.
Cloud information is reported as follows:
<cloud amount> <cloud type> <cloud base/top>FT
e.g. BKN SC 4000/6000FT
BKN CU 8000/ABV10000FT
If additional details regarding the location and timing of the cloud are required the order of information is as follows:
<cloud amount> <cloud type> <cloud base/top>FT> <location> <timing>Z
e.g. BKN ST 1500/3000FT C1 ONLY FM 15Z
The following cloud will always be reported:

Graphical Area Forecast User Guide
17
any cloud with a base at or below 10000 feet above mean sea level (AMSL);
CB and TCU regardless of levels. However, if the cloud base and/or top are above 10000 feet AMSL, ABV10000FT will be used; and
any cloud producing precipitation that affects the atmosphere below 10000 feet AMSL regardless of levels. However, if the clouds base or top are above 10000 feet AMSL, ABV10000FT will be used.
Significant cloud layers are based on the amount at each level, not on the summation amount and are stated using the approved terms and abbreviations in APPENDIX B.
ABBREVIATION DEFINITION
FEW Cloud amount of 1-2 oktas inclusive
SCT Cloud amount of 3-4 oktas inclusive
BKN Cloud amount of 5-7 oktas inclusive
OVC Cloud amount of 8 oktas
Table 2 Approved cloud amount abbreviations
The following qualifiers, regarding convective clouds (CB and TCU) and associated thunderstorms, are used in a GAF according to the following spatial coverage definitions.
QUALIFIER ABBREVIATION DEFINITION
Isolated ISOL An area with a maximum spatial coverage of up to 50%.
Occasional OCNL An area with a maximum spatial coverage greater than 50% but not more than 75%.
Frequent FREQ An area with a maximum spatial coverage greater than 75%.
Table 3 Approved CB and TCU cloud amount abbreviations
Additionally, EMBD (embedded) is added to these abbreviations to indicate CB or TCU clouds that are embedded in layers of other cloud, regardless of whether or not they are protruding from the layer.
The height AMSL of the base and top of cloud is given in thousands of feet. Heights are represented using 4 digits with a leading zero for heights less than 1000 feet, e.g. 4000FT, 0800FT. If the cloud base and/or top is (or are) above 10000 feet, the height will be indicated by ABV10000FT.
Information on Icing (ICE) and Turbulence (TURB) is generally incorporated in the legend section of a GAF as follows:
TS / CB / TCU implies SEV ICE and SEV TURB
CU / SC / AC implies MOD TURB

Graphical Area Forecast User Guide
18
CLD ABV FZLVL implies MOD ICE
However, moderate and/or severe ice accretion and turbulence information outside the situations mentioned in the legend will be mentioned in column three as follows:
<qualifier> <phenomena> <vertical extent>FT <location> <timing>Z BECMG <change in intensity> <timing>Z
e.g. SEV ICE ABV 7000FT N OF YTIB/YBAD; or SEV TURB BLW 8000FT; or MOD TURB BLW 5000FT BECMG SEV FM 07Z
Any occurrence of moderate or severe mountain waves are also included in the third column, using the format defined above and the approved abbreviation of MTW, for example:
MOD MTW ABV 5000FT
If a layer of turbulence and/or icing is forecast the following applies:
if the base of the turbulent layer is occurring below 10000 feet and the vertical extent is expected to extend above 10000 feet, descriptions such as ABV 8000FT are used. This indicates that there is turbulence/icing above 8000 feet. If the turbulence/icing layer extends above 10000 feet, the user should refer to Mid-level SIGWX chart (or High-level SIGWX chart if required) to determine the vertical extent; and
if the top of the turbulent layer is expected to occur below 10000 feet and the turbulence is expected to extend to ground level, descriptions such as BLW 8000FT are used. This indicates that the turbulence extends from the surface to 8000 feet.
If the layer is not bounded by the surface or 10000 feet descriptions such as
4000/9000FT are used, or if the top is bounded by 10000 feet descriptions such as
5000/10000FT are used.
Any occurrence of moderate turbulence associated with thermals is also included using the format as follows:
<qualifier> TURB <vertical extent>FT IN THERMALS <location> <timing>
E.g. MOD TURB BLW 8000FT IN THERMALS FM00Z
When dust devils are mentioned in the SURFACE VIS AND WX column the associated turbulence and vertical extent is included in this column.
5.3.4 Column 4: Freezing Level
The freezing level is displayed in thousands of feet e.g. 8000 feet is displayed as 8000FT. The upper limit of the freezing level is limited to 10000 feet. However, if the freezing level is above 10000 feet then the level will be indicated by ABV 10000FT.
If the freezing level is above 10000 feet then this information can be obtained from Mid-Level SIGWX and GPWT Charts. Refer to APPENDIX H for information on how to obtain freezing level information from SIGWX and GPWT charts. However, it should be noted that if the

Graphical Area Forecast User Guide
19
freezing level is below 10000 feet, the freezing level information should always be obtained from a relevant GAF.
Reference is made to variations in height greater than 2000 feet, and to the occurrence of more than one freezing level. If there are multiple freezing levels then this information is given in the following format; FZ LYR 6000/8000FT, this indicates a freezing layer between 6000 to 8000 feet. For example, there is a freezing layer between 4000 and 6000 feet, with the main freezing level at 9000 feet. The FZLVL column should include both the main freezing level and the freezing layer, as below:
9000FT
FZ LYR 4000/6000FT
If the freezing level is indicated by 8000FT N/5000FT S, then the northern and southern most boundaries of the defined area should be interpreted as having those corresponding values, and that the freezing level grades incrementally. PCA locations or latitude and longitude may be used to indicate the change of freezing level for example:
8000FT, ABV 10000FT N OF 30S
5000FT, 7000FT N OF YPYF/YLTN
5.3.5 Use of Sub Areas
A sub area is used to highlight conditions that are slightly different to that of the associated area, and the information that the text refers to only applies to the sub area. An alphanumeric label, such as A1 or B1 (in bold), will be used to identify a sub area, as the following examples
highlight.
Isolated showers are expected throughout area A but in sub area A1 the showers have greater coverage (i.e. scattered in this case), and are expected to decrease to isolated at 10Z.
3000M ISOL SHRA (SCT IN A1, ISOL FM 10Z)
Scattered showers are expected throughout area B (this includes sub area B1) but in sub area B1 isolated heavy showers and thunderstorms are also expected from 04Z.
AREA B
>10KM NIL
4000M SCT SHRA FM 02Z
2000M ISOL +SHRA IN B1 ONLY FM 04Z
1000M ISOL TSRA IN B1 ONLY FM 04Z
Scattered rain is expected throughout area D, with widespread rain in sub area D1 from 02Z (until 02Z D1 will experience scattered rain).
AREA D
>10KM NIL
5000M SCT RA (WDSPR FM 02Z IN D1)

Graphical Area Forecast User Guide
20
Thunderstorms are expected throughout area A, however they will cease at 07Z in A1.
Area A
>10KM NIL
4000M SCT SHRA
2000M ISOL TSRA (CEASING 07Z IN A1)
To highlight the different conditions in a sub area from that of the associated area brackets can be used as the following example highlight:
If sub area information is referenced alongside the area conditions:
AREA B
4000M SCT SHRA (ISOL IN B1, SCT FM 11Z)
Scattered showers are expected throughout area B (including sub area B1), however the showers will be isolated in area B1 until 11Z.
AREA A SCT CU 5000/ABV10000FT (SCT CU 2500/6000FT IN A1)
Scattered cumulus cloud is expected throughout area A (including sub area A1) but the base and top are lower in sub area A1.
AREA D MOD TURB BLW 8000FT (SEV IN D1)
Moderate turbulence below 8000 feet is expected in area D whereas in sub area D1 the turbulence will be severe.
When text refers to a sub area only, and there is no reference to conditions in the associated area, then the text will not be enclosed in brackets, for example:
AREA D
2000M ISOL TSRA IN D1 ONLY TL 21Z
The corresponding cloud, turbulence and/or icing also apply to that sub area without that sub area needing to be referenced:
ISOL CB 4000/ABV10000FT
BKN ST 1000/2500FT
BKN CU/SC 2500/9000FT
If the cloud, icing and/or turbulence information is unique to the sub area, in that the conditions only occur in the sub area and not the area, then the text will not be enclosed in brackets, for example:
AREA D
ISOL TCU 4000/ABV10000FT IN D1 ONLY TL 11Z
BKN ST 1000/2500FT
BKN CU/SC 2500/9000FT

Graphical Area Forecast User Guide
21
The towering cumulus is unique to the sub area and is only expected until 11Z, whereas throughout the area and sub area there will be broken stratus and broken cumulus and stratocumulus.
5.4 Critical Locations
A critical location is defined as a pass or gap through a mountain range which may be available for use by VFR pilots when poor conditions prohibit flight across the ranges elsewhere. The main concern at these locations is whether the pilot can fly over these regions visually.
There are four critical locations within the Australian flight region:
LOCATION GAF AREA ABBREVIATION ELEVATION (feet)
Bowral NSW-E BWL 2200
Mount Victoria NSW-E MVI 3700
Murrurundi NSW-E MUI 2300
Kilmore Gap VIC KMG 1200
Table 4 Critical location information
Critical locations are displayed on the graphic in a different colour (blue) and with a bold circle. Weather forecast information for critical locations is displayed in the REMARKS field.
The name of the critical location(s) is provided in abbreviated format (for example KMG for Kilmore Gap) and the elevation (ELEV) of the location is provided in feet to indicate the elevation of the location AMSL. The forecast will be written in a format similar to TAFs, using approved abbreviations as in APPENDIX B.
The format of critical locations is as follows:
<PCA ID> < [ELEV XXXXFT]>:<Weather> <visibility> <cloud> <variations>
e.g. KMG [ELEV 1200FT]: 9999 –RA BKN ST 2500FT, TEMPO 0811/0817 5000M RA BKN ST 1500FT
5.4.1 Weather Information
Weather is included if necessary and will be written as an approved abbreviation (see APPENDIX B).
In situations where conditions at the critical location are good but fog is expected in the valleys in the vicinity “FG VAL” may be appended to the forecast, for example; 9999 NSC [FG VAL].
5.4.2 Visibility Information
The surface visibility is reported if cloud is not on the ground and is given in metres e.g. 4000M. When the visibility is expected to be greater than 10 kilometres, it is indicated as 9999.

Graphical Area Forecast User Guide
22
5.4.3 Cloud information
Cloud is represented as <cloud amount> <cloud type> <level>FT, e.g. BKN SC 4000FT, where cloud height is AMSL and cloud type is an approved abbreviation as per APPENDIX B. Cloud height is given in feet AMSL e.g. 3000 feet is given as 3000FT.
Where the height of the cloud is the same as the elevation of the location, indicating cloud is on the ground, the forecast is written as [CLD ON GND]. It is assumed the visibility in cloud will be less than 1000 metres, and therefore a visibility group is not included in the forecast, e.g. cloud on the ground at Mt Victoria would be written as BKN ST 3700FT [CLD ON GND].
CAVOK is used for a critical location to indicate visibility greater than 10km and a cloud ceiling greater than 5000 feet above ground level.
5.4.4 Additional Information
The change indicators FMddhhmm or BECMG ddhh/ddhh are also used when one set of prevailing weather conditions are expected to change to a different set of conditions. The indicators are the beginning of a self-contained forecast, i.e. information on visibility, weather and cloud is included as required.
INTER or TEMPO may be used to describe intermittent or temporary variations in the prevailing forecast conditions respectively.
Probability Forecasts, indicated by PROB% ddhh/ddhh, may be used if the estimated probability of occurrence is thirty or forty per cent, but only with reference to thunderstorms or poor visibility resulting from fog, mist, dust, smoke or sand, e.g. PROB30 0118/0123 0500M FG.
Forecasts for critical location are coded in one line. For example in NSW-E GAF:
CRITICAL LOCATIONS [HEIGHTS AMSL]:
BWL [ELEV 2200FT]: SHRA BKN ST 2200FT [CLD ON GND]
MVI [ELEV 3700FT]: RA BKN ST 3700FT [CLD ON GND], FM210000 9999 SHRA BKN ST 5000FT, TEMPO 2102/2105 4000M SHRA BKN ST 4000FT
MUI [ELEV 2300FT]: RA BKN ST 2300FT [CLD ON GND], PROB30 INTER 2102/2105 3000M TSRA BKN ST 3500FT SCT CB 5000FT
5.5 GAF Worked Example
Figure 12 below is a GAF for Queensland South that was issued on the 19th of October 2017
at 0254Z. The GAF is valid from 0500Z until 1100Z on the 19th of October 2017. Weather
features, if displayed, are valid as of 0500Z on the 19th of October 2017.

Graphical Area Forecast User Guide
23
Figure 12 Queensland South GAF
Area A
Surface visibility and weather
Where there is no weather, visibility will be greater than 10 km.
There will be scattered smoke below 10000FT AMSL with visibility reduced to 8000 m over land.
There will be isolated dust devils with visibility reduced to 5000 m in sub area A2 till 08Z.
There will be isolated smoke below 6000FT AMSL with visibility reduced to 2000 m over land in sub area A1.
Cloud, icing and turbulence
Throughout Area A there will be scattered cumulus clouds with base 5000FT AMSL to top above 10000FT AMSL, however in sub areas A1 and A2 there are variations. In sub area A1, the base and top of scattered cumulus cloud are expected to be 3000FT AMSL and 6000FT AMSL respectively. And in A2, the base and top of scattered cumulus cloud are expected to be 8000FT AMSL and ABV10000FT AMSL respectively. Moderate turbulence and icing should be expected with these clouds (as per legend).
Where there are dust devils in sub area A2 expect moderate turbulence below 10000FT AMSL.
There will be moderate turbulence below 10000 FT AMSL in thermals west of line YEML / YTAM (Emerald/Taroom) until 08Z.
Freezing level

Graphical Area Forecast User Guide
24
Above 10000 FT
Area B
Surface visibility and weather
Where there is no weather, visibility will be greater than 10 km.
There will be isolated smoke below 10000FT AMSL with visibility reduced to 8000 m.
There will be isolated showers of rain with visibility reduced to 3000 m.
There will be isolated thunderstorms of rain with visibility reduced to 2000 m.
Cloud, icing and turbulence
Throughout Area B there will be scattered cumulus clouds with base 5000FT AMSL to top above 10000FT AMSL. Moderate turbulence and icing should be expected with these clouds (as per legend).
In isolated moderate showers of rain, there will be isolated towering cumulus with base 3500 FT AMSL to top above 10000 FT AMSL, broken stratus clouds with base 2000 FT AMSL to top 3500 FT AMSL, broken cumulus and stratocumulus cloud with base 3500 FT AMSL to top above 10000 FT AMSL. Severe icing and turbulence should be expected with towering cumulus and moderate turbulence and icing should be expected with the cumulus and stratocumulus (as per legend).
In isolated moderate thunderstorms of rain, there will be isolated cumulonimbus with base 3500 FT AMSL to top above 10000 FT AMSL, broken stratus clouds with base 2000 FT AMSL to top 3500 FT AMSL, broken cumulus and stratocumulus cloud with base 3500 FT AMSL to top above 10000 FT AMSL. Severe icing and turbulence should be expected with cumulonimbus and moderate turbulence and icing should be expected with the cumulus and stratocumulus (as per legend).
There will be moderate turbulence below 10000 FT AMSL in thermals west of line YGDI / YTAM (Goondiwindi / Taroom) until 08Z.
Freezing level
Above 10000 FT
Area C
Surface visibility and weather
Where there is no weather, visibility will be greater than 10 km.
There will be isolated moderate showers of rain with visibility reduced to 3000 m.
Cloud, icing and turbulence
Throughout Area C there will be scattered cumulus and stratocumulus clouds with base 3000FT AMSL to top 7000FT AMSL. Moderate turbulence should be expected with these clouds (as per legend).
In isolated moderate showers of rain, there will be broken stratus clouds with base 1500 FT AMSL to top 3000 FT AMSL, overcast cumulus and stratocumulus cloud with base 3000 FT AMSL to top 9000 FT AMSL. Moderate turbulence should be expected with the cumulus and stratocumulus (as per legend).
Freezing level
Above 10000 FT

Graphical Area Forecast User Guide
25
Note: In addition to all the above, it is good practice to consult medium level SIGWX charts, SIGMETs and AIRMETs, GPWT charts, synoptic charts, relevant TAFs and METARs in order to obtain the fullest picture of the existing and predicted weather.
Further worked examples can be found in Appendix D.

Graphical Area Forecast User Guide
26
6 Changes to GAF and Corrected GAF
GAFs will not be amended for deteriorating conditions. Advice of deteriorating conditions meeting the AIRMET criteria and not currently contained in GAFs, shall be provided by issuing an AIRMET. For further information on AIRMETs refer to Section 7. When GAFs are reissued at the standard issue times, any phenomena contained in any valid AIRMET(s) shall be included in the relevant GAF(s), and thereafter the relevant AIRMET(s) must be cancelled.
A SIGMET is always issued for the specified weather phenomena regardless of whether it is forecast in the GAF. When GAFs are reissued at the standard issue times, any phenomena contained in any valid SIGMET(s) shall be included in the relevant GAF(s), however, the SIGMET will only be cancelled once the phenomenon ceases to meet SIGMET criteria.
6.1 Corrections
A correction to a GAF can be made between standard issue times for the following reasons:
1. Typographical Errors (TYPO)
Typographical errors are errors made in the typing process, such as a spelling mistake or a mistake in an approved abbreviation.
2. Transmission errors (TRANS ERR)
Transmission errors are errors such as transmitting before completion and in some circumstances if uncorrected, this would result in an erroneous interpretation of the GAF and may create a potential hazard to aviation.
3. Improvement in Conditions (IMPR)
Improvement in conditions as described in Table 5 below.
ELEMENT CORRECTION CRITERIA
Volcanic Ash, thunderstorm, hail, severe squall line, tropical cyclone, sandstorm, dust storm, freezing precipitation, fog, icing, turbulence, mountain waves
No longer present and/or SIGMET or no longer required.
Visibility When visibility is forecast to improve and change to or pass through one or more of the following values:
8000M and/or 5000M
Cloud amount Decrease to less than BKN, height of base being below 5000FT above the highest terrain in the area

Graphical Area Forecast User Guide
27
Cloud height of base Height of base (above ground level) of any cloud layer of BKN or OVC extent is forecast to lift and change to or pass through one of the following values:
1500 FT and 1000 FT
Table 5 Criteria for GAF correction for an improvement in conditions
Corrections will be issued with the term CORRECTED below the first line of the Header field,
as in Figure 13 below.
Figure 13 Corrected GAF Header
Corrected GAFs will include a brief description highlighting the changes in the Remarks field and will be written in the following format:
COR AREA <area>: <reason >
e.g. COR AREA A: TYPO
COR AREA D: IMPR, TS NO LONGER EXPECTED
Where TYPO is typographical error, TRANS ERR is for transmission error and IMPR is for improvement in conditions.
Note: when a corrected GAF is issued only information pertaining to the correction will be modified. Therefore a corrected GAF will only contain changes relating to items 1, 2 and/or 3 mentioned above.
Refer to APPENDIX E for examples of corrected GAFs.
6.2 Corrected GAF Worked Example
A GAF for Victoria was issued on the 15th of September 2017 at 0154Z (Figure 14 below). The
GAF is valid from 1100Z until 1700Z on the 15th of September 2017. Weather features, if
displayed, are valid as of 1100Z on the 15th of September 2017.

Graphical Area Forecast User Guide
28
Figure 14 Victorian GAF with error
The meteorologist responsible for the GAF notices a typo in section C, TURB is misspelt as TRUB. The forecaster corrects the spelling and issues a corrected GAF (Figure 15), which includes a comment in the remarks box to outline the correction and the reason for the correction.
Figure 15 CORRECTED Victorian GAF

Graphical Area Forecast User Guide
29
7 AIRMET
AIRMET advices are currently issued to provide pilots with information on the occurrence and/or expected occurrence of specified meteorological phenomena that are not included within the valid Area Forecast (ARFOR).
Further information regarding the AIRMET product can be found at http://www.bom.gov.au/aviation/gaf/index.shtml.
GAFs will not be amended. An AIRMET will be responsible for notifying users of deterioration to conditions meeting specified criteria that are not already included in the relevant GAF. (NB. A SIGMET is always issued for the specified phenomena regardless of whether it is
forecast in the GAF.)
7.1 Issuance
From 9 November 2017 AIRMET will be issued for the following phenomena if not already contained in the current GAF:
WEATHER ELEMENT/ PHENOMENON
CRITERIA
Visibility Widespread areas of visibility of less than 8000 M over an area of at least 3000NM
2; or
Visibility of less than 5000 M in areas of high traffic density.
Cloud Widespread areas of cloud coverage of BKN or OVC below 1500 FT AGL over an area of at least 3000NM
2; or
Cloud coverage of BKN or OVC below 1000 FT AGL in areas of high traffic density; or Any cumulonimbus or towering cumulus cloud that was not forecast, regardless of geographic extent or frequency.
Weather Isolated or occasional thunderstorms, regardless of geographic extent or frequency; or Moderate icing (not issued separately when icing occurs in convective clouds); or Moderate turbulence (not issued separately when turbulence occurs in convective clouds); or
Moderate mountain waves.
Freezing Level Significant change in freezing level (Change of 2000 FT or more)
Table 6 Criteria for issuance of AIRMETs

Graphical Area Forecast User Guide
30
7.2 Extension
Current AIRMETs are the subject of continuous watch and shall not be left to expire without explicitly being cancelled or extended if required. The validity time of an AIRMET cannot exceed 4 hours.
If an AIRMET is required to be extended, the lead time will be between 30 to 60 minutes prior to the beginning of the validity of the next issue of the AIRMET, i.e. AIRMET will not be extended 60 minutes prior to the beginning of validity of the next issue, for example:
An AIRMET is not extended if its validity continues past the commencement of the next routine GAF. In this case, the phenomenon will be included in the next routine GAF and the AIRMET is cancelled once the GAF becomes valid; following on from the example above this is highlighted as follows:
*It is important to note that the low visibility hazard (fog) still exists, and is contained in the valid GAF.
7.3 Cancellation
An AIRMET will be cancelled when:
during the validity period of an AIRMET the phenomenon for which the AIRMET had
been issued is now included in a routine issue of a GAF; and/or
the phenomenon ceases to exist.
Therefore it is important to note that when GAFs are reissued at the standard issue times,
23Z, 05Z, 11Z and 17Z, any phenomena contained in any valid AIRMET(s) shall be included
in the relevant GAF(s), and thereafter the relevant AIRMET(s) will be cancelled, as highlighted
below:
18Z 2120Z
FG not forecast in GAF AIRMET extended FG observed AIRMET issued
AIRMET VALID 18Z – 22Z
AIRMET VALID 22Z – 02Z
23Z 2305Z
FG now included in GAF AIRMET cancelled*
GAF VALID 23Z – 05Z
CNL AIRMET VALID 2305Z – 02Z

Graphical Area Forecast User Guide
31
*It is important to note that the thunderstorm hazard still exists, and is contained in the valid GAF.
Figure 16 below highlights another example of an AIRMET being cancelled after the next routine issuance of GAF becomes valid. At 0400Z GAFs 05-11Z and 11-17Z are issued. At 0440Z the meteorologist observes thunderstorms. Thunderstorms are not forecast in the current GAF coverage period (05-17Z). An AIRMET is issued at 0440Z, for four hours. The expectation is that the thunderstorms will cease at 14Z. Therefore at 0810Z the AIRMET is extended for another four hours.
Figure 16 AIRMET cancellation example
At 10Z the meteorologist prepares the next routine issuance of GAF, 11-17Z and 17-23Z, and includes in the 11-17Z GAF thunderstorms until 14Z. The GAFs are sent and become valid at 11Z. At 1105Z the AIRMET is cancelled as the thunderstorms are now contained in the valid GAF.

Graphical Area Forecast User Guide
32
8 Grid Point Wind and Temperature Forecasts
8.1 Introduction
The Bureau produces Grid-Point Wind and Temperature (GPWT) forecasts for High-level (FL180-450) and Mid-level (FL050-240). Since May 2017, the Bureau has produced a Low-level GPWT forecast which includes wind and temperature information from 1000 FT (AMSL) to FL140.
With the introduction of the GAF, low-level wind information will be provided by Low-level GPWT forecasts. The wind data will replace the wind information provided in the current ARFORs. The Low-level GPWT forecast will be available via the NAIPS Briefing Page when is implemented on 9 November 2017.
8.2 Layout
The GPWT forecast consists of the following two components (refer to Figure 17 below):
Legend - containing the title of the product, issue time, validity times, structure of the data and ISA (International Standard Atmosphere) pressure (hPa) and temperature for each level;
Image - showing a map of the relevant GPWT Area, including coast line, state boundaries, with a 1.5 degree grid of wind and temperature values, or 5 degree grid for the Australia forecast.

Graphical Area Forecast User Guide
33
Figure 17 NSW GPWT forecast
8.3 Domain
Low-level GPWT forecast products provide forecast wind and temperature data for nine regional areas across Australia, covering the domains of the GAF products, as shown in Figure 18 below. The regional GPWT forecast charts display data in a grid of 1.5° latitude by 1.5° longitude and data is given for the flight levels 1000 FT, 2000 FT, 5000 FT, 7000 FT, 10000 FT and FL140.
It should be noted that the two NSW GAFs will be covered by a single GPWT forecast chart (GPWT NSW) and the Victorian and Tasmanian GAF areas will be covered by a single GPWT forecast chart (GPWT VT).
In addition to the nine regional GPWT forecasts, a single national Low-level GPWT forecast at five degree data resolution (grid of 5° latitude by 5° longitude) provides an efficient way to review winds across the entire domain of Australia (see the black box in below). This national low-level GPWT forecast matches the domain of the national Mid and High-level GPWT forecasts.
Low-level regional and Australian GPWT forecasts are produced from the Bureau's numerical prediction model (NWP) data, whereas the Mid and High-level GPWT forecasts are produced from World Area Forecast Centre (WAFC) model data therefore the values may differ for the same location and height given that the data sources are different.
Graphical Area Forecast User Guide
34
Figure 18 Low-level GPWT forecast boundaries
8.4 Product Format
To support an efficient machine-to-machine loading of wind and temperatures, a single national GPWT forecast dataset will be provided in XML format. This dataset will be provided every 6 hours and contain data at a 1.5 degree resolution, for time steps T+3hrs to T+48hrs in three hour increments with the same levels as GPWT forecasts.
8.5 Issue Times and Validity Periods
Low-level GPWT forecasts are issued four times a day, with charts valid at three hourly time steps as shown in Table 7 below.
ISSUE TIME CHARTS VALID AT
22Z 00Z, 03Z, 06Z, 09Z, 12Z, 15Z, 18Z, 21Z
04Z 06Z, 09Z, 12Z, 15Z, 18Z, 21Z, 00Z, 03Z
10Z 12Z, 15Z, 18Z, 21Z, 00Z, 03Z, 06Z, 09Z
16Z 18Z, 21Z, 00Z, 03Z, 06Z, 09Z, 12Z, 15Z
Table 7 Issue and Validity Times of Low Level GPWT Charts
8.6 Deconstructing Low-level GPWT Forecast Charts
The GPWT legend below in Figure 19 contains the following information:
Product name and flight levels covered by the forecast
Validity time
Issue time
Information on how to interpret the data in the chart
Levels (FL/FT)
International Standard Atmosphere (ISA) temperatures and pressure levels (hPa)

Graphical Area Forecast User Guide
35
Figure 19 Low Level GPWT chart legend
Each grid box in the GPWT forecast chart contains wind speed and direction and temperature data for the levels outlined in the legend. The values given are forecast data for the mid-point of each square and are given in the following format; dd fff tTT; where each element represents the following:
ELEMENT DESCRIPTION EXAMPLE
dd Wind direction in tenths of degrees true 28 is 280 degrees 04 is 040 degrees
fff Wind speed in knots 019 is 19 knots 045 is 45 knots
t Sign of temperature, positive or negative + is positive temperature - is negative temperature
TT Temperature in whole degrees Celsius 08 is 8 degrees Celsius
Table 8 Explanation of data box format
Note: For levels at which the data is reported below the ground level the wind and temperatures will displayed as “-- --- ---“.
Figure 20 below shows an example of a grid box of data from a GPWT forecast chart. In this example, at FL140 winds are 300/19 and temperature -06°C (top line). At 2000 feet, winds are 230/05 and temperature +23°C (second line from the bottom). The bottom line (corresponding to 1000 feet AMSL) has dashed lines to indicate that at this particular grid point the terrain is above 1000 feet so there is no valid data.
Figure 20 Example of grid box from GPWT chart
Latitude and longitude information is displayed at the edge of the chart, and coastlines are also shown to assist in determining geographical locations.

Graphical Area Forecast User Guide
36
It should be noted that northerly wind direction in the GPWT forecast is 360 degrees, indicated in the forecast in the left hand column as '36'. The use of '000' denotes calm and will be displayed in the centre column of the grid box.
Information on significant changes in wind speed and direction due to various weather features, such as Southerly Buster, Tropical Cyclone, etc can be obtained from the GPWT Forecasts. However, it should be noted that due to its temporal resolution, on some occasions GPWT Forecasts may not highlight these significant wind changes, especially if the features are fast moving.
8.7 Caveats
GPWT forecast charts are used by pilots to determine winds and temperatures at a particular altitude or to select the best altitude for a particular flight. Users may have to interpolate the data to determine winds and temperatures at a location between grid points, at a level between the levels given on the chart, or at times other than the valid time of the chart.
The deterministic nature of GPWT forecasts means that it is necessary to treat the accuracy of the data with some degree of caution. While the accuracy of this data has vastly improved in recent years and generally verifies with observed conditions well, model winds provided by the Bureau's NWP model may not always be accurate or have the resolution to depict winds accurately, especially in fast moving systems.
It must also be noted that the terrain height within a grid box can vary by several thousand feet. As a result, winds in the lower levels may not be available despite some areas within a grid box featuring terrain height as low as sea level in some cases. The highlighted box in Figure 21 below (Innisfail and inland areas) illustrates one such example. In these cases, downstream neighbouring grid point data at 1000 feet and 2000 feet may need to be referenced to deduce wind speed and direction in the area. For example, the 1000 feet and 2000 feet wind direction and speed in the grid box to the right of the highlighted box are 150/27 and 140/28 respectively, and therefore downstream of the highlighted box. Therefore in the highlighted box where there is no terrain at 1000 feet and 2000 feet one could infer that the wind speed and direction is the similar to the downstream grid box.

Graphical Area Forecast User Guide
37
Figure 21 GPWT QLD-N example
Graphical Area Forecast User Guide
38
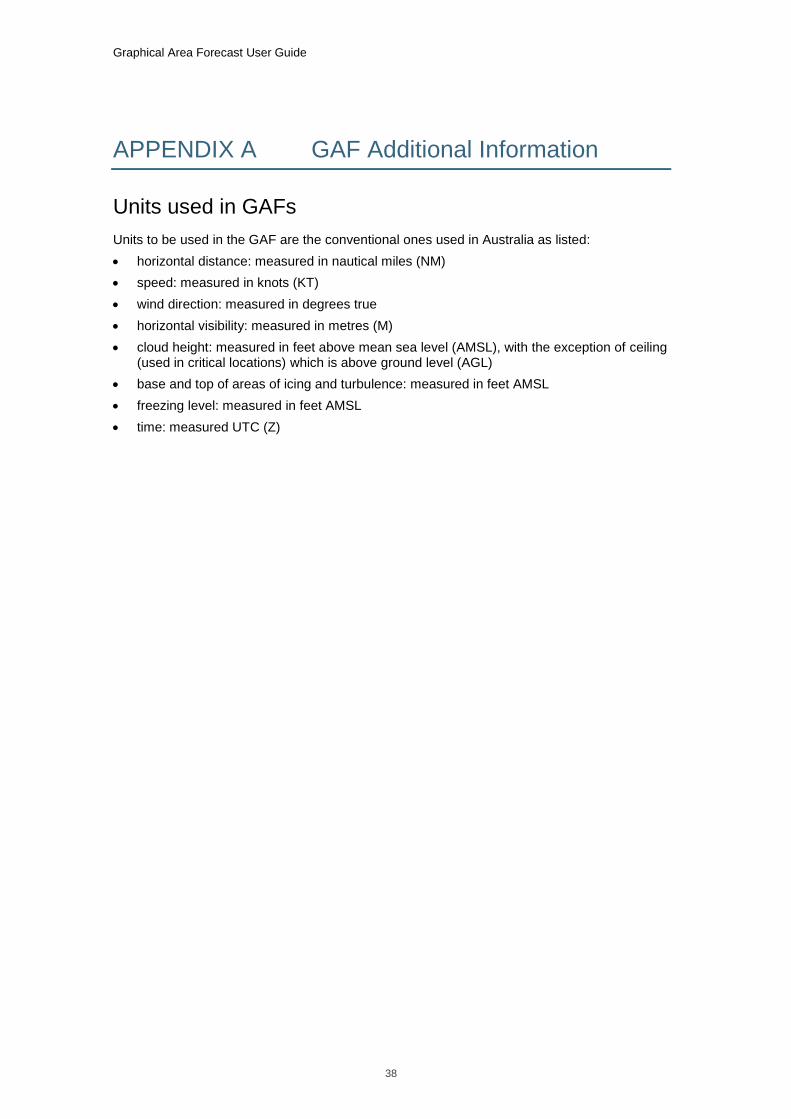
APPENDIX A GAF Additional Information
Units used in GAFs
Units to be used in the GAF are the conventional ones used in Australia as listed:
horizontal distance: measured in nautical miles (NM)
speed: measured in knots (KT)
wind direction: measured in degrees true
horizontal visibility: measured in metres (M)
cloud height: measured in feet above mean sea level (AMSL), with the exception of ceiling (used in critical locations) which is above ground level (AGL)
base and top of areas of icing and turbulence: measured in feet AMSL
freezing level: measured in feet AMSL
time: measured UTC (Z)

Graphical Area Forecast User Guide
39
APPENDIX B Approved Abbreviations/Terms
APPROVED ABBREVIATION
TERM DESCRIPTION/USE EXAMPLE
ABV Above Above a level FZLVL ABV 10000FT
AC Altocumulus Cloud type SCT AC/AS 9000/ABV10000FT
AND Connection word MOD TURB BLW 8000FT AND IN
THERMALS
Amount Used in the remarks section only
COR AREA A IMPR CLD AMOUNT
AS Altostratus Cloud type SCT AC/AS 9000/ABV10000FT
AT At At a time or location
BASE(S) Base(s) Cloud base BKN CU 4000/8000FT, BASE 2000FT SEA/LAND WI 30NM OF COAST
BECMG Becoming To describe temporal changes
SCT SHRA BECMG ISOL FM 10Z
BLW Below Below a level MOD TURB BLW 5000FT
BL Blowing Descriptor to be used with dust (DU), sand (SA) or snow (SN)
1000M WDSPR BLDU
BKN Broken Cloud amount BKN ST 1000/3000FT
BR Mist Weather phenomenon 2000M ISOL BR
CAVOK
Ceiling and Visibility OK
Ceiling above 5000FT and visibility greater than 10KM and only used for critical locations
BWL [ELEV 2200FT]: CAVOK

Graphical Area Forecast User Guide
40
Ceasing To describe cessation of weather in sub area
2000M ISOL TSRA (CEASING 07Z IN A1)
Changed Used in the remarks section only
COR AREA: A TYPO TRUB CHANGED TO TURB
CLD Cloud Used in the remarks section only
COR AREA A IMPR CLD AMOUNT
CLD ON GND
Cloud on ground Used for critical locations to indicate cloud on ground. Should always be given in parenthesis and only used for critical locations
MVI [ELEV 3700FT]: BKN ST 3700FT [CLD ON GND]
COAST Coast At the coast BKN ST 1000/2500FT LAND WI 30NM OF COAST
COR Correction For use in REMARKS COR AREA E: TYPO
CB Cumulonimbus Cloud type ISOL CB 2000/ABV10000FT
CU Cumulus Cloud type SCT CU 4000/ABV10000FT
Decreased Used in the remarks section only
COR AREA C IMPR CLD AMOUNT DECREASED
DR Drifting Descriptor to be used with dust (DU) or snow (SN)
0500 WDSPR DRSN
DU Dust Weather phenomenon 6000M WDSPR DU
DZ Drizzle Weather phenomenon 8000M SCT DZ
DS Dust Storm Weather phenomenon 5000M SCT DS
E East Direction 6000M WDSPR DU E OF YTFD /
MVI
ELEV
Elevation Used for critical locations only
BWL [ELEV 2200FT]: SHRA BKN ST 2200FT [CLD ON GND]
EMBD*
Embedded Weather and cloud description
ISOL EMBD CB 4000/ABV10000FT

Graphical Area Forecast User Guide
41
FEW Few Cloud amount FEW CU 5000/8000FT
FG Fog Weather phenomenon 0500 ISOL FG FM 18Z
FT Feet Height description ABV10000FT
FU Smoke Weather phenomenon 8000M WDSPR FU
FZ Freezing Descriptor to be used with fog (FG), drizzle (DZ) or rain (RA)
4000M SCT FZRA
FZ LYR Freezing Layer Used to describe freezing layers
FZ LYR 6000/8000FT
FZLVL Freezing Level Height of freezing level in feet
Appears on GAF table
FRQ*
Frequent Weather and cloud amount 1000M OCNL TSRA (1000M FRQ
TSRA A1 ONLY FM 06Z)
FM From For temporal changes MOD TURB BLW 4000FT FM 15Z
GR Hail Weather phenomenon to be used with SH/SHRA or TS/TSRA
0500M ISOL +TSRAGR FM 10Z
GS Small hail or snow pellets
Weather phenomenon 2000M ISOL +SHRAGS
HZ Haze Weather phenomenon 8000M WDSPR HZ
+ Heavy Weather intensity 1000M ISOL +SHRA FM 04Z
ICE Icing Weather phenomenon MOD ICE ABV 7000FT
Improved Used in the remarks section only
COR AREA D: VIS IMPROVED
IMPR Improvement in conditions
For use in REMARKS only COR AREA B: IMPR TS NO LONGER EXPECTED
IN MOD TURB BLW 8000FT AND IN

Graphical Area Forecast User Guide
42
THERMALS
Increased Used in the remarks section only
COR AREA C IMPR CLD HEIGHT INCREASED
INLAND Inland Land from the coast to a point inland
BKN ST 0500/1500FT COAST/30NM INLAND
INTER
Intermittent conditions
Only used in critical locations forecasts
INTER 1208/1211 4000 SHRA BKN
ST 3000FT
ISOL Isolated Weather and cloud amount 3000M ISOL SHRA
KM Kilometres Distance >10KM NIL
KT Knot Used to describe speed of movement of weather features
Appears on GAF image
LAND Land Over land 8000M SCT FU LAND
- Light Weather intensity 8000M SCT -RA
L Low pressure Weather feature Appears on GAF image
M Metres Distance 6000M SCT RA
MOD Moderate Intensity description MOD TURB BLW 5000FT TL 02Z
MTW Mountain Waves Weather phenomenon MOD MTW TL 08Z
NM Nautical mile Distance BKN ST 0500/1500FT COAST/30NM
INLAND
NIL Nil No significant weather >10KM NIL
NS Nimbostratus Cloud type OVC NS 2000/ABV10000FT
N North Direction MOD TURB BLW 5000FT N OF YMOR / YKMP

Graphical Area Forecast User Guide
43
NE Northeast Direction ISOL SHRA, SCT NE OF YMOR / YKMP
NW Northwest Direction ISOL TCU NW OF YTFD / YNBR
OCNL*
Occasional Weather and cloud amount ISOL CB 2000/ABV10000FT, OCNL
FM 06Z
OF Of Used to define area ISOL TCU NW OF YTFD / YNBR
ONLY Only Used when mentioning sub-areas
SEV TURB BLW 8000FT D1 ONLY
OVC Overcast Cloud amount OVC ST 1000/4000FT
RA Rain Weather phenomenon 5000M SCT RA
Ranges Geographical description (mountains/ranges)
ISOL SHRA RANGES E OF YTFD /
YORG
PO Dust Devils Weather phenomenon 5000M ISOL PO
SA Sand Weather phenomenon 5000M SCT BLSA
SS Sandstorm Weather phenomenon 1000M WDSPR SS
SCT Scattered Weather and cloud amount 0500M ISOL FG, BECMG SCT FM
18Z
SEA Sea Geographical description (over sea)
0500M ISOL FG SEA TL 02Z
SEV Severe Intensity description SEV TURB BLW 8000FT TL 04Z
SH Shower/s Weather phenomenon 8000M ISOL -SHRA
SN Snow Weather phenomenon 4000M ISOL SHSN ABV 2500FT
S South Direction 8000FT N / 4000 S
SE Southeast Direction ISOL FG SE OF YCTM / NAMA FM
10Z

Graphical Area Forecast User Guide
44
SW Southwest Direction SEV TURB SW OF YCWR / UDA
SQL Squall Weather phenomenon SQL TS TL 09Z
STNR Stationary Used to describe speed of movement of weather features
Appears on GAF image
SC Stratocumulus Cloud type SCT SC 2000/5000FT
SFC Surface Header in the weather table
ST Stratus Cloud type BKN ST 1000/2500FT
TEMPO
Temporary conditions
Periods of 30 to 60 minutes. Only used in Critical locations forecasts
TEMPO 2105/2110 2000 TSRA BKN
ST 2200FT
THERMALS Thermals Weather phenomenon MOD TURB BLW 5000FT IN THERMALS
TL Until For temporal changes 3000M SCT BR TL 23Z
TS Thunderstorm Weather phenomenon 1000M ISOL TSRA, BECMG OCNL
FM 05Z
TO To
TOP(S) Cloud Top(s) Description of cloud Top(s) SCT CU 2500/8000FT, TOP TO
ABV10000FT LAND
TCU Towering cumulus Cloud type ISOL TCU 2000/ABV10000FT
TROUGH Trough Weather feature Appears on GAF image
TRANS ERR Transmission error For use in REMARKS COR AREA A: TRANS ERR
TURB Turbulence Weather phenomenon SEV TURB BLW 8000FT
TYPO Typographical error For use in REMARKS COR AREA C TYPO
VAL
Valley/s Geographical descriptor. Only used in Critical
0500M ISOL FG VAL

Graphical Area Forecast User Guide
45
locations forecasts
VA Volcanic Ash Weather phenomenon >10KM WDSPR VA N YPKT/YNGU
VIS Visibility Used in the remarks section only
COR AREA B: IMPR VIS IMPROVED
W West Direction 7000M ISOL DU W OF HRD / YHAY
WDSPR Widespread Weather and cloud amount 7000M WDSPR -RA
WI Within Used as spatial descriptor SEV TURB BLW 8000FT LAND/SEA WI 30NM OF N COAST
Z Zulu Coordinated Universal Time 3000M ISOL BR TL 22Z
Table 9 Approved Abbreviations and Terms
* To be used for TS, CB and/or TCU only.

Graphical Area Forecast User Guide
46
APPENDIX C Approved Symbols
SYMBOL MEANING
Cold fronts
L Significant low pressure systems
Significant surface trough
Direction-of-motion arrows
Tropical cyclones
Table 10 Approved symbols

Graphical Area Forecast User Guide
47
APPENDIX D GAF Worked Examples
In order to understand how to interpret the GAF more fully, it is useful to consider a few worked examples.
GAF Example 1
Figure 22 GAF for Tasmania
GAF for Tasmania issued on the 19th of October 2017 at 0332Z.
The GAF is valid from 1100Z until 1700Z on the 19th of October 2017.
Weather Features are valid as of 1100Z on the 19th of October 2017.
Area A
Surface visibility and weather
Where there is no weather, visibility will be greater than 10 km.
Cloud, icing and turbulence
Throughout Area A, there will be scattered cumulus and stratocumulus clouds with base 3500FT AMSL to top 9000 FT AMSL, becoming few with base 4000 FT AMSL to top 9000 FT AMSL from 1500Z. Moderate turbulence and icing should be expected with these clouds (as per legend).
There will be severe turbulence below 8000 FT AMSL over land and sea area within 30NM of the coast.

Graphical Area Forecast User Guide
48
Freezing level
4000 FT
Area B
Surface visibility and weather
There will be widespread light showers of rain with visibility reduced to 6000 m.
There will be isolated moderate showers of rain with visibility reduced to 4000 m.
Cloud, icing and turbulence
In widespread light showers of rain, there will be scattered stratus clouds with base 1500 FT AMSL to top 2500 FT AMSL and broken cumulus and stratocumulus clouds with base 2500 FT AMSL to top 9000 FT AMSL. Moderate turbulence and icing should be expected with cumulus and stratocumulus cloud.
In isolated moderate showers of rain, there will be broken stratus clouds with base 1500 FT AMSL to top 2000 FT AMSL, overcast cumulus and stratocumulus cloud with base 2000 FT AMSL to top 9000 FT AMSL. Moderate turbulence and icing should be expected with cumulus and stratocumulus cloud.
There will be severe turbulence below 8000 FT AMSL over land and sea within 30NM of the north coast.
Freezing level
4000 FT in the south grading to 5000 FT in the north.
Area C
Surface visibility and weather
Where there is no weather, visibility will be greater than 10 km.
There will be isolated moderate thunderstorms with rain until 1500Z with visibility reduced to 2000 m.
There will be isolated moderate showers, falling as snow above 3000 FT AMSL, with visibility reduced to 2000 m.
Cloud, icing and turbulence
Throughout Area C, there will be scattered cumulus and stratocumulus clouds with base 2500
FT AMSL to top 9000 FT AMSL. Moderate turbulence and icing should be expected with this
cloud.
In isolated moderate thunderstorms with rain, there will be isolated cumulonimbus cloud with base 2000 FT AMSL to top above 10000 FT AMSL and broken stratus clouds with base 1500 FT AMSL to top 2000 FT AMSL. Severe turbulence and icing should be expected with this cumulonimbus cloud.
In isolated moderate showers of rain and snow showers, there will be isolated towering cumulus with base 2000 FT AMSL to top above 10000 FT AMSL, broken stratus clouds with base 1500 FT AMSL to top 2000 FT AMSL, overcast cumulus and stratocumulus cloud with base 2000 FT AMSL to top 9000 FT AMSL. Severe turbulence and icing should be expected with towering cumulus cloud. Moderate turbulence and icing should be expected with cumulus and stratocumulus cloud.
Freezing level
4000 FT in the south grading to 5000 FT in the north.

Graphical Area Forecast User Guide
49
GAF Example 2
Figure 23 GAF for Victoria
GAF for Victoria issued on the 15th of September 2017 at 0030Z
The GAF is valid from 0500Z until 1100Z on the 15th of September 2017
Weather Features are valid as of 0500Z on the 15th of September 2017
Area A
Surface visibility and weather
Where there is no weather, visibility will be greater than 10 km.
Cloud, icing and turbulence
Throughout Area A, there will be scattered altocumulus and altostratus cloud with base 9000 FT AMSL to top above 10000 FT AMSL. Moderate turbulence should be expected with this cloud.
Freezing level
Above 10000 FT
Area B
Surface visibility and weather
Where there is no weather, visibility will be greater than 10 km.
There will be scattered moderate rain with visibility reduced to 5000 m.
There will be isolated areas of smoke with visibility reduced to 4000 m.
Cloud, icing and turbulence

Graphical Area Forecast User Guide
50
Throughout Area B, there will be scattered stratocumulus with base 4000 FT AMSL to top 7000 FT AMSL, scattered altocumulus and altostratus cloud with base 9000 FT AMSL to top above 10000 FT AMSL. Moderate turbulence should be expected with this cloud.
In scattered moderate rain, there will be broken stratus clouds with base 1500 FT AMSL to top 4000 FT AMSL, broken stratocumulus clouds with base 4000 FT AMSL to top 7000 FT AMSL and broken altocumulus and altostratus cloud with base 7000 FT AMSL to top above 10000 FT AMSL. Moderate turbulence should be expected with this cloud.
Freezing level
Above 10000 FT
Area C
Surface visibility and weather
Where there is no weather, visibility will be greater than 10 km.
There will be isolated moderate rain with visibility reduced to 8000 m.
There will be isolated areas of smoke over land with visibility reduced to 4000 m.
Cloud, icing and turbulence
Throughout Area C, there will be scattered stratocumulus cloud with base 2500 FT AMSL to top 7000 FT AMSL, which is expected to be broken over the sea, scattered altocumulus and altostratus cloud with base 9000 FT AMSL to top above 10000 FT AMSL. Moderate turbulence should be expected with this cloud.
In isolated moderate rain, there will be scattered stratocumulus cloud with base 2500 FT AMSL to TOP 5000 FT AMSL, and broken altocumulus and altostratus cloud with base 7000 FT AMSL to top above 10000 FT AMSL. Moderate turbulence should be expected with this cloud.
There will be moderate turbulence developing below 7000 FT AMSL from 0900Z.
Freezing level
Above 10000 FT
Critical Location Forecast:
KMG – Kilmore Gap, elevation is 1200 FT AMSL, there will be visibility of more than 10 km and scattered stratocumulus cloud with base 1800 FT AGL (above ground level) throughout the GAF validity period. During the entire GAF period (i.e. 0500Z to 1100Z), there will be temporary variations (periods of 30 to 60 minutes) to the previously given mean conditions due to moderate rain where visibility will be 5000 m and cloud will be broken stratus with base to 0300 FT AGL.

Graphical Area Forecast User Guide
51
APPENDIX E Corrected GAF Examples
Figure 24 Corrected QLD South GAF
Figure 25 Corrected WA North GAF

Graphical Area Forecast User Guide
52
Figure 26 Corrected NSW East GAF
Figure 27 Corrected TAS GAF

Graphical Area Forecast User Guide
53
APPENDIX F Using GPWT Forecasts
An example flight is shown by the green line on the GPWT forecast chart in Figure 28 below. The forecast chart has been cut from the Western Australian south GPWT chart, with the green line depicting a flight departing from the west (near Perth) and heading to the east. (Note: the green coastline in the far left hand column of grid boxes). Pilots would be required to read the data from the grid boxes based on the level they are flying at noting that the data is representative of the central point within the grid box.
Figure 28 Example Flight
Table 11 below shows the data displayed in the grid boxes for this particular flight.
GRID POINT 1 GRID POINT 2 GRID POINT 3 GRID POINT 4 GRID POINT 5
Height (FT/FL)
Wind (kts)
Temp (C)
Wind (kts)
Temp (C)
Wind (kts)
Temp (C)
Wind (kts)
Temp (C)
Wind (kts)
Temp (C)
FL140 280/32 -7 270/35 -6 280/27 -6 290/34 -7 300/45 -7
10,000FT 270/25 +2 280/21 +2 280/29 +2 280/38 +2 280/39 +2
7,000FT 280/35 +9 300/25 +9 280/25 +9 290/25 +9 290/20 +11
5,000FT 270/21 +11 290/27 +13 290/28 +13 280/24 +14 300/14 +16
2,000FT 270/03 +12 260/09 +10 260/12 +8 280/13 +16 270/14 +18
1,000FT 300/02 +14 270/06 +13 -- -- -- -- -- --
Table 11 Wind and Temperature data for example flight

Graphical Area Forecast User Guide
54
For example, the flight might ascend through the first grid point to cruising level at 8000 feet. Cruising level would be maintained until the fifth grid point (far right hand grid box), when the flight would descend to its destination.
Therefore the pilot would need to consider winds at 1000, 2000, 5000 and 7000 feet from grid box one. An interpolation between 7000 feet and 10000 feet may be required to better determine the wind at 8000 feet. For grid boxes two, three and four, wind at 7000 feet would be required and an interpolation between 7000 and 10000 feet to determine the winds at 8000 feet. Winds at 1000, 2000, 5000 and 7000 feet would be required from grid box five. An example using two consecutive GPWT charts is provided in Section APPENDIX F.

Graphical Area Forecast User Guide
55
APPENDIX G Using Two GPWT Forecasts
In this example wind and temperature data are required for a flight departing YMLT at 0800Z and arriving at YKII at 0940Z. The flight is from east to west.
GPWT forecast charts are issued for 3 hourly time steps as mentioned in Section 8. At 0400UTC GPWT forecast charts valid for 06Z-09Z (Figure 29) and 09-12Z (Figure 30) will be issued and will provide wind and temperature data for the duration of the flight. A subset of the actual GPWT forecast charts are provided below.
1. Using the GPWT forecast valid from 06Z for the first hour of the flight (08-09Z)
Figure 29 Extract from VT GPWT forecast chart valid at 0600 UTC
The yellow line denotes the flight path from YMLT to approximately one hour into the flight. The maroon lines point to the section of the flight path that relates to each grid point.
2. Using the GPWT forecast valid from 09Z for the remaining 40 minutes of the flight (09-0940Z):

Graphical Area Forecast User Guide
56
Figure 30 Extract from VT GPWT forecast chart valid at 0900 UTC
The yellow line denotes the flight path from approximately one hour into the flight to the destination YKII. The maroon lines point to the section of the flight path that relates to each grid point.
Table 12 below provides the wind and temperature data for the flight path as it moves across each grid point.
CHART 1 CHART 2
GRID POINT 1 GRID POINT 2 GRID POINT 3 GRID POINT 1 GRID POINT 2
Height (ft)
Wind (kts)
Temp (C)
Wind (kts)
Temp (C)
Wind (kts)
Temp (C)
Wind (kts)
Temp (C)
Wind (kts)
Temp (C)
14,000 280/28 -7 270/25 -5 290/27 -6 280/33 -4 280/27 -3
10,000 260/16 +1 290/31 +3 290/19 +5 300/31 +5 310/35 +5
7,000 290/15 +11 290/35 +12 300/32 +12 300/33 +13 300/24 +12
5,000 300/15 +16 280/30 +16 290/31 +15 290/26 +16 300/22 +16
2,000 --- --- 300/16 +20 270/12 +19 260/06 +19 270/11 +18
1,000 --- --- 340/15 +20 290/05 +18 350/03 +19 240/13 +15
Table 12 Grid Point Wind and Temperature data for example flight from YMLT to YKII
Note: For levels at which the data is reported below the Ground Level the wind and temperatures will displayed as “-- --- ---“.

Graphical Area Forecast User Guide
57
APPENDIX H Obtaining Freezing Level
For the purpose of this exercise please ignore the issue time and validity periods of the products.
For a flight from Perth (YPPH) to Carnarvon (YCAR), the weather areas applicable to the flight are A, B, C and E
Figure 31 WA South GAF
.
Freezing level information should always be obtained from the GAF in the instance, therefore to obtain the freezing level for the example flight:
1. Check the GAF (Figure 31)
In this example the freezing level grades from 6000 feet in area A to above 10000 feet in area E (Note: ABV 10000FT indicates the freezing level is higher than 10000 feet);
2. Refer to the GPWT chart (Figure 32)

Graphical Area Forecast User Guide
58
Figure 32 WA South GPWT forecast chart
The approximate flight path is indicated on the GPWT forecast chart in Figure 32 (yellow line
with Carnarvon at approximately 25⁰ south). The last two grid boxes that the flight traverses
through approximately represent area E on the GAF (Figure 31). Both of these grid boxes show the freezing level is above 10000 feet but below 14000 feet, as highlighted in Figure 33 below:
Figure 33 Subset of WA South GPWT forecast chart grid boxes
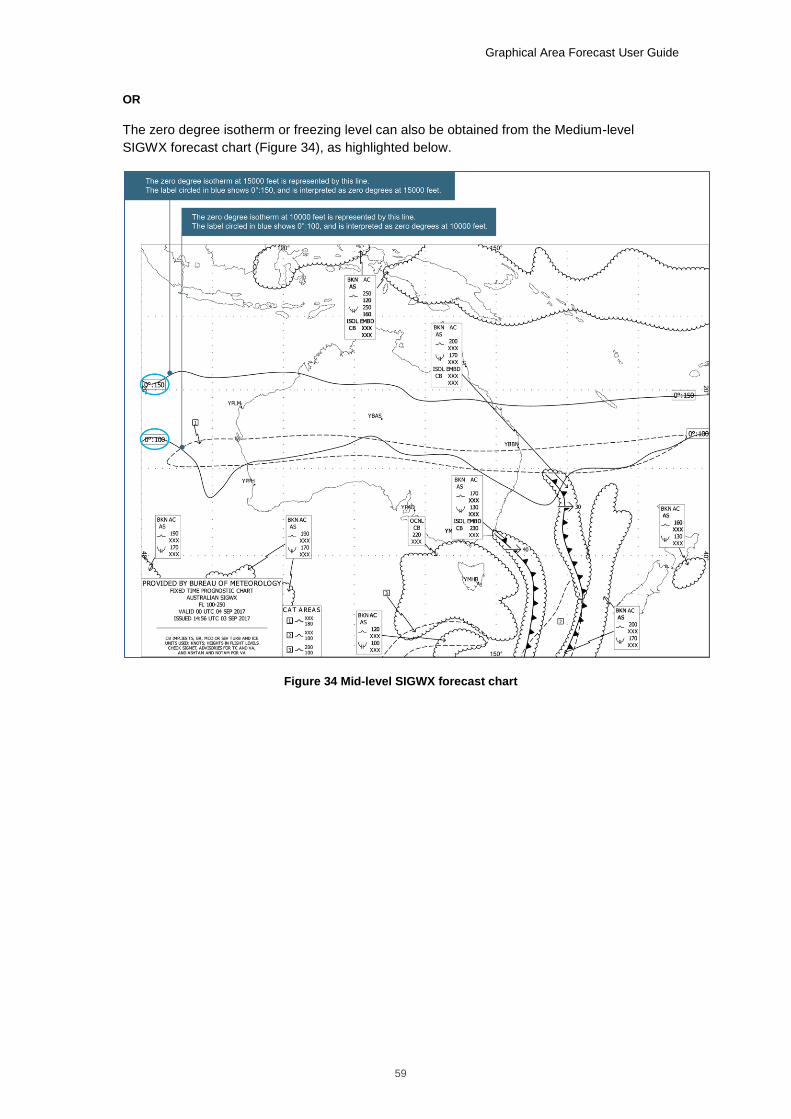
Graphical Area Forecast User Guide
59
OR
The zero degree isotherm or freezing level can also be obtained from the Medium-level
SIGWX forecast chart (Figure 34), as highlighted below.
Figure 34 Mid-level SIGWX forecast chart