groundwater levels, trends, and relations to pumping in ... · groundwater levels, trends, and...
TRANSCRIPT

U.S. Department of the InteriorU.S. Geological Survey
Open-File Report 2015–1145
Prepared in cooperation with the Klamath Water and Power Agency and the Oregon Water Resources Department
Groundwater Levels, Trends, and Relations to Pumping in the Bureau of Reclamation Klamath Project, Oregon and California
40
50
60
70
80
90
100
110
1201998 2000 2002 2004 2006 2008 2010 2012 2014 2016
Dep
th t
o w
ater
bel
ow l
and
surf
ace,
in fe
et
Year

Cover: Top left: Tulelake Irrigation District Well 1, October 2001. Photograph by Marshall Gannett. Top right: Flow meter on well in southern Tule Lake subbasin, October 2001. Photograph by Marshall Gannett. Bottom left: USGS Hydrologic Technician recording water levels in the southern Tule Lake Basin, May 2001. Photograph by Marshall Gannett. Bottom right: Graph showing water levels in well 41S/12E-10CCC1 (USGS SiteID 420116121241801) near Malin, Oregon.

Groundwater Levels, Trends, and Relations to Pumping in the Bureau of Reclamation Klamath Project, Oregon and California
By Marshall W. Gannett and Katherine H. Breen
Prepared in cooperation with the Klamath Water and Power Agency and the Oregon Water Resources Department
Open-File Report 2015–1145
U.S. Department of the Interior U.S. Geological Survey
U.S. Department of the Interior SALLY JEWELL, Secretary
U.S. Geological Survey Suzette M. Kimball, Acting Director
U.S. Geological Survey, Reston, Virginia: 2015
For more information on the USGS—the Federal source for science about the Earth, its natural and living resources, natural hazards, and the environment—visit http://www.usgs.gov or call 1–888–ASK–USGS (1–888–275–8747)
For an overview of USGS information products, including maps, imagery, and publications, visit http://www.usgs.gov/pubprod
Any use of trade, firm, or product names is for descriptive purposes only and does not imply endorsement by the U.S. Government.
Although this information product, for the most part, is in the public domain, it also may contain copyrighted materials as noted in the text. Permission to reproduce copyrighted items must be secured from the copyright owner.
Suggested citation: Gannett, M.W., and Breen, K.H., 2015, Groundwater levels, trends, and relations to pumping in the Bureau of Reclamation Klamath Project, Oregon and California: U.S. Geological Survey Open-File Report 2015-1145, 19 p., http://dx.doi.org/10.3133/ofr20151145.
ISSN 2331-1258 (online)

iii
Contents Abstract ...................................................................................................................................................................... 1 Introduction ................................................................................................................................................................. 1
Purpose of this Report ............................................................................................................................................ 2 Scope of the Investigation ....................................................................................................................................... 2
Groundwater Pumping ................................................................................................................................................ 4 Groundwater-Level Changes ...................................................................................................................................... 5 Relation between Pumping and Groundwater-Level Changes ................................................................................. 14 Anticipated Effects of Groundwater Pumping ........................................................................................................... 18 Summary and Discussion ......................................................................................................................................... 19 Acknowledgments ..................................................................................................................................................... 19 References Cited ...................................................................................................................................................... 19
Figures Figure 1. Location of monitored wells and their associated subgroupings in and around the Bureau of Reclamation Klamath Project, Oregon and California. ................................................................................................................... 3 Figure 2. Typical hydrograph for a monitored well in the area of the Bureau of Reclamation Klamath Project showing spring-to-fall and spring-to-following-spring water-level declines, Oregon and California, 1999–2015. ....... 6 Figure 3. Median water-level changes for spring-to-summer, spring-to-fall, and spring-to-following-spring periods, Klamath Valley subarea, Oregon, 2001–2014. .......................................................................................................... 9 Figure 4. Median water-level changes in spring-to-summer, spring-to-fall, and spring-to-following-spring periods, northern Tule Lake subarea, Oregon and California, 2000–2014. ............................................................................. 9 Figure 5. Median water-level changes in spring-to-summer, spring-to-fall, and spring-to-following-spring periods, southern Tule Lake subarea, Oregon and California, 2000–2014. .......................................................................... 10 Figure 6. Cumulative median spring-to-following-spring water-level changes, Klamath Valley subarea, Oregon, 2000–2014. .............................................................................................................................................................. 11 Figure 7. Cumulative median spring-to-following-spring water-level changes, northern Tule Lake subarea, Oregon and California, 2000–2014. ...................................................................................................................................... 11 Figure 8. Cumulative median spring-to-following-spring water-level changes, southern Tule Lake subarea, Oregon and California, 2000–2014. ...................................................................................................................................... 12 Figure 9. Groundwater-level declines at individual wells in and around the Bureau of Reclamation Klamath Project, Oregon and California, 2004–2014. ......................................................................................................................... 13 Figure 10. Median spring-to-fall groundwater-level change as a function of annual Project pumping in the Klamath Valley subarea, Oregon, 2002–2014. ...................................................................................................................... 14 Figure 11. Median spring-to-following-spring groundwater-level change as a function of annual Project pumping in the Klamath Valley subarea, Oregon, 2002–2014. .................................................................................................. 15 Figure 12. Median spring-to-fall groundwater-level change as a function of annual Project pumping in the northern Tule Lake subarea, Oregon and California, 2000–2014. ......................................................................................... 15 Figure 13. Median spring-to-following-spring groundwater-level change as a function of annual Project pumping in the northern Tule Lake subarea, Oregon and California 2000–2014. ...................................................................... 16 Figure 14. Median spring-to-fall groundwater-level change as a function of annual Project pumping in the southern Tule Lake subarea, Oregon and California, 2000–2014. ......................................................................................... 16 Figure 15. Median spring-to-following-spring groundwater-level change as a function of annual Project pumping in the southern Tule Lake subarea, Oregon and California, 2000–2014. .................................................................... 17

iv
Tables Table 1. Annual supplemental groundwater pumping volumes, by subarea, for the Bureau of Reclamation Klamath Project, Oregon and California, 2001–2014. .............................................................................................................. 4 Table 2. Summary statistics of water-level changes for spring-to-summer, spring-to-fall, and spring-to-following-spring periods for Klamath Valley and northern and southern Tule Lake subareas, upper Klamath Basin, Oregon and California, 2000–2014. ........................................................................................................................................ 7 Table 3. Anticipated spring-to-fall and spring-to-following-spring groundwater-level changes associated with different levels of Project pumping in the Klamath Valley, and northern and southern Tule Lake subareas, Oregon and California........................................................................................................................................................... 18
Conversion Factors Multiply By To obtain
Length foot (ft) 0.3048 meter (m)
Volume acre-foot (acre-ft) 1,233 cubic meter (m3)
acre-foot (acre-ft) 0.001233 cubic hectometer (hm3)
Flow rate acre-foot per year (acre-ft/yr) 1,233 cubic meter per year (m3/yr)
acre-foot per year (acre-ft/yr) 0.001233 cubic hectometer per year (hm3/yr)
Datums Vertical coordinate information is referenced to the North American Vertical Datum of 1988 (NAVD 88)].
Horizontal coordinate information is referenced to the North American Datum of 1983 (NAD 83)].

1
Groundwater Levels, Trends, and Relations to Pumping in the Bureau of Reclamation Klamath Project, Oregon and California
By Marshall W. Gannett and Katherine H. Breen
Abstract The use of groundwater to supplement surface-water supplies for the Bureau of Reclamation
Klamath Project in the upper Klamath Basin of Oregon and California markedly increased between 2000 and 2014. Pre-2001 groundwater pumping in the area where most of this increase occurred is estimated to have been about 28,600 acre-feet per year. Subsequent supplemental pumping rates have been as high as 128,740 acre-feet per year. During this period of increased pumping, groundwater levels in and around the Bureau of Reclamation Klamath Project have declined by about 20–25 feet. Water-level declines are largely due to the increased supplemental pumping, but other factors include increased pumping adjacent to the Klamath Project and drying climate conditions. This report summarizes the distribution and magnitude of supplemental groundwater pumping and groundwater-level declines, and characterizes the relation between the stress and response in subareas of the Klamath Project to aid decision makers in developing groundwater-management strategies.
Introduction Groundwater has been used for irrigation in the upper Klamath Basin of Oregon and California
for many decades. The use of groundwater to supplement surface-water supplies on the Bureau of Reclamation Klamath Project (hereinafter referred to as the “Project”), however, increased markedly after 2000 as a result of changes in surface-water allocations. Much of the increased supplemental pumping has been associated with a pilot water bank and similar agency-sponsored programs under which well owners have been contracted to supply water to the Project.
The increased pumping in the Project has caused localized increases in seasonal drawdown and generally continuous year-to-year water-level declines. These effects are a cause for concern among groundwater users and agencies tasked with maintaining stable water levels and managing aquifers for sustainable use. There is an extensive dataset of supplemental pumping volumes and corresponding water-level changes that can be used to inform groundwater-management strategies and decisions.
Groundwater use in the upper Klamath Basin can be categorized as primary, meaning that it is the sole source of irrigation water for a parcel of land, or supplemental, meaning it is used only when a primary surface-water source is not available. Groundwater pumping not associated with the Project is referred to hereinafter as background pumping. Groundwater pumping for the Project contracted by Reclamation or the Klamath Water and Power Agency is all supplemental and is referred to hereinafter as Project pumping.

2
Purpose of this Report This report summarizes the volumes and geographic distribution of recent Project pumping, as
well as corresponding groundwater-level changes in key areas in and around the Project where Project-related pumping has been greatest. The goal is to provide an empirical understanding of the relation between measured pumping and water-level changes in order to inform groundwater-management decisions. The analyses and resulting graphics in this report can be updated on a regular basis to provide resource managers and water users with the most current information.
Scope of the Investigation This study focused on three subareas of the Project—the Klamath Valley and the northern and
southern parts of the Tule Lake subbasin (fig. 1). Most supplemental pumping for the Project is from these three subareas, and they are where changes in water levels have been the largest. Other areas are not discussed because Project pumping is minimal and (or) historical monitoring data are too sparse for analysis. The analysis period is 2000–2014. Project pumping increased during this period and information on pumping volumes is available. Comprehensive groundwater-level monitoring in the upper Klamath Basin began in 2001.

3
Figure 1. Location of monitored wells and their associated subgroupings in and around the Bureau of Reclamation Klamath Project, Oregon and California.

4
Groundwater Pumping Groundwater pumping for the Project generally is metered, so the geographic distribution and
volumes are reasonably well known (table 1). There was no Project pumping in 2000, and that year is taken to represent background conditions. Project pumping data for 2001–2007 were collected by the Bureau of Reclamation (Reclamation), and data for 2010–2014 were collected by the Klamath Water and Power Agency. Pumping records for wells operated by the Tule Lake Irrigation District (TID), which encompasses the California part of the Tule Lake subbasin, are maintained by the district. No contracted pumping on the Project occurred during 2008, 2009, and 2011. During the 2002 irrigation season, only a small amount of Project pumping occurred, and it was entirely from the TID wells. Annual Project pumping ranged from 0 to 128,740 acre-ft, averaging about 48,000 acre-ft/yr between 2001 and 2014 (about 61,000 acre-ft/yr for the years when there was pumping). To understand the relative influence of the Project pumping stress, it is helpful to have estimates of background pumping.
Table 1. Annual supplemental groundwater pumping volumes, by subarea, for the Bureau of Reclamation Klamath Project, Oregon and California, 2001–2014. [Data for 2001–2007 were collected by the Bureau of Reclamation (Reclamation), and data for 2010–2014 were collected by the Klamath Water and Power Agency. Volumes in acre-feet]
Year Subarea Total
project pumping Other Sprague
River Upper
Lost River Klamath Valley
Northern Tule Lake
Southern Tule Lake
Lower Klamath
Lake 2001 – – 9,956 9,933 17,692 32,015 – 69,236
2002 – – – – 16,925 1,644 – 18,569
2003 – – 931 10,129 22,915 18,833 2,859 55,667
2004 12,051 376 – 23,991 19,146 16,572 1,734 73,870
2005 – – – 20,705 21,139 23,300 567 65,710
2006 463 184 – 7,820 11,611 12,662 – 32,740
2007 – – – 15,516 18,424 13,681 – 47,621
2008 – – – – – – – –
2009 – – – – – – – –
2010 – – 2,486 24,508 69,425 29,451 2,871 128,740
2011 – – – – – – – –
2012 – – – 10,833 5,636 12,666 1,229 30,363
2013 – – – 18,844 20,653 23,706 1,485 64,688
2014 – – – 19,193 25,656 35,918 2,689 83,456
5
There is no comprehensive systematic measurement of background (non-Project) groundwater use in the upper Klamath Basin. General information on groundwater irrigation is available from the water rights records in Oregon and land and water surveys in California. These data sources provide information on where groundwater irrigation is legally or historically practiced that can be used, along with other information, to estimate non-metered groundwater pumping.
Primary groundwater pumping in the lower Lost River subbasin (which includes the Klamath Valley and Tule Lake subareas of the Project) in 2000 was estimated to have been about 11,500 acre-ft (Gannett and others, 2007). About 8,500 acre-ft of this amount is estimated to have been pumped in California (Bill Ehorn, California Department of Water Resources, oral commun., 2015). Pumping in the Lower Klamath Lake subbasin (which also includes part of the Project) in 2000 was estimated by Gannett and others (2007) to have been about 17,100 acre-ft. This means that primary groundwater pumping in the area where most Project pumping now occurs was roughly 28,600 acre-ft in 2000. This estimate likely is conservative because it does not include non-Project supplemental pumping.
Groundwater-Level Changes Groundwater levels have been monitored in or near the Klamath Project for many decades. The
number of monitored wells and the frequency of monitoring increased markedly between the late 1990s and 2001. Monitoring is conducted by the Oregon Water Resources Department, the California Department of Water Resources, the U.S. Geological Survey, and TID. About 130 wells are monitored in the Klamath Valley and Tule Lake subareas, and another 47 wells in the upper Lost River subbasin.
Groundwater levels in the upper Klamath Basin respond to variations in recharge, pumping, and the stage in surface-water features (Gannett and others, 2007). The ways in which wells respond to these stresses depend on well depth and location. Variations in recharge are caused by the timing of precipitation and snowmelt, drought cycles, and long-term climate trends. Groundwater levels generally rise during wet years and decline during dry years. Groundwater levels in shallow wells in the Project commonly rise during the irrigation season due to secondary recharge from canal seepage, and decline when the irrigation season ends. Groundwater pumping for irrigation, which primarily is from deep wells producing from the volcanic aquifer, commonly results in seasonal water-level declines in wells that penetrate the volcanic aquifer. Full or partial recovery from seasonal declines can occur after the irrigation season. If the pumping stress is large and the water-level recovery is not complete before the onset of pumping the following year, year-to-year water-level declines will result. Water levels in wells very close to Upper Klamath Lake rise and decline in response to lake stage.
The predominant patterns observed in groundwater levels in and around the Project are seasonal pumping effects and year-to-year changes (fig. 2). Seasonal pumping effects manifest as water-level declines between spring and fall (usually measured in April and October) and generally are followed by water-level recoveries. Year-to-year changes manifest as either rises or, more commonly, declines in water level from one spring to the next (usually measured in April). In this report, winter, spring, summer, and fall periods correspond to January–March, April–June, July–September, and October–December, respectively. Year-to-year trends historically have been downward during droughts and upward during wet periods.

6
30
40
50
60
70
80
90
100
1999
2000
2001
2002
2003
2004
2005
2006
2007
2008
2009
2010
2011
2012
2013
2014
2015
Dept
h to
Wat
er (f
eet b
elow
land
surf
ace)
Year
Spring-to-following-spring (year-to-year) change
Spring-to-fall (seasonal) change
Figure 2. Typical hydrograph for a monitored well in the area of the Bureau of Reclamation Klamath Project showing spring-to-fall and spring-to-following-spring water-level declines, Oregon and California, 1999–2015.
Groundwater-level patterns and trends in the Project area were determined by calculating spring-to-summer and spring-to-fall water-level changes in each monitored well every year. These values are an indicator of seasonal pumping effects on groundwater levels in the Project area. Spring-to-summer declines were greater than spring-to-fall declines in some years because of variations in the timing of pumping during the irrigation season. Spring-to-following-spring water levels were also calculated every year for each well. These spring-to-spring values reflect residual pumping effects as well as climate trends. The values for each year were aggregated by subarea, and median values were determined for each year (table 2 and figs. 3–5). This provides a general overview of water-level changes in each subarea of the Project. Because the goal of this exercise is to understand the relation between pumping and water levels in the producing aquifer, wells that respond primarily to canal operation (generally shallow wells) were not included in the analysis.

7
Table 2. Summary statistics of water-level changes for spring-to-summer, spring-to-fall, and spring-to-following-spring periods for Klamath Valley and northern and southern Tule Lake subareas, upper Klamath Basin, Oregon and California, 2000–2014. [Changes are in feet; negative numbers indicate water-level declines. Abbreviations: Min, minimum; Avg, average; Med, median; Max, maximum; Num, number of sites included in calculations]
Year Water-level change
Spring-to-summer Spring-to-fall Spring-to-following-spring Min Avg Med Max Num Min Avg Med Max Num Min Avg Med Max Num
Klamath Valley subarea 2000 -16.7 -16.7 -16.7 -16.7 1 -16.6 -16.6 -16.6 -16.6 1 -
11 10 -4.05 -4.05 3.00 2
2001 -13.6 -7.2 -6.0 -3.3 4 -30.8 -18.0 -14.7 -12.5 5 -19.0 -11.2 -10.8 -4.9 6 2002 -5.7 -0.6 -1.9 4.2 6 -1.3 2.9 1.9 7.3 8 -0.2 5.8 5.7 9.6 8 2003 -41.3 -11.6 -5.9 -0.9 14 -47.3 -13.8 -13.8 -2.8 14 -34.2 -7.4 -5.5 -2.7 16 2004 -22.0 -12.7 -12.4 -1.6 12 -19.3 -10.5 -9.4 -2.9 15 -4.8 -0.2 -2.3 14.5 16 2005 -31.4 -14.9 -12.9 -1.9 12 -17.9 -12.4 -13.4 -6.2 10 -13.8 -1.5 -1.6 2.6 16 2006 -18.6 -9.4 -11.7 0.8 12 -14.0 -5.4 -6.9 1.5 16 -4.7 0.4 0.7 1.9 16 2007 -27.0 -2.1 -0.9 2.6 13 -15.3 -7.7 -9.1 -0.6 15 -8.3 -1.1 -0.9 1.8 16 2008 -0.7 1.1 0.3 3.9 14 -2.7 2.3 1.7 7.1 16 -3.0 4.0 5.0 11.1 17 2009 -3.6 -0.5 -0.9 2.4 12 -3.2 0.3 -0.7 5.5 14 -1.1 2.0 1.5 14.8 14 2010 -32.2 -19.8 -18.4 -8.2 12 -30.8 -21.4 -20.5 -12.8 14 -15.1 -10.4 -12.1 2.8 16 2011 0.7 2.4 2.7 4.0 13 -9.8 3.6 4.7 8.5 14 -2.0 7.0 7.5 12.7 15 2012 -34.3 -5.5 -4.9 2.1 14 -14.7 -10.0 -11.4 -3.5 13 -4.8 -3.6 -4.3 0.6 15 2013 -23.4 -15.5 -17.3 -3.9 12 -20.7 -12.3 -11.1 -1.2 14 -6.4 -5.0 -5.1 -3.6 14 2014 -20.3 -13.8 -13.0 -1.3 11 -21.1 -12.7 -11.5 -0.8 13 -5.5 -2.7 -2.9 0.4 13
Northern Tule Lake subarea 2000 -6.0 -0.9 -1.2 8.5 16 -9.7 -0.3 -0.1 6.3 24 -5.3 0.0 0.1 7.0 27 2001 -20.6 -9.6 -10.0 -1.5 24 -36.4 -13.9 -14.3 -1.2 30 -14.0 -6.0 -6.6 8.1 31 2002 -13.0 -3.4 -2.7 3.3 43 -26.6 -8.6 -7.7 0.9 45 -19.2 -0.9 -0.6 6.5 48 2003 -239.6 -13.0 -6.0 0.1 45 -17.1 -7.9 -7.7 -0.7 50 -12.2 -2.8 -2.7 6.5 52 2004 -103.1 -10.7 -6.8 0.7 43 -37.0 -4.7 -4.7 3.1 51 -8.0 -0.5 -0.5 5.8 53 2005 -151.8 -13.0 -6.8 0.4 43 -17.5 -6.9 -8.0 3.1 49 -4.7 -1.4 -1.6 2.1 54 2006 -156.7 -11.6 -6.2 -0.2 50 -8.0 -2.7 -2.7 3.6 51 -6.0 0.1 0.2 3.4 55 2007 -30.8 -2.2 -1.0 15.3 49 -16.5 -4.8 -4.9 0.1 51 -4.0 -0.3 -0.6 3.9 52 2008 -12.8 -1.1 -1.0 13.8 46 -19.9 -0.9 -0.5 11.0 51 -4.5 0.7 0.9 5.6 53 2009 -12.7 -2.1 -2.0 8.2 43 -10.1 -1.5 -1.3 8.1 51 -15.4 -2.3 -0.9 1.9 52 2010 -37.9 -13.7 -15.2 -0.2 43 -19.0 -10.8 -11.9 -0.3 51 -13.0 -3.7 -4.9 10.9 52 2011 -8.3 0.1 -0.5 19.7 48 -3.5 1.3 0.4 16.5 40 -3.4 1.5 1.6 6.6 53 2012 -13.1 -2.2 -2.9 12.1 46 -14.5 -1.8 -2.3 9.7 51 -10.0 -1.3 -0.9 4.8 54 2013 -20.0 -7.3 -7.8 5.2 48 -17.6 -6.7 -7.5 6.9 51 -9.9 -3.1 -3.5 5.7 54 2014 -20.1 -9.6 -11.7 -0.3 41 -21.6 -9.9 -10.7 1.7 53 -8.6 -3.1 -3.5 2.9 54

8
Year Water-level change
Spring-to-summer Spring-to-fall Spring-to-following-spring Min Avg Med Max Num Min Avg Med Max Num Min Avg Med Max Num
Southern Tule Lake subarea 2000 -0.2 -0.2 -0.2 -0.2 1 -0.1 0.8 0.6 2.6 12 -8.9 -1.1 -0.5 0.7 12
2001 -47.0 -12.8 -7.4 -3.1 9 -49.9 -12.8 -6.9 1.5 10 -8.1 -3.9 -3.9 0.4 11
2002 -3.8 -1.2 -1.2 0.8 13 -13.2 -2.1 -1.5 0.5 14 -4.4 -0.2 -0.7 2.9 15
2003 -38.4 -7.5 -2.2 -0.3 14 -14.1 -3.0 -2.3 2.3 14 -4.2 -2.4 -2.7 3.3 15
2004 -35.2 -3.2 -0.8 1.8 13 -8.5 -1.8 -1.5 0.9 12 -3.1 -0.7 -0.8 1.0 14
2005 -23.1 -5.7 -3.0 -1.1 8 -13.0 -4.8 -3.8 -1.0 14 -5.1 -1.8 -1.5 -0.3 14
2006 -31.1 -5.4 -1.4 0.0 9 -10.0 -3.0 -1.7 1.1 14 -2.4 -0.4 -0.3 2.5 14
2007 -33.0 -3.6 -0.6 1.5 14 -15.7 -3.6 -2.0 1.1 13 -2.3 0.3 0.2 5.2 15
2008 -14.4 -4.2 -2.6 -0.5 11 -9.2 -3.1 -2.0 0.8 13 -6.2 -1.3 -1.5 1.1 13
2009 -11.5 -2.9 -2.8 0.8 15 -6.0 -2.1 -1.7 1.6 17 -18.1 -3.4 -1.5 0.4 16
2010 -17.5 -6.4 -5.3 -0.1 10 -18.1 -6.4 -5.5 0.5 13 -9.4 -5.0 -4.2 0.9 14
2011 -1.3 0.1 -0.2 1.9 9 -2.2 1.4 0.3 9.9 8 -7.7 0.4 0.0 13.6 14
2012 -5.6 -1.2 -1.6 1.4 13 -1.5 0.2 0.7 2.1 12 -3.5 -1.1 -1.3 4.7 14
2013 -18.4 -3.4 -1.8 1.9 6 -13.0 -3.0 -2.1 1.2 6 -2.3 -1.1 -1.4 1.4 6
2014 -14.5 -4.6 -3.6 0.4 13 -13.1 -3.3 -3.2 0.2 14 -3.1 -1.1 -0.7 2.4 14

9
-25
-20
-15
-10
-5
0
5
10
2001
2002
2003
2004
2005
2006
2007
2008
2009
2010
2011
2012
2013
2014
Wat
er-L
evel
Cha
nge
(ft)
Year
Spring to Summer
Spring to Fall
Spring to Following Spring
Figure 3. Median water-level changes for spring-to-summer, spring-to-fall, and spring-to-following-spring periods, Klamath Valley subarea, Oregon, 2001–2014. Year 2000 is not included because the number of monitored wells was too small to be representative.
-20
-15
-10
-5
0
5
2000
2001
2002
2003
2004
2005
2006
2007
2008
2009
2010
2011
2012
2013
2014
Wat
er-L
evel
Cha
nge
(ft)
Year
Spring to Summer
Spring to Fall
Spring to Following Spring
Figure 4. Median water-level changes in spring-to-summer, spring-to-fall, and spring-to-following-spring periods, northern Tule Lake subarea, Oregon and California, 2000–2014.
10
-15
-10
-5
0
5
2000
2001
2002
2003
2004
2005
2006
2007
2008
2009
2010
2011
2012
2013
2014
Wat
er-L
evel
Cha
nge
(ft)
Year
Spring to Summer
Spring to Fall
Spring to Following Spring
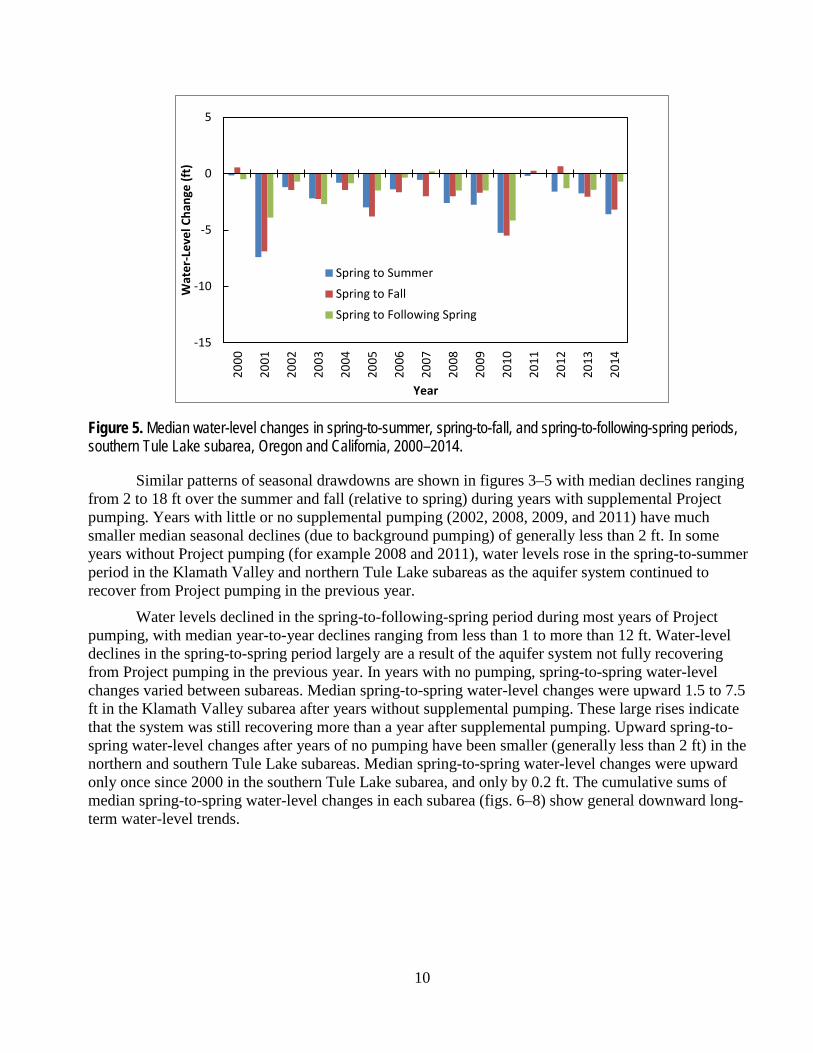
Figure 5. Median water-level changes in spring-to-summer, spring-to-fall, and spring-to-following-spring periods, southern Tule Lake subarea, Oregon and California, 2000–2014.
Similar patterns of seasonal drawdowns are shown in figures 3–5 with median declines ranging from 2 to 18 ft over the summer and fall (relative to spring) during years with supplemental Project pumping. Years with little or no supplemental pumping (2002, 2008, 2009, and 2011) have much smaller median seasonal declines (due to background pumping) of generally less than 2 ft. In some years without Project pumping (for example 2008 and 2011), water levels rose in the spring-to-summer period in the Klamath Valley and northern Tule Lake subareas as the aquifer system continued to recover from Project pumping in the previous year.
Water levels declined in the spring-to-following-spring period during most years of Project pumping, with median year-to-year declines ranging from less than 1 to more than 12 ft. Water-level declines in the spring-to-spring period largely are a result of the aquifer system not fully recovering from Project pumping in the previous year. In years with no pumping, spring-to-spring water-level changes varied between subareas. Median spring-to-spring water-level changes were upward 1.5 to 7.5 ft in the Klamath Valley subarea after years without supplemental pumping. These large rises indicate that the system was still recovering more than a year after supplemental pumping. Upward spring-to-spring water-level changes after years of no pumping have been smaller (generally less than 2 ft) in the northern and southern Tule Lake subareas. Median spring-to-spring water-level changes were upward only once since 2000 in the southern Tule Lake subarea, and only by 0.2 ft. The cumulative sums of median spring-to-spring water-level changes in each subarea (figs. 6–8) show general downward long-term water-level trends.

11
-30
-25
-20
-15
-10
-5
0
2000
2001
2002
2003
2004
2005
2006
2007
2008
2009
2010
2011
2012
2013
2014
Cum
ulat
ive
Wat
er-L
evel
Cha
nge
(ft)
Year
Figure 6. Cumulative median spring-to-following-spring water-level changes, Klamath Valley subarea, Oregon, 2000–2014. The initial 4-foot decline in 2000 (spring 2000–spring 2001) is based on data from only two wells.
-25
-20
-15
-10
-5
0
5
2000
2001
2002
2003
2004
2005
2006
2007
2008
2009
2010
2011
2012
2013
2014
Cum
ulat
ive
Wat
er-L
evel
Cha
nge
(ft)
Year
Figure 7. Cumulative median spring-to-following-spring water-level changes, northern Tule Lake subarea, Oregon and California, 2000–2014.

12
-25
-20
-15
-10
-5
0
5
2000
2001
2002
2003
2004
2005
2006
2007
2008
2009
2010
2011
2012
2013
2014
Cum
ulat
ive
Wat
er-L
evel
Cha
nge
(ft)
Year
Figure 8. Cumulative median spring-to-following-spring water-level changes, southern Tule Lake subarea, Oregon and California, 2000–2014.

13
The 20–25 foot water-level declines shown in figures 6–8 are consistent with water-level change maps. Water-level changes at individual wells between spring 2004 and spring 2014 in and around the Klamath Project are shown in figure 9.
Figure 9. Groundwater-level declines at individual wells in and around the Bureau of Reclamation Klamath Project, Oregon and California, 2004–2014.

14
Relation between Pumping and Groundwater-Level Changes Supplemental groundwater pumping and median groundwater-level changes in specific subareas
are strongly related (figs. 10–15). The strong relation (coefficient of determination [R2] values range from about 0.28 to 0.89) stems from the fact that Project pumping is the single largest factor influencing water levels in those subareas. Secondary factors causing scatter on the plots include background pumping, canal leakage, climate influences, and antecedent conditions (pumping during preceding years).
y = -0.000678x + 0.257582R² = 0.750163
-25
-20
-15
-10
-5
0
5
10
0 5,000 10,000 15,000 20,000 25,000 30,000
Sprin
g to
Fal
l W
ater
Lev
el C
hang
e (ft
)
Annual Project Pumping in Area (AF)
Figure 10. Median spring-to-fall groundwater-level change as a function of annual Project pumping in the Klamath Valley subarea, Oregon, 2002–2014.

15
y = -0.000443x + 4.067506R² = 0.626791
-15
-10
-5
0
5
10
0 5,000 10,000 15,000 20,000 25,000 30,000Sprin
g to
Spr
ing
Wat
er L
evel
Cha
nge
(ft)
Annual Project Pumping in Area (AF)
Figure 11. Median spring-to-following-spring groundwater-level change as a function of annual Project pumping in the Klamath Valley subarea, Oregon, 2002–2014.
y = -0.000344x - 0.147902R² = 0.891657
-20
-15
-10
-5
0
5
0 20,000 40,000 60,000 80,000
Sprin
g to
Fal
l W
ater
Lev
el C
hang
e (ft
)
Annual Project Pumping in Area (AF)
Figure 12. Median spring-to-fall groundwater-level change as a function of annual Project pumping in the northern Tule Lake subarea, Oregon and California, 2000–2014. Year 2001 is not included because water levels were affected by the curtailment of Project surface-water deliveries. Year 2010 (red square) is not included in the regression because it is an outlier and does not represent probable future conditions.

16
y = -0.000118x + 0.536746R² = 0.576810
-6
-5
-4
-3
-2
-1
0
1
2
0 20,000 40,000 60,000 80,000Sprin
g to
Spr
ing
Wat
er L
evel
Cha
nge
(ft)
Annual Project Pumping in Area (AF)
Figure 13. Median spring-to-following-spring groundwater-level change as a function of annual Project pumping in the northern Tule Lake subarea, Oregon and California 2000–2014. Year 2001 is not included because water levels were affected by the curtailment of Project surface-water deliveries. Year 2010 (red square) is not included in the regression because it is an outlier and does not represent probable future conditions.
y = -0.000122x - 0.378613R² = 0.539702
-8-7-6-5-4-3-2-1012
0 10,000 20,000 30,000 40,000
Sprin
g to
Fal
l W
ater
Lev
el C
hang
e (ft
)
Annual Project Pumping in Area (AF)
Figure 14. Median spring-to-fall groundwater-level change as a function of annual Project pumping in the southern Tule Lake subarea, Oregon and California, 2000–2014.

17
y = -0.000054x - 0.594514R² = 0.276793
-5
-4
-3
-2
-1
0
1
0 10,000 20,000 30,000 40,000Sprin
g to
Spr
ing
Wat
er L
evel
Cha
nge
(ft)
Annual Project Pumping in Area (AF)
Figure 15. Median spring-to-following-spring groundwater-level change as a function of annual Project pumping in the southern Tule Lake subarea, Oregon and California, 2000–2014.
Median spring-to-fall and spring-to-following-spring water-level changes are shown in figures 10 and 11, respectively, as a function of Project pumping in the Klamath Valley area from 2002 to 2014. Year 2000 was not included because too few wells were measured in the Klamath Valley subarea to provide meaningful results. Year 2001 was not included because groundwater levels were heavily influenced by the curtailment of Project surface-water deliveries that year. Years with no Project supplemental groundwater pumping commonly showed groundwater-level rises during both spring-to-fall and spring-to-following-spring periods. This is due in part to continued recovery from previous pumping (antecedent condition).
Median spring-to-fall and spring-to-following-spring water-level changes are shown in figures 12 and 13, respectively, as a function of Project pumping in the northern Tule Lake subarea from 2000 to 2014. Data from 2010, when nearly 70,000 acre-ft of groundwater was pumped in this subarea, were not included in the regressions in figures 12 and 13 because they are outliers and do not represent probable future pumping conditions. As with the Klamath Valley subarea, year 2001 was not included because groundwater levels were affected by the curtailment of Project surface-water deliveries that year. Years with no Project groundwater pumping showed positive and negative groundwater-level changes during the spring-to-fall and spring-to-following-spring periods. This is because of the varying influence of recovery and background pumping.
Median spring-to-fall and spring-to-following-spring water-level changes are shown in figures 14 and 15, respectively, as a function of Project pumping in the southern Tule Lake subarea from 2000 to 2014. All years are included because the curtailment of surface-water deliveries in 2001 had minimal influence on groundwater levels in this subarea. Years with no Project pumping showed both positive and negative spring-to-fall groundwater-level changes suggesting varying influences of recovery and background pumping. Spring-to-following-spring groundwater-level trends have been negative (downward) in most years without Project pumping, suggesting the influence of background pumping.

18
Anticipated Effects of Groundwater Pumping The relations shown in figures 10–15 can be used to provide insights regarding probable water-
level changes in response to specific volumes of Project pumping. The equations for the linear regression lines in figures 10–15 were used to develop a table showing anticipated spring-to-fall and spring-to-following-spring groundwater-level changes in each subarea given different annual pumping volumes (table 3). The pumping volumes represent the Project pumping from the individual subareas.
The information in table 3 is intended to provide only general insights regarding the response of groundwater levels to different annual pumping volumes. The R2 values of the regressions indicate that Project pumping explains only part of the measured groundwater-level changes. Other influences, such as background pumping, climate, and antecedent conditions, also affect water levels. The scatter in figures 10–15 provides a general sense of the uncertainty of the linear models. For example, an anticipated water-level change from spring to fall of about -16 ft would be associated with 24,000 acre-ft of supplemental pumping in the Klamath Valley subarea (table 3; extrapolating between 20,000 and 25,000 acre-ft values). The measured spring-to-fall water-level changes associated with 24,000 acre-ft of pumping in the Klamath Valley subarea (fig. 10) ranged from about -9.4 ft in 2004 to about -20.5 ft in 2010, with the larger 2010 decline partly because of massive pumping in the adjacent area. The empirical relation between Project pumping and groundwater-level changes will improve as more data become available.
Table 3. Anticipated spring-to-fall and spring-to-following-spring groundwater-level changes associated with different levels of Project pumping in the Klamath Valley, and northern and southern Tule Lake subareas, Oregon and California. [Numbers based on linear regression of annual pumping volumes and median water-level changes in the associated subareas. Negative values indicate groundwater-level declines]
Pumping in subarea
(acre-feet per year)
Water-level changes (feet)
Spring to fall Spring to spring Klamath Valley
Northern Tule Lake
Southern Tule Lake
Klamath Valley
Northern Tule Lake
Southern Tule Lake
0 0.3 -0.1 -0.4 4.1 0.5 -0.6 5,000 -3.1 -1.9 -1.0 1.9 -0.1 -0.9
10,000 -6.5 -3.6 -1.6 -0.4 -0.6 -1.1 15,000 -9.9 -5.3 -2.2 -2.6 -1.2 -1.4 20,000 -13.3 -7.0 -2.8 -4.8 -1.8 -1.7 25,000 -16.7 -8.7 -3.4 -7.0 -2.4 -1.9 30,000 – -10.5 -4.0 – -3.0 -2.2 35,000 – – -4.6 – – -2.5

19
Summary and Discussion Considerable information has been collected since 2001 on the spatial distribution and annual
volumes of groundwater pumped for supplemental use in the Bureau of Reclamation Klamath Project (the “Project”) in the upper Klamath Basin of Oregon and California. At the same time, groundwater levels have been intensely monitored through a collaborative multi-agency effort. Taken together, these datasets provide insight into the relation between Project pumping and the corresponding seasonal and year-to-year groundwater-level changes.
Plots of seasonal (spring-to-fall) and year-to-year (spring-to-following-spring) groundwater-level changes as a function of annual supplemental pumping volumes for subareas in the Project show a clear relation between the volume of pumping and groundwater-level changes. As anticipated, larger pumping volumes result in larger seasonal drawdown and larger year-to-year groundwater-level declines.
These relations were described statistically using linear regression. The resulting equations were then used to develop a table relating the expected spring-to-fall and spring-to-following-spring water-level changes associated with different annual volumes of Project groundwater pumping. The relation is intended to provide only general insights. Project pumping explains only part of the observed groundwater-level changes. Other influences, such as climate, background pumping, and antecedent conditions, also influence groundwater levels.
Graphs of the cumulative spring-to-spring groundwater-level changes show more or less continual declines throughout the Project since 2001. The median declines total about 20 feet in the northern and southern Tule Lake subareas, and about 25 feet in the Klamath Valley subarea.
The maintenance of stable groundwater levels and identification of sustainable pumping volumes are groundwater management goals in Oregon and California. It is outside the scope of this report and study to identify pumping volumes necessary to achieve these groundwater management goals. The empirical analyses in this report are intended to assist resource managers and water users in development of groundwater-management strategies.
Acknowledgments The authors gratefully acknowledge the cooperation and interest of water users and well owners
in the upper Klamath Basin for access to wells for monitoring. This report benefitted from helpful discussions with Ivan Gall, Karl Wozniak, and Jerry Grondin of the Oregon Water Resources Department, and Bill Ehorn and Glen Gordon of the California Department of Water Resources. Mike Neuman (Bureau of Reclamation, Klamath Basin Area Office), Julie Matthews (Klamath Water and Power Agency), Brad Kerby (Tulelake Irrigation District), and Karl Wozniak provided critical groundwater-pumping data.
References Cited Gannett, M.W., Lite, K.E. Jr., La Marche, J.L., Fisher, B.J., and Polette, D.J., 2007, Ground-water
hydrology of the upper Klamath Basin, Oregon and California: U.S. Geological Survey Scientific Investigations Report 2007-5050, 84 p.

Gannett and Breen—- Groundwater Levels, Trends, and Relations to Pum
ping in the Klamath Project, Oregon and California —
Open-File Report 2015–1145
ISSN 2331-1258 (online) http://dx.doi.org/10.3133/ofr20151145