healthwatch usa meeting
TRANSCRIPT
HealthWatch USA Meeting
Patrick Conway, M.D., MSc
CMS Chief Medical Officer
Director, Center for Clinical Standards and Quality
Acting Director, Center for Medicare and Medicaid Innovation
July 31, 2013

Discussion
• Our Goals and Early Results
• Value-based purchasing and quality
improvement programs
• 2014 Physician Fee Schedule Quality
Proposals
• Quality Measurement to Drive Improvement
• Future and Opportunities for collaboration

Size and Scope of
CMS Responsibilities
• CMS is the largest purchaser of health care in the world (approx
$900B per year)
• Combined, Medicare and Medicaid pay approximately one-third of
national health expenditures.
• CMS programs currently provide health care coverage to roughly
105 million beneficiaries in Medicare, Medicaid and CHIP (Children’s
Health Insurance Program); or roughly 1 in every 3 Americans.
• The Medicare program alone pays out over $1.5 billion in benefit
payments per day.
• CMS answers about 75 million inquiries annually.
• Millions of consumers will receive health care coverage through new
health insurance programs authorized in the Affordable Care Act.
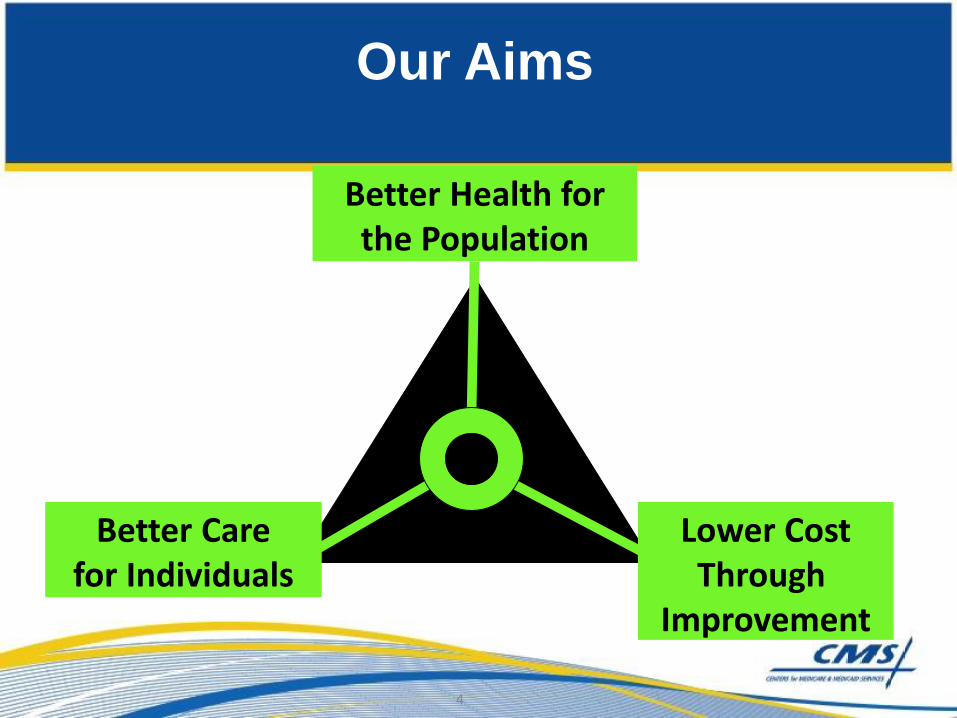
Better Health for the Population
Better Care for Individuals
Lower Cost Through
Improvement
Our Aims
4

How do we ensure quality care?
• Improvement as a
Strategy
• Customer-Mindedness
• Outcomes Focus
• Statistical Thinking
• Continual Improvement
(PDSA)
• Leadership
How Will Change Actually Happen?
• There is no “silver bullet”
• We must apply many incentives
• We must show successful alternatives
• We must offer intensive supports
– Help providers with the painstaking work
of improvement
• We must learn how to scale and spread
successful interventions
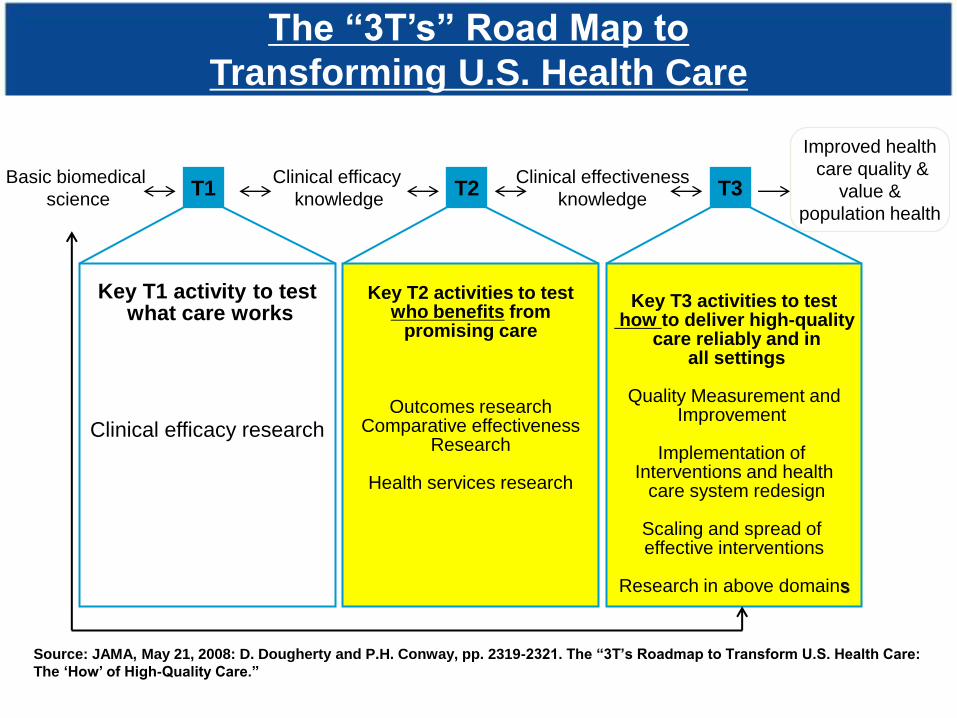
The “3T’s” Road Map to
Transforming U.S. Health Care
Key T1 activity to test what care works
Clinical efficacy research
Key T2 activities to test who benefits from
promising care
Outcomes research Comparative effectiveness
Research
Health services research
Key T3 activities to test
how to deliver high-quality care reliably and in
all settings
Quality Measurement and Improvement
Implementation of
Interventions and health care system redesign
Scaling and spread of effective interventions
Research in above domains
T1 T2 T3 Basic biomedical
science
Clinical efficacy
knowledge
Clinical effectiveness
knowledge
Improved health
care quality &
value &
population health
Source: JAMA, May 21, 2008: D. Dougherty and P.H. Conway, pp. 2319-2321. The “3T’s Roadmap to Transform U.S. Health Care:
The ‘How’ of High-Quality Care.”

Transformation of Health Care at
the Front Line
• At least six components
– Quality measurement
– Aligned payment incentives
– Comparative effectiveness and evidence available
– Health information technology
– Quality improvement collaboratives and learning
networks
– Training of clinicians and multi-disciplinary teams
8
Source: P.H. Conway and Clancy C. Transformation of Health Care
at the Front Line. JAMA 2009 Feb 18; 301(7): 763-5
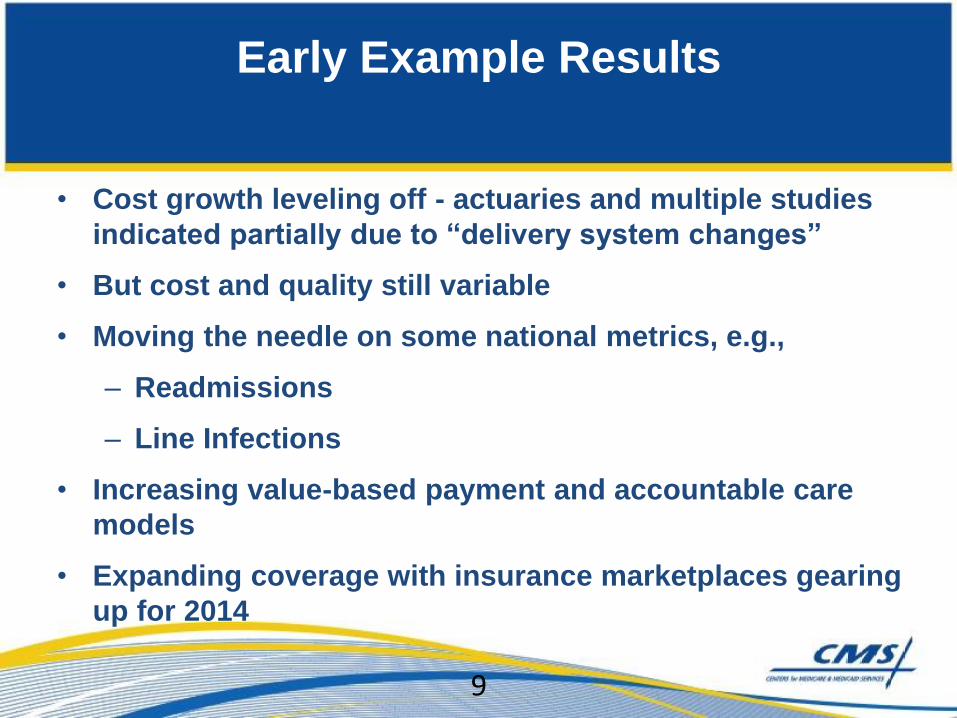
Early Example Results
• Cost growth leveling off - actuaries and multiple studies
indicated partially due to “delivery system changes”
• But cost and quality still variable
• Moving the needle on some national metrics, e.g.,
– Readmissions
– Line Infections
• Increasing value-based payment and accountable care
models
• Expanding coverage with insurance marketplaces gearing
up for 2014
9
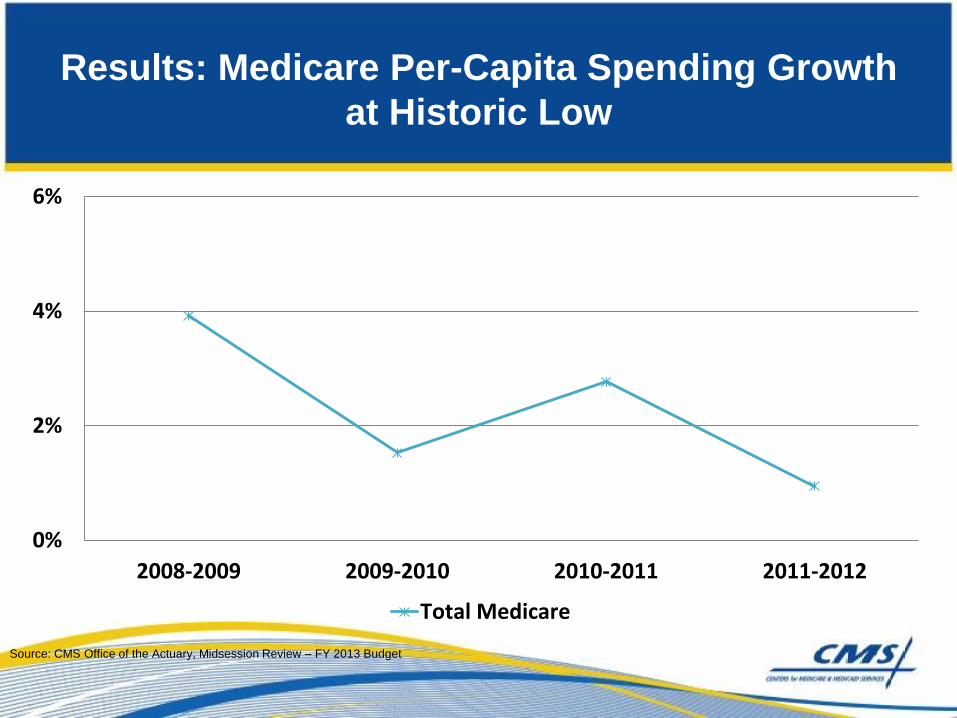
Results: Medicare Per-Capita Spending Growth
at Historic Low
0%
2%
4%
6%
2008-2009 2009-2010 2010-2011 2011-2012
Total Medicare
Source: CMS Office of the Actuary, Midsession Review – FY 2013 Budget

Wide Variation in Spending Across the Country
CT Scans Per Capita Spending* (2011)
Fort Myers, FL
$117 per capita
Honolulu, HI
$49 per
capita
National Average = $76
Ratio to the
national average
*includes institutional and professional
spending
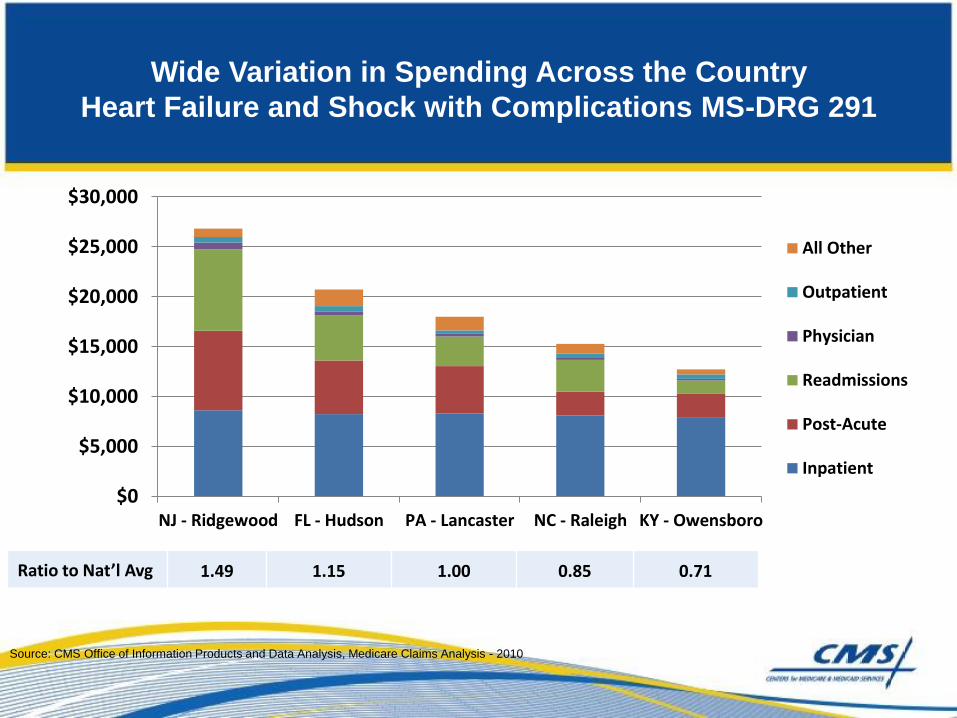
Wide Variation in Spending Across the Country
Heart Failure and Shock with Complications MS-DRG 291
$0
$5,000
$10,000
$15,000
$20,000
$25,000
$30,000
NJ - Ridgewood FL - Hudson PA - Lancaster NC - Raleigh KY - Owensboro
All Other
Outpatient
Physician
Readmissions
Post-Acute
Inpatient
Ratio to Nat’l Avg 1.49 1.15 1.00 0.85 0.71
Source: CMS Office of Information Products and Data Analysis, Medicare Claims Analysis - 2010

National Medicare 30 Day Readmissions

0
0.5
1
1.5
2
2.5
Baseline Q1 Q2 Q3 Q4 Q5 Q6
41 %
Reduction
1.133
CLA
BSI
s p
er
1,0
00
ce
ntr
al li
ne
day
s
Quarters of participation by hospital cohorts, 2009–2012
CLABSI Rate in CUSP
National Project
Over 1,000
ICUs
achieved an
average
41% decline
in CLABSI
over 6
quarters (18
months),
from 1.915
to 1.133
CLABSI per
1,000
central line
days.
Discussion
• Our Goals and Early Results
• Value-based purchasing and quality
improvement programs
• 2014 Physician Fee Schedule Quality
Proposals
• Quality Measurement to Drive Improvement
• Future and Opportunities for collaboration

The Six Goals of the CMS Quality
Strategy
Make care safer by reducing harm caused in the delivery of care
Strengthen person and family engagement as partners in their care
Promote effective communication and coordination of care
Promote effective prevention and treatment of chronic disease
Work with communities to promote healthy living
Make care affordable
1
2
3
4
5
6

17
Value-Based Purchasing
• Value-based purchasing is a tool that allows CMS to
link the National Quality Strategy with fee-for-service
payments at a national scale.
• It is an important driver in revamping how services are
paid for, moving increasingly toward rewarding
providers and health systems that deliver better
outcomes in health and health care at lower cost to the
beneficiaries and communities they serve.
• Hospital value-based purchasing program shifts
approximately $1 billion based on performance

18
Value-Based Purchasing
• Five Principles
- Define the end goal, not the process for achieving it
- All providers’ incentives must be aligned
- Right measure must be developed and implemented in
rapid cycle
- CMS must actively support quality improvement
- Clinical community and patients must be actively
engaged
VanLare JM, Conway PH. Value-Based Purchasing – National
Programs to Move from Volume to Value. NEJM July 26, 2012
19
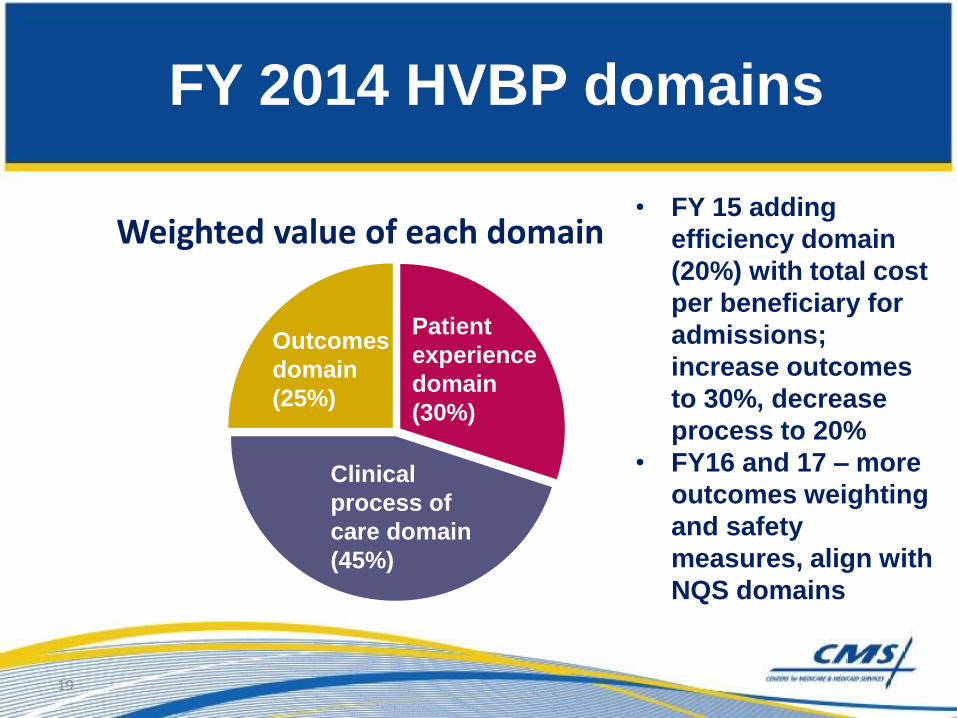
FY 2014 HVBP domains
Weighted value of each domain
Outcomes
domain
(25%)
Clinical
process of
care domain
(45%)
Patient
experience
domain
(30%)
• FY 15 adding
efficiency domain
(20%) with total cost
per beneficiary for
admissions;
increase outcomes
to 30%, decrease
process to 20%
• FY16 and 17 – more
outcomes weighting
and safety
measures, align with
NQS domains
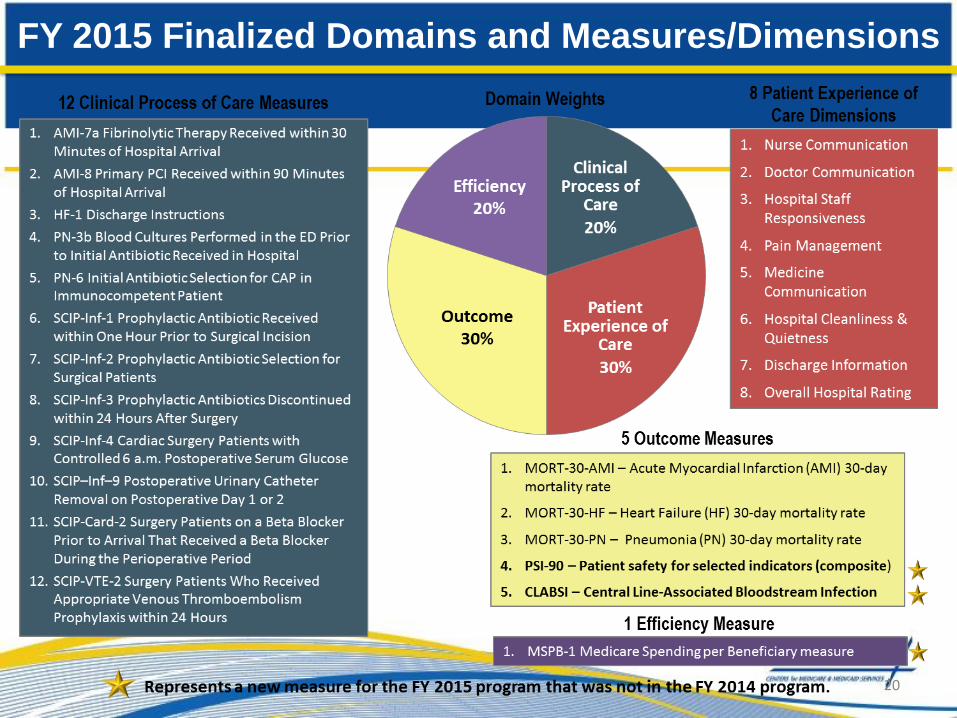
FY 2015 Finalized Domains and Measures/Dimensions
20
• Proposed two additional HAI measures
– Catheter Associated Urinary Tract Infection (CAUTI)
– Surgical Site Infection (SSI)
• Proposed performance period is 2014 calendar year
• CMS intends to post final rule by August 1, 2013
• HAI’s are part of Outcomes domain in FY 2016 (40% total domain weight)
FY 2016 Hospital VBP Program
Healthcare Associated Infection Proposals
21

• Starting in Oct 2012, hospitals with excess risk
adjusted Medicare readmissions had payments
reduced (5 conditions proposed for FY15)
• Payment reductions for hospitals in bottom
quartile of healthcare acquired conditions
starting Oct 2014
– Proposed to start with 2 domains weighted 50% each:
healthcare acquired infections and healthcare acquired
conditions
– Need to move beyond claims-based HAC measures over time
Other Payment adjustment
programs
22

Discussion
• Our Goals and Early Results
• Value-based purchasing and quality
improvement programs
• 2014 Physician Fee Schedule Quality
Proposals
• Quality Measurement to Drive Improvement
• Future and Opportunities for collaboration

• Principle of report once and receive credit for all programs:
Physician Quality Reporting System, Physician Value-Based
Modifier, EHR Incentive Meaningful Use, and ACO if applicable
• Focus on registry reporting and EHR based reporting, both of
which can be all payer
• Group reporting growth, including for ACOs
• Physician value modifier starts in 2013 (groups of 100 or more),
proposed down to groups of 10 or more for 2014 and by 2017
adjusting all Medicare payments to physicians based on quality
and cost
Physician Reporting Programs
24
Physician Quality Reporting System
• Adding 47 new measures and 3 measures groups
to fill existing gaps
• Doubling the number of outcome measures and
reduced the number of process measures
• Removing a number of claims-based measures
that were duplicative or infrequently reported
• Eliminating claims based measure groups (all are
available via registries)
• Encouraging registry and EHR reporting and
proposed decreasing claims-based measures
more over time
Physician Quality Reporting System
• PQRS Incentive: 9 measures across 3
domains (aligns with MU reporting
requirements)
• PQRS Payment Adjustment: 3 measures
• Physicians that meet the Incentive criteria
automatically avoid the Payment
Adjustment
• Groups that report on CG-CAHPS can use
those measures towards meeting
satisfactory reporting criteria
Clinical Data Registries
• ATRA of 2012 allows physicians who submit quality
measures to a CDR to meet PQRS criteria
• Proposed PFS rule lays out the criteria for an entity to be a
CDR
• Only applies to individual physician reporting in statute but
will allow group batch reporting
• Physicians may report on all patients, regardless of payer
source
• To meet PQRS incentive criteria, must report on 9 measures
across 3 domains
• Must report on at least 1 outcome measure
• Measures do not need to be part of current PQRS measure
set
Physician Compare
• Outlines a phased plan for publicly reporting physician
performance on quality measures
• In 2014, CMS will publicly report measures reported by
large groups and ACOs
– Physicians will have a 30 day preview period of
measure results
• In 2014, CMS will publicly report CG-CAHPS measures
• As early as 2015, CMS will publicly report measures for
individual physicians
• CMS will work with specialty societies to identify vetted
measures for public reporting
• Website redesign is now live
Physician Value Modifier
• 2014 is the 2nd year of the program; by 2015 measurement
year, law requires all physicians to be assessed for payment
in 2017
• Decrease group size to 10 or more eligible professionals
(will affect 60% of EPs)
• Category 1: Groups that participate in the PQRS Group
Practice Reporting Option (GPRO) by any method (EHR,
Registry, Web Interface)
– If a group doesn’t participate in GPRO, then if 70% of the
group’s EPs report individually, they will be assessed as a
group
• Category 2: Groups that do not participate in reporting
Physician Value Modifier
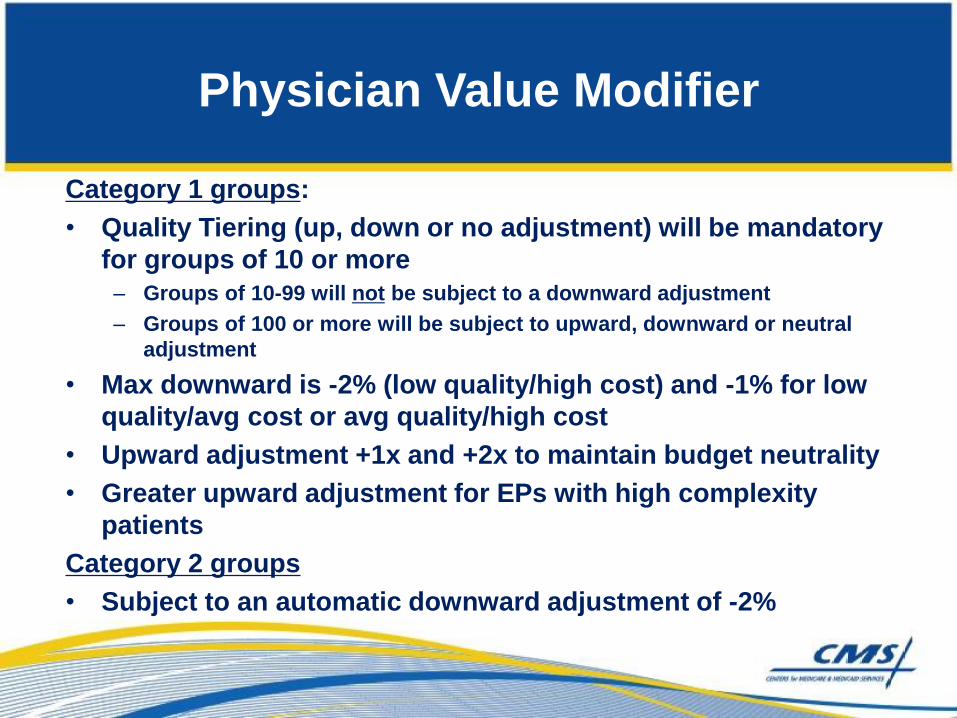
Category 1 groups:
• Quality Tiering (up, down or no adjustment) will be mandatory
for groups of 10 or more
– Groups of 10-99 will not be subject to a downward adjustment
– Groups of 100 or more will be subject to upward, downward or neutral
adjustment
• Max downward is -2% (low quality/high cost) and -1% for low
quality/avg cost or avg quality/high cost
• Upward adjustment +1x and +2x to maintain budget neutrality
• Greater upward adjustment for EPs with high complexity
patients
Category 2 groups
• Subject to an automatic downward adjustment of -2%
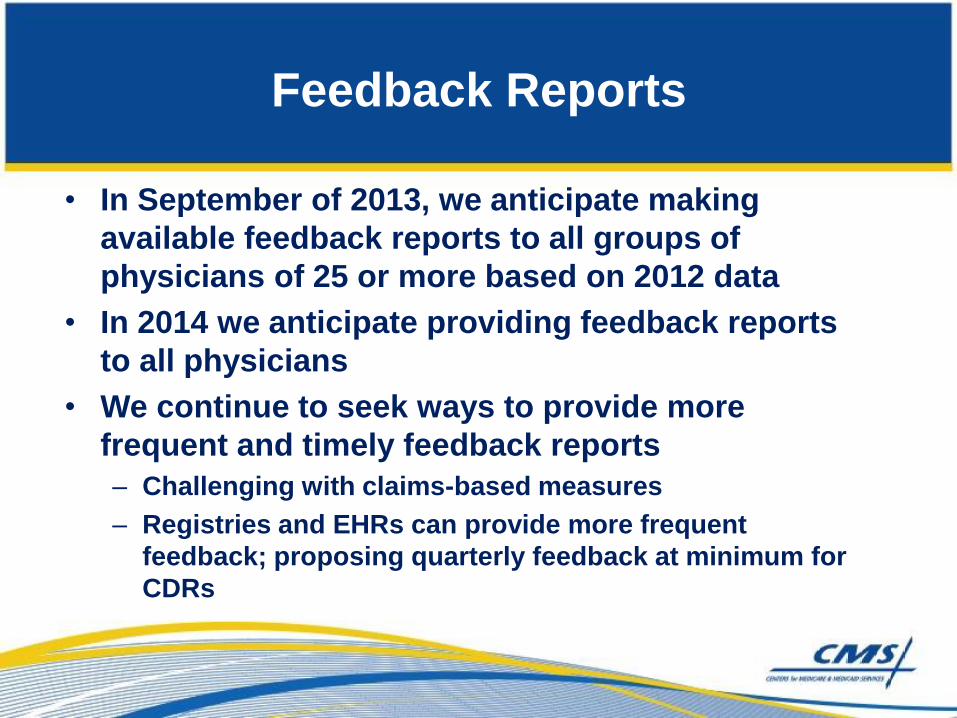
Feedback Reports
• In September of 2013, we anticipate making
available feedback reports to all groups of
physicians of 25 or more based on 2012 data
• In 2014 we anticipate providing feedback reports
to all physicians
• We continue to seek ways to provide more
frequent and timely feedback reports
– Challenging with claims-based measures
– Registries and EHRs can provide more frequent
feedback; proposing quarterly feedback at minimum for
CDRs

Discussion
• Our Goals and Early Results
• Value-based purchasing and quality
improvement programs
• 2014 Physician Fee Schedule Quality
Proposals
• Quality Measurement to Drive Improvement
• Future and Opportunities for collaboration
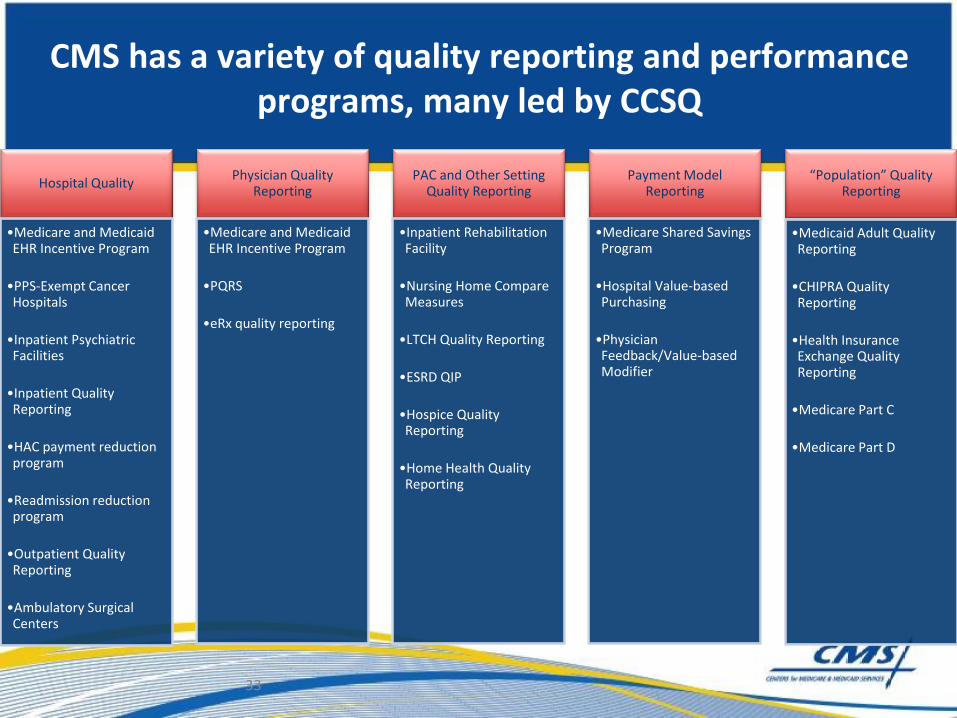
Hospital Quality
•Medicare and Medicaid EHR Incentive Program
•PPS-Exempt Cancer Hospitals
•Inpatient Psychiatric Facilities
•Inpatient Quality Reporting
•HAC payment reduction program
•Readmission reduction program
•Outpatient Quality Reporting
•Ambulatory Surgical Centers
Physician Quality Reporting
•Medicare and Medicaid EHR Incentive Program
•PQRS
•eRx quality reporting
PAC and Other Setting Quality Reporting
•Inpatient Rehabilitation Facility
•Nursing Home Compare Measures
•LTCH Quality Reporting
•ESRD QIP
•Hospice Quality Reporting
•Home Health Quality Reporting
Payment Model Reporting
•Medicare Shared Savings Program
•Hospital Value-based Purchasing
•Physician Feedback/Value-based Modifier
“Population” Quality Reporting
•Medicaid Adult Quality Reporting
•CHIPRA Quality Reporting
•Health Insurance Exchange Quality Reporting
•Medicare Part C
•Medicare Part D
33
CMS has a variety of quality reporting and performance programs, many led by CCSQ
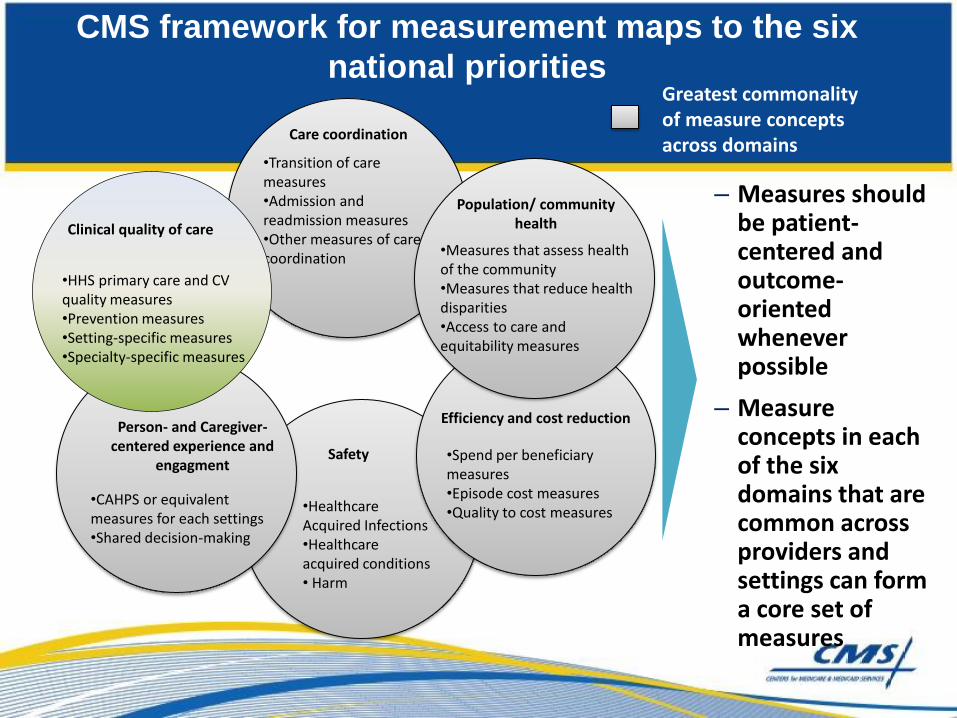
CMS framework for measurement maps to the six
national priorities Greatest commonality of measure concepts across domains
– Measures should be patient-centered and outcome-oriented whenever possible
– Measure concepts in each of the six domains that are common across providers and settings can form a core set of measures
Person- and Caregiver- centered experience and
engagment
•CAHPS or equivalent measures for each settings •Shared decision-making
Efficiency and cost reduction
•Spend per beneficiary measures •Episode cost measures •Quality to cost measures
Care coordination
•Transition of care measures •Admission and readmission measures •Other measures of care coordination
Clinical quality of care
•HHS primary care and CV quality measures •Prevention measures •Setting-specific measures •Specialty-specific measures
Population/ community health
•Measures that assess health of the community •Measures that reduce health disparities •Access to care and equitability measures
Safety
•Healthcare Acquired Infections •Healthcare acquired conditions • Harm

Quality can be measured and improved at multiple
levels
•Measure concepts should “roll up” to align quality improvement objectives at all levels •Patient-centric, outcomes oriented measures preferred at all three levels •The six NQS domains can be measured at each of the three levels
Incr
eas
ing
ind
ivid
ual
acc
ou
nta
bili
ty
Incr
eas
ing
com
mo
nal
ity
amo
ng
pro
vid
ers
Community
Practice setting
Individual clinician and patient
•Population-based denominator •Multiple ways to define denominator, e.g., county, HRR •Applicable to all providers
•Denominator based on practice setting, e.g., hospital, group practice
•Denominator bound by patients cared for •Applies to all physicians •Greatest component of a physician’s total performance
Discussion
• Our Goals and Early Results
• Value-based purchasing and quality
improvement programs
• 2014 Physician Fee Schedule Quality
Proposals
• Quality Measurement to Drive Improvement
• Future and Opportunities for collaboration
Vision for the Future
• Measures Drive Improvement
–Real-time
–Local ownership with benchmarking
–Linked to decision support and patient dashboards
• Measures Drive Value-Based Purchasing
–Reliable
–Accurate
–Outcomes-based
• Measures Inform Consumers
–Meaningful
–Transparent

The Future of Quality Measurement for
Improvement and Accountability
• Meaningful quality measures increasingly need to
transition away from setting-specific, narrow snapshots
• Reorient and align measures around patient-centered
outcomes that span across settings
• Measures based on patient-centered episodes of care
• Capture measurement at 3 main levels (i.e., individual
clinician, group/facility, population/community)
• Why do we measure?
– Improvement
Source: Conway PH, Mostashari F, Clancy C. The Future of Quality Measurement for
Improvement and Accountability. JAMA 2013 June 5; Vol 309, No. 21 2215 - 2216
Opportunities and Challenges of a
Lifelong Health System
• Payers, including Medicare and Medicaid,
increasingly responsible for care for longer periods
of time
• Goal of system to optimize health outcomes and
lower costs over much longer time horizons
• Health trajectories modifiable and compounded over
time
• Importance of early years of life
Source: Halfon N, Conway PH. The Opportunities and Challenges
of a Lifelong Health System. NEJM 2013 Apr 25; 368, 17: 1569-1571
Financial Instruments and models that might
incentivize lifelong health management
• Horizontally integrated health, education, and social services that
promote health in all policies, places, and daily activities
• Consumer incentives (value-based insurance design)
• “Warranties” on specific services
• Bundled payment for suite of services over longer period
• Measuring health outcomes and rewarding plans for improvement
in health over time
• Community health investments
• ACOs could evolve toward community accountable health
systems that have a greater stake in long-term population health
outcomes

What can you do?
• Delivery system transformation happens at the state and
community level
• Clinicians are key to transformation
• Need to focus on better care, better health, and lower costs
• Need to continuously test and improve
• Will need to engage front line clinicians, consumers, employers,
and others in driving change
• Support the testing of new accountable care models, care
coordination models, and models to purchase value, instead of
volume
• So much more….
41
What can you do?
• Eliminate patient harm
• Engage patients and families in transformation
• Teach others and continuously learn
• Test new ideas
• Strive to be the best possible quality improvement
infrastructure
• Relentless pursuit of improving health outcomes
• Major Force in Delivery System Transformation
42
Contact Information
Dr. Patrick Conway, M.D., M.Sc.
CMS Chief Medical Officer
Director, Center for Clinical Standards and Quality
Acting Director, Center for Medicare and Medicaid Innovation
410-786-6841
43

Questions and Comments
• How can we work together to accelerate the pace of improvement
in the health system?
• How can CMS support your efforts?
• How can we drive improvement in all settings and shift towards
payment based on value and accountable, coordinated care?
• How do we scale and spread success?
• How can we work together to reduce and attempt to eliminate
patient harm in all settings?
• How can you best lead transformation of the delivery system?
44