honors thesis - university of colorado boulder
TRANSCRIPT

1
Verification of Tropical Storm Track Prediction
in Southeast Asia Using GFS Model
Honors Thesis
Presented to the College of Agriculture and Life Sciences
Department of Earth and Atmospheric Sciences
of Cornell University
in Partial Fulfillment of the Requirements for the
Research Honors Program
by
Cheuk Yi Joseph Lee
May 2013
Research Faculty Mentor: Mark W. Wysocki
2
ABSTRACT
This study investigates the skill of the Global Forecast System (GFS) model in
predicting tropical cyclones (TCs) tracks and intensity in SE Asia from 2007 to 2011. Data
from 27 TCs passing through the grid box of 20° to 25° N and 110° to 120° E are analyzed.
The GFS lowest central pressure forecast is used to determine the forecasted location of the
TCs. Forecast tracks and central pressures are compared to the TC best track records
produced by the Joint Typhoon Warning Center (JTWC). Average errors and biases in
latitude, longitude, absolute distance and central pressure are calculated for all the TCs.
The GFS forecast tracks exhibit greater longitudinal errors than latitudinal errors, as well
as North and East biases relative to the observation. Elliptical forecast cone is proposed
so as to visually account for the directional biases of the GFS model.

3
1. Introduction
By verifying and understanding the limitations of numerical weather prediction
(NWP) models, meteorologists can improve their forecasts of Tropical Cyclone’s (TC)
tracks and intensities. In the past, TC forecasts of various models and statistical schemes,
including the Navy Operational Global Atmospheric Prediction System (NOGAPS), U.K.
Meteorological Office global model (UKMO) and statistical hurricane prediction scheme
(SHIPS), or even the consensus of the models, in different TC basins have been evaluated
using different methods of verification (Goerss et al. 2004; Elsberry et al. 2007).
This research verifies the Global Forecast System (GFS) model because it is a
widely used, regularly updated and free global operational NWP model operated by the
National Oceanic and Atmospheric Administration (NOAA). Southeast Asia is the region
of interest due to its high population in major cities as shown in Figure 1 and Figure 2,
and its active and long annual TC season.
In 2002, the National Hurricane Center (NHC) developed the concentric cone of
uncertainty around the TC center, which has the radii equal to the average errors in all
forecasted TC tracks over the previous 10 years, and aimed to show the potential
geographic range of the projected TC (Board et al. 2007).
The NHC (2013) states, “the cone represents the probable track of the center of a
tropical cyclone, and is formed by enclosing the area swept out by a set of circles along
the forecast track (at 12, 24, 36 hours, etc). The size of each circle is set so that two-thirds
of historical official forecast errors over a 5-year sample fall within the circle.” The
selected circle radii, made by the NHC (2013), defining the cones in 2013 for the Atlantic
and eastern North Pacific basins are listed in Table 4. In general, forecasters adapt the
circular TC forecast cone comprehensively to determine the area of uncertainty.
However, circles do not account for the directionally biased uncertainty made by the
models or the forecasters, in which ellipses would be a more precise choice of graphical
presentation to solve this problem. Ellipses of error distribution in verifying TC forecast
errors have been made before (Fogarty and Bowyer 2008), which had suggested that the
elliptical graphical presentation of TC forecast uncertainty is more effective than the
traditional circular forecast cone.

4
The major objective of the research is to assess the reliability of the GFS model’s
TC track and intensity forecast by evaluating the statistical error and bias. A scheme of
GFS-model-based elliptical TC forecast cone is also introduced. This research would act
as a reference for forecasters to forecast TCs in Southeast Asia and contribute in
improving TC forecasts.
2. Methodology
In this study, only the TCs that passed through the grid box 20° to 25° N, 110° to
120° E in west Pacific Ocean during 2007 to 2011 were selected, as presented in Figure 1.
The observed TC tracks, which were obtained from the best track data from the Joint
Typhoon Warning Center (JTWC), and were compared to the forecast tracks from the
GFS model output. There are 27 chosen TCs in total, according to the categorization
provided in the best track data from the JTWC. All of them were tropical depressions, 23
TCs were tropical storms and 14 TCs were typhoons. In this research, stronger TCs are
defined as the TC observations reaching the intensities of typhoon stage or even strong
typhoon stage, which made up more than half of the TC samples. All of the 14 stronger
TCs eventually reduced their strength and ended as weaker TCs. The summary of the data
set is presented in Table 1.
All the TCs are also divided into 2 categories, those with wave-like patterns, which
looped in the same region for consecutive initializations, and the non-wave-like cases.
Among all the TCs, 4 of them, including Typhoon Linfa in Figure 5, had wave-like
patterns. The GFS model had problems in tracking them, therefore some of the analyses
would classify them as a group of outliers.
The GFS outputs initialized every 12 hours, with 6-hour intervals between each
point of the TC location, over a forecast period up to 7.5 days, were used. Points of the
local lowest pressure represent the locations of the TCs’ centers in the target region. To
avoid erratic forecasted TC tracks, an upper limit of 2.5° latitude and longitude of TC
movement within 6-hour intervals is imposed on plotting the lowest pressure in the local
area of interest. Among the total of 385 initializations, only 3 of them did not involve any
TC observations of weak intensities.
Errors of every initialization are calculated by subtracting the GFS forecast position
and central pressure from the observed TC position and central pressure. Errors in

5
distance are calculated using the great circle formula:
D = 2 × R × arcsin 1
2sin ϕ
𝑜− ϕ
f
2
+ cos ϕo × cos ϕ
f ×
1
2sin λo − λf
2
D: Distance between two locations
R: Radius of Earth, R = 6371 km
ϕo: Latitude of observed position in degrees
ϕf: Latitude of forecast position in degrees
λo: Longitude of observed position in degrees
λf: Longitude of forecast position in degrees
Errors are presented in terms of total distance, north-south distance (latitude),
east-west distance (longitude), and central pressure. Each set of error values are divided
into two categories, stronger TCs and weaker TCs, according to the observed TC
intensities at the observed time. After averaging the magnitude of errors and the actual
errors in the two categories for each TC, the mean absolute errors and the mean biases of
all TCs are determined respectively. Analyses excluding Typhoon Linfa and other
wave-like TCs reveal the GFS model has difficulties on forecasting their tracks. The
average errors and biases are listed in Table 2 and Table 3.
In order to develop the TC forecast cone, the absolute errors and biases of distance
and pressure are averaged at the initialization, 24-hour, 48-hour, 72-hour and 96-hour for
each TC. Five of the TCs did not exist long enough for the GFS model to generate the
96-hour forecast. The mean absolute errors and the mean biases in different forecast
periods are found after averaging the errors among all TCs, which are presented in Table
5 and Table 6.
3. Results
In Table 2, for all the TCs studied, the GFS model has slightly smaller absolute
distance errors in tracking weaker TCs. The GFS model yields larger distance errors in
the east-west direction than in the north-south direction in both categories. It shows the
GFS model has larger uncertainty in determining the longitudinal position of a TC. The
GFS forecasts also have significantly greater errors of about 35 hPa in determining TC

6
central pressures for stronger TCs.
From Table 3, the GFS forecasts demonstrate north and east biases on average
among all TCs, as well as an underestimation of TC strength. The bias in longitude is
notably larger than the bias in latitude. Compared to the stronger TCs, the GFS forecasts
exhibit smaller biases in latitude, longitude and central pressure for weaker TCs. Figure 3
is an example illustrating the biases, based on the observation track and the forecast track
of Typhoon Nesat, which lasted from 00Z 23 to 18Z 30 September 2011. Figure 4 also
shows a forecast track of Nesat initialized at its mature stage. Both initializations show
the GFS model captured Nesat’s track very well in the beginning 6-hour periods, no
matter before or after it became a typhoon.
The GFS model yielded extraordinary distance errors on forecasting Typhoon Linfa.
Therefore, excluding Linfa, which has a wave-like structure, in the analysis, the absolute
distance errors and biases of the GFS forecasts are remarkably improved. The GFS
forecast errors for the other 3 TCs with wave-like pattern are similar to the forecast errors
for rest of the selected TCs. Therefore, Linfa can be inferred as an outlier that causes
huge difficulties for the GFS model to locate its track. The observed wave-like pattern of
Typhoon Linfa, which persisted from 06Z 13 to 12Z 22 June 2009, is illustrated in Figure
5.
The longitudinal errors become significantly larger than the latitudinal errors in later
forecast periods, as shown in Table 5. From the 48-hour forecast period onwards, the
longitudinal errors are greater than the latitudinal errors by almost a factor of 2. The
pressure errors are consistent among different forecast periods, since the GFS model
tends to substantially overestimate the TC central pressure values for stronger TCs. The
circular GFS forecast cone shown in Figure 6, is based on the average absolute errors of
various forecast periods in Table 5, which is less skillful compared to the NHC forecast
errors in Table 4.
From Table 6, there are very weak South and West forecast biases at initialization.
For later forecast periods, the GFS model exhibits amplifying North and East biases. The
underestimation of the TC strength is steady for different the forecast periods.

7
4. Discussion
Results indicate that the GFS TC forecasts yield average distance errors in a range of
300 to 350 km (in radius), which is less than half of the distance from Hong Kong to
Taipei (808 km). Qualitatively speaking, the GFS model handles TC track forecasts better
for normal cases than for wave-like cases.
Beta effect related processes and other tropical factors (Carr and Elsberry 2000a)
could explain why the GFS model yields larger absolute longitudinal errors than absolute
latitudinal errors. Mid-latitude circulation influences (Carr and Elsberry 2000b) can
justify the magnifying errors when the poleward moving TCs enter the mid-latitudes. The
GFS model also has problems on capturing the relocated vortex vertical structure, which
causes inaccurate interactions between the upper atmosphere and the TCs (Payne et al.
2007). This flaw of the GFS model could explain the errors and biases.
Tron and Snyder (2012) concluded that “the uncertainty in best-track position and
intensity are not trivial”. The TC intensity uncertainty is particularly significant due to
undersampling. The errors calculated from the previous analyses can be partly explained
by the possible inaccuracy in the best-track data from the JTWC, especailly for the
central pressure data. The JTWC might have overestimated the strength (understated the
central pressure) of TCs, especially the more powerful ones, which leads to the
substantial pressure errors of the GFS forecasts.
Applying the circular forecast cone graphing method of the NHC, a green forecast
cone of the GFS model, using the average absolute distance errors of the 24-hour,
48-hour and 72-hour forecasts as radii, is plotted along the observation track of typhoon
Neoguri in Figure 6. Positions 5, 9, 13 and 17 are the initialization, 24-hour, 48-hour and
72-hour locations of Neoguri respectively, which are the centers of the absolute error
circles. The cone is constructed by connecting the tangential points of the absolute error
circles. In general, the forecasting cone covers the GFS track. For example, the circle
centered at observation position 9 covers the GFS forecast position 9. This GFS
initialization of Neoguri is an example of weak south and west bias in later stage, which
is different from the average biases in Table 3 and Table 6.
From the results above, the average distance errors in the east-west direction
(longitudinal error) are much larger than the errors in the north-south direction

8
(latitudinal error). The traditional method of using circles to represent the directionally
unbiased uncertainty is not significant enough to visually show the higher confidence of
the GFS model in forecasting TC tracks in the north-south direction than in the east-west
direction. Therefore, in Figure 8, Figure 9 and Figure 10, ellipses, instead of circles, are
graphed based on the different longitudinal and latitudinal errors in TC track forecasts.
The major and minor axes of the ellipses are in the east-west and north-south directions
respectively. Although the shape of the whole elliptical forecast cone depends on the
moving speed of a TC, the shapes and the axes of the average error ellipses would not
change.
The GFS model is inaccurate in locating the initial positions of the TCs, and the
ellipses of the minimum, average and maximum initialization errors of all TCs are plotted
in Figure 7. The GFS model was relatively precise in locating the initial position of
typhoon Nesat, therefore it has the minimal initialization errors among all 27 TCs, which
is represented by the green ellipse. The blue ellipse indicates the average initialization
errors of all GFS initializations.
The GFS model produced the greatest initialization error among all TCs in the case
of a tropical depression, which was passing through the northeast part of the targeted
region from 11 to 14 July 2009. The purple ellipse represents the errors of this outlier.
The possible reason why the GFS model had difficulties in locating the starting positions
of the tropical depression is because there were a tropical storm, Soudelor, affecting the
southwest part of the area of interest at the same time (8 to 12 July 2009) and a typhoon,
Molave, which crossed over the targeted region soon after the depression (15 to 19 July
2009). The average forecast distance error of the depression for the initialization positions
is large, but the errors for the rest of the track are normal, which are similar to the
averages of all the TCs. Therefore, multiple TCs observed in the same region during the
same time period may cause problems to the GFS model in locating the initial positions
of weaker TCs, but not the rest of the forecast positions.
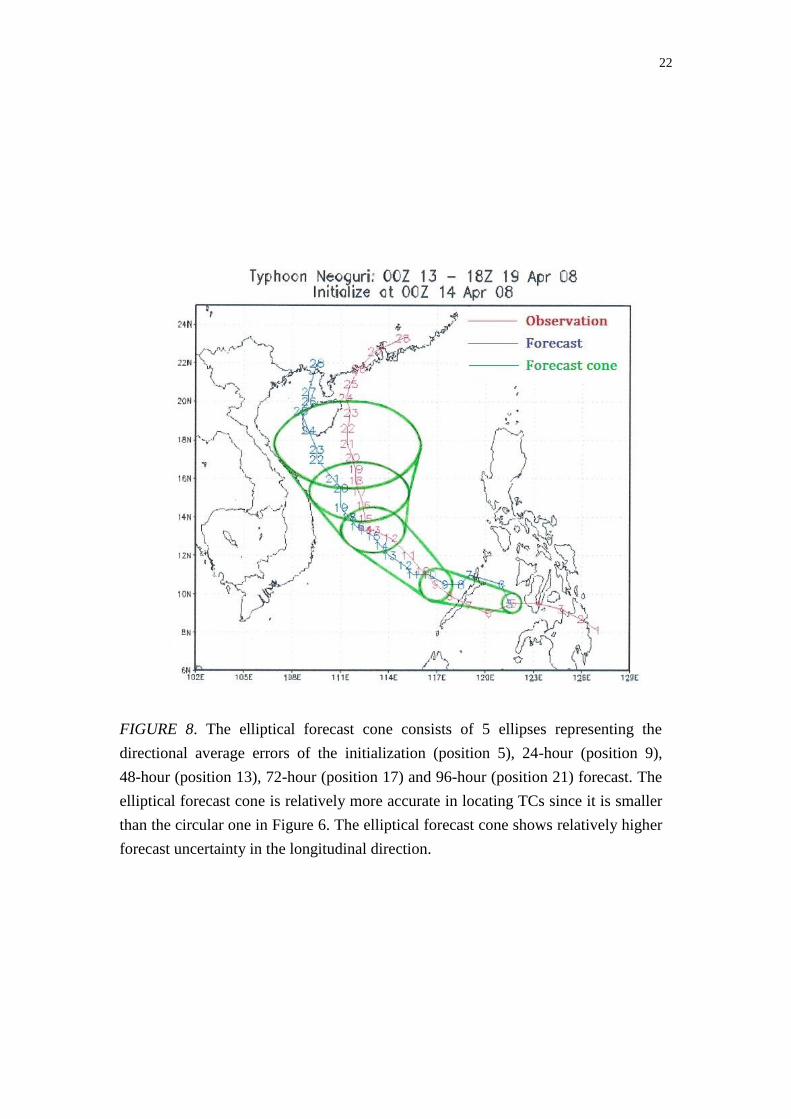
Figure 8 shows the green elliptical forecast cone of the average longitudinal and
latitudinal errors, including the initialization, 24-hour, 48-hour, 72-hour and 96-hour error
ellipses, using Typhoon Neoguri as an illustration. Compared to the circular forecast cone
in Figure 6, the uncertainty of forecast tracks, which corresponds to the area of the ellipse,
is notably reduced.

9
As the GFS model made precise track forecast for typhoon Nesat, the elliptical
forecast cone averaging the directional forecast errors in this particular TC is plotted on
Figure 9. The narrow minor axis of the ellipses in the north-south direction exhibits the
great confidence of the GFS model in locating the latitude positions of Nesat.
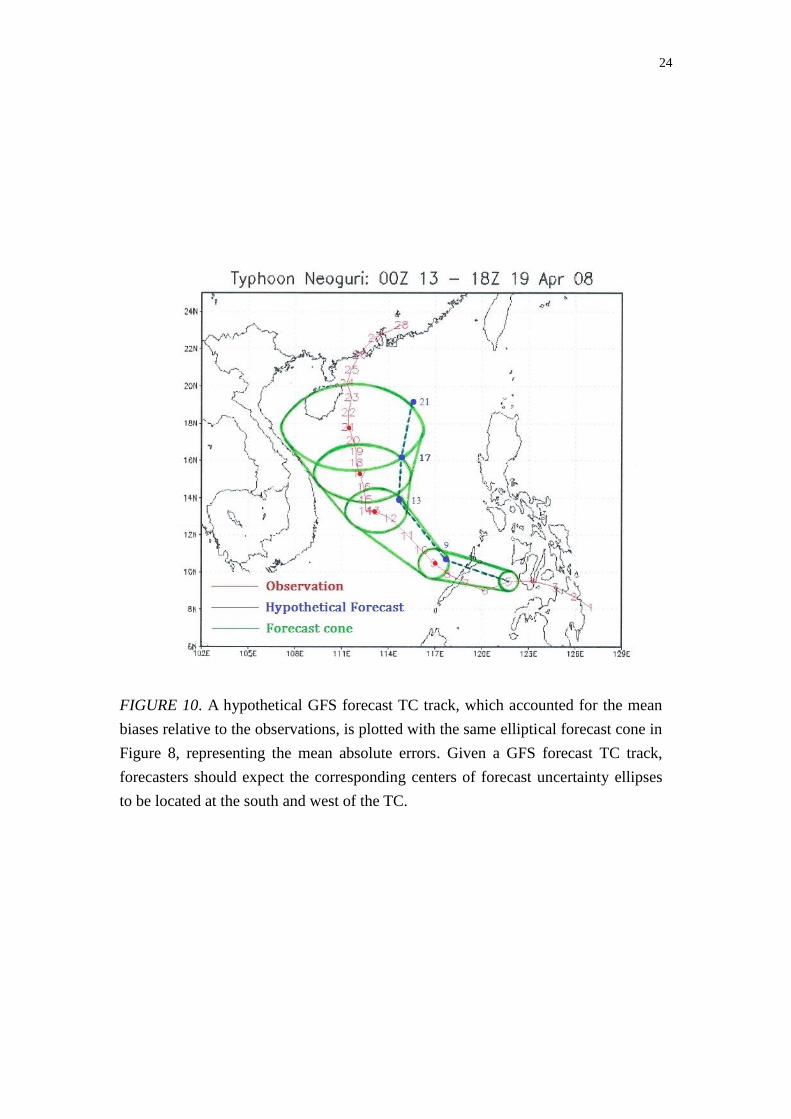
Figure 10 displays the same elliptical forecast cone as Figure 8, with a dashed blue
hypothetical TC track based on average biases. Since the GFS model has north and east
biases in initialization, 24-hour, 48-hour, 72-hour and 96-hour forecasts, the hypothetical
track is linked between the biased forecast positions corresponding to the respective
observation locations, which is north and east of the possible observation track on
average.
5. Conclusion
In this article, the TC track and intensity forecasts of the GFS model have been
verified. On average, the GFS model yields larger longitudinal errors, underestimates TC
strengths and has north and east bias. Elliptical forecast cone is recommended for
operational use to replace traditional circular forecast cone.
Based on the pervious graphical analysis, forecasters can easily locate a projected
TC track with the uncertainty ellipses at the south and west of a corresponding GFS
forecast track. Compared to the traditional directionally unbiased TC track forecast
represented by circular TC forecast cones, the GFS model has higher uncertainty in
forecasting the longitudinal positions of TCs, therefore TC warnings should be issued for
a large area along the South China coast when TCs are approaching to the region by the
GFS model guidance.
During active TC months, forecasters should be aware that the GFS model might
have significant errors in locating the initial positions of the TCs when there are multiple
TCs in the same area during the same period. Further research verifying TC forecast
errors in multiple coexisting TCs conditions has to be conducted in order to conclude a
statistically significant argument.
Future work includes determining the actual effects of the Coriolis parameter in TC
forecasting in the GFS model, analyzing the relationship between the number of landfalls
and the GFS model forecast accuracy, and evaluating how TC recurvature affects the

10
forecast skills of the GFS model. With a bigger sample size in multiple regions, a more
conclusive probabilistic forecast cone can be attained.
6. Acknowledgement
The authors are grateful to receive research funding from Dr. Robert Morley via the
Morley Student Research Grant from College of Agriculture and Life Sciences, Cornell
University. The authors thank Mr. Brian Belcher and Mr. Marty Sullivan for their help
and assistance in technical support.

11
REFERENCES
Broad, K., A. Leiserowitz, J. Weinkle, M. Steketee, 2007. Misinterpretations of the “cone
of uncertainty” in Florida during the 2004 hurricane season. Bulletin of the
American Meteorological Society, 88, 651–667.
Carr, L. E., III, and R. L. Elsberry, 2000a. Dynamical tropicalcyclone track forecast errors.
Part I: Tropical region errors. Weather and Forecasting, 15, 641–661.
Carr, L. E., III, and R. L. Elsberry, 2000b. Dynamical tropical cyclone track forecast
errors. Part II: Midlatitude circulation influences. Weather and Forecasting, 15,
662–681.
Elsberry, R. L., T. D. B. Lambert, M. A. Boothe, 2007. Accuracy of Atlantic and Eastern
North Pacific Tropical Cyclone Intensity Forecast Guidance. Weather and
Forecasting, 22, 747–762.
Fogarty C. and P. Bowyer, 2008. An analysis of along- and cross-track forecast errors
and error biases for TCs in the Atlantic Basin. Retrieved from American
Meteorological Society, 28th
Conference on Hurricanes and Tropical Meteorology,
website: https://ams.confex.com/ams/28Hurricanes/techprogram/paper_137458.htm
Goerss, J. S., C. R. Sampson, J. M. Gross, 2004. A History of Western North Pacific
Tropical Cyclone Track Forecast Skill. Weather and Forecasting, 19, 633–638.
National Hurricane Center (NHC), 2013. Definition of the NHC track forecast cone.
Retrieved 3 March, 2013, from http://www.nhc.noaa.gov/aboutcone.shtml
Payne, K. A., R. L. Elsberry, M. A. Boothe, 2007. Assessment of Western North Pacific
96- and 120-h Track Guidance and Present Forecastability. Weather and
Forecasting, 22, 1003–1015.
Torn, R. D., and C. Snyder, 2012. Uncertainty of Tropical Cyclone Best-Track
Information. Weather and Forecasting, 27, 715–729.

12
United Nations Office for the Coordination of Humanitarian Affairs (OCHA), 2013.
Population Density of Asia-Pacific as per the 2008 Landscan dataset. Retrieved 29
March 2013, from http://www.unocha.org/roap/maps-graphics/regional-reference-
maps

13
Tables and Figures
TABLE 1. Summary of the TC strength, the corresponding sample sizes and GFS
initializations.
TC samples GFS Initializations
All cases 27 385
Weaker than typhoon 27 382
Stronger than typhoon 14 192
FIGURE 1. The area of interest is bounded by the orange box. It covers a large
metropolitan area in South China including Hong Kong, Macau and Guangzhou.

14
TABLE 2. Summary of the average absolute errors of different TC strengths in latitude, longitude, absolute distance and pressure.
TC weaker than typhoon
TC stronger than typhoon
TABLE 3. Summary of the average biases of different TC strengths in latitude, longitude and pressure.
TC weaker than typhoon
TC stronger than typhoon
Lat error N-S distance error Lon error E-W distance error Absolute distance error Pressure error
All TCs 1.42° 157.45 km 2.29° 236.85 km 311.36 km 7.639 hPa
Without typhoon Linfa 1.34° 148.59 km 2.22° 229.97 km 299.82 km 7.625 hPa
Without wave-like TCs 1.3° 144.07 km 2.16° 223.27 km 292.12 km 7.482 hPa
All TCs 1.4° 155.61 km 2.74° 286.04 km 347.37 km 35.106 hPa
Without typhoon Linfa 1.08° 119.96 km 2.45° 256.47 km 297.76 km 35.723 hPa
Without wave-like TCs 1.12° 124.09 km 2.56° 268.47 km 311.38 km 35.257 hPa
Lat error N-S distance bias Lon error E-W distance bias Pressure bias
All TCs -0.27° -30.16 km
North
-1.51° -156.72 km
East
-3.5 hPa Under-
estimate
strength
Without typhoon Linfa -0.15° -16.71 km -1.42° -148.13 km -3.429 hPa
Without wave-like TCs -0.11° -12.74 km -1.34° -139.13 km -3.252 hPa
All TCs -0.82° -91.54 km
North
-2.33° -244.08 km
East
-35.026 hPa Under-
estimate
strength
Without typhoon Linfa -0.46° -51.14 km -2.09° -218.94 km -35.636 hPa
Without wave-like TCs -0.47° -52.15 km -2.21° -232.2 km -35.155 hPa

15
TABLE 4. Radii of NHC forecast cone circles for 2013, based on error statistics from 2008-2012 (NHC 2013).
Forecast Period 2/3 Probability Circle, Atlantic Basin 2/3 Probability Circle, Eastern North Pacific Basin
24 hours 96.304 km 90.748 km
48 hours 170.384 km 151.864 km
72 hours 237.056 km 205.572 km
96 hours 327.804 km 290.764 km
TABLE 5. Summary of the average absolute errors of different forecast periods in latitude, longitude, absolute distance and pressure.
Forecast Period Lat error N-S distance error Lon error E-W distance error Absolute distance error Pressure error
Initialization 0.53° 58.72 km 0.61° 64.53 km 98.01 km 14.25 hPa
24 hours 0.76° 84.06 km 1.03° 108.99 km 152.53 km 17.07 hPa
48 hours 1.08° 120.52 km 2.09° 219.93 km 267.68 km 21.24 hPa
72 hours 1.39° 154.51 km 3.32° 348.15 km 404.46 km 24.35 hPa
96 hours 2.12° 235.50 km 4.85° 507.19 km 594.42 km 24.74 hPa
TABLE 6. Summary of the average biases of different forecast periods in latitude, longitude and pressure.
Forecast Period Lat bias N-S distance bias Lon bias E-W distance bias Pressure bias
Initialization +0.01° +1.58 km South +0.04° +3.98 km West -12.12 hPa
Under-
estimate
strength
24 hours -0.20° -21.64 km
North
-0.69° -73.15 km
East
-14.52 hPa
48 hours -0.56° -62.23 km -1.64° -172.53 km -18.08 hPa
72 hours -0.83° -91.86 km -2.66° -279.05 km -20.47 hPa
96 hours -1.40° -155.24 km -4.03° -421.66 km -20.58 hPa

16
FIGURE 2. An extract of the population density map as per 2008 Landscan dataset
made by the United Nations Office for the Coordination of Humanitarian Affairs
(OCHA 2013). The area of interest is bounded by the green box superimposed on the
population density map of SE Asia. The high population density shows the social
implications of improving TC forecasts.

17
FIGURE 3. 24 September 2011 12Z (position 7) initialization: GFS forecast track
shows north and east bias compared to the observation. The distance errors in the
east-west direction are larger than the distance errors in the north-south direction.
Absolute distance errors increase over time.

18
FIGURE 4. 27 September 2011 12Z (position 19) initialization: GFS forecast track
shows an excellent qualitative alignment with the observation in track direction.
Distance errors grow after 36 hours (after position 24 in the graph) when Nesat
weakens.

19
FIGURE 5. 15 June 2009 12Z (position 10) initialization: Typhoon Linfa exhibited a
wave-like pattern for over 2 days (position 16 to position 24). The GFS forecast
track qualitatively captures the wave-like pattern, however the absolute distance
errors are greatly magnified after the looping, which greatly reduce the forecast
accuracy quantitatively. Excluding Linfa, the average absolute errors and biases are
greatly improved, as listed in Table 2 and 3.

20
FIGURE 6. 14 April 2008 00Z (position 5) initialization: Circular forecast cone
based on the mean absolute distance error of all TCs are plotted at the 24-hour
(position 9), 48-hour (position 13) and 72-hour (position 17) after the initialization,
centered at the observed track. Corresponding forecast locations are within the cone
in general, except for the every early stage. This particular initialization displays a
weak south and west bias in later stage.

21
FIGURE 7. The green minimum initialization error ellipse is drawn according to the
average initialization errors of Typhoon Nesat; The blue ellipse is the average
initialization error ellipse of all cases (see Table 5); The purple maximum
initialization error ellipse is drawn according to the average initialization errors of
the tropical depression lasted from 11 to 14 July 2009. All three of the initialization
ellipses are drawn without accounting for directional biases.
22
FIGURE 8. The elliptical forecast cone consists of 5 ellipses representing the
directional average errors of the initialization (position 5), 24-hour (position 9),
48-hour (position 13), 72-hour (position 17) and 96-hour (position 21) forecast. The
elliptical forecast cone is relatively more accurate in locating TCs since it is smaller
than the circular one in Figure 6. The elliptical forecast cone shows relatively higher
forecast uncertainty in the longitudinal direction.

23
FIGURE 9. Similar to Figure 8, the elliptical forecast cone is based on the mean
errors of Typhoon Nesat in particular. Since the GFS model is accurate in
determining the latitudinal positions of Nesat, the ellipses are relatively narrow in
the north-south direction compared to Figure 8.
24
FIGURE 10. A hypothetical GFS forecast TC track, which accounted for the mean
biases relative to the observations, is plotted with the same elliptical forecast cone in
Figure 8, representing the mean absolute errors. Given a GFS forecast TC track,
forecasters should expect the corresponding centers of forecast uncertainty ellipses
to be located at the south and west of the TC.