how do business groups evolve? evidence from new...
TRANSCRIPT

How do business groups evolve? Evidence from new project
announcements.
Meghana Ayyagari∗, Radhakrishnan Gopalan†, and Vijay Yerramilli‡
June, 2009
Abstract
Using a unique data set of investment projects from India, we examine how businessgroups choose between implementing a new project within an existing firm (“integra-tion”) versus implementing in a new firm (“non-integration”). While industry common-ality is an important determinant of this choice, we document that it is also commonfor groups to house diversification projects in existing firms. Larger and more profitablegroups are more likely to integrate projects, and the integrated projects are more likelyto be from less profitable industries. Within the group, projects are more likely to beintegrated into larger and more profitable firms. Interestingly, diversification projectsfrom profitable industries are more likely to be integrated into high insider holdingfirms. On average, the market reacts more positively to project announcements by highinsider holding firms. Overall, our results suggest that a key determinant of integra-tion is to use an existing group firm’s cash flows to support the new project, and alsothat insiders expropriate minority shareholders by selectively implementing profitableprojects in high insider holding firms.
∗School of Business and Elliott School of International Affairs, George Washington University. email:[email protected]; ph: (202) 994-1292†Olin Business School, Washington University. email: [email protected]; ph: (314) 935-9196.‡Kelley School of Business, Indiana University. email: [email protected]; ph: (812) 855-2694.

Introduction
Firms in many countries other than the United States are organized as business groups,
which comprise of multiple independent firms controlled by a common set of insiders.
Groups typically have complex ownership structures with insiders controlling member firms
through direct and indirect ownership stakes. There are also significant cross-sectional dif-
ference in how groups organize businesses within their member firms. While some groups
have multiple firms operating in the same or related industries, others have large diversified
firms operating in multiple industries. An example of the former is the Aditya Birla Group
in India which has four firms in the telecom industry, while an example of the latter is the
Mahindra Group, whose flagship firm, Mahindra and Mahindra Ltd., manufactures farm
equipment, cars, trucks and defence equipment. We have a limited understanding of how
groups organize businesses within their member firms. Specifically, how do groups choose
between implementing a new project within an existing group firm (“integration”) versus
implementing it in a new firm (“non-integration”)? What are the characteristics of the firms
in which new projects are integrated? Since group insider holding and potentially the in-
sider’s incentives to maximize value vary across member firms (see Morck et al. (2005) for a
survey), answers to these questions are fundamental to our understanding of the functioning
of business groups. In this paper, we use a unique data set of 3,331 new projects announced
by Indian business groups to understand how groups decide between implementing a new
project within an existing firm as opposed to in a new firm.
The choice between integration and non-integration is a fundamental question in the
theory of the firm dating back to Coase (1937). A large volume of theoretical literature
highlights the different costs and benefits involved in the decision (see Leland (2007), Inderst
and Muller (2003), Fluck and Lynch (1999), Holmstrom and Tirole (1993), Flannery et al.
(1993)). Despite the rich theoretical literature, empirical evidence has been hard to come by
even in the case of US firms, mainly due to the lack of project level data. Studies of changes
in firm scope resulting from mergers and acquisitions or spin-offs are likely to be biased due
to the endogeneity of the decision. Our unique project level data helps us understand how
group, firm, and project characteristics at the time of initiation of the project affect the
integration decision. More importantly, by analyzing the stock market’s reaction to project
announcements we get a clean measure of market’s ex ante expectation of the project’s net
present value.
Business groups offer a rich laboratory in which to test the predictions of the theories
of integration. The group insider controls multiple firms in different industries, and can
potentially integrate (or not) a new project within any one of the firms. Thus the group
structure offers cross-sectional variation in firm and project characteristics that we can
1

exploit to test the theories of integration. Moreover, since the insider’s cash-flow rights
varies across member firms, the insider can use her superior information about project
profitability to expropriate minority shareholders by selectively implementing profitable
projects in group firms with high insider shareholding, or in new firms with high insider
holding (see Almeida and Wolfenzon (2006)). So in addition to the costs and benefits
studied in the existing theories, the group structure also allows us to understand how
the conflict between controlling shareholders and minority shareholders affects the choice
between integration and non-integration.
While most of the theories dealing with the integration choice are based on stand-alone
firms, business groups also face similar tradeoffs. In countries with underdeveloped capital
markets like India, business groups often use their internal capital market to finance new
projects for which external capital is difficult to raise (Khanna and Palepu (2000)). In the
Indian context, such subsidization is most easily achieved by integrating the new project
in an existing group firm. This is because accounting norms require groups to disclose all
the inter-firm loans made within the group (Gopalan et al. (2007)). On the other hand, in
case of projects requiring external capital, non-integration may be desirable because of the
greater transparency.
Based on the extant theoretical literature, we identify three broad non-mutually exclu-
sive hypotheses that can influence the business group insiders’ choice between integration
and non-integration. First, the choice may be driven by the operational and financial syn-
ergies between the new project and an existing group firm (“synergy hypothesis”). Second,
the choice may be driven by a need to support the new project using the cash flows of
an existing group firm (“subsidization hypothesis”). Third, as explained above, the choice
may be driven by the insiders’ desire to expropriate outside shareholders (“expropriation
motive”). In our empirical analysis, we seek to understand the importance of these three hy-
pothesis by estimating how project, group and firm characteristics affect the choice between
integration and non-integration.
Our data comes from two sources. We obtain our sample of project announcements from
the CapEx database maintained by the Center for Monitoring Indian Economy (CMIE).
CapEx obtains its data from different sources such as firm disclosures, government agencies
and news reports. The database provides us information on the project’s announcement
date, estimated cost, industry classification, and the name of the firm and business group
announcing the project. We complement CapEx data with financial information of group
firms from the Prowess database. Our final sample consists of 3,331 projects announced by
firms belonging to private Indian business groups, over the period 1995–2007.
Our key variable of interest is whether the project is integrated or non-integrated. We
2

classify a project as integrated if the firm announcing the project was incorporated before
the announcement date of the project, and if its sales in the year prior to the project’s
announcement exceeds Rs. 100 million. Otherwise, we classify the project as non-integrated;
i.e., non-integration means that the group sets up a new firm to undertake the project. In our
sample, 82% of projects are integrated within existing group firms while 18% are set up in
new firms. Interestingly, we find that 71% of the projects that involve the group diversifying
into a new industry are integrated within an existing firm. We also find that 13.4% of the
projects are implemented in a new firm despite the group having an existing firm in the
same 2-digit NIC industry. In other words, the synergy hypothesis – which predicts that
projects should be integrated with firms from the same industry – alone cannot explain the
group’s choice between integration and non-integration.
We do three types of multivariate analysis to test the predictions of our hypotheses. In
the first set of tests, we estimate how project and group characteristics affect the group’s
decision to integrate the project in an existing firm. In the second set of tests, we focus
on integrated projects and examine how individual firm characteristics affect the groups’s
choice to integrate a project within the firm. In our final set of tests, we examine the project
announcement returns to understand the market’s assessment of the project’s NPV, which
further helps us distinguish between the three hypotheses.
Consistent with the synergy hypothesis, we find that a project is more likely to be
integrated if the business group has an existing firm in the same industry. But as mentioned
above, synergy alone does not seem to explain the integration decision. Consistent with
the subsidization motive, we find that projects from profitable industries are less likely
to be integrated, and that larger and more profitable business groups are more likely to
integrate new projects into an existing firm. While this evidence is consistent with the
synergy hypothesis as well (since larger and more profitable business groups are more likely
to undertake expansion projects that may be integrated for synergy reasons), we obtain
similar results when we examine the integration decision for diversification projects, where
synergy considerations are likely to be less important.
Within a business group, we find that projects are more likely to be housed in the
larger and more profitable group firms. Again, this finding holds even when we examine
the integration decision for diversification projects only. This offers strong support for the
subsidization hypothesis.
Our analysis also reveals that business group insiders selectively house profitable diversi-
fication projects in group firms in which they hold a high percentage of shares. This evidence
is consistent with insiders using investment decisions to expropriate minority shareholders.
Using data on the characteristics of the board of directors of individual firms, we identify
3

the number of family directors in a firm’s board and use it as a measure of the extent of
insider control over a firm. Consistent with the insider using her control to influence inte-
gration decisions, we find that profitable group firms with more family directors are more
likely to diversify into new industries.
Further evidence for the expropriation hypothesis comes from our tests that examine how
project announcement returns vary with project, firm and group characteristics. While the
average announcement return for a new project is positive, the announcement returns are
larger for projects undertaken in high insider holding group firms. This effect is economically
significant: while the average market-adjusted announcement return is 0.89%, integrating
the project in a high insider holding group firm causes the announcement return to be
higher by 1%. This effect is larger in high growth firms, is larger for projects involving
a high fraction of tangible assets, and is larger in more profitable groups. Overall, the
results are consistent with the view that business group insiders selectively house profitable
projects in firms in which they own a high percentage of shares.
Our paper contributes to the literature on business groups by shedding light on how
business groups make major investment decisions. Our finding that a key motivation behind
integration is to support the new project using the cash flows of the group firm complements
the findings in Shin and Park (1999), Khanna and Palepu (2000), Van der Molen and
Gangopadhyay (2003), and Gopalan et al. (2007) that the group structure improves group
firms’ access to financing.
Our finding that insiders selectively house profitable projects in group firms where they
hold a high percentage of shares contributes to the literature that highlights the negative
aspects of the group structure. It has been argued that the group structure exacerbates
agency conflicts between insiders and minority shareholders, and facilitates “tunneling” of
funds from minority shareholders to the group’s insiders (Johnson et al. (2000), Claessens
et al. (2000), Bertrand et al. (2002), Friedman et al. (2003)). We contribute to this literature
by identifying investment decisions as a specific channel through which insiders can benefit
themselves at the expense of minority shareholders.
The remainder of the paper is organized as follows. We describe our hypothesis and
highlight their predictions in the next section, describe our data, empirical specifications
and summary statistics in Section 2. Our main empirical results are presented in Section
3. Section 4 concludes the paper.
4

1 Hypotheses
In this section, we outline the main hypotheses relevant to a business group’s choice be-
tween integrating a new project within an existing group firm versus implementing it in a
new firm. The Synergy hypothesis highlights the operational and financial synergies that
can be realized through integration. The Subsidization hypothesis highlights the ability to
subsidize integrated projects using the cash flow of existing firms. Finally, the Expropria-
tion hypothesis highlights the ability of the business group’s insider to expropriate outside
shareholders through the project integration decision.
Synergy Hypothesis: Integrating a new project into an existing firm can lead to opera-
tional and financial synergies. Operational synergies arise from economies of scale and scope.
Financial synergies arise if integration leads to risk diversification, allowing the combined
firm to benefit from a higher leverage ratio and hence greater interest tax shields (Lewellen
(1971), Flannery et al. (1993), and Leland (2007)). On the other hand, non-integration can
be beneficial because it allows firms to have separate capital structures tailored to suit indi-
vidual project needs (Leland (2007)). Overall, the existing theories predict that integration
dominates non-integration for projects with similar risk characteristics and costs of default.
The synergy hypothesis predicts that integration is more likely when the new project is
in the same industry or in a vertically integrated industry as any of the existing group firms,
while non-integration is more likely for diversification projects that do not share synergies
with existing firms. Also, large projects are more likely to be non-integrated because the
benefits of tailoring a separate capital structure to suit project needs are likely to be large.
Subsidization Hypothesis: Integration allows firms to more easily shift cash across
projects. This can be beneficial when external capital is difficult to raise because it allows
for the financing of new projects using the cash flows of an established firm (Fluck and
Lynch (1999), Inderst and Muller (2003)). On the other hand, non-integration leads to
greater transparency for financiers, which can make it easier to raise external financing by
mitigating asset substitution problems (Flannery et al. (1993)) and improving monitoring
(Holmstrom and Tirole (1993)).
The key prediction of the subsidization hypothesis is that projects for which external
capital is difficult to raise – e.g., projects from less profitable industries, projects with low
tangible assets, and projects from industries with low level of IPO activity – are more likely
be integrated. Large and profitable business groups are more likely to integrate projects,
and within such business groups, projects are more likely to be integrated in large and
profitable group firms. Larger projects are less likely to be integrated.
5

Expropriation Hypothesis: Business groups have complex ownership structures with
insiders controlling member firms through direct and indirect ownership stakes. The insid-
ers’ cash flow rights vary across firms, which exacerbates agency conflicts between insiders
and minority shareholders, and facilitates tunneling of funds from minority shareholders to
the group’s insiders. Almeida and Wolfenzon (2006) theoretically analyze the choice between
a horizontal group structure in which the controlling family directly acquires shareholding
in a firm and a vertical group structure in which project investment is financed through
cross-holdings through existing firms. Their vertical group structure can be equated to a
integrated structure. They highlight that one of the main benefits of a horizontal structure
to the controlling family is that it allows the family to retain the entire project NPV for
itself. On the other hand, under a vertical structure, the family has to share the project’s
NPV with the minority shareholders of the existing firm.
The main prediction of the expropriation hypothesis is that business group insiders
will selectively implement profitable projects in group firms in which they own a high
percentage of shares. We use the median profitability of a project’s industry as well as the
announcement returns from the project to test this prediction. Further to the extent that
the group insider obtains private benefits from new projects, say from larger firm size, they
are more likely to implement marginally profitable projects in profitable group firms if they
exercise greater control over the firms. This is similar to the free cash flow agency costs
highlighted by Jensen (1986).
2 Sample Construction, Empirical Specification and Prelim-
inary Results
2.1 Sample Construction
We use two main sources of data for our empirical analysis. We obtain data on new projects
announced by Indian business groups from the CapEx database, maintained by the Center
for Monitoring Indian Economy (CMIE). CapEx is a unique database of new and ongoing
projects in India, and includes information on around 14,000 projects announced since
1995. Among other things, CapEx provides information on the project’s announcement
date, identity of the company undertaking the project, cost of the project, project status,
industry classification, and identity of the business group sponsoring the project. CapEx
collects its information from multiple sources: company annual reports, media reports, and
Government sources in case of projects that require Government approval. Our inquiries
reveal that any investment project that costs more than Rs. 100 million is likely to be
included in the database. An investment project becomes a part of the CapEx database
6

from its first announcement date through to its commissioning.
We use CapEx’s classification to identify projects sponsored by firms belonging to a
private Indian business group. To do that, we exclude projects identified by CapEx as
sponsored by state owned firms, foreign firms and private Indian stand-alone firms. For
projects sponsored by firms belonging to Indian business groups, CapEx identifies the busi-
ness group the sponsoring firm belongs to. CapEx classification of Indian business groups
is similar to the ones used in prior studies (e.g., Khanna and Palepu (2000), Bertrand et al.
(2002), and Gopalan et al. (2007)).1
Our final sample consists of 3,331 projects undertaken by 769 firms belonging to 325
private Indian business groups. All the projects have announcement dates between 1995-
2007. We use CapEx classification to identify the project’s industry affiliation. We match
the industry definition provided in CapEx with the National Industrial Classification Codes
2004 (NIC-2004) published by the Indian Ministry of Statistics. NIC-2004 is the standard
for industrial classification currently used in India and is identical to the structure of ISIC
Rev. 3.1 up to the 4-digit level. Our sample projects are from 47 unique 2-digit NIC code
industries.
Our second source of data is Prowess, which is also maintained by the CMIE. Prowess
provides annual financial information of public and private Indian firms, beginning in 1989.2
We merge the Capex and Prowess databases to obtain information on the companies spon-
soring the projects. We collect the following types of information from Prowess: annual
financial information, equity ownership of insiders, board composition, industry affiliation
at the level of 2-digit NIC codes, and group affiliation.
We adopt Prowess’ classification to identify group affiliation of the firms. This group
classification is identical across CapEx and Prowess and as mentioned earlier, has been
used in prior studies on Indian business groups. For identifying industry affiliation, we use
information on the principal line of activity of the firm.
2.2 Empirical Specifications and Key Variables
In our empirical investigation, we conduct three sets of tests to understand how project,
group and firm characteristics affect the group’s decision to implement a project within an
existing firm (integration) versus in a new firm firm (non-integration).1We also ensure that all business group structures have more than one identifiable firm belonging to the
group.2Choudhury (1999) points out that Prowess covers a firm if it meet any of the following criteria: (i) firm’s
turnover exceeds Rs. 25 million; (ii) firm’s annual reports are available for at least two years prior to thedate of updating; and (iii) the firm is listed on either the Bombay Stock Exchange (BSE) or the NationalStock Exchange (NSE).
7

Our first set of tests examine the impact of project industry and group characteristics
on the integration decision. Specifically, we estimate logit regressions that are variants of
the following form:
yp = F (β0 + β1Xp + β2Xg + µt + εpt), (1)
where F () denotes the logistic function, subscript ‘p’ denotes the project, subscript ‘g’
denotes the business group undertaking the project, and subscript ‘t’ denotes the year in
which the project is announced. The sample for this regression has one observation per
project, and includes all projects reported in Capex as announced by a private Indian
business group during the time period 1995–2006.
Our main dependent variable is Integratep, a dummy variable that takes a value one for
projects that are implemented within an existing group firm, and zero otherwise. To identify
integrated projects, we first match CapEx and Prowess data sets based on firm names. We
classify a project as integrated if the firm undertaking the project was incorporated before
the project’s announcement year, and had sales of at least Rs. 100 million in the year prior
to the project’s announcement year.
Some of the projects in our sample may be expansion projects undertaken by existing
firms, and hence, are more likely to be integrated given the operational synergies they share
with the existing firms. To ensure that our results are not driven by such expansion projects
and to understand why groups integrate diversification projects, we repeat our regressions
with the dependent variable Integrate-Dp, a dummy variable that takes the value one if a
project is integrated in a firm that is not in the same 2-digit industry as the project, and
zero otherwise.
Among project characteristics (Xp), we include project size using Log(Project Cost), the
natural logarithm of the stated cost of the project. We use project industry characteristics
to proxy for the project’s profitability, growth prospects, tangibility and investment needs
because these variables are not available for the project at the time of its announcement.
We measure all industry characteristics as the median values for all firms in the same 2-
digit NIC code as the project in the year prior to the project’s announcement. We use
the following dummy variables to proxy for the project’s industry characteristics: High
ROA Ind. identifies industries that are in the top quartile among all 2-digit NIC industries
in terms of ROA ( EBITDATotal Assets); High Growth Ind. identifies industries that are in the top
quartile in terms of sales growth rate; High Tangibility Ind. identifies industries that are in
the top quartile in terms of asset tangibility (measured as Gross Fixed AssetsTotal Assets ); High Leverage
Ind. identifies industries that are in the top quartile in terms of their leverage (defined
as DebtTotal Assets). While we present results that employ dummy variables to measure project
industry characteristics, all our results are robust to using continuous variables. Finally,
8

IPOs in Ind. measures the number of IPOs by firms in the industry in that year.
Among the group characteristics (Xg) we include, Group Diversify a dummy variable
that takes the value one if none of the existing firms in the group are in the same 2-digit
NIC code industry as the project, and zero otherwise. We also use the following dummy
variables to proxy for other group characteristics: Large Group identifies groups whose size,
measured in terms of the sum of total assets of all member firms, exceeds the median size
among all groups during the year; High ROA Group identifies groups with above median
ROA (defined as the ratio of the sum of EBITDA of all member firms over the sum of Total
Assets); High Investment Group identifies groups with above median investment intensity
(defined as the ratio of the sum of investments by all member firms to the sum of their
total assets) during the year; High Leverage Group identifies groups with above median
leverage (defined as the ratio of the sum of total debt of all firms in the group to the sum
of their total assets) during the year; High Growth Group identifies groups with aggregate
sales growth above sample median during the year.
Our second set of tests are aimed at understanding which group firms announce inte-
grated projects. Specifically, we estimate OLS regressions that are variants of the following
form:
yft = β0 + β1Xp + β2Xf + µg + µt + εft, (2)
The sample for this regression has one observation for each group firm-project-year
combination, and includes all groups with more than three firms in a year and that announce
an integrated project. The dependent variable in this regression is either Integrateft or
Integrate-Dft. Integrateft is a dummy variable that takes the value one if firm ‘f’ announces
a project in year ‘t’ and zero otherwise. Integrate-Dft is a dummy variable that takes the
value one if firm ‘f’ announces a diversification project (i.e., a project from a different 2-digit
NIC code industry) in year ‘t’. We control this regression for year fixed effects (µt) and
group fixed effects (µg). The standard errors are robust and clustered at the level of the
business group.
We employ the dummy variables Same Industry (in regressions with Integrateft as the
dependent variable) to identify instances when the firm is in the same 2-digit NIC industry
as the project. We also employ Vertically Integrated Industry to identify instances when the
firm is vertically integrated with the project. We measure the extent of vertical integration
between two NIC 2-digit industries using the input-output matrix for India. An industry
pair is classified as vertically integrated if 10% or more of the input to either industry comes
from the other industry. Among the firm characteristics (Xf ) that we control for, Log(Total
Assets) is the natural logarithm of the book value of total assets; ROA is the ratio of
EBITDA to total assets; Insider Holding (%) is the percentage of the firm’s shares held by
9

the insider of the business group, as identified by Prowess. We also obtain information on
the board of directors of the firm and control for Board Size, the size of the firm’s board and
Family Directors, the size of the largest block of directors that share the same last name.
We use Family Directors as a measure of the insider family’s control over the firm’s board.
Finally in our third set of tests, we investigate the value implications of new project
announcements, by estimating the following OLS regression on all group firms that announce
new projects:
Announcement Returnp = β0 + β1Xp + β3Xf + µt + εpt, (3)
where Announcement Returnp is the abnormal stock return of the firm around the ten day
period surrounding the announcement of project ‘p’. We calculate abnormal return as the
difference between the firm’s stock return and the return on the National Stock Exchange’s
Nifty index.
2.3 Summary Statistics and Univariate Tests
Table I provides the year-wise and industry-wise distribution of the projects in our sample.
As can be seen from Panel A, the number of projects increases significantly in 2000 and
again in 2004. These increases represent both improved investments prospects resulting
from higher economic growth as well as improved coverage by CapEx. In Panel B, we
provide a break-up of the number of projects per industry at the 2-digit NIC industry level.
We only include those industries that have at least 30 projects reported during the sample
period 1995-2007. As can be seen, a large fraction of our projects are in the manufacturing
sector with chemicals and basic metals sub-sectors topping the list.
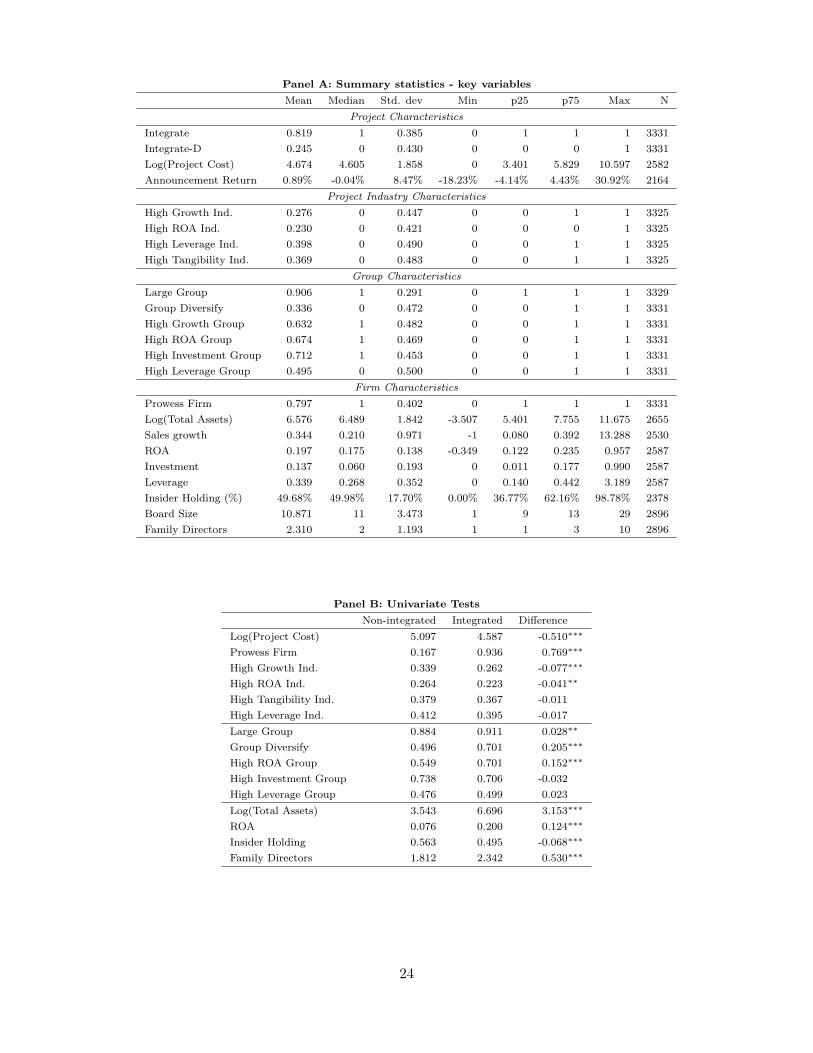
We provide summary statistics for our key variables in Table II. We classify 82% of the
projects in our sample as integrated and 18% as non-integrated. The average project in our
sample involves an investment of Rs. 5,292 million, while the median project investment is
Rs. 450 million. Recall that because we do not have financial information on the projects,
we use project industry characteristics to proxy for project profitability, growth prospects,
expected leverage and tangibility. In terms of industry characteristics, 28% of the projects
in our sample are in high-growth industries, i.e., industries that are in the top quartile in
terms of sales growth. Similarly, 23% of the projects are in highly profitable industries.
Reflecting the importance of debt finance for the projects, we find that 40% of the projects
are in industries that are in the top quartile in terms of leverage, while 37% are in industries
that are in the top quartile in terms of asset tangibility.
We classify a group as large if its size, in terms of the sum of total assets of all its member
10
firms, exceeds the sample median size of all business groups during the year. While large
groups, by definition, constitute 50% of all business groups, they account for 90.6% of the
projects in our sample. Given that CapEx covers larger projects, this probably reflects the
fact that larger business groups are more likely to announce large projects. As the mean
value of the variable Group Diversify indicates, 33.6% of the projects in our sample involve
the business group diversifying into a new industry.
We have financial information on the firm undertaking the project for around 80% of the
projects (mean value of Prowess Firm is 0.797). On average, the business group’s insider
holds 49.7% of the shares of firms undertaking the projects. On average, the firm’s board
consists of 10.9 directors, out of which, 2.3 directors belong to the business group insider’s
family.
The average announcement return for the integrated projects in our sample is 0.89%.
This shows that the market expects the average project to have positive NPV. Interestingly
there is significant cross-sectional variation in the project announcement returns with about
53% of the announcement returns being negative. In our subsequent tests, we explore the
reason why a group may announce a project that the market expects to destroy firm value.
In Panel B of Table II we present a univariate comparison of the key variables across
integrated and non-integrated projects. As can be seen, larger projects, projects from high
growth and high profitability industries are more likely to be implemented in new firms.
Larger and more profitable business groups are more likely to integrate projects. Non-
integration is more likely when the business group is diversifying into a new industry. Not
surprisingly, when the group implements the project in a new firm, the insider holding is
higher in the new firm as compared to in existing firms announcing integrated projects.
Interestingly, the number of family directors is lower in new firms announcing projects.
We now proceed to our multi-variate analysis.
3 Empirical Results
In this section, we discuss the main empirical results of our paper. The discussion is divided
into three subsections. In Section 3.1, we discuss the impact of project characteristics and
business group characteristics on a group’s choice to integrate a new investment project
within an existing firm. In Section 3.2, we examine the characteristics of the group firms
into which projects are integrated. Finally, in Section 3.3, we investigate the stock market’s
reaction to the announcement of new projects by group firms.
11

3.1 When do business groups integrate new projects into existing firms?
We begin our empirical analysis by estimating how project and group characteristic affect
the group’s choice between integration and non-integration. To this end, we estimate the
logit regression (1) with Integratep as the dependent variable. The sample for this regression
has one observation per project. In all specifications, the standard errors are robust and
clustered at the individual group level. The results of the estimation are presented in Table
III.
In Columns (1) through (3), we estimate the regression with only the project characteris-
tics as independent variables. As mentioned earlier, we use project’s industry characteristics
to proxy for project profitability, growth rate, leverage and tangibility. The negative and
significant coefficient on Log(Project Cost) in all the columns indicates that larger projects
are more likely to be implemented as stand-alone firms. This result is consistent with the
synergy hypothesis as the benefits from tailoring capital structure to suit project needs is
likely to be greater for larger projects. The negative and significant coefficient on Group
Diversify indicates that when a group enters a new industry it is more likely to implement
the project in a new firm. This result is also consistent with the synergy hypothesis.
The negative coefficient on High ROA Ind. indicates that projects from profitable in-
dustries are more likely to be implemented as stand-alone firms. This is consistent with the
subsidization hypothesis that predicts that projects from low profitability industries, that
are more likely to need some cash flow support, are likely to be integrated. Other industry
characteristics such as past sales growth rate, tangibility and leverage do not have any effect
on the decision to integrate. The positive coefficient on No of IPOs in Column (3) sug-
gests that business groups are more likely to integrate projects that are in industries with
a high level of IPO activity. We believe that this result is driven by the non-diversification,
expansion projects in our sample. A high IPO activity in an industry is likely to indicate
more investment opportunities in the industry. Group firms in such industries are likely to
announce expansion projects, which are more likely to be integrated for synergy motives.
In Column (4), we repeat our estimation after including business group characteristics
such as size, profitability, investment intensity, leverage and growth as independent vari-
ables, in addition to the project characteristics that we found to be significant in Columns
(1)–(3). We find that large and profitable business groups are more likely to implement
new investment projects within existing firms (positive coefficients on Large Group and
High ROA Group), while groups with high investment needs are more likely to set up new
firms to implement new investment projects (negative sign on High Investment Group in
Column (5)). We further find that groups with high leverage are more likely to implement
projects within existing firms.
12

To summarize the results in Table III, business groups are less likely to integrate large
projects and projects from profitable industries. Large and profitable groups with low
investment needs are more likely to integrate new projects into existing firms. A key de-
terminant of whether a project is integrated or not is whether the business group has an
existing firm in the same industry; i.e., when business groups diversify into new industries,
they are more likely to do so by setting up new firms.
Observe that while the coefficients on the group characteristics such as group size and
profitability in Table III are consistent with the subsidization hypothesis, they are also
consistent with the synergy hypothesis. This is because firms from large and more profitable
groups are more likely to undertake expansion projects in the same industry. These projects
are also likely to to be integrated for synergy reasons. One way to distinguish between the
subsidization and synergy hypotheses is to examine the choice between integration and non-
integration for diversification projects; i.e., projects that are not in the same industry as
any of the groups’ existing firms.
Table IV summarizes the results of our regressions investigating why business groups
integrate diversification projects into existing group firms. Specifically, we estimate the logit
regression (1) with Integrate-Dp as the dependent variable. Recall that Integrate-Dp is a
dummy variable that takes the value one if the project is integrated but is not in the same
2-digit NIC industry as any of the existing group firms, and zero otherwise. The sample for
this regression is the same as that in Table III, and we use the same set of control variables,
with the exception of the variable Group Diversify.
In Columns (1) through (3), we estimate the regression with only the project and in-
dustry characteristics as independent variables. Because leverage and tangibility are highly
correlated, we do not include them both together in the same specification. Our results
indicate that business groups are more likely to integrate diversification projects from low
profitability industries into existing firms. This result provides strong support for the subsi-
dization hypothesis. Industry characteristics like growth rates, leverage and asset tangibility
do not have any impact on business groups’ propensity to integrate diversification projects.
The negative coefficient on No. of IPOs in Column (3) indicates that business groups are
also more likely to integrate diversification projects from industries with low IPO activity.
This finding offers further support to the subsidization hypothesis because a low level of IPO
activity in the project’s industry could indicate difficulty in raising outside equity capital.
The business group’s ability to use its internal capital market to subsidize projects is likely
to be most valuable under such circumstances. This finding is consistent with the notion
that there is a social benefit to diversification by Indian business groups (Khanna et al.
(1998)) because business groups seek out entrepreneurial ventures in industries that are not
13

very well developed and hence for which external finance is less available.
In Columns (4), we repeat our estimation after including group characteristics as in-
dependent variables, in addition to the industry characteristics found to be significant in
Columns (1)–(3). We find that business groups that have low growth rates are more likely
to integrate diversification projects into existing firms. The low growth rate may reflect the
lack of investment opportunities for the existing firms in their industry and hence the deci-
sion to diversify. Other group characteristics like size, profitability and investment intensity
do not affect a group’s propensity to integrate diversification projects.
In unreported tests, we examine business groups’ propensity to diversify into new indus-
tries and the types of industries that they diversify into. To do this, we estimate regressions
similar to (1) with the dependent variable being Group Diversify, a dummy variable that
identifies instances where a business group diversifies into a new industry. We find that
groups are more likely to diversify into high growth industries, and industries with low IPO
activity. We further find that small groups, groups with low investment needs and groups
with low sales growth rates are more likely to diversify into new industries. We do not find
any evidence that a business group’s profitability or leverage has any effect on its propen-
sity to diversify into a new industry. These results highlight that an important reason for
business groups to diversify is to seek out new growth opportunities, especially when there
are limited growth opportunities in their existing industries.
3.2 Which group firms are new projects integrated into?
Our results so far suggest that a business group is more likely to integrate a new project into
an existing group firm if the project is small in size, is not from a profitable industry, and
is from an industry that the group already has a presence in. In this section, we examine
the characteristics of the group firms into which new projects are integrated. Typically, the
insider of the business group has effective control over all the firms within the group and
can choose to integrate the new project into any of the group firms. Apart from testing
the synergy and subsidization hypotheses, our tests in this section will also help us test the
expropriation hypothesis.
Because non-integrated projects, by definition, are housed in new firms, we conduct this
analysis on only the integrated projects in our sample. We estimate the regression (2) as a
linear probability model with Integrateft, a dummy variable that takes a value one if a group
firm announces a project in a year and zero otherwise. We employ a linear probability model
instead of a logit model because we include several interaction terms in our specification,
and also include group fixed effects. The coefficients on interaction terms are difficult to
interpret in a logit model, and inclusion of fixed effects in a non-linear model is subject to
14

the incidental parameters problem (Wooldridge (2002)) The sample for this regression has
one observation for each firm-project-year combination and includes firms from all groups
with more than three firms in a year. The restriction to groups with at least three firms
ensures that there is sufficient variation in firm characteristics within the group. However,
our qualitative results hold even without this restriction. We include year fixed effects and
group fixed effects in the regressions. In all specifications, the standard errors are robust
and clustered at the level of the business group undertaking the project. The results of our
estimation are presented in Table V.
In Column (1), we investigate the impact of firm characteristics like size, profitability
and promoter holding on the probability that a new investment project will be integrated
with the firm’s existing operations. The positive and significant coefficient on Same Industry
indicates that projects are more likely to be integrated within firms from the same industry.
We also find that projects are more likely to be integrated in larger, more profitable firms
and firms that have recently experienced high sales growth (positive coefficients on Log(Total
Assets) and ROA and Sales growth). As before, these results are consistent both with the
synergy and subsidization hypotheses. Because larger firms, more profitable firms and fast
growing firms are more likely to undertake expansion projects, the integration decision
may be driven by the operating synergies between the project and the existing operations.
Alternatively, large and more profitable firms are more likely to have surplus cash flow which
can be used to finance new investment opportunities. Thus these results are consistent
with the subsidization hypothesis. We distinguish between these two hypothesis when we
examine diversification projects in Table VI.
As we highlight in the introduction, the insiders’ choice of where to house a new project
can also be driven by a desire to expropriate funds from the group’s minority sharehold-
ers. Insiders can expropriate minority shareholders by selectively implementing profitable
projects in high insider holding firms. To test this prediction, we include Insider Holding
as an additional regressor. As can be seen, the coefficient on Insider Holding is not signif-
icantly different from zero, which indicates that on average groups are not more likely to
implement new projects in high insider holding firms.
Given the large difference in the announcement effects for the new projects, not all new
projects may be positive NPV. Hence in Column (2), we investigate if profitable projects,
i.e., those from profitable industries are more likely to be housed in group firms with higher
insider shareholding. To do this, we repeat our estimation after including the interaction
term High ROA Ind.× Insider Holding. As can be seen, the coefficient on the interaction
term is not significantly different from zero.
In Column (3), we repeat the estimation after including an interaction term between
15

Insider Holding and ROA to see if groups are more likely to house projects in profitable
group firms with high insider holding. As can be seen, the coefficient on the interaction
term is not significantly different from zero.
The decision to integrate a new project within a group firm may also depend on the
insider family’s control over the firm’s board of directors. Intuitively, it should be easier for
the family to house a new project within a group firm in which they control more board
seats.Recall that we use Family Directors as a proxy for the family’s control over the firm’s
board. We also control for the size of the firm’s board of directors using the variable Board
Size.
The positive coefficients on Board Size and Family Directors in Column (4) indicate that,
on average, new projects are more likely to be integrated in group firms with large boards
and boards dominated by the insider’s family. However, the insignificant coefficient on the
interaction term, High ROA Ind. × Family Directors, in Column (5) suggests that projects
from profitable industries are not more likely to be integrated in firms dominated by the
insiders’ family. The positive coefficient on the interaction term, ROA × Family Directors,
does indicate that new projects are more likely to be integrated in profitable group firms if
the boards of these firms have more family directors.
There are two possible interpretations for the results in Columns (4) through (6). Be-
cause large family-dominated boards suggest poor governance, one way to interpret these
results is that new projects are more likely to be housed in poorly governed firms, especially
when they happen to be profitable. Alternatively, it could be that the family maintains
greater control over the most valuable businesses in the group, and selectively implements
projects in these firms. We will try to disentangle these explanations when we examine the
stock market reaction to project announcements.
To summarize the results in Table V, we find that projects are more likely to be inte-
grated in group firms from the same industry, and in large and profitable group firms. In
terms of board characteristics, new projects are more likely to be integrated in firms with
large family-dominated boards. Moreover, profitable group firms are more likely to house
new projects when they have family-dominated boards.
We noted earlier that the positive coefficients on Log(Total Assets) and ROA are con-
sistent with both the synergy hypothesis as well as the subsidization hypothesis. To better
distinguish between these two hypotheses, we examine the propensity of group firms to
house diversification projects. Specifically, we estimate regression (2) with Integrate-Dft as
the dependent variable. Recall that Integrate-Dft is a dummy variable that takes the value
one if firm ‘f’ announces a diversification project, and zero otherwise. The results of our
estimation are presented in Table VI. The empirical specification and control variables are
16
very similar to those in Table V.
The positive and significant coefficients on Log(Total Assets), ROA and Sales growth
in Column (1) indicate that larger, profitable group firms and group firms with high sales
growth are more likely to diversify into new industries. This finding is strongly supportive
of the subsidization hypothesis. Similar to our results in Table V, we do not find that insider
holding affects the firm’s decision to diversify.
In Column (2), we repeat our estimation after including the interaction term High ROA
Ind. × Insider Holding. The positive and significant coefficient on the interaction term
indicates that group firms with high insider holding are more likely to diversify into more
profitable industries. The coefficient is also economically significant. The coefficient indi-
cates that a group firm with insider holding one standard deviation above the sample mean
is 1% more likely to implement a diversification project in a high profitability industry. As
compared to this, the average probability of any group firm implementing a diversification
project is 2.93%. This result offers strong evidence in support of the expropriation hypoth-
esis. We do not find any evidence that profitable group firms with high insider holding
are more or less likely to diversify (insignificant coefficient on ROA × Insider Holding in
Column (3)).
In terms of board characteristics, the positive and significant coefficients on Board Size
and Family Directors in Column (4) indicate that group firms with larger boards and those
with more family directors are more likely to diversify. We do not find any evidence that
group firms with more family directors are more likely to diversify into more profitable
industries (coefficient on High ROA Ind. × Family Directors in Column (5) is not sig-
nificant). However, the positive and significant coefficient on ROA × Family Directors in
Column (6) does indicate that profitable group firms with more family directors are more
likely to diversify.
3.3 Market reaction to project announcement
Our results so far offer support to all three of our hypotheses. The result that groups
are more likely to integrate projects into firms in the same industry is consistent with
the synergy hypothesis. The fact that projects from less profitable industries are more
likely to be integrated even if they involve diversification, and that they are more likely
to be integrated into large and profitable group firms is consistent with the substitution
hypothesis. Consistent with the expropriation motive, we find that business group insiders
selectively house profitable diversification projects in group firms with high insider holding.
In this section, we study the stock market reaction to project announcements to garner
17

further evidence on the determinants of the integration decision. We compute the announce-
ment return over a 11-day window around the project’s announcement date, i.e., from day
-5 to day +5 where day 0 denotes the project announcement date. We compute the market-
adjusted announcement return as the firm’s stock return over this window adjusted for the
return on the National Stock Exchange’s (NSE) Nifty index over the same window. We
obtain stock returns from the Prowess database and returns on the Nifty Index from NSE’s
web site (http://www.nseindia.com).
Given the high variance in announcement returns, we winsorize the announcement re-
turns at the 1% level. We then estimate the regression (3) with the winsorized Announce-
ment Return as the dependent variable. Our sample for this regression includes all the
projects that are integrated into publicly listed group firms. The results of our estimation
are presented in Table VII. In all specifications, the standard errors are robust and clustered
at the individual group level.
In Column (1), we investigate the impact of insider holding on announcement returns
after controlling for various project, industry, group and firm characteristics. Since the
prediction of the expropriation hypothesis is in terms of insider holding across firms within
the group, we define the dummy variable High Insider Holding to identify group firms in
which the insider holding exceeds the median insider holding across all firms within the
group. The positive and significant coefficient on High Insider Holding indicates that the
announcement of a project is viewed positively by the stock market when the project is
announced by a group firm in which the insiders holds a high proportion of shares. This
could reflect the market’s belief that the insiders selectively implement profitable projects
in firms in which they hold a high proportion of shares, and that the returns generated
from the project will not be tunneled away to other group firms. The coefficient of 0.01
indicates that announcement returns are higher by 1% for projects announced by high
insider holding firms. This is economically significant when compared with the average
announcement return of 0.89%.
The negative coefficient on ROA indicates that the announcement return is lower when
a profitable group firm announces a project. This is consistent with the subsidization
hypothesis as the market may view project announcements by profitable firms as indicating a
greater likelihood of subsidization. The coefficient is also economically significant with a one
standard deviation increase in firm profitability being associated with a lower announcement
return of 0.93%. Other firm characteristics like size, growth and leverage do not affect
project announcement returns.
The coefficients on control variables indicate that the announcement return is not signif-
icantly affected by project cost or by whether it is a diversification project. Industry char-
18

acteristics like profitability, tangibility and growth also do not matter on average. However,
the announcement return is negative when the project is in a hot IPO industry. Finally,
group size and profitability also do not affect announcement returns on average.
Now that we have established that the stock market reacts positively to projects under-
taken by high insider holding firms within the group, we next investigate how this effect
varies in the cross-section with various firm, project, industry and group characteristics. To
do this, we repeat the regression in Column (1) after including interaction terms between
High Insider Holding and the firm, project, industry or group characteristic of interest.
While we estimate specifications after including interaction terms between High Insider
Holding and all the project, group and industry characteristics, we only report those that
were significant.
The positive and significant coefficient on the interaction term, High Insider Holding
× Sales Growth, in Column (2) indicates that the market reacts even more positively to
projects undertaken by high insider holding firms when they also happen to be high growth
firms. In unreported tests, we find that the market’s reaction to projects announced by
high insider holding firms does not vary with firms’ size, profitability or leverage.
The insignificant coefficient on the interaction term, High Insider Holding× Group Di-
versify, in Column (3) indicates that the stock market’s reaction to projects undertaken by
high insider holding firms does not vary depending on whether the project is a diversifying
project or not. In unreported tests, we also find that this effect does not vary depending
on the cost of the project.
The positive and significant coefficient on the interaction term, High Insider Holding ×High Tangibility Ind., in Column (4) indicates that the market reacts even more positively
to projects undertaken by high insider holding firms when the projects are from industries
with greater asset tangibility. Industry asset tangibility is likely to proxy for the project’s
debt capacity. In unreported tests, we find that the market’s reaction to projects announced
by high insider holding firms does not vary with industry profitability or growth.
In Column (5), we find that the market’s reaction to projects undertaken by high insider
holding firms is higher when the group’s profitability itself is high (positive coefficient on
High Insider Holding ×High ROA Group).
Overall, the results in Table VII offer further support to both the expropriation and
subsidization hypotheses. The result that the announcement return is higher for projects
undertaken in high insider ownership group firms is consistent with the expropriation hy-
pothesis. Similarly, the result that the announcement return is lower when the profitability
of the firm undertaking the project is high is consistent with the subsidization hypothesis.
19

4 Concluding remarks
In this paper, we examine the impact of project characteristics, business group character-
istics, and group firm characteristics on the business group’s choice between integrating a
new project into one of the existing firms versus establishing a new firm to implement the
project. We document that the choice between integration and non-integration by Indian
business groups is non-trivial; i.e., groups do not automatically start new firms when they
diversify into new industries; neither do they always integrate new projects into existing
firms in the same industry. For instance, 73% of the diversification projects undertaken by
Indian business groups are housed in an existing group firm.
Our results suggest that a key motive behind integration is to subsidize and support the
new project using the cash flows of an existing group firm. Consistent with this idea, we
find that larger and more profitable business groups are more likely to integrate projects,
and that the integrated projects are more likely to be from less profitable industries. Within
the group, projects are more likely to be housed in larger and more profitable group firms.
Moreover, the stock market, on average, reacts negatively to announcements of diversifica-
tion projects undertaken by group firms.
We also find evidence that suggests that insiders of business groups expropriate cash
flows from minority shareholders of the group through their investment decisions. Consistent
with this view, we find that insiders selectively house profitable projects in group firms in
which they hold a high percentage of shares. This result holds both for diversification
and non-diversification projects. Moreover, the stock market reacts positively to project
announcements by group firms that have high levels of insider share-holding, which probably
reflects the market’s belief that expropriation of cash flows is less likely in such firms.
Interestingly, while the market reacts negatively to diversification projects on average, the
reaction is positive if such projects are announced by group firms with high levels of insider
share-holding. This probably reflects the markets belief that insiders selectively implement
profitable projects in group firms in which they hold a high shareholding.
20

References
Almeida, H. and D. Wolfenzon (2006). A theory of pyramidal ownership and family business groups. Journal of
Finance 61, 2637–2681.
Bertrand, M., P. Mehta, and S. Mullainathan (2002). Ferreting out tunneling: An application to Indian business
groups. Quarterly Journal of Economics 117, 121–148.
Choudhury, M. (1999). Potential selectivity bias in aata: An evaluation of Prowess, a firm-level database on Indian
industry. SSRN working paper.
Claessens, S., S. Djankov, and L. Lang (2000). The separation of ownership and control in east asian corporations.
Journal of Financial Economics 58, 81–112.
Coase, R. H. (1937). The nature of the firm.
Flannery, M. J., J. F. Houston, and S. Venkataraman (1993). Financing multiple investment projects. Financial
Management Summer, 161–172.
Fluck, Z. and A. W. Lynch (1999). Why do firms merge and then divest? a theory of financial synergy. Journal of
Business 72, 319–346.
Friedman, E., S. Johnson, and T. Mitton (2003). Propping and tunneling. Journal of Comparative Economics 31,
732–750.
Gopalan, R., V. Nanda, and A. Seru (2007). Affiliated firms and financial support: Evidence from Indian business
groups. Journal of Financial Economics 86, 759–795.
Holmstrom, B. and J. Tirole (1993). Market liquidity and performance monitoring. Journal of Political Econ-
omy 101 (4), 678–709.
Inderst, R. and H. M. Muller (2003). Internal versus external financing: An optimal contracting approach. Journal
of Finance 58, 1033–1062.
Jensen, M. (1986). Agency costs of free cash flow, corporate finance and takeovers. American Economic Review 76,
323–29.
Johnson, S., R. La Porta, F. Lopez de Silanes, and A. Shleifer (2000). Tunneling. American Economic Review 90,
22–27.
Khanna, T. and K. Palepu (2000). Is group affiliation profitable in emerging markets? An analysis of diversified
Indian business groups. Journal of Finance 55 (2), 867–891.
Khanna, T., K. Palepu, and D. Wu (1998). The house of tata, 1995: The next generation. Harvard Business School
case 9-798-037.
Leland, H. E. (2007). Financial synergies and the optimal scope of the firm: Implications for mergers, spinoffs, and
structured finance. Journal of Finance 62, 765–807.
Lewellen, W. (1971). A pure financial rationale for the conglomerate merger. Journal of Finance 26.
Morck, R., D. Wolfenzon, and B. Yeung (2005). Corporate governance, economic entrenchment and growth. Journal
of Economic Literature 43, 657–722.
Shin, H. and Y. S. Park (1999). Financing constraints and internal capital markets: evidence from korean chaebols.
Journal of Corporate Finance 5, 169–191.
Van der Molen, R. and S. Gangopadhyay (2003). Business groups, financing constraints and investment: the case of
India. Journal of Development Studies 40, 93–119.
Wooldridge, J. M. (Ed.) (2002). Econometric analysis of cross-section and panel data. MIT Press.
21
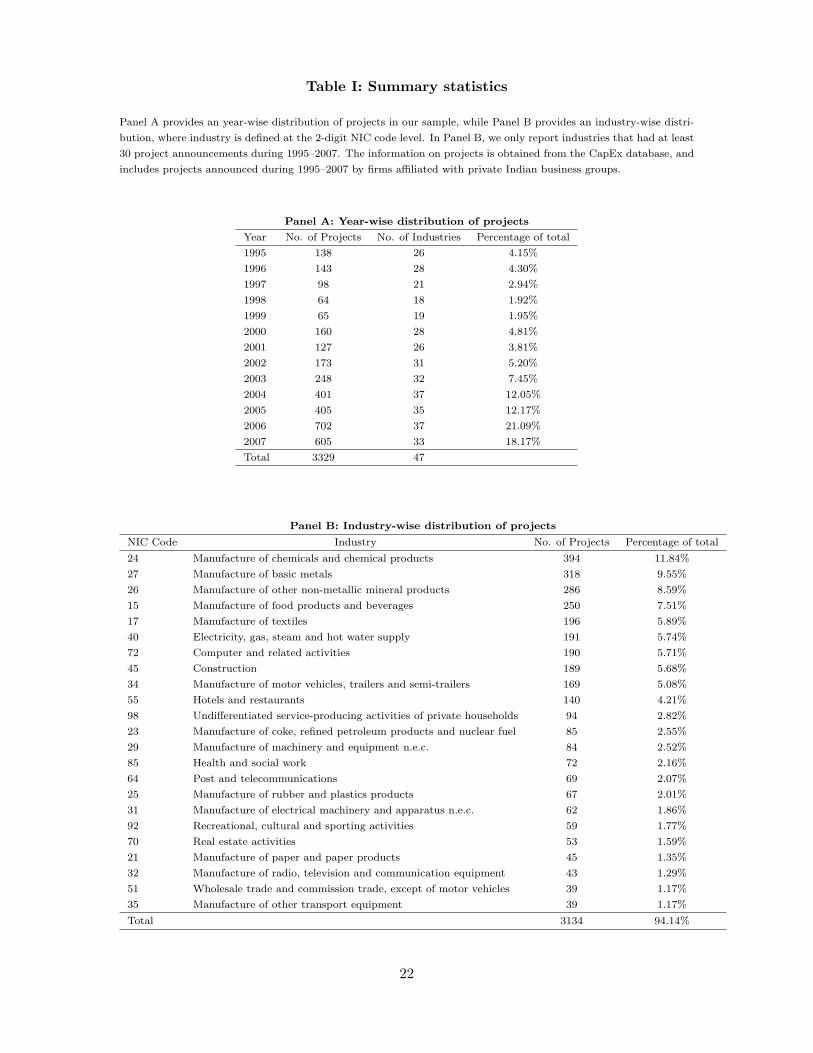
Table I: Summary statistics
Panel A provides an year-wise distribution of projects in our sample, while Panel B provides an industry-wise distri-
bution, where industry is defined at the 2-digit NIC code level. In Panel B, we only report industries that had at least
30 project announcements during 1995–2007. The information on projects is obtained from the CapEx database, and
includes projects announced during 1995–2007 by firms affiliated with private Indian business groups.
Panel A: Year-wise distribution of projects
Year No. of Projects No. of Industries Percentage of total
1995 138 26 4.15%
1996 143 28 4.30%
1997 98 21 2.94%
1998 64 18 1.92%
1999 65 19 1.95%
2000 160 28 4.81%
2001 127 26 3.81%
2002 173 31 5.20%
2003 248 32 7.45%
2004 401 37 12.05%
2005 405 35 12.17%
2006 702 37 21.09%
2007 605 33 18.17%
Total 3329 47
Panel B: Industry-wise distribution of projects
NIC Code Industry No. of Projects Percentage of total
24 Manufacture of chemicals and chemical products 394 11.84%
27 Manufacture of basic metals 318 9.55%
26 Manufacture of other non-metallic mineral products 286 8.59%
15 Manufacture of food products and beverages 250 7.51%
17 Manufacture of textiles 196 5.89%
40 Electricity, gas, steam and hot water supply 191 5.74%
72 Computer and related activities 190 5.71%
45 Construction 189 5.68%
34 Manufacture of motor vehicles, trailers and semi-trailers 169 5.08%
55 Hotels and restaurants 140 4.21%
98 Undifferentiated service-producing activities of private households 94 2.82%
23 Manufacture of coke, refined petroleum products and nuclear fuel 85 2.55%
29 Manufacture of machinery and equipment n.e.c. 84 2.52%
85 Health and social work 72 2.16%
64 Post and telecommunications 69 2.07%
25 Manufacture of rubber and plastics products 67 2.01%
31 Manufacture of electrical machinery and apparatus n.e.c. 62 1.86%
92 Recreational, cultural and sporting activities 59 1.77%
70 Real estate activities 53 1.59%
21 Manufacture of paper and paper products 45 1.35%
32 Manufacture of radio, television and communication equipment 43 1.29%
51 Wholesale trade and commission trade, except of motor vehicles 39 1.17%
35 Manufacture of other transport equipment 39 1.17%
Total 3134 94.14%
22
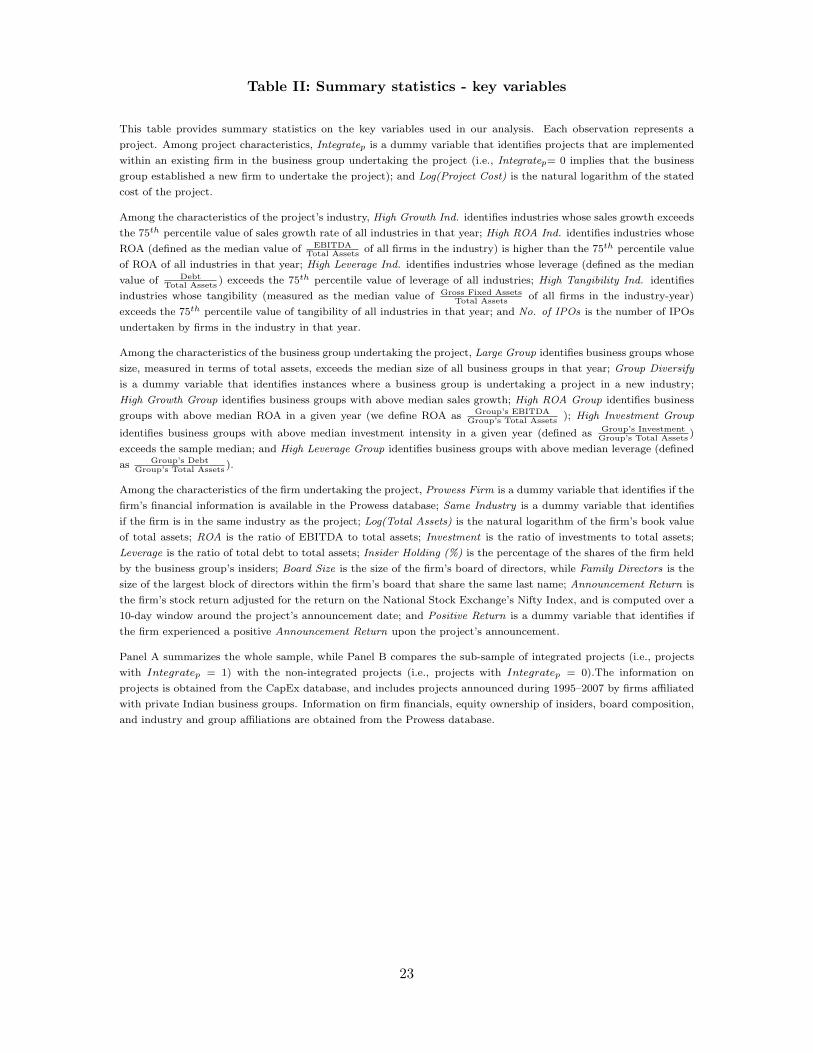
Table II: Summary statistics - key variables
This table provides summary statistics on the key variables used in our analysis. Each observation represents a
project. Among project characteristics, Integratep is a dummy variable that identifies projects that are implemented
within an existing firm in the business group undertaking the project (i.e., Integratep= 0 implies that the business
group established a new firm to undertake the project); and Log(Project Cost) is the natural logarithm of the stated
cost of the project.
Among the characteristics of the project’s industry, High Growth Ind. identifies industries whose sales growth exceeds
the 75th percentile value of sales growth rate of all industries in that year; High ROA Ind. identifies industries whose
ROA (defined as the median value of EBITDATotal Assets
of all firms in the industry) is higher than the 75th percentile value
of ROA of all industries in that year; High Leverage Ind. identifies industries whose leverage (defined as the median
value of DebtTotal Assets
) exceeds the 75th percentile value of leverage of all industries; High Tangibility Ind. identifies
industries whose tangibility (measured as the median value of Gross Fixed AssetsTotal Assets
of all firms in the industry-year)
exceeds the 75th percentile value of tangibility of all industries in that year; and No. of IPOs is the number of IPOs
undertaken by firms in the industry in that year.
Among the characteristics of the business group undertaking the project, Large Group identifies business groups whose
size, measured in terms of total assets, exceeds the median size of all business groups in that year; Group Diversify
is a dummy variable that identifies instances where a business group is undertaking a project in a new industry;
High Growth Group identifies business groups with above median sales growth; High ROA Group identifies business
groups with above median ROA in a given year (we define ROA as Group’s EBITDAGroup’s Total Assets
); High Investment Group
identifies business groups with above median investment intensity in a given year (defined as Group’s InvestmentGroup’s Total Assets
)
exceeds the sample median; and High Leverage Group identifies business groups with above median leverage (defined
as Group’s DebtGroup’s Total Assets
).
Among the characteristics of the firm undertaking the project, Prowess Firm is a dummy variable that identifies if the
firm’s financial information is available in the Prowess database; Same Industry is a dummy variable that identifies
if the firm is in the same industry as the project; Log(Total Assets) is the natural logarithm of the firm’s book value
of total assets; ROA is the ratio of EBITDA to total assets; Investment is the ratio of investments to total assets;
Leverage is the ratio of total debt to total assets; Insider Holding (%) is the percentage of the shares of the firm held
by the business group’s insiders; Board Size is the size of the firm’s board of directors, while Family Directors is the
size of the largest block of directors within the firm’s board that share the same last name; Announcement Return is
the firm’s stock return adjusted for the return on the National Stock Exchange’s Nifty Index, and is computed over a
10-day window around the project’s announcement date; and Positive Return is a dummy variable that identifies if
the firm experienced a positive Announcement Return upon the project’s announcement.
Panel A summarizes the whole sample, while Panel B compares the sub-sample of integrated projects (i.e., projects
with Integratep = 1) with the non-integrated projects (i.e., projects with Integratep = 0).The information on
projects is obtained from the CapEx database, and includes projects announced during 1995–2007 by firms affiliated
with private Indian business groups. Information on firm financials, equity ownership of insiders, board composition,
and industry and group affiliations are obtained from the Prowess database.
23
Panel A: Summary statistics - key variables
Mean Median Std. dev Min p25 p75 Max N
Project Characteristics
Integrate 0.819 1 0.385 0 1 1 1 3331
Integrate-D 0.245 0 0.430 0 0 0 1 3331
Log(Project Cost) 4.674 4.605 1.858 0 3.401 5.829 10.597 2582
Announcement Return 0.89% -0.04% 8.47% -18.23% -4.14% 4.43% 30.92% 2164
Project Industry Characteristics
High Growth Ind. 0.276 0 0.447 0 0 1 1 3325
High ROA Ind. 0.230 0 0.421 0 0 0 1 3325
High Leverage Ind. 0.398 0 0.490 0 0 1 1 3325
High Tangibility Ind. 0.369 0 0.483 0 0 1 1 3325
Group Characteristics
Large Group 0.906 1 0.291 0 1 1 1 3329
Group Diversify 0.336 0 0.472 0 0 1 1 3331
High Growth Group 0.632 1 0.482 0 0 1 1 3331
High ROA Group 0.674 1 0.469 0 0 1 1 3331
High Investment Group 0.712 1 0.453 0 0 1 1 3331
High Leverage Group 0.495 0 0.500 0 0 1 1 3331
Firm Characteristics
Prowess Firm 0.797 1 0.402 0 1 1 1 3331
Log(Total Assets) 6.576 6.489 1.842 -3.507 5.401 7.755 11.675 2655
Sales growth 0.344 0.210 0.971 -1 0.080 0.392 13.288 2530
ROA 0.197 0.175 0.138 -0.349 0.122 0.235 0.957 2587
Investment 0.137 0.060 0.193 0 0.011 0.177 0.990 2587
Leverage 0.339 0.268 0.352 0 0.140 0.442 3.189 2587
Insider Holding (%) 49.68% 49.98% 17.70% 0.00% 36.77% 62.16% 98.78% 2378
Board Size 10.871 11 3.473 1 9 13 29 2896
Family Directors 2.310 2 1.193 1 1 3 10 2896
Panel B: Univariate Tests
Non-integrated Integrated Difference
Log(Project Cost) 5.097 4.587 -0.510∗∗∗
Prowess Firm 0.167 0.936 0.769∗∗∗
High Growth Ind. 0.339 0.262 -0.077∗∗∗
High ROA Ind. 0.264 0.223 -0.041∗∗
High Tangibility Ind. 0.379 0.367 -0.011
High Leverage Ind. 0.412 0.395 -0.017
Large Group 0.884 0.911 0.028∗∗
Group Diversify 0.496 0.701 0.205∗∗∗
High ROA Group 0.549 0.701 0.152∗∗∗
High Investment Group 0.738 0.706 -0.032
High Leverage Group 0.476 0.499 0.023
Log(Total Assets) 3.543 6.696 3.153∗∗∗
ROA 0.076 0.200 0.124∗∗∗
Insider Holding 0.563 0.495 -0.068∗∗∗
Family Directors 1.812 2.342 0.530∗∗∗
24
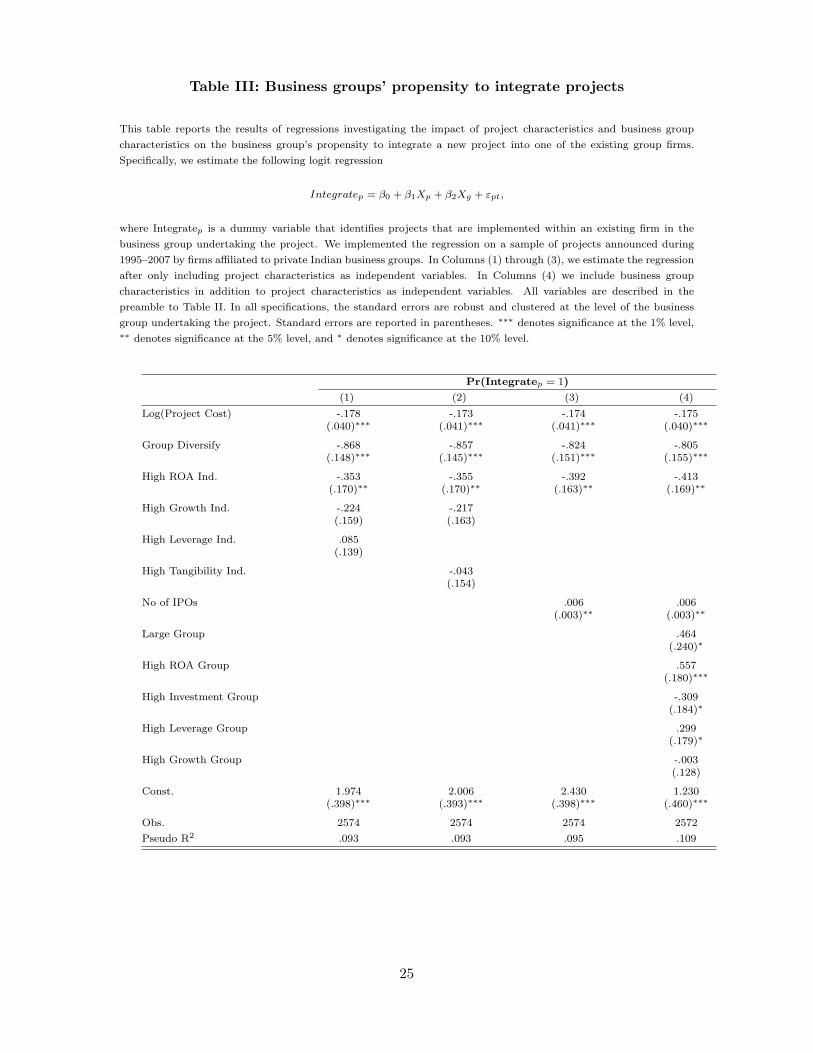
Table III: Business groups’ propensity to integrate projects
This table reports the results of regressions investigating the impact of project characteristics and business group
characteristics on the business group’s propensity to integrate a new project into one of the existing group firms.
Specifically, we estimate the following logit regression
Integratep = β0 + β1Xp + β2Xg + εpt,
where Integratep is a dummy variable that identifies projects that are implemented within an existing firm in the
business group undertaking the project. We implemented the regression on a sample of projects announced during
1995–2007 by firms affiliated to private Indian business groups. In Columns (1) through (3), we estimate the regression
after only including project characteristics as independent variables. In Columns (4) we include business group
characteristics in addition to project characteristics as independent variables. All variables are described in the
preamble to Table II. In all specifications, the standard errors are robust and clustered at the level of the business
group undertaking the project. Standard errors are reported in parentheses. ∗∗∗ denotes significance at the 1% level,∗∗ denotes significance at the 5% level, and ∗ denotes significance at the 10% level.
Pr(Integratep = 1)
(1) (2) (3) (4)
Log(Project Cost) -.178 -.173 -.174 -.175(.040)∗∗∗ (.041)∗∗∗ (.041)∗∗∗ (.040)∗∗∗
Group Diversify -.868 -.857 -.824 -.805(.148)∗∗∗ (.145)∗∗∗ (.151)∗∗∗ (.155)∗∗∗
High ROA Ind. -.353 -.355 -.392 -.413(.170)∗∗ (.170)∗∗ (.163)∗∗ (.169)∗∗
High Growth Ind. -.224 -.217(.159) (.163)
High Leverage Ind. .085(.139)
High Tangibility Ind. -.043(.154)
No of IPOs .006 .006(.003)∗∗ (.003)∗∗
Large Group .464(.240)∗
High ROA Group .557(.180)∗∗∗
High Investment Group -.309(.184)∗
High Leverage Group .299(.179)∗
High Growth Group -.003(.128)
Const. 1.974 2.006 2.430 1.230(.398)∗∗∗ (.393)∗∗∗ (.398)∗∗∗ (.460)∗∗∗
Obs. 2574 2574 2574 2572
Pseudo R2 .093 .093 .095 .109
25
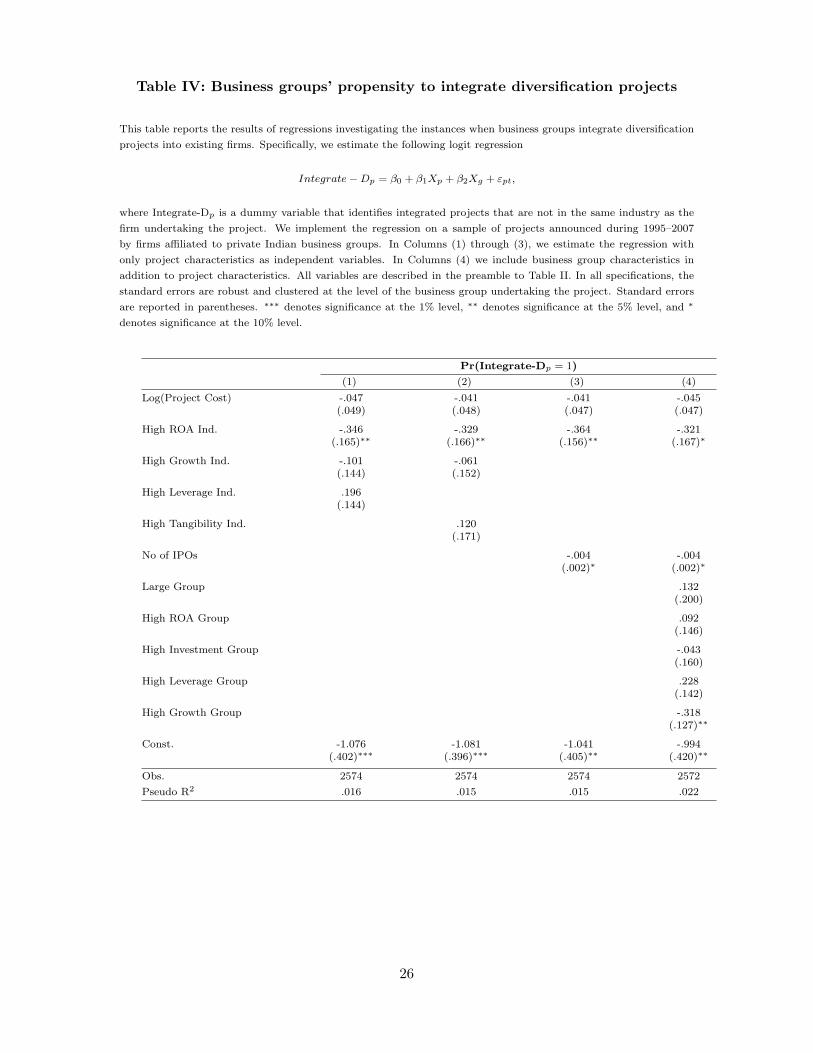
Table IV: Business groups’ propensity to integrate diversification projects
This table reports the results of regressions investigating the instances when business groups integrate diversification
projects into existing firms. Specifically, we estimate the following logit regression
Integrate−Dp = β0 + β1Xp + β2Xg + εpt,
where Integrate-Dp is a dummy variable that identifies integrated projects that are not in the same industry as the
firm undertaking the project. We implement the regression on a sample of projects announced during 1995–2007
by firms affiliated to private Indian business groups. In Columns (1) through (3), we estimate the regression with
only project characteristics as independent variables. In Columns (4) we include business group characteristics in
addition to project characteristics. All variables are described in the preamble to Table II. In all specifications, the
standard errors are robust and clustered at the level of the business group undertaking the project. Standard errors
are reported in parentheses. ∗∗∗ denotes significance at the 1% level, ∗∗ denotes significance at the 5% level, and ∗
denotes significance at the 10% level.
Pr(Integrate-Dp = 1)
(1) (2) (3) (4)
Log(Project Cost) -.047 -.041 -.041 -.045(.049) (.048) (.047) (.047)
High ROA Ind. -.346 -.329 -.364 -.321(.165)∗∗ (.166)∗∗ (.156)∗∗ (.167)∗
High Growth Ind. -.101 -.061(.144) (.152)
High Leverage Ind. .196(.144)
High Tangibility Ind. .120(.171)
No of IPOs -.004 -.004(.002)∗ (.002)∗
Large Group .132(.200)
High ROA Group .092(.146)
High Investment Group -.043(.160)
High Leverage Group .228(.142)
High Growth Group -.318(.127)∗∗
Const. -1.076 -1.081 -1.041 -.994(.402)∗∗∗ (.396)∗∗∗ (.405)∗∗ (.420)∗∗
Obs. 2574 2574 2574 2572
Pseudo R2 .016 .015 .015 .022
26

Table V: Firm characteristics and propensity to integrated new projects
This table reports the results of regressions investigating how the business group insiders’ choice of the group firm
in which to house a new project varies depending on characteristics of the firms within the group. We estimate the
linear probability regression
Integrateft = β0 + β1Xp + β3Xf + µt + µg + εpt,
where Integratefp is a dummy variable that identifies if firm ‘f’ announces a project in year ‘t’. The sample for this
regression has one observation for each firm-project-year combination, and includes all firms belonging to business
groups that have at least 3 firms in a year. All variables are described in the preamble to Table II. We include year
fixed effects and group fixed effects in all specifications, and the standard errors are robust and clustered at the level
of the business group undertaking the project. Standard errors are reported in parentheses. ∗∗∗ denotes significance
at the 1% level, ∗∗ denotes significance at the 5% level, and ∗ denotes significance at the 10% level.
Pr(Integrateft = 1)
(1) (2) (3) (4) (5) (6)
Same Industry .273 .273 .273 .230 .231 .230(.028)∗∗∗ (.028)∗∗∗ (.028)∗∗∗ (.025)∗∗∗ (.025)∗∗∗ (.025)∗∗∗
Vertically Integrated .029 .028 .029 .019 .019 .019(.019) (.019) (.019) (.011)∗ (.011)∗ (.011)∗
Log(Total Assets) .041 .041 .041 .025 .025 .024(.014)∗∗∗ (.014)∗∗∗ (.014)∗∗∗ (.006)∗∗∗ (.006)∗∗∗ (.006)∗∗∗
ROA .055 .056 .058 .038 .038 .044(.027)∗∗ (.027)∗∗ (.034)∗ (.012)∗∗∗ (.012)∗∗∗ (.015)∗∗∗
Sales Growth .007 .007 .007 -.003 -.003 -.002(.003)∗∗∗ (.003)∗∗∗ (.003)∗∗∗ (.001)∗∗ (.001)∗∗ (.001)∗
Insider Holding (%) -.0009 -.005 .0004(.038) (.042) (.041)
High ROA Ind. -.009 -.005(.007) (.005)
High ROA Ind. × Insider Holding .0002(.0004)
ROA × Insider Holding -.0005(.002)
Board Size .006 .006 .006(.003)∗ (.003)∗ (.003)∗∗
Family Directors .019 .019 .020(.007)∗∗ (.008)∗∗ (.008)∗∗
High ROA Ind. × Family Directors -.002(.007)
ROA × Family Directors .046(.027)∗
Const. -.173 -.170 -.174 -.156 -.164 -.158(.102)∗ (.103)∗ (.105)∗ (.067)∗∗ (.066)∗∗ (.067)∗∗
Obs. 14519 14483 14519 26666 26590 26666
R2 .348 .349 .348 .287 .287 .288
27
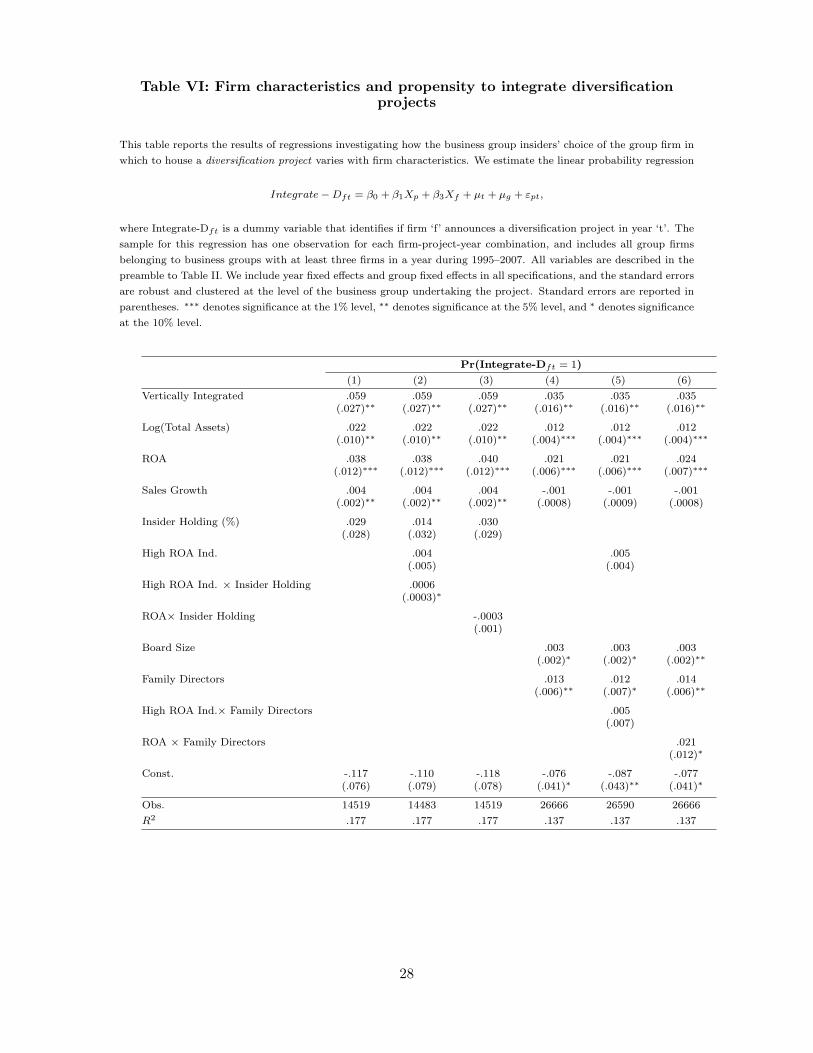
Table VI: Firm characteristics and propensity to integrate diversificationprojects
This table reports the results of regressions investigating how the business group insiders’ choice of the group firm in
which to house a diversification project varies with firm characteristics. We estimate the linear probability regression
Integrate−Dft = β0 + β1Xp + β3Xf + µt + µg + εpt,
where Integrate-Dft is a dummy variable that identifies if firm ‘f’ announces a diversification project in year ‘t’. The
sample for this regression has one observation for each firm-project-year combination, and includes all group firms
belonging to business groups with at least three firms in a year during 1995–2007. All variables are described in the
preamble to Table II. We include year fixed effects and group fixed effects in all specifications, and the standard errors
are robust and clustered at the level of the business group undertaking the project. Standard errors are reported in
parentheses. ∗∗∗ denotes significance at the 1% level, ∗∗ denotes significance at the 5% level, and ∗ denotes significance
at the 10% level.
Pr(Integrate-Dft = 1)
(1) (2) (3) (4) (5) (6)
Vertically Integrated .059 .059 .059 .035 .035 .035(.027)∗∗ (.027)∗∗ (.027)∗∗ (.016)∗∗ (.016)∗∗ (.016)∗∗
Log(Total Assets) .022 .022 .022 .012 .012 .012(.010)∗∗ (.010)∗∗ (.010)∗∗ (.004)∗∗∗ (.004)∗∗∗ (.004)∗∗∗
ROA .038 .038 .040 .021 .021 .024(.012)∗∗∗ (.012)∗∗∗ (.012)∗∗∗ (.006)∗∗∗ (.006)∗∗∗ (.007)∗∗∗
Sales Growth .004 .004 .004 -.001 -.001 -.001(.002)∗∗ (.002)∗∗ (.002)∗∗ (.0008) (.0009) (.0008)
Insider Holding (%) .029 .014 .030(.028) (.032) (.029)
High ROA Ind. .004 .005(.005) (.004)
High ROA Ind. × Insider Holding .0006(.0003)∗
ROA× Insider Holding -.0003(.001)
Board Size .003 .003 .003(.002)∗ (.002)∗ (.002)∗∗
Family Directors .013 .012 .014(.006)∗∗ (.007)∗ (.006)∗∗
High ROA Ind.× Family Directors .005(.007)
ROA × Family Directors .021(.012)∗
Const. -.117 -.110 -.118 -.076 -.087 -.077(.076) (.079) (.078) (.041)∗ (.043)∗∗ (.041)∗
Obs. 14519 14483 14519 26666 26590 26666
R2 .177 .177 .177 .137 .137 .137
28

Table VII: Market reaction to project announcements by group firms
This table reports the results of regressions investigating the stock market’s reaction to the announcement of a new
project by a group firm. We use a 10-day window around the projects announcement date (i.e., from day -5 to day
+5 where day 0 denotes the project announcement date) to compute the announcement return, which is measured as
the firms stock return over this window adjusted for the return on the National Stock Exchanges (NSE) Nifty index
over the same window. We estimate the following OLS regression
Announcep = β0 + β1Xg + β2Xp + β3Xf + µt + εpt,
where Announcep is the announcement return for project ‘p’. The sample for this regression includes all projects
announced by existing group firms. We include year fixed effects in all specifications, and the standard errors are
robust and clustered at the level of the business group undertaking the project. All other variables are described in
the preamble to Table II. Standard errors are reported in parentheses. ∗∗∗ denotes significance at the 1% level, ∗∗
denotes significance at the 5% level, and ∗ denotes significance at the 10% level.
29
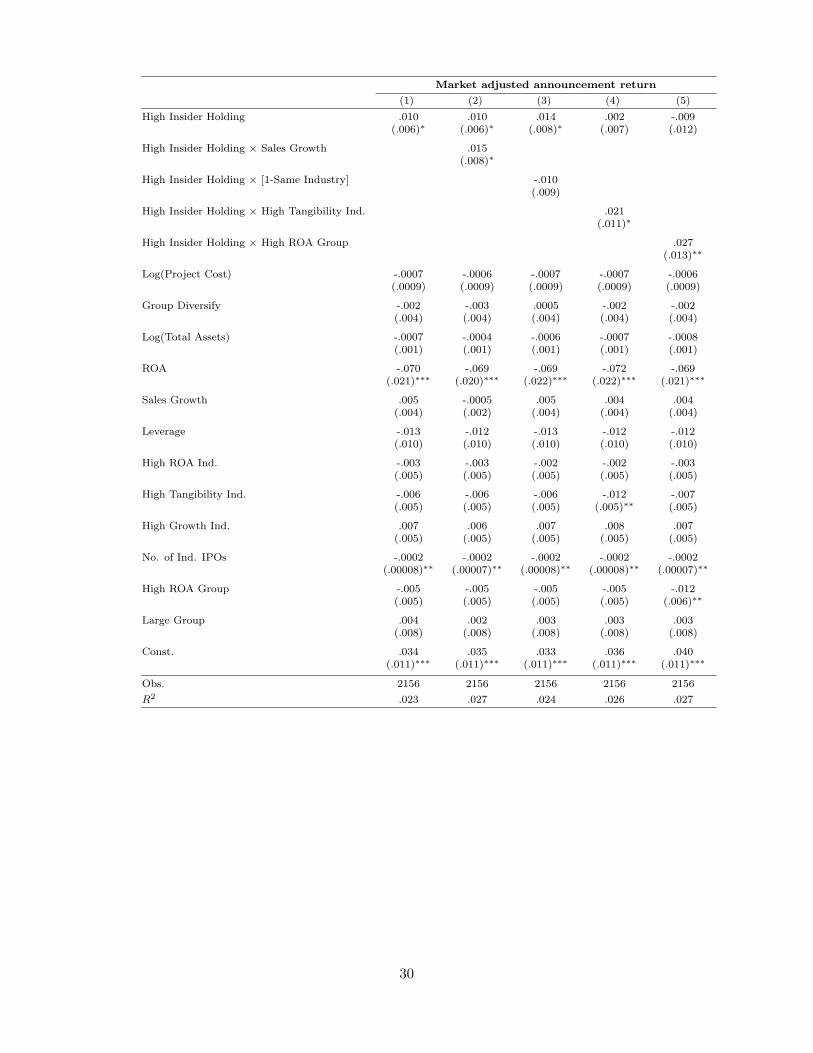
Market adjusted announcement return
(1) (2) (3) (4) (5)
High Insider Holding .010 .010 .014 .002 -.009(.006)∗ (.006)∗ (.008)∗ (.007) (.012)
High Insider Holding × Sales Growth .015(.008)∗
High Insider Holding × [1-Same Industry] -.010(.009)
High Insider Holding × High Tangibility Ind. .021(.011)∗
High Insider Holding × High ROA Group .027(.013)∗∗
Log(Project Cost) -.0007 -.0006 -.0007 -.0007 -.0006(.0009) (.0009) (.0009) (.0009) (.0009)
Group Diversify -.002 -.003 .0005 -.002 -.002(.004) (.004) (.004) (.004) (.004)
Log(Total Assets) -.0007 -.0004 -.0006 -.0007 -.0008(.001) (.001) (.001) (.001) (.001)
ROA -.070 -.069 -.069 -.072 -.069(.021)∗∗∗ (.020)∗∗∗ (.022)∗∗∗ (.022)∗∗∗ (.021)∗∗∗
Sales Growth .005 -.0005 .005 .004 .004(.004) (.002) (.004) (.004) (.004)
Leverage -.013 -.012 -.013 -.012 -.012(.010) (.010) (.010) (.010) (.010)
High ROA Ind. -.003 -.003 -.002 -.002 -.003(.005) (.005) (.005) (.005) (.005)
High Tangibility Ind. -.006 -.006 -.006 -.012 -.007(.005) (.005) (.005) (.005)∗∗ (.005)
High Growth Ind. .007 .006 .007 .008 .007(.005) (.005) (.005) (.005) (.005)
No. of Ind. IPOs -.0002 -.0002 -.0002 -.0002 -.0002(.00008)∗∗ (.00007)∗∗ (.00008)∗∗ (.00008)∗∗ (.00007)∗∗
High ROA Group -.005 -.005 -.005 -.005 -.012(.005) (.005) (.005) (.005) (.006)∗∗
Large Group .004 .002 .003 .003 .003(.008) (.008) (.008) (.008) (.008)
Const. .034 .035 .033 .036 .040(.011)∗∗∗ (.011)∗∗∗ (.011)∗∗∗ (.011)∗∗∗ (.011)∗∗∗
Obs. 2156 2156 2156 2156 2156
R2 .023 .027 .024 .026 .027
30