hydrochemistry, hydromorphology and the social...
TRANSCRIPT

Rezaul Karim, Farjana Akter and Koushik Ahmed | December 2011
2ND PHASE
MONITORING
REPORT
HYDROCHEMISTRY, HYDROMORPHOLOGY AND THE
SOCIAL DYNAMICS OF THE RIVER MAYUR

1 | P a g e
Hydrochemistry and Hydromorphology of the River Mayur: 2nd phase monitoring report Water security in Periurban South Asia: Adapting to Climate Change and Urbanization Project Study Team Team Lead Professor Dilip Kumar Datta, PhD Environmental Science Discipline, Khulna University, Khulna-9208 Supervision Kushal Roy Assistant Professor, Environmental Science Discipline, Khulna University, Khulna-9208 Prosun Kumar Ghosh Lecturer, Environmental Science Discipline, Khulna University, Khulna-9208 Data analysis, integration and reporting RezaulKarim, Research Intern MS Student, Environmental Science Discipline, Khulna University, Khulna-9208 FarjanaAkter, Research Intern MS Student, Environmental Science Discipline, Khulna University, Khulna-9208 Koushik Ahmed, Research Intern MS Student, Environmental Science Discipline, Khulna University, Khulna-9208 Reporting period July 2011- December 2011

2 | P a g e
Introduction This is the second edition of the monitoring report of Water security in Periurban South Asia: Adapting to Climate Change and Urbanization Project. This hydrochemical monitoring report covers data from 12 sampling stations featuring tidal variation. This report also covers latest social dynamics related to the water security issues in the Mayur River basin. Table 1 represents the locations of the sampling stations. Table 1: Location of monitoring stations (from country side to river side) Station No
Station's Name Latitude (N) Longitude (E) Elevation (m)
1 Hamid nagar Sluice gate 22°50´00.0´´ 89°31´05.6´´ 3 2 ChotoBoyraSosanghat 22°49´35.1´´ 89°31´46.5´´ 3 3 Opposite KMC 22°49´21.1´´ 89°31´53.9´´ 1 4 Bamboo bridge, Sonadanga 22°48´55.2´´ 89°32´10.07´´ 1.9 5 Khaderkhal 22°48´32.0´´ 89°32´13.9´´ 4.7 6 Gollamari 22°47´59.6´´ 89°32´26.4´´ 6.4 7 Buromoulovidorga bridge 22°47´47.6´´ 89°32´34.7´´ 1.8 8 MohammadnogorBiswaroad bridge 22°47´8.6´´ 89°32´19.5´´ 9 9 Sachibuniawapdakheyaghat 22°46´38.5´´ 89°32´28.9´´ 9
10 PutimariKheyaghat 22°46´17.3´´ 89°32´34.05´´ 9 11 PutimariTalghat 22°45´54.2´´ 89°33´06.0´´ 4 12 Alutola Bridge 22°45´26.6´´ 89°33´04.03´´ 5
Context Khulna City Corporation (KCC) covers an area of about 46 square kilometers with a population of around 1 million as of 2010. The density of the population is 15,429 per square kilometer. The water demand was found as 25,695,648 gallons per day in 2010, while an ADB report estimates the demand would increase up to 112,992,000 gallons per day during 2030 for an estimated population of 1.62 million. At present KWASA (Khulna WASA) supplies about 14,695,864 gallons of water per day. KWASA supplies water from 69 boreholes within KCC area. However, currently KWASA does not have any surface water reservoir for water supply. Ground water quality in KCC area has been diminishing over last couple of decades. Now-a-days quality of ground water is not good enough (in terms of Total Dissolved Solid- TDS) for supply of potable water for the citizens of KCC. Spatial analysis of TDS plots of groundwater samples over the KCC area suggests most of the area exceeds the limit of potable water quality (i.e., TDS > 1000 mgL-1) (Figure 1a and 1b). As the quality of ground water is not enough to satisfy the demand of KCC and the adjoining areas, it is, perhaps the time to turn towards surface water options. In this case, the River Mayur can play an important role being as a fresh water reservoir.

Figure 1a and 1b: Iso-TDS plot for ground water samples in the KCC area. The plots represent monsoon (left, 1a) and winter (right, 1b) samples. Data from Datta and Roy, 2010 (unpublished research report).

Study area The Mayur River borders the southwestern KCC and receives water from beel Pabla and drains to the River Rupsha. The drainage area of the Mayur is about 53 square kilometers. However the Mayur receives effluents from 48 square kilometers of KCC area, a significant area of which is urbanized. Figure 2 represents the Mayur River drainage basin and Figure 3 represents the elevation profile of the Mayur drainage basin perimeter. It is notable that the elevation is significantly high at the periphery of the urbanized area which explains the occasional drainage congestion in this portion of the Mayur river basin.
Figure 2 (top): Mayur River basin delineated using elevation data. Figure 3 (bottom): Elevation profile of the Mayur Riverbasin perimeter. The blue circles on Figure 2 and 3 indicate the urbanized zone.

1 | P a g e
Mayur river basin at a glance:
• Length: 11.69 kilometers
• Average Channel Width: 12 m- 80 m
• Tributaries: 6
• Distributaries: 2
• City drains : 22
• Major land use types: Dominated by agriculturefollowed bywetlands andurban areas (Figure 4)
• Average Sinuosity : 1.37
• Water reserve capacity: 725,732,265 us gallon (natural)1 556,542,824 us gallon (at present state)2
Figure 4: Major landuse types in the Mayur River basin area
1 preliminary estimates 2 1m3 = 264 us gallon
Urbanized
Agricultural
Agricultural area
2 | P a g e
Results and Discussion PART I: HYDROCHEMISTRY AND WATER QUALITY The first monitoring report covered results from 1st sampling period (February 2011). This 2nd monitoring report includes 2nd and 3rd sampling results (May and August 2011) including the pervious results. This results and discussion section of the report briefly presents the sampling results.
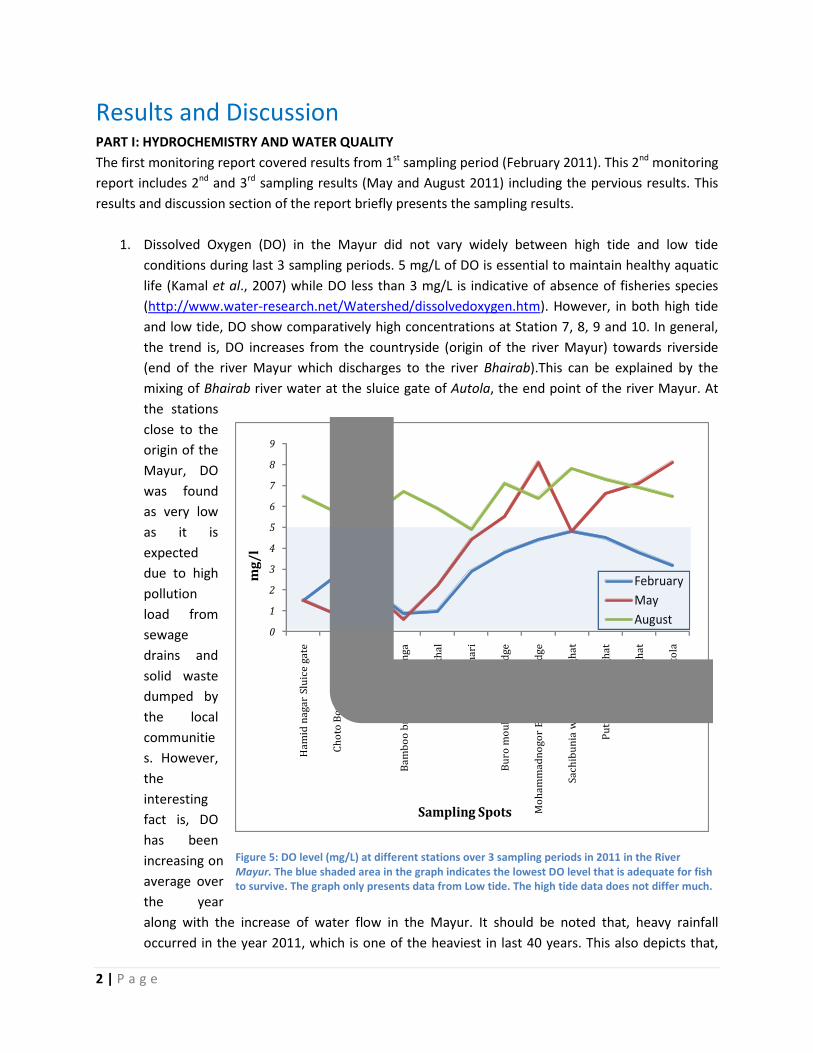
1. Dissolved Oxygen (DO) in the Mayur did not vary widely between high tide and low tide conditions during last 3 sampling periods. 5 mg/L of DO is essential to maintain healthy aquatic life (Kamal et al., 2007) while DO less than 3 mg/L is indicative of absence of fisheries species (http://www.water-research.net/Watershed/dissolvedoxygen.htm). However, in both high tide and low tide, DO show comparatively high concentrations at Station 7, 8, 9 and 10. In general, the trend is, DO increases from the countryside (origin of the river Mayur) towards riverside (end of the river Mayur which discharges to the river Bhairab).This can be explained by the mixing of Bhairab river water at the sluice gate of Autola, the end point of the river Mayur. At the stations close to the origin of the Mayur, DO was found as very low as it is expected due to high pollution load from sewage drains and solid waste dumped by the local communities. However, the interesting fact is, DO has been increasing on average over the year along with the increase of water flow in the Mayur. It should be noted that, heavy rainfall occurred in the year 2011, which is one of the heaviest in last 40 years. This also depicts that,
0
1
2
3
4
5
6
7
8
9
Ham
id n
agar
Slu
ice
gate
Chot
o Bo
yra
Sosa
ngha
t
Opp
osite
KM
C
Bam
boo
brid
ge, S
onad
anga
Khad
er k
hal
Golla
mar
i
Buro
mou
lovi
dor
ga b
ridg
e
Moh
amm
adno
gor
Bisw
aroa
d br
idge
Sach
ibun
ia w
apda
khe
ya g
hat
Putim
ari K
heya
gha
t
Putim
ari T
algh
at
Alut
ola
mg/
l
Sampling Spots
FebruaryMayAugust
Figure 5: DO level (mg/L) at different stations over 3 sampling periods in 2011 in the River Mayur. The blue shaded area in the graph indicates the lowest DO level that is adequate for fish to survive. The graph only presents data from Low tide. The high tide data does not differ much.
3 | P a g e
Mayur water quality increases with its flow, and river flow sustains like the present state, despite of the pollution, Mayur water will still be good for freshwater fisheries (DO > 5 mg/L). Both of the DO and BOD load over the sampling period also indicative of ability of pollution recovery in the river water except the places of local pollution sources (stations situated close to the origin of the Mayur. E.g., stations 1-5) (Figure 5).
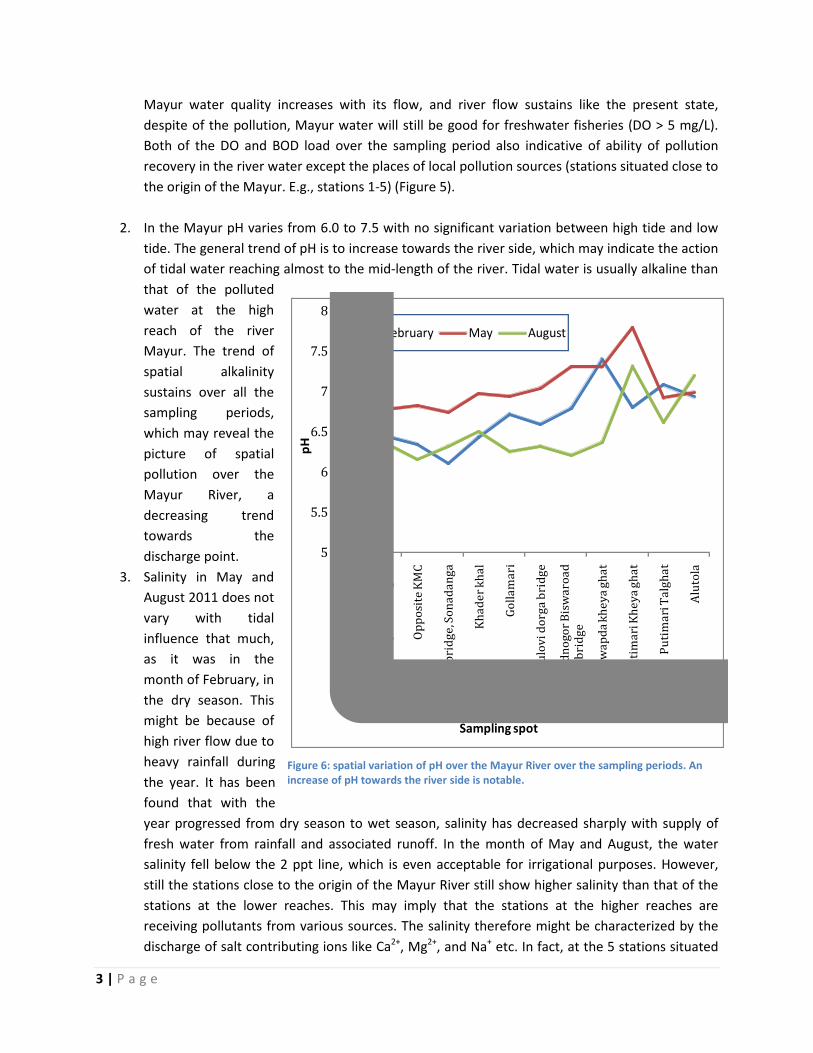
2. In the Mayur pH varies from 6.0 to 7.5 with no significant variation between high tide and low tide. The general trend of pH is to increase towards the river side, which may indicate the action of tidal water reaching almost to the mid-length of the river. Tidal water is usually alkaline than that of the polluted water at the high reach of the river Mayur. The trend of spatial alkalinity sustains over all the sampling periods, which may reveal the picture of spatial pollution over the Mayur River, a decreasing trend towards the discharge point.
3. Salinity in May and August 2011 does not vary with tidal influence that much, as it was in the month of February, in the dry season. This might be because of high river flow due to heavy rainfall during the year. It has been found that with the year progressed from dry season to wet season, salinity has decreased sharply with supply of fresh water from rainfall and associated runoff. In the month of May and August, the water salinity fell below the 2 ppt line, which is even acceptable for irrigational purposes. However, still the stations close to the origin of the Mayur River still show higher salinity than that of the stations at the lower reaches. This may imply that the stations at the higher reaches are receiving pollutants from various sources. The salinity therefore might be characterized by the discharge of salt contributing ions like Ca2+, Mg2+, and Na+ etc. In fact, at the 5 stations situated
5
5.5
6
6.5
7
7.5
8
Ham
id n
agar
Slu
ice
gate
Chot
o Bo
yra
Sosa
ngha
t
Opp
osite
KM
C
Bam
boo
brid
ge, S
onad
anga
Khad
er k
hal
Golla
mar
i
Buro
mou
lovi
dor
ga b
ridg
e
Moh
amm
adno
gor B
isw
aroa
d br
idge
Sach
ibun
ia w
apda
khe
ya gh
at
Putim
ari K
heya
ghat
Putim
ari T
algh
at
Alut
ola
pH
Sampling spot
February May August
Figure 6: spatial variation of pH over the Mayur River over the sampling periods. An increase of pH towards the river side is notable.

4 | P a g e
at the upper reach, salinity has been found highly correlated with Mg2+ and Na+ (0.94 and 0.86, p<0.05). Thus it can be interpreted as, in stations 1 to 5, Mg2+ and Na+ might not be contributed by the tidal water as these two species show low variation during low and high tide along with salinity (standard deviation = 2.26) while Mg2+ does not vary much with stations towards the river end but salinity starts to increase from station 6 to station 12(standard deviation = 3.3). The main source of Mg2+ in natural water is weathering of dolomite and Mg-silicates (90% of world average river water) while 8% is contributed by pollution and the rest 2% is contributed by cyclic sea-salt (Berner and Berner, 1987). As Mg2+ does not vary that much with tidal water but varies highly with reaches of the Mayur at upper part (station 1 to station 5) it can be concluded that main source of Mg2+
02468
10121416
Ham
id n
agar
Slu
ice
gate
Chot
o Bo
yra
Sosa
ngha
t
Opp
osit
e KM
C
Bam
boo
brid
ge, S
onad
anga
Khad
er k
hal
Gol
lam
ari
Buro
mou
lovi
dor
ga b
ridg
e
Moh
amm
adno
gor
Bisw
aroa
d br
idge
Sach
ibun
ia w
apda
khe
ya g
hat
Puti
mar
i Khe
ya g
hat
Puti
mar
i Tal
ghat
Alu
tola
Sali
on
ity
(pp
t)
Sampling Spot
February May August
02468
1012141618
Ham
id n
agar
Slu
ice
gate
Chot
o Bo
yra
Sosa
ngha
t
Opp
osit
e KM
C
Bam
boo
brid
ge, S
onad
anga
Khad
er k
hal
Gol
lam
ari
Buro
mou
lovi
dor
ga b
ridg
e
Moh
amm
adno
gor
Bisw
aroa
d br
idge
Sach
ibun
ia w
apda
khe
ya g
hat
Puti
mar
i Khe
ya g
hat
Puti
mar
i Tal
ghat
Alu
tola
Salin
ity
(ppt
)
Sampling Spot
February May August
Figure 7: Spatial distribution of salinity in the Mayur River over the period of February 2011 to August 2011. The top graph represents High tide salinity and the bottom graph represents low tide salinity

5 | P a g e
in Mayur is pollution at the upper reaches while additional Mg2+ comes from tidal water at the downstream. But in the pre monsoon and monsoon season the salinity decreases. The decreasing rate depends upon the amount of rainfall. However, overall salinity in Mayur River is found to be decreasing with the progress of wet season.
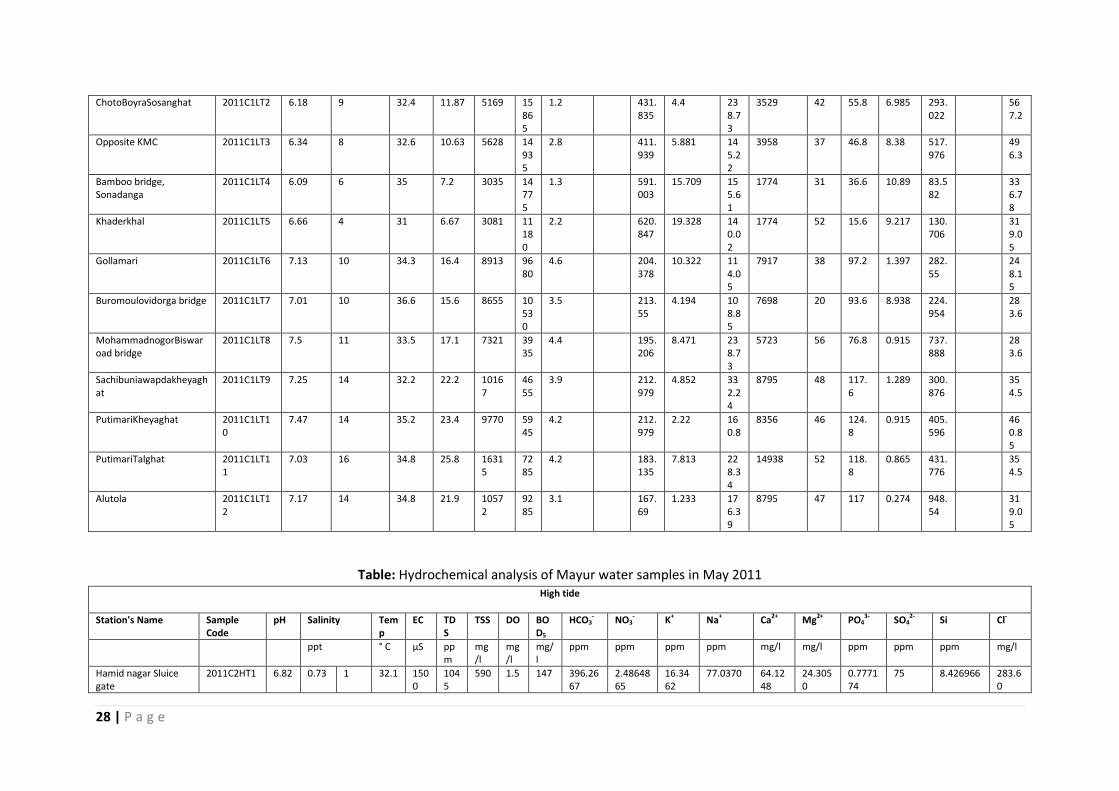
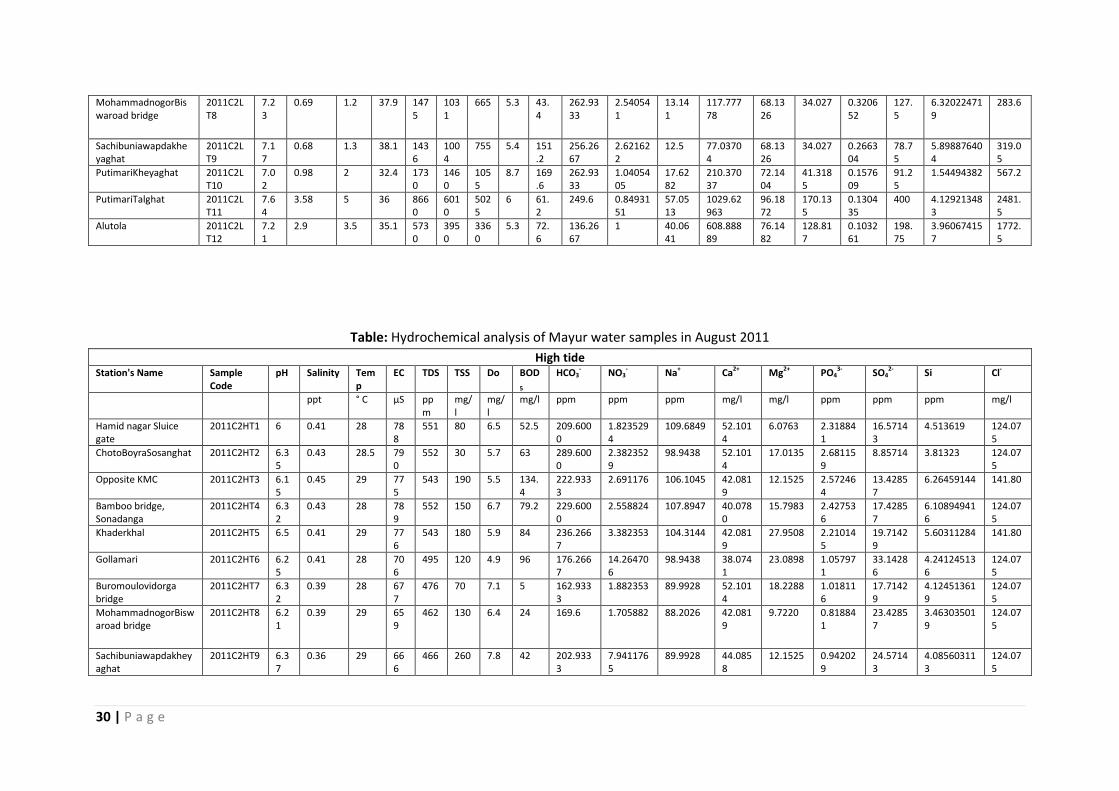
4. Bicarbonate was found in Mayur ranging from 158 to 670 ppm with a high tide average of 383±193 ppm and low tide average of 317±162 ppm at February, ranging from 136142 to 483 ppm with a high tide average of 322.4±92.83 ppm and low tide average of 334.32±106 ppm at May and ranging from 142 to 290 ppm with a high tide average of 196.82±42.78 ppm and low tide average of 211.27±41.69 ppm at August. The source of HCO3
- in natural water is carbonate weathering and bacterial decomposition of soil that produce CO2. Only 2% of world average river water HCO3
- is contributed from pollution. However in this case, high concentration of HCO3
- in the upper stream stations of the Mayur with low variation with tidal effects indicates the source is pollution from bacterial decomposition. However, the increasing trend of bicarbonate from station 1 to station 5 and smaller values and stable trend towards downstream stations are indicating that in the upper stations water characters are influenced by bicarbonate pollution rather than bacterial composition that are accumulated until station 5 is reached. It is noticeable from Table 1 that, until station 4, elevation of Mayur decreases, then certainly increases in station 5 and 6, then again starts decreasing until the river ends. This means, there is stagnant water at station 5 which only is reached and flushed by peak high tide. This might explain the higher values of bicarbonate at station 6 and 7 at high tide and then decreasing values towards the river end. The very same reason (elevation) also explains the salinity and Mg2+deviation
of Mayur at station 5.
5. Na+ ranges from 1474 ppm to 14938 ppm in Mayur at February and is the main source of ions and major
0
2000
4000
6000
8000
10000
12000
14000
Ham
id n
agar
Slu
ice
gate
Chot
o Bo
yra
Sosa
ngha
t
Opp
osit
e KM
C
Bam
boo
brid
ge, S
onad
anga
Khad
er k
hal
Gol
lam
ari
Buro
mou
lovi
dor
ga b
ridg
e
Moh
amm
adno
gor
Bisw
aroa
d br
idge
Sach
ibun
ia w
apda
khe
ya g
hat
Puti
mar
i Khe
ya g
hat
Puti
mar
i Tal
ghat
Alu
tola
TDS
(mg/
L)
February May August
Figure8: Spatial distribution of TDS in Mayur River over the year 2011. The blue shaded area indicates water suitability for irrigation.

6 | P a g e
contributor to TDS in the river. According to the USSL irrigation water classification water containing more than TDS 3000 ppm is unsuitable for irrigation. Average TDS of Mayur River often exceeds 7000 ppm. But in the rainy season it varies from 44 ppm to 1400 ppm at the month of May and 30 ppm to 120 ppm at the month of August. It decreased due to salinity reduction. At the peak monsoon period the TDS values are suitable for irrigation purpose, and even usable for domestic purposes (Figure 8).
6. The Piper diagram (1970) analysis of water classification depicts that Mayur water quality has improved over the sampling period, that is, as the wet season increased, water quality improved for even using for domestic purposes. As the Figure 9 reveals, from February to May, water samples have moved from salinity apex towards more hardness while in August with ample water in the river system, samples moved on to more neutral class (in the mid of the diamond), which indicate improvement of water quality.
Figure 9: Piper (1970) diagram analysis of Mayur water samples.

7 | P a g e
Figure 10: DO levels in the Mayur River in Dry season- February 2011 (Top) and wet Season- August 2011 (Bottom). The black line indicates the minimum DO level for sustenance of Fish. Comparative analysis of the figures shows that D) levels have significantly improved over the wet season.
PART II: HYDROMORPHOLOGY AND BATHYMETRY Mayur river elevation profile and bathymetry has been conducted in this period (June 2011- December 2011) and preliminary results are included in this section.

8 | P a g e
Elevation profile Maximum Depth: 6m at the PutimariTaltola Minimum Depth: less than 1 m at Hamid Nagar Average Depth: 2.4 m
The Alutola Sluice gate station has been under heavy siltation due to the non-regular operation of the sluice gates. In fact, a channel has been constructed to enter tidal water into the Mayur controlled by the Alutola 10-sluice gate. Therefore, there is no natural connection between the Mayurand the Bahairab (Figure 12). The channel dries out in dry season (less than 0.5 m of water depth). Soil and water Salinity increases significantly in dry season.
Bathymetry
First 5 stations at upper reach Last 5 stations at the lower reach
Figure 11: Elevation profile of the river Mayur. It is noticeable that at almost midlength of the river Mayur bed is elevated and it has divided the channel into two parts. Therefore the lower reach of the river is well mixed with tidal water where the upper reach is uninterrupted with tide effects. It is also noticeable that the both ends of the river is under extensive siltation.
Figure 12: AlutolaSluie gate at the end of the Mayur that is disconnected from the Bhairab river

9 | P a g e
The bathymetric survey of the Mayur is a work in progress. Some primary cross sections and estimation of water reserve capacity has been calculated on a very primary basis. The difficulty of the Mayur’s bathymetric survey is to deduct the debris effect from the cross sections. In most cross sections, natural elevation profile has not been found. A second more rigorous survey is ongoing. Some of the cross sections retrieved from the Mayur are presented in Figure 12 and 13. Primary estimates of the water reserve capacity of the Mayur have been done through 3D-trapizium calculation method.
In the upstream of Mayur, debris has been found averaging 0.5-1.0 m from the natural base level while in the downstream, sediment was found rather than debris and the amount of sedimentation is high near the Alutola sluice gate. Estimates of water reserve capacity Water reserve capacity: 725,732,265 us gallon (natural)3
556,542,824 us gallon (at present state)4 However, the estimates of “natural” water reserve capacity are still under process, as calculating natural cross sections under debris filled cross sections are difficult to estimate.
3 preliminary estimates 4 1m3 = 264 us gallon
Figure 13: 2 Downstream Cross sections of the Mayur River
Figure 14: 2 upstream cross sections of the Mayur. The blue circles indicate debris filled areas
10 | P a g e
PART III: SOCIAL DYNAMICS This report is not part of the usual hydrochemical monitoring report. It has been done to assess the current social state of water use and user conflicts. Water use: Community conflicts Several subprojects of the Southwest Area Integrated Water Resources Management Project (SWAIWRMP) have introduced structural interventions for flood control, drainage, and water conservation (ADB, BWDB and WARPO, 2004). The purposes of these interventions is to allow storage of fresh water for dry season irrigation, drain out water to allow cultivation in wetlands, locally called beel, and prevent saline water intrusion during the later part of the dry season (BWDB and WARPO, 2005). Although these interventions have been beneficial to dry season agriculture, fisheries and the aquatic ecosystem have been adversely affected (LGED, 2007). This conflict may turn into severe problem in the perspective of Bangladesh as the number of FCD (Flood Control and Drainage) projects are increasing rapidly.
In the context of Bangladesh, water resource development activities, namely flood control, drainage and irrigation, and closures of natural canals and large/ small rivers got a boost in the 1960s. A huge number of water development schemes were constructed and still under construction as development interventions overlooking the ecology of the beel. Water requirements for aquatic habitat were totally ignored, while planning, designing, and implementing the schemes. As a result, aquatic habitats were eradicated, removed, shrunken, and / or modified with impunity affecting the open water capture fisheries and livelihood of the fishermen community (Ali, 1997). Flood control drainage and irrigation (FCD/I) projects alter the inundation pattern to create an artificial environment conducive to agricultural production (FAP 6, 1994). Flood control projects have a series of relatively specific impacts on fisheries. The conflicts between irrigation and fisheries begin as the fisheries issue in flood control is usually seen in terms of trade-offs. If the overall benefits to agriculture and other sectors exceed the disbenefits suffered by fisheries and those dependent on them, the project is acceptable to the respective authority. This kind of approach ignores many serious issues regarding distribution and what constitutes a benefit for different groups within the population (FAP 17, 1995).
Back ground of the study Bangladesh is a riverside country. But many of them are dead and few are processing to dead. In Khulna city Mayur River is an Epimorphal river, destructing day by day by anthropogenic activities. Khulna city is one of the most vulnerable cities around the world.
The Moyur River has been originated from vast water body named Beel Dakatia. It is running through the Chalk Mathurabad and Chhoto Boyra and it is named the Moyur river near Sonadanga bus stand. It is also running through the Gollamari, Dubi, Harintana and Lobonchora and meets with Rupsha river at Badamtola. It has also another flow running into the Eastern side named Kazibasa at Tatultola. About 30 years ago it was very forceful and traditional river. That people swam and steamer, big trolleres, boats ran this river with goods and people. Fishermen caught fish. Several types of fishes were found at that time. Good corps was grown up farmers. It protected the town from flood and helped a lot in our economy. The river was about 11.69 Kilometer long and diameter was 30-111 Ft. About 2000 families of fishermen live per 100 yard on the river side. The Mayur River is one of the major drainage channels through which a large volume of water, both from urban Khulna and adjacent Beel Pabla and Beel Dakatia area is discharged into the river Rupsha. City protection dam was constructed in 1982-1983 by BWDB. From then the river started to die. The Mayur River is the main drainage channel for the eastern
11 | P a g e
part of Polder 28/2, via a single 10 vent-sluice at Alutola (BWDB, 1992). The regular operation of that sluice gate was not found.
During rainy season (from June to October) the sweet water from the Rupsah River were allowed to enter into the Mayur River through the Alutala sluice gate. The sluice gate was closed during November to February to abstain saline water intrusions for agricultural purpose. But the owner of the shrimp gher were exercised their power to open the sluice gate for saline water intrusion during this time. As a result upstream and downstream village peoples were deprived of water use for agriculture purpose. There is a water management group (WMCA) which is inactive. Only one person operates the gate. The gateman serves the order of BWDB to operate the gate. The main aim of research is to identify water use conflicts between up and down stream water user groups and resolve these conflicts.
Objectives The main objective of the study is to identification of different water users group of Mayur River and water use conflicts between up and down stream water user groups. The sub objective is to identification of possible solution through stakeholder workshop & potential Institutional resolution of existing conflicts between up-stream & downstream stakeholders.
Possible outcome from the study may be increasing river water flow, controlling the pollution of the river, equitable distribution of water, increasing aesthetic value of the river & increased river water use acceptability on various purposes.
Materials &Methodology
Materials Purposive sampling method is using for this study. Tetultala and RayerMahal two villages were taken as sampling area. The criteria for selecting sampling site were River water uses conflicts, improper sluice gate operation, immense waste disposing without following any rules and regulations and capturing river bank illegally & narrow down the river width. The sample size is 50.
Data Collection Tools Primary data collection by questionnaire survey (from different water user groups) & FGD
[Conflicting water uses issues (River Water)]. For possible solution stakeholder meetings also done.
Secondary data collected from BWDB; KCC; KDA; DOE (Khulna Office). Information also collected from BBS Zillah series & BBS community series, Khulna Zillah.

12 | P a g e
Figure: Schematic Methodological Framework
Conceptualization of problems
Site selection
Reconnaissance Survey
Data collection
Secondary data collection Primary data collection
Papers, journals, BBS, KCC, LGED, BWDB, DOE, internet, unpublished
thesis.
Reconnaissance Survey
Clustering, Questionnaire survey, FGD, Stakeholder
Data interpretation
Data processing
Draft report preparation
Rectification of Draft report
Final report presentation

13 | P a g e
Results and Discussion
Over all Mayur river water usage in the past:
Mayur: communities and conflicts Four types of water user groups (directly dependent on Mayur): present status
• Households (95% of downstream households) • Farmers (60% of total farmers) • Fishermen (60% of total fishermen) • Communities disposing waste to Mayur (52% of total riverside communities)
Main conflict groups: Upstream versus Downstream communities Upstream (hamidnagar) communities:
• Main concern is Alutola sluice gate operation • They believe if the sluice gate was properly operated they might have got enough water
for agriculture and fishing, even pollution might get limited • Some illegal land traders forcefully let saline water enter into the river to kill water
hyacinth for navigation purposes which in turn destroys paddy fields upstream. Downstream(Alutola) communities:
• Main concern is waste dumping
Community Type: Upstream DownstreamCase study area: Rayer mahalTetultolaHouseholds 0 95Fishermen 20 100Farmers 20 100Garbage disposal 100 5
Figure 15: Usage of Mayur river water in past

14 | P a g e
• They believe if waste dumping is stopped they might have got better quality water for agriculture and fishing
NOTE: The Hatia joint of the Mayur is one of the popular hunting ground for fishermen. The Hatia joint is one of the deepest points of the Mayur with better water quality
Community versus community:
Farmers (upstream) The sluice gate should be operated properly, waste disposal should be stopped, needs water from downstream
Needs to put salt in water for shrimp cultivation, wants water from downstream
Aqua-culturists (Upstream and downstream)
Farmers and fishermen
(Downstream)
The waste should not be dumped in the river
No place to dump waste (?)
Waste disposal group
Institution versus institution: • KCC says BWDB responsible for sluice gate operation but BWDB failed in this task • DoE is the responsible authority for waste water monitoring but they failed to do their
duties • BWDB and DoE said: KCC is responsible for handling the drains of Khulna City • Part of the Mayur (Upstream) is under responsibility of KCC while the rest lies to the
Batiaghata.
MAYUR: LAND GRABBING Land grabbing is one of the Mayur river’s important problems
• From upstream (Hamidnagar) to Gallamary Bridge the rivers length is about 5.5 km • On average 31% of the river is grabbed by local influential • The Mayur spans over 2.4 km with an average width of 17m and 3.1km with average width
of 32m. • Mayur has an area of 140,000 sq. m. from Hamidnagar to Gollamary Bridge of which 43,400
sq. m has been grabbed

15 | P a g e
Land grabbing identified in Mayur river: On average 31% of Mayur river is already illegally
grabbed by local influential The satellite picture indicates the flowing river course by blue shade and grabbed land by orange
shade. Most of the land grabbing occurred at the upstream. Downstream land grabbing is relatively
less. Andirghat (between sampling spot 1 & 2) is one the mostly grabbed area in the Mayur. In this
area the Mayur is so narrow that the river width in most areas is 8-10 m only.
Figure 16: Land grabbed at the upper reached of the Mayur. The orange shaded areas indicated land grabbed and the blue shaded areas indicate natural water flow.

16 | P a g e
Fig: Land Grabbing at Soto BoyraSosanghat (Agricultural practices)
Fig: Land Grabbing at Andirghat (Housing Purposes)
17 | P a g e
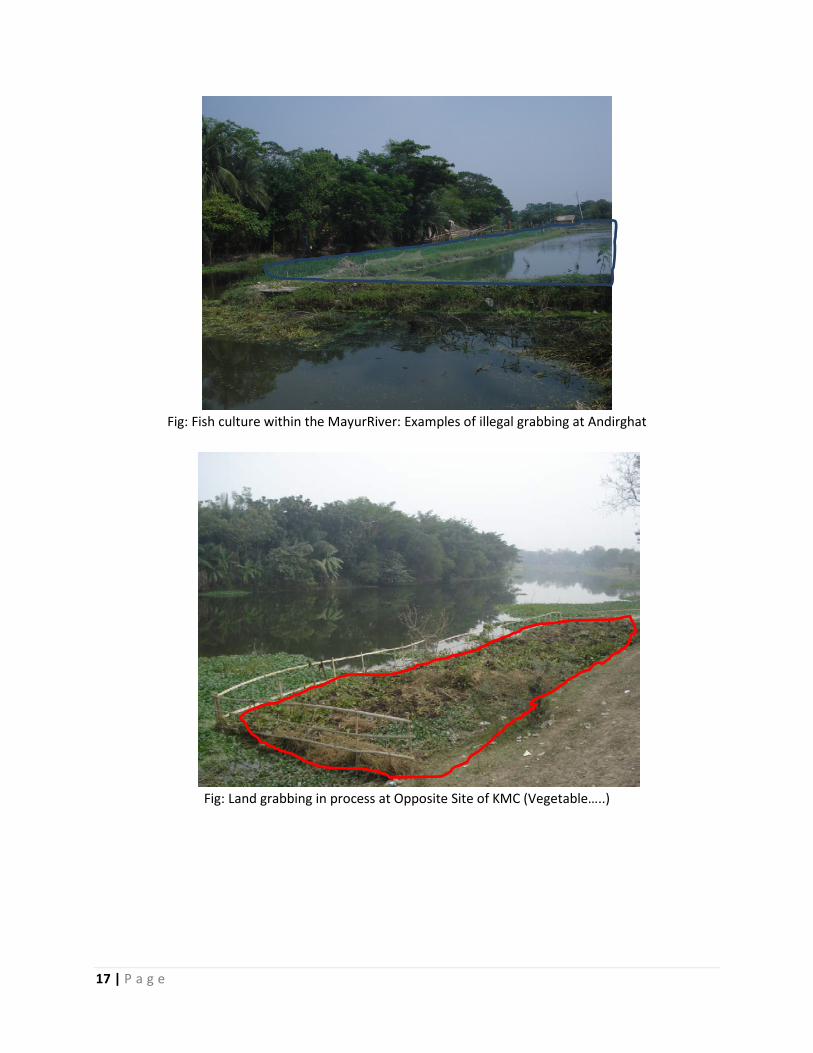
Fig: Fish culture within the MayurRiver: Examples of illegal grabbing at Andirghat
Fig: Land grabbing in process at Opposite Site of KMC (Vegetable…..)

18 | P a g e
Fig: Grabbed in the name of…….
Fig: Orange color indicates land grabbed illegally, Blue color indicate natural flow
River flow
River flow
19 | P a g e
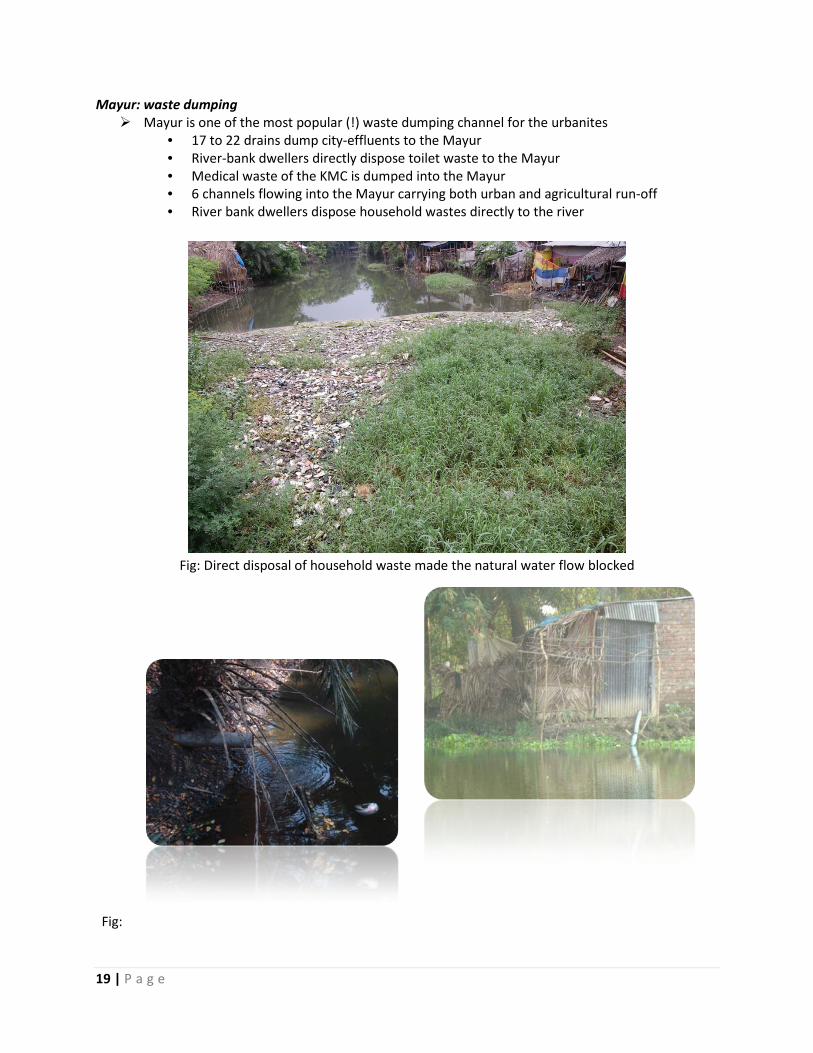
Mayur: waste dumping Mayur is one of the most popular (!) waste dumping channel for the urbanites
• 17 to 22 drains dump city-effluents to the Mayur • River-bank dwellers directly dispose toilet waste to the Mayur • Medical waste of the KMC is dumped into the Mayur • 6 channels flowing into the Mayur carrying both urban and agricultural run-off • River bank dwellers dispose household wastes directly to the river
Fig: Direct disposal of household waste made the natural water flow blocked
Fig:

20 | P a g e
Sanitary waste dumped directly on the River
Fig: Dead cow- disposed to the river floating from upstream to downstream
creating organic pollution on the way
Recommendations from the community Suggestions for restoration of the Mayur: Re-excavation, people like to participate voluntarily if action is taken Proper operation and maintenance of the Alutola and RayerMohal
sluice gate Construction of a wastewater line parallel to the river for waste
water dumping Increase public awareness Implementation of KDA masterplan Reestablish connections with BeelDakatia, BeelPablaandKhuderkhal Action taken against illegal land grabbers
CONCLUSION When flushed with fresh water, Mayur water is usable for agriculture. Mayur needs an immediate excavation of debris which is causing overflow of water and flooding many nearby bank areas. Mayur has to receive fresh water from upstream to survive. Given the wet season water quality, biological treatment is sufficient for pollution control in MayurRiver.
Some Insights from the Field Hamidnagar: Origin of the river • Very narrow, only a channel to local people, however connected to a sluice gate that controls water from BeelPabla • Most popular waste disposal point, there is no other use of this channel • Population density high • Waste of snail crushing industries are also dumped here Hamidnagar to Shwashanghat • Land grabbing in full force for agriculture and aquaculture Gollamari Bridge • One of the highest waste loads • Waste from Gollamari Bazar, slaughter house and city waste line • Highest amount of debris found (>1.5m) BuroMoulovirDorgah • Land grabbing for aquaculture purposes • Numerous toilet lines in river

21 | P a g e
Annex 1
River cross-section of sampling stations
Sample Station 1: Hamidnagor
Speed: 0.5 m/min Total Length: 11.9 m
Sample Station 2: Soto Boyra Shoshanghat
Speed: 0.25 m/min Total Length: 26 m
Sample Station 3: Opposite of KMC
Speed: not measureable (river is full of hyacinth) Total Length: 43 m

22 | P a g e
Sample Station 4: Bamboo bridge, Sonadanga
Speed: not measureable (river is full of hyacinth)
Total Length: 48.7 m
Sample Station 5: Kadererkhal
Speed: 0.02 m/min Total Length: 50 m
Sample Station 6: Gollamary
Speed: 0.05 m/min Total Length: 31 m

23 | P a g e
Sample Station 7: Buro-moulovir Dorga
Speed: 0.2m/min Total Length: 42 m
Sample Station 8: Mohammad Nagor Bisso Road Bridge
Speed: 0.4m/min Total Length: 64 m
Sample Station 9: Sussibunia Kheya ghat
Speed: 0.8m/min
Total Length: 71 m

24 | P a g e
Sample Station 10: Putimary Pukur ghat
Speed: 0.5m/min
Total Length: 74 m
Sample Station 11: Putimary Taltola
Speed: 0.9m/min
Total Length: 80 m
Sample Station 12: Alutola
Speed: 2.8 m/min
Total Length: 48 m

25 | P a g e
Annex 2 Table: Comparative study of Mayur River water quality over various time scale and water quality standards. All parameters are reported in ppm
unless otherwise stated.
Parameters
Average River
water in Asiaa
World
Average
river
water
pollutionb
BD
Standardc
Bhairb
River
(2010)d
Mayur
River
(2002)e
Mayur River
(2010)f
Mayur River 2011g
February May August
Actual Natural High Tide Low Tide High Tide Low Tide High Tide Low Tide
DO - - - 6 4 1.10-8.18 - 2.9±1.4 3±1 4.31±2.8 4.57±2.7 6.43±0.82 5.98±0.54
BOD5 - - - - - - - - - 121.5±58.6 133.37±47 56.84±38 61±33.1
Na 8.7 6.6 2.0 200 12 16.8-33.9 3096±1748 5047±3099 6454±3747 140.3±114.5 340±441 92.23±20 98.65±17
K 1.7 1.6 0.1 12 3.7 1.5-6.9 95±65 148±62 180±66 21±11 21.61±13.4 9.31±2.6 9.42±2.7
Ca 17.8 16.6 1.3 75 28.3 49-94 66±18 66±18 42±10 71±14.2 73.81±7.7 44.92±5.23 42.08±3.63
Mg 4.6 4.3 0.3 35 6.89 31-59 121±54 121±54 81±36 48.6±36.8 51.85±46.6 14.08±6.67 17.62±4.87
HCO3 67.1 66.2 1.0 - 76.49 167±31 341±90 341±91 317±163 322.4±92.83 334.32±106 196.82±42.78 211.27±41.69
NO3 - - - 10 2.77 - 7.7±5.8 7±4 7.5±5 2.4±1.2 2.55±1.07 3.90±3.66 2.60±0.9
SO4 13.3 9.7 3.2 400 11.98 57.35 417.9±144.8 217±132 396±246 163±94.2 143.85±88.19 21.33±7 23.99±8.44
PO4
- - - 6 0.08 4.89-11.46 5±3 8±8.8 4.7±4 0.31±0.23 0.33±0.15 1.53±0.82 1.43±0.78
Cl- 10.0 7.6 2.5 150-600 15.83 - 3918±2823 276±71 385±117 596.7±591.4 641.05±714 118.17±27.67 131.2±24.14
EC (μS/cm) - - - - 241.70 159-275 7658±2045 1397±602 1611±630 2320±1830 2460±2300 699.17±110 744.7±90.34
TDS (ppm) 134.6 123.5 10.5 1000 168.61 255-305 8067±3474 6196±3138 7869±3722 2161±1221 1753±1575 490±76.83 538±53.53
TSS (mg/l) - - - - - - - 9306±4360 10193±4162 1085±1137 2478±3005 141±67.89 95.83±59

26 | P a g e
aBerner and Berner, 1987 bStallard et al., 1986 as quoted in Berner and Berner, 1987. c Department of Environment, Ministry of Environment and Forests, Government of Bangladesh. dRifat et al., 2011 e Kamal et al., 2007 fDas, 2010 gKarim et al, 2011
PH - - - - - - - 6.68±0.35 6.87±0.48 7±0.30 7.02±0.27 6.5±0.40 7.3±0.06
Temp 0C - - - - - - - 30.45±1.7 33.59±1.8 33.72±2.68 33.71±2.45 28.75±0.66 28.08±0.79
Salinity(ppt
) - - -- - - - - 9.17±3.24 10.58±3.55 1.073±0.82 1.152±0.99 0.39±0.06 0.40 ±0.05
Si - - - - - - - - - 9.70±3.62 8.40±4.39 4.67±0.93 4.57±1.57

27 | P a g e
Annex 3 Table: Hydrochemical analysis of Mayur water samples in February 2011.
High tide Station's Name Sample
Code pH Salinit
y Temp EC TDS TSS D
o BOD5
HCO3- NO3
- K+ Na+
Ca2+ Mg2+ PO43- SO4
2- Si Cl-
ppt ° C µS ppm mg/l mg/l
mg/l ppm ppm ppm ppm
mg/l
mg/l ppm ppm ppm
mg/l
Hamid nagar Sluice gate 2011C1HT1 6.57 10
31.8 14.3 5194 14210 1.5
401.991
6.374 171.19 3749
26 75.6 4.475 405.596
354.5
ChotoBoyraSosanghat 2011C1HT2 6.44 10
31.5 14.98 5588 15670 2.7
362.199
4.565 88.07 4626
44 74.4 6.149 169.976
212.7
Opposite KMC 2011C1HT3 6.34 7
33 9.9 4735 12245 2.1
392.043
6.539 155.61 3749
29 51 15.074
159.504
177.25
Bamboo bridge, Sonadanga
2011C1HT4 6.10 5
28.2 7.34 3194 12820 0.9
561.159
7.197 56.9 2213
29 30.6 27.624
91.436 177.25
Khaderkhal 2011C1HT5 6.43 5
28.7 5.31 3037 13615 1 630.795
5.716 56.9 1993
24 10.8 19.536
65.256 230.43
Gollamari 2011C1HT6 6.72 7
29 9.87 3647 4060 2.9
610.899
6.374 140.02 2432
28 50.4 12.842
135.942
230.43
Buromoulovidorga bridge 2011C1HT7 6.59 5
29.5 6.52 4047 6220 3.8
670.587
17.683
108.85 2871
40 18 5.302 67.874 248.15
MohammadnogorBiswaroad bridge
2011C1HT8 6.79 13
29.1 21 7580 3240 4.4
262.719
5.51 254.31 6162
88 81.6 4.754 366.326
354.5
Sachibuniawapdakheyaghat
2011C1HT9 7.40 11
28.9 17.4 5650 4560 4.8
190.62 3.865 186.78 4626
46 91.2 0.58 185.684
319.05
PutimariKheyaghat 2011C1HT10
6.80 12
31.6 18.8 7604 6380 4.5
181.448
3.865 155.61 6381
44 96 0.329 387.27 354.5
PutimariTalghat 2011C1HT11
7.08 11
31.5 20 10945
9545 3.8
176.862
13.735
228.34 9892
40 109.2
0.407 183.066
301.33
Alutola 2011C1HT12
6.93 14
32.6 22.3 13123
9105 3.2
158.518
4.194 176.39 11866
48 120 0.413 395.124
354.5
Low tide Station's Name Sample
Code pH Salinity Temp EC TDS TS
S Do BOD
5 HCO3
- NO3
- K+ Na+ Ca2+ Mg2+ PO43- SO4
2
- Si Cl-
ppt ° C µS ppm mg/l
mg/l mg/l ppm
ppm ppm
ppm mg/l
mg/l ppm ppm
ppm mg/l
Hamid nagar Sluice gate 2011C1LT1 6.62 11
30.7 14.59 5799 14240
1.1 362.199
6.045 124.44
4187 34 75 6.64 400.36
602.65
28 | P a g e
ChotoBoyraSosanghat 2011C1LT2 6.18 9
32.4 11.87 5169 15865
1.2 431.835
4.4 238.73
3529 42 55.8 6.985 293.022
567.2
Opposite KMC 2011C1LT3 6.34 8
32.6 10.63 5628 14935
2.8 411.939
5.881 145.22
3958 37 46.8 8.38 517.976
496.3
Bamboo bridge, Sonadanga
2011C1LT4 6.09 6
35 7.2 3035 14775
1.3 591.003
15.709 155.61
1774 31 36.6 10.89 83.582
336.78
Khaderkhal 2011C1LT5 6.66 4
31 6.67 3081 11180
2.2 620.847
19.328 140.02
1774 52 15.6 9.217 130.706
319.05
Gollamari 2011C1LT6 7.13 10
34.3 16.4 8913 9680
4.6 204.378
10.322 114.05
7917 38 97.2 1.397 282.55
248.15
Buromoulovidorga bridge 2011C1LT7 7.01 10
36.6 15.6 8655 10530
3.5 213.55
4.194 108.85
7698 20 93.6 8.938 224.954
283.6
MohammadnogorBiswaroad bridge
2011C1LT8 7.5 11
33.5 17.1 7321 3935
4.4 195.206
8.471 238.73
5723 56 76.8 0.915 737.888
283.6
Sachibuniawapdakheyaghat
2011C1LT9 7.25 14
32.2 22.2 10167
4655
3.9 212.979
4.852 332.24
8795 48 117.6
1.289 300.876
354.5
PutimariKheyaghat 2011C1LT10
7.47 14
35.2 23.4 9770 5945
4.2 212.979
2.22 160.8
8356 46 124.8
0.915 405.596
460.85
PutimariTalghat 2011C1LT11
7.03 16
34.8 25.8 16315
7285
4.2 183.135
7.813 228.34
14938 52 118.8
0.865 431.776
354.5
Alutola 2011C1LT12
7.17 14
34.8 21.9 10572
9285
3.1 167.69
1.233 176.39
8795 47 117 0.274 948.54
319.05
Table: Hydrochemical analysis of Mayur water samples in May 2011 High tide
Station's Name Sample Code
pH Salinity Temp
EC TDS
TSS DO BOD5
HCO3- NO3
- K+ Na+ Ca2+ Mg2+ PO43- SO4
2- Si Cl-
ppt ° C µS ppm
mg/l
mg/l
mg/l
ppm ppm ppm ppm mg/l mg/l ppm ppm ppm mg/l
Hamid nagar Sluice gate
2011C2HT1 6.82 0.73 1 32.1 1500
1045
590 1.5 147 396.2667
2.4864865
16.3462
77.0370 64.1248
24.3050
0.777174
75 8.426966 283.60

29 | P a g e
ChotoBoyraSosanghat 2011C2HT2 6.78 0.68 1.5 31.2 1480
1032
690 0.8 153 396.2667
3.8513514
16.9872
88.1481 60.1170
31.5965
0.407609
100 9.691011 283.60
Opposite KMC 2011C2HT3 6.82 0.68 1.5 30.3 1510
1055
240 2.0 168 409.6 3.432432
18.2692
43.7037 64.1248
31.5965
0.315217
91.25 8.988764 283.60
Bamboo bridge, Sonadanga
2011C2HT4 6.74 0.69 1.4 31.1 1454
1016
525 0.6 192 482.9333
2.837838
16.9872
80.7407 72.1404
31.5965
0.391304
107.5 12.359551
319.05
Khaderkhal 2011C2HT5 6.97 0.69 1.5 32.8 1465
1023
435 2.2 168 376.2667
0.863014
15.7051
102.9630
64.1248
34.0270
0.684783
150 9.831461 354.50
Gollamari 2011C2HT6 6.94 0.63 1.4 35.6 130 4.4 140.4
342.9333
3.432432
15.7051
102.9630
72.1404
26.7355
0.173913
132.5 17.977528
248.15
Buromoulovidorga bridge
2011C2HT7 7.04 0.56 1.5 37.2 1190
832 490 5.5 21 316.2667
2.837838
13.7821
54.8148 76.1482
21.8745
0.288043
165 10.814607
248.15
MohammadnogorBiswaroad bridge
2011C2HT8 7.3 1.62 2.5 36.4 3390
2360
1850
8.1 43.4
249.6 0.863014
33.0128
228.8889
76.1482
65.6235
0.298913
221.25 10.674157
1063.50
Sachibuniawapdakheyaghat
2011C2HT9 7.3 2.22 3 37.1 4590
321 0
2445
4.8 70.4
176.2667
1 36.2179
206.6667
88.1716
68.0540
0.190217
337.5 9.269663 1311.65
PutimariKheyaghat 2011C2HT10
7.79 3.07 4 36.9 6670
4650
3975
6.6 48 222.9333
0.739726
44.5513
457.7778
96.1872
138.5385
0.086957
352.5 8.286517 2091.55
PutimariTalghat 2011C2HT11
6.92 1.02 1.5 32 1710
1443
1125
7.1 142.6
249.6 3.8513514
16.3462
136.2963
76.1482
94.6275
0.086957
145 2.022472 531.75
Alutola 2011C2HT12
6.99 0.29 1 31.9 560 391 525 8.1 164.3
249.6 2.4864865
6.2179
103.3333
40.0780
14.5830
0.048913
82.5 8.005618 141.80
Low tide
Station's Name Sample Code
pH Salinity Temp
EC TDS
TSS Do BOD5
HCO3- NO3
- K+ Na+ Ca2+ Mg2+ PO43- SO4
2- Si Cl-
ppt ° C µS ppm
mg/l
mg/l
mg/l
ppm ppm ppm ppm mg/l mg/l ppm ppm ppm mg/l
Hamid nagar Sluice gate
2011C2LT1
6.94
0.72 1.5 31.7 1540
1112
190 0.6 156 462.9333
2.702703
19.5513
91.85185
68.1326
31.5965
0.521739
93.75
8.56741573 319.05
ChotoBoyraSosanghat 2011C2LT2
6.59
0.72 1.6 32.8 1550
1106
810 1.2 147.2
476.2667
4.324324
19.5513
121.48148
72.1404
34.027 0.554348
91.25
15.730337079
354.5
Opposite KMC 2011C2LT3
6.9 0.77 1.5 33 1510
1213
900 3.1 132 446.2667
3.189189
16.9872
110.37037
68.1326
34.027 0.429348
112.5
14.185393258
319.05
Bamboo bridge, Sonadanga
2011C2LT4
6.89
0.74 1.6 32.4 1550
1104
9550
1.8 174 429.6 3.567568
17.6282
1400 76.1482
29.166 0.271739
115 11.516853933
354.5
Khaderkhal 2011C2LT5
7.04
0.7 1.5 31.8 1510
1068
205 2.4 160 382.9333
2.756757
18.9103
99.25926
72.1404
29.166 0.375 120 12.640449438
319.05
Gollamari 2011C2LT6
6.84
0.69 1.4 31 1427
1004
825 7.2 153 329.6 3.14865 12.5 147.40741
72.1404
31.5965
0.407609
180 7.303370787
283.6
Buromoulovidorga bridge
2011C2LT7
6.85
0.66 1 32.3 1397
976 6400
7.8 180.2
316.2667
2.85135 13.7821
65.92593
76.1482
24.305 0.380435
117.5
8.988764045
319.05
30 | P a g e
MohammadnogorBiswaroad bridge
2011C2LT8
7.23
0.69 1.2 37.9 1475
1031
665 5.3 43.4
262.9333
2.540541
13.141
117.77778
68.1326
34.027 0.320652
127.5
6.320224719
283.6
Sachibuniawapdakheyaghat
2011C2LT9
7.17
0.68 1.3 38.1 1436
1004
755 5.4 151.2
256.2667
2.621622
12.5 77.03704
68.1326
34.027 0.266304
78.75
5.898876404
319.05
PutimariKheyaghat 2011C2LT10
7.02
0.98 2 32.4 1730
1460
1055
8.7 169.6
262.9333
1.0405405
17.6282
210.37037
72.1404
41.3185
0.157609
91.25
1.54494382 567.2
PutimariTalghat 2011C2LT11
7.64
3.58 5 36 8660
6010
5025
6 61.2
249.6 0.8493151
57.0513
1029.62963
96.1872
170.135
0.130435
400 4.129213483
2481.5
Alutola 2011C2LT12
7.21
2.9 3.5 35.1 5730
3950
3360
5.3 72.6
136.2667
1 40.0641
608.88889
76.1482
128.817
0.103261
198.75
3.960674157
1772.5
Table: Hydrochemical analysis of Mayur water samples in August 2011 High tide
Station's Name Sample Code
pH Salinity Temp
EC TDS TSS Do BOD5
HCO3- NO3
- Na+ Ca2+ Mg2+ PO43- SO4
2- Si Cl-
ppt ° C µS ppm
mg/l
mg/l
mg/l ppm ppm ppm mg/l mg/l ppm ppm ppm mg/l
Hamid nagar Sluice gate
2011C2HT1 6 0.41 28 788
551 80 6.5 52.5 209.6000
1.8235294
109.6849 52.1014
6.0763 2.318841
16.57143
4.513619 124.075
ChotoBoyraSosanghat 2011C2HT2 6.35
0.43 28.5 790
552 30 5.7 63 289.6000
2.3823529
98.9438 52.1014
17.0135 2.681159
8.85714 3.81323 124.075
Opposite KMC 2011C2HT3 6.15
0.45 29 775
543 190 5.5 134.4
222.9333
2.691176 106.1045 42.0819
12.1525 2.572464
13.42857
6.26459144 141.80
Bamboo bridge, Sonadanga
2011C2HT4 6.32
0.43 28 789
552 150 6.7 79.2 229.6000
2.558824 107.8947 40.0780
15.7983 2.427536
17.42857
6.108949416
124.075
Khaderkhal 2011C2HT5 6.5 0.41 29 776
543 180 5.9 84 236.2667
3.382353 104.3144 42.0819
27.9508 2.210145
19.71429
5.60311284 141.80
Gollamari 2011C2HT6 6.25
0.41 28 706
495 120 4.9 96 176.2667
14.264706
98.9438 38.0741
23.0898 1.057971
33.14286
4.241245136
124.075
Buromoulovidorga bridge
2011C2HT7 6.32
0.39 28 677
476 70 7.1 5 162.9333
1.882353 89.9928 52.1014
18.2288 1.018116
17.71429
4.124513619
124.075
MohammadnogorBiswaroad bridge
2011C2HT8 6.21
0.39 29 659
462 130 6.4 24 169.6 1.705882 88.2026 42.0819
9.7220 0.818841
23.42857
3.463035019
124.075
Sachibuniawapdakheyaghat
2011C2HT9 6.37
0.36 29 666
466 260 7.8 42 202.9333
7.9411765
89.9928 44.0858
12.1525 0.942029
24.57143
4.085603113
124.075

31 | P a g e
PutimariKheyaghat 2011C2HT10
7.31
0.37 29.5 660
468 160 7.3 12 162.9333
2.764706 84.6223 44.0858
12.1525 0.659420
30.28571
4.046692607
106.35
PutimariTalghat 2011C2HT11
6.61
0.39 29 710
497 90 6.9 27 156.2667
2.75 97.1536 50.0975
7.2915 0.923913
25.71429
5.3307393 124.075
Alutola 2011C2HT12
7.19
0.22 30 394
276 230 6.5 63 142.9333
2.6029412
30.9166 40.0780
7.2915 0.778986
25.14286
4.39688716 35.45
Station's Name Sample Code
pH Salinity Temp
EC TDS TSS Do BOD5
HCO3- NO3
- Na+ Ca2+ Mg2+ PO43- SO4
2- Si Cl-
ppt ° C µS ppm
mg/l
mg/l
mg/l ppm ppm ppm mg/l mg/l ppm ppm ppm mg/l
Hamid nagar Sluice gate
2011C2LT1 7.3 0.45 27 787
552 30 6.7 18 256.2667
2.647059 107.89474
42.0819
17.0135 2.101449
16.57143
4.01544402 156.525
ChotoBoyraSosanghat 2011C2LT2 7.37
0.42 27 788
552 130 6.8 33 242.9333
2.632353 116.84569
42.0819
17.0135 2.173913
20.57143
6.640926641
141.8
Opposite KMC 2011C2LT3 7.35
0.43 28 793
554 60 6 55.5 262.9333
2.720588 111.47512
38.0741
14.583 2.644928
13.14286
4.092664093
141.8
Bamboo bridge, Sonadanga
2011C2LT4 7.31
0.42 28 852
596 70 5.6 108.5
256.3 2.735294 108 40.0780
17.0135 2.028986
20 5.212355212
141.8
Khaderkhal 2011C2LT5 7.36
0.45 28 811
568 70 6.8 85 262.9333
2.558824 111.47512
42.0819
14.583 2.428 10.85714
6.293436293
124.075
Gollamari 2011C2LT6 7.28
0.33 29 677
572 10 6 30 202.9 2.11765 82.83208 42.0819
13.3678 1.144928
30.71429
2.432432432
106.35
Buromoulovidorga bridge
2011C2LT7 7.33
0.34 29 605
524 100 6.1 33 189.6 2.13235 81.04189 42.0819
31.5965 0.974638
33.14286
3.474903475
88.625
MohammadnogorBiswaroad bridge
2011C2LT8 7.32
0.31 29 613
428 70 5.8 81 156.2667
2.823529 64.93018 52.1014
15.79825
0.496377
37.85714
2.355212355
106.35
Sachibuniawapdakheyaghat
2011C2LT9 7.22
0.35 28 651
456 100 5.1 96 176.2667
1.882353 86.41246 38.0741
15.79825
0.760870
22.85714
5.791505792
124.075
PutimariKheyaghat 2011C2LT10
7.16
0.38 29 764
534 110 5.7 21 169.6 1.9852941
97.15360 44.0858
14.583 0.760870
32.57143
2.81853282 124.075
PutimariTalghat 2011C2LT11
7.14
0.4 28 721
505 190 5.5 99 189.6 1.6764706
95.36341 40.0780
20.65925
0.880435
27.42857
6.216216216
141.8
Alutola 2011C2LT12
7.25
0.47 27 874
611 210 5.7 72 169.6 5.1764706
120.42607
42.0819
19.444 0.760870
22.14286
5.521235521
177.25