hypervariable noncoding sequences in saccharomyces cerevisiae · hypervariable noncoding sequences...
TRANSCRIPT

Copyright © 2005 by the Genetics Society of AmericaDOI: 10.1534/genetics.105.042283
Hypervariable Noncoding Sequences in Saccharomyces cerevisiae
Justin C. Fay1 and Joseph A. Benavides
Department of Genetics, Washington University School of Medicine, St. Louis, Missouri 63108
Manuscript received February 20, 2005Accepted for publication May 12, 2005
ABSTRACTCompared to protein-coding sequences, the evolution of noncoding sequences and the selective con-
straints placed on these sequences is not well characterized. To compare the evolution of coding andnoncoding sequences, we have conducted a survey for DNA polymorphism at five randomly chosen lociamong a diverse collection of 81 strains of Saccharomyces cerevisiae . Average rates of both polymorphismand divergence are 40% lower at noncoding sites and 90% lower at nonsynonymous sites in comparisonto synonymous sites. Although noncoding and coding sequences show substantial variability in ratios ofpolymorphism to divergence, two of the loci, MLS1 and PDR10 , show a higher rate of polymorphism atnoncoding compared to synonymous sites. The high rate of polymorphism is not accompanied by a highrate of divergence and is limited to a few small regions. These hypervariable regions include sites withthree segregating bases at a single site and adjacent polymorphic sites. We show that this clustering ofpolymorphic sites is significantly greater than one would expect on the basis of the spacing betweenpolymorphic fourfold degenerate sites. Although hypervariable noncoding sequences could result fromselection on regulatory mutations, they could also result from transient mutational hotspots.
PROBABILISTIC models for the molecular evolu- ulatory sequences that have been examined in detail,mostly those acting early in Drosophila development.tion of DNA sequences have provided much insight
The genome sequencing of closely related species hasinto protein function and evolution (Kimura 1983; Fayprovided a wealth of data on the molecular evolutionand Wu 2003). The power of these models is derivedof both coding and noncoding sequences (Cliften et al.in part from the genetic code, which results in the inter-2003; Kellis et al. 2003; Thomas et al. 2003; Richardsspersion of sites with nonsynonymous and synonymouset al. 2005). One of the main motivations for these proj-effects on the amino acid sequence of a protein. Inects has been the identification of conserved noncodingcontrast to protein-coding sequences, we know relativelysequences, the majority of which likely function in genelittle about the function and evolution of cis-regulatoryregulation. The identification of regulatory sequencessequences. Although some models have been developedby their conservation between species presents a chal-(Moses et al. 2004a,b), a major limitation is the paucitylenge to understanding their evolution since not all reg-of experimentally identified cis-regulatory sequences.ulatory sequences may be tightly conserved. One approachThe examination of polymorphism and divergenceis to study noncoding sequences in their entirety, elimi-in cis-regulatory sequences has shown that while thesenating any bias in the method used to distinguish func-sequences are constrained, substantial variation existstional and nonfunctional sequences.both within and between species (Jenkins et al. 1995;
The examination of polymorphism and divergenceLudwig and Kreitman 1995; Ludwig et al. 1998; Tautzin unannotated noncoding sequences has revealed aand Nigro 1998; Dermitzakis et al. 2003; Moses et al.number of regions showing a higher than expected rate2003; Phinchongsakuldit et al. 2004). This variationof polymorphism or divergence. The rate of polymor-can be explained under a neutral model since there arephism but not divergence was found to be greater in thedegenerate positions within transcription factor binding5�-UTR and intronic sequence of hunchback compared tosites (Moses et al. 2003) and redundant binding sitesthat in synonymous sites in adjacent hunchback codingwithin an enhancer (Ludwig et al. 1998, 2000). In onesequences (Tautz and Nigro 1998). A small 200-bpstudy, the DNA sequence variation was found to be in-region upstream of Attacin C showed a rate of polymor-consistent with a neutral model (Jenkins et al. 1995).phism 10-fold higher than that found at nearby synony-However, these studies have been limited to the few reg-mous sites (Lazzaro and Clark 2001). Divergence andlinkage disequilibrium were also much higher in theregion. Examination of polymorphism and divergence
Sequence data from this article have been deposited with the EMBL/ in 136 5�-UTR sequences in humans revealed a higherGenBank Data Libraries under accession nos. AY942206–AY942556.ratio of divergence to polymorphism at 5�-UTR com-1Corresponding author: Department of Genetics, Box 8510, 4444 For-
est Park Pkwy., St. Louis, MO 63108. E-mail: [email protected] pared to that in fourfold degenerate sites found in adja-
Genetics 170: 1575–1587 ( August 2005)

1576 J. C. Fay and J. A. Benavides
RESULTScent coding sequences (Hellmann et al. 2003). The sameresult was found for noncoding sequences upstream of DNA polymorphism: DNA polymorphism was surveyedaccessory gland proteins (Kohn et al. 2004). Although in 81 strains of S. cerevisiae (Table 1), constituting a totalthere are a number of caveats to comparing variation of 3561 bp of intergenic sequence and 3671 bp of codingin noncoding sites to that in synonymous sites, together sequence. A total of 191 polymorphic sites were found,the data suggest the selective forces acting on coding constituting 67 unique haplotypes. Four of the polymor-and noncoding sequences may be quite different. phic sites contained 3 segregating bases. Twelve inser-
To compare rates of variation in coding and noncod- tions and no deletions were found. The 12 insertionsing sequences, we have surveyed DNA polymorphism at ranged in length from 1 to 3 bp. Of the 12 insertions,five randomly chosen loci in a diverse collection of 81 8 were within a string of A or T bases ranging in sizestrains of Saccharomyces cerevisiae . For each locus we ex- from 4 to 11 bp, 1 was within a C4 repeat, 1 consisted ofamined 608–845 bp of coding sequence at the 5� end a TA2 repeat, and 1 consisted of a TC5 repeat.of the gene and 611–804 bp of noncoding sequence, Heterozygous sites were found in 35 of the 81 strainsnearly the entire 5�- intergenic sequence. The five loci and at 94 of the 191 polymorphic sites. A chi-squareinclude: CCA1, a tRNA nucleotidyltransferase (Aebi et al. test for Hardy-Weinberg equilibrium identified 45 poly-1990); CYT1, which encodes cytochrome c1, a compo- morphic sites with a significant deficit of heterozygousnent of the mitrochondrial respiratory chain (Sadler strains (P � 0.001). Because most natural isolates ofet al. 1984); MLS1, a malate synthase (Hartig et al. 1992); S. cerevisiae are homothallic diploids (Mortimer et al.PDR10 , an ATP-binding cassette membrane pump in- 1994), haploid spores are capable of switching matingvolved in pleiotropic drug resistance (Balzi and Gof- type and selfing. Thus, loss of heterozygosity is not un-feau 1995); and ZDS2, known to function in chromatin expected. However, of the 35 strains with heterozygoussilencing and cell cycle progression (Bi and Pringle sites, 10 strains were heterozygous at between 11 and 261996; Roy and Runge 1999). Similar to variation at non- sites while the remaining 25 strains were heterozygous atsynonymous sites, all five loci show lower rates of diver- 5 or fewer sites. The strains with high levels of heterozy-gence in noncoding compared to synonymous sites. Yet, gosity can be explained by a recent mating between twotwo genes, MLS1 and PDR10 , show higher rates of poly- distantly related strains or by loss of their capability tomorphism at noncoding compared to synonymous sites. sporulate, a common phenotype found in commercial
wine strains (Johnston et al. 2000).The distinction of haploid and diploid strains is im-
portant for allele frequency estimates and other popula-MATERIALS AND METHODStion genetic analyses. Although sporulation is a clear
Strains: Strains were obtained from a variety of sources. indication of diploidy, the absence of sporulation is un-B1–B6 were obtained from B. Dunn. I14 was collected by J. Fay.informative since some diploids sporulate at very lowCDB and PR were obtained from Red Star Yeast (Oakland,frequencies. To avoid this problem we analyzed only oneCA). K1–K15 were obtained from N. Goto-Yamamoto and the
NODAI culture collection. M1–M34 were provided by R. Mor- allele from each strain. For those strains containingtimer. UC1–UC10 were obtained from the University of Cali- heterozygous sites, we inferred haplotypes using the pro-fornia (Davis, CA) Department of Viticulture and Enology gram PHASE (Stephens et al. 2001) and randomly choseculture collection. SB was bought at Whole Foods (Berkeley,
one of the two inferred haplotypes. Because 16 of theCA). Y1–Y12 were provided by C. Kurtzman from the Agricul-heterozygous sites are unique variable sites that are pres-ture Research Service Culture Collection. YJM145–YJM1129
were obtained from J. McCusker. YPS163–YPS1009 were pro- ent in only a single strain, the random sampling resultedvided by P. Sniegowski. in the loss of 7 polymorphic sites. All subsequent analy-
Polymorphism survey: Five genes from divergently tran- ses are based on the 184 polymorphic sites that re-scribed intergenic sequences were randomly chosen from the
mained (Table 2).Saccharomyces Genome Database, excluding RNA genes andDiversity at synonymous sites ranges from 0.33 togenes of unknown function. Genes with no clear ortholog in
S. paradoxus were not considered. For each gene, the 5�-inter- 1.32% at the five loci (Table 3), where diversity is mea-genic sequence and a portion of the coding sequence were sured by the average number of pairwise differencesamplified by PCR, purified, and both strands were sequenced between strains per base pair. The overall average diver-using BigDye (Perkin Elmer, Boston) termination sequencing.
sity, 0.84%, is higher than that in humans, 0.11–0.15%Phred and Phrap were used to call bases and assemble a contig-(Cargill et al. 1999; Halushka et al. 1999), but loweruous sequence for each strain (Ewing and Green 1998). Consed
was used to visualize the sequence assemblies and to identify het- than that in Drosophila melanogaster , 1.41% (Kern anderozygous sites. Only one of the two haplotypes inferred using Begun 2005).PHASE were used in the analyses (Stephens et al. 2001). Se- The frequency spectrum is slightly skewed toward rarequences were aligned using ClustalW. Population genetic analy-
variants compared to that expected from a randomly mat-ses were done using DNASP (Rozas and Rozas 1999). Sub-ing population of constant size under a Wright-Fisherstitution rates between species were estimated using PAML
(Yang 1997). model. Tajima’s D (Tajima 1989) ranges from �0.60 to
1577Hypervariable Noncoding Sequences
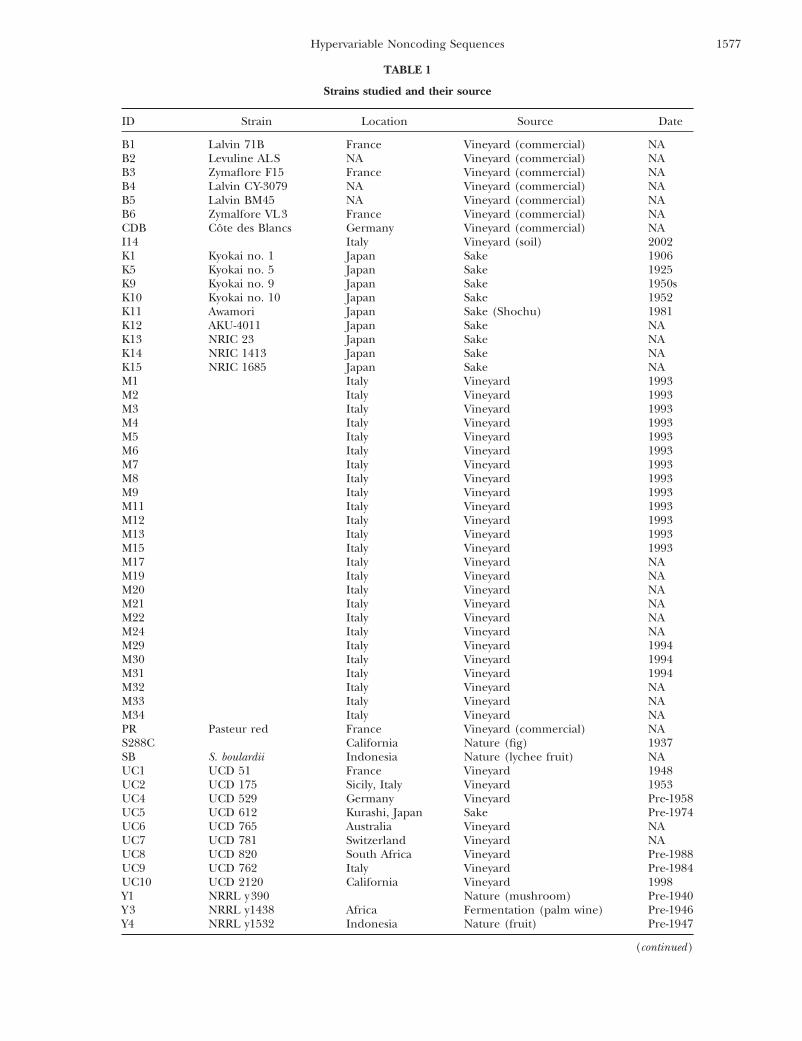
TABLE 1
Strains studied and their source
ID Strain Location Source Date
B1 Lalvin 71B France Vineyard (commercial) NAB2 Levuline ALS NA Vineyard (commercial) NAB3 Zymaflore F15 France Vineyard (commercial) NAB4 Lalvin CY-3079 NA Vineyard (commercial) NAB5 Lalvin BM45 NA Vineyard (commercial) NAB6 Zymalfore VL3 France Vineyard (commercial) NACDB Cote des Blancs Germany Vineyard (commercial) NAI14 Italy Vineyard (soil) 2002K1 Kyokai no. 1 Japan Sake 1906K5 Kyokai no. 5 Japan Sake 1925K9 Kyokai no. 9 Japan Sake 1950sK10 Kyokai no. 10 Japan Sake 1952K11 Awamori Japan Sake (Shochu) 1981K12 AKU-4011 Japan Sake NAK13 NRIC 23 Japan Sake NAK14 NRIC 1413 Japan Sake NAK15 NRIC 1685 Japan Sake NAM1 Italy Vineyard 1993M2 Italy Vineyard 1993M3 Italy Vineyard 1993M4 Italy Vineyard 1993M5 Italy Vineyard 1993M6 Italy Vineyard 1993M7 Italy Vineyard 1993M8 Italy Vineyard 1993M9 Italy Vineyard 1993M11 Italy Vineyard 1993M12 Italy Vineyard 1993M13 Italy Vineyard 1993M15 Italy Vineyard 1993M17 Italy Vineyard NAM19 Italy Vineyard NAM20 Italy Vineyard NAM21 Italy Vineyard NAM22 Italy Vineyard NAM24 Italy Vineyard NAM29 Italy Vineyard 1994M30 Italy Vineyard 1994M31 Italy Vineyard 1994M32 Italy Vineyard NAM33 Italy Vineyard NAM34 Italy Vineyard NAPR Pasteur red France Vineyard (commercial) NAS288C California Nature (fig) 1937SB S. boulardii Indonesia Nature (lychee fruit) NAUC1 UCD 51 France Vineyard 1948UC2 UCD 175 Sicily, Italy Vineyard 1953UC4 UCD 529 Germany Vineyard Pre-1958UC5 UCD 612 Kurashi, Japan Sake Pre-1974UC6 UCD 765 Australia Vineyard NAUC7 UCD 781 Switzerland Vineyard NAUC8 UCD 820 South Africa Vineyard Pre-1988UC9 UCD 762 Italy Vineyard Pre-1984UC10 UCD 2120 California Vineyard 1998Y1 NRRL y390 Nature (mushroom) Pre-1940Y3 NRRL y1438 Africa Fermentation (palm wine) Pre-1946Y4 NRRL y1532 Indonesia Nature (fruit) Pre-1947
(continued)

1578 J. C. Fay and J. A. Benavides
TABLE 1
(Continued)
ID Strain Location Source Date
Y5 NRRL y1546 West Africa Fermentation (bili wine) Pre-1947Y6 NRRL yb1952 French Guiana NA Pre-1950Y8 NRRL y2411 Turkey Vineyard Pre-1957Y9 NRRL y5997 Indonesia Fermentation (ragi) Pre-1962Y10 NRRL y7567 Philippines Fermentation (coconut) Pre-1973Y12 NRRL y12633 Ivory Coast Fermentation (palm wine) Pre-1981YJM145 Segregant YJM128 Missouri Clinical Pre-1989YJM269 Fermentation (apple juice) 1953YJM270 Europe Vineyard Pre-1957YJM280 Segregant YJM273 United States Clinical Pre-1994YJM308 United States Clinical Pre-1994YJM320 Segregant YJM309 United States Clinical Pre-1994YJM326 Segregant YJM310 United States ClinicalYJM339 Segregant YJM311 United States Clinical Pre-1994YJM421 Segregant YJM419 United States Clinical Pre-1994YJM434 Europe ClinicalYJM436 Europe Clinical Pre-1994YJM440 United States Clinical Pre-1994YJM454 United States Clinical Pre-1994YJM627 Segregant Y55 France NAYJM1129 NRRL y-567 Fermentation (distillery) Pre-1912YPS1000 New Jersey Nature (oak exudate) 2000YPS1009 New Jersey Nature (oak exudate) 2000YPS163 Pennsylvania Nature (oak exudate) 1999
ID, identification number; NA, not available.
�1.09 among the five genes, none of which are signifi- tion. Seven strains were from natural samples, includingoak tree exudates, a mushroom, a fig, and various fruits.cant (Table 3). One hundred twenty-eight SNPs have a
minor allele frequency of �10% compared to the 99 ex- Eleven strains were obtained from clinical samples ofimmunocompromised patients. Ten strains were obtainedpected under a Wright-Fisher model (Watterson 1975).
Four of the 12 insertions, all found within the promoter from sake fermentations. Seven strains were obtainedfrom fermentations excluding wine and sake. Two strainsof PDR10, have a minor allele frequency of �10%.
Population structure: We examined population struc- were from an unknown source.Significant population differentiation was found bothture stratified by the source from which each strain was
obtained and by continent from which each strain was among sample sources and among sample locations(Table 3, P � 0.001 for all genes). However, the sourcesisolated (Table 1). Forty-two strains were from Europe,
14 from Asia, 15 from America, 4 from Africa, and 6 are and locations from which the strains were isolated arecorrelated with one another. Most European strainsof unknown origin. Forty-four strains were isolated from
grapes, wine fermentations, or commercial wine produc- were obtained from vineyards, most North American
TABLE 2
Polymorphic sites identified in five genes
Surveyed sites Polymorphic sites
Gene Sample size Noncoding Coding Synonymous NC N S I
CCA1 73 721 788 179.4 20 1 11 2CYT1 67 611 608 149.1 15 1 10 2MLS1 77 804 845 186.5 41 4 12 0PDR10 75 730 758 177.4 26 7 6 8ZDS2 59 695 672 140.7 21 5 8 0Total 81 3561 3671 833.1 123 18 47 12
NC, noncoding; N, nonsynonymous; S, synonymous; I , insertion.
1579Hypervariable Noncoding Sequences
TABLE 3
Population sample statistics from five genes
� (�100) K st
Gene NC N S Tajima’s D Fu and Li’s D Source Location
CCA1 0.39 0.03 0.76 �1.08 �1.54 0.28 0.28CYT1 0.25 0.01 1.32 �1.09 0.51 0.11 0.08MLS1 0.91 0.10 0.80 �0.60 �1.51 0.34 0.25PDR10 0.55 0.15 0.33 �1.05 �2.46 0.46 0.37ZDS2 0.51 0.16 0.99 �0.69 0.37 0.23 0.20Average 0.521 0.091 0.838 �0.90 �0.93 0.28 0.24
�, the average number of pairwise differences between strains per base pair. K st (Hudson et al. 1992) wasmeasured by source and location as designated in Table 1.
strains were obtained from clinical samples, and most pected given the population structure found in S. cere-visiae and its ability to reproduce asexually.Asian strains were obtained from fermentation of sub-
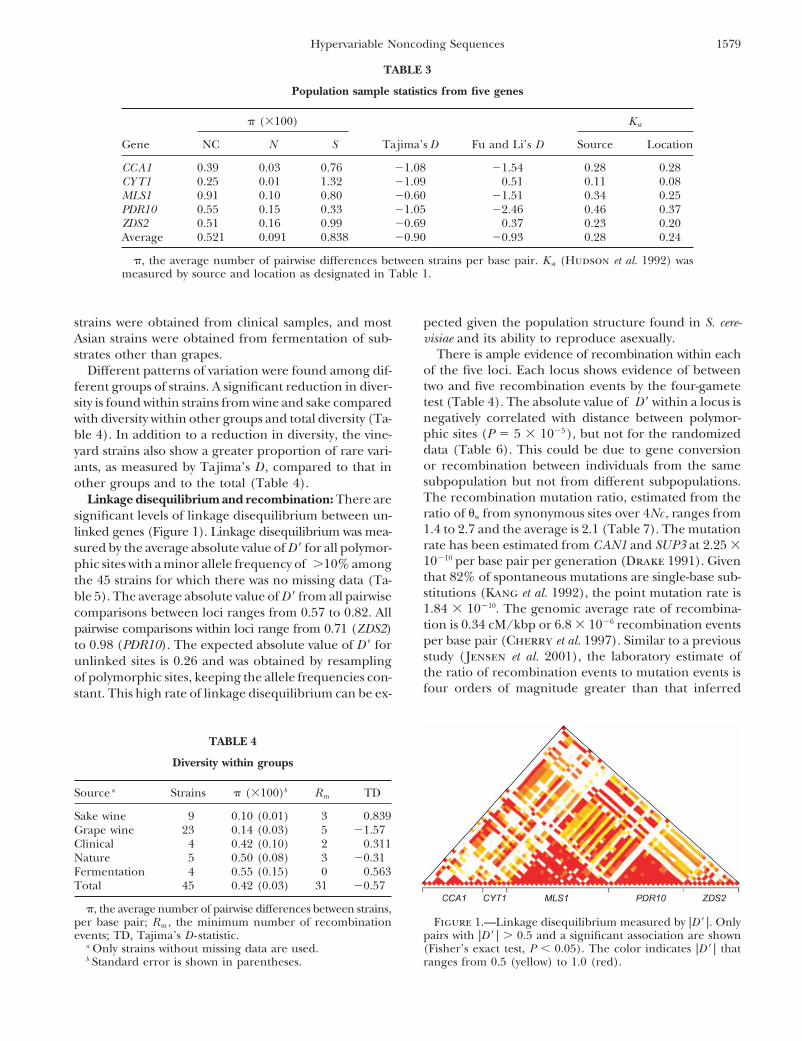
There is ample evidence of recombination within eachstrates other than grapes.of the five loci. Each locus shows evidence of betweenDifferent patterns of variation were found among dif-two and five recombination events by the four-gameteferent groups of strains. A significant reduction in diver-test (Table 4). The absolute value of D � within a locus issity is found within strains from wine and sake comparednegatively correlated with distance between polymor-with diversity within other groups and total diversity (Ta-phic sites (P � 5 � 10�5), but not for the randomizedble 4). In addition to a reduction in diversity, the vine-data (Table 6). This could be due to gene conversionyard strains also show a greater proportion of rare vari-or recombination between individuals from the sameants, as measured by Tajima’s D , compared to that insubpopulation but not from different subpopulations.other groups and to the total (Table 4).The recombination mutation ratio, estimated from theLinkage disequilibrium and recombination: There areratio of �w from synonymous sites over 4Nc , ranges fromsignificant levels of linkage disequilibrium between un-1.4 to 2.7 and the average is 2.1 (Table 7). The mutationlinked genes (Figure 1). Linkage disequilibrium was mea-rate has been estimated from CAN1 and SUP3 at 2.25 �sured by the average absolute value of D � for all polymor-10�10 per base pair per generation (Drake 1991). Givenphic sites with a minor allele frequency of �10% amongthat 82% of spontaneous mutations are single-base sub-the 45 strains for which there was no missing data (Ta-stitutions (Kang et al. 1992), the point mutation rate isble 5). The average absolute value of D � from all pairwise1.84 � 10�10. The genomic average rate of recombina-comparisons between loci ranges from 0.57 to 0.82. Alltion is 0.34 cM/kbp or 6.8 � 10�6 recombination eventspairwise comparisons within loci range from 0.71 (ZDS2)per base pair (Cherry et al. 1997). Similar to a previousto 0.98 (PDR10). The expected absolute value of D � forstudy (Jensen et al. 2001), the laboratory estimate ofunlinked sites is 0.26 and was obtained by resamplingthe ratio of recombination events to mutation events isof polymorphic sites, keeping the allele frequencies con-four orders of magnitude greater than that inferredstant. This high rate of linkage disequilibrium can be ex-
TABLE 4
Diversity within groups
Source a Strains � (�100)b R m TD
Sake wine 9 0.10 (0.01) 3 0.839Grape wine 23 0.14 (0.03) 5 �1.57Clinical 4 0.42 (0.10) 2 0.311Nature 5 0.50 (0.08) 3 �0.31Fermentation 4 0.55 (0.15) 0 0.563Total 45 0.42 (0.03) 31 �0.57
�, the average number of pairwise differences between strains,per base pair; R m , the minimum number of recombination Figure 1.—Linkage disequilibrium measured by |D � |. Only
pairs with |D � | � 0.5 and a significant association are shownevents; TD, Tajima’s D - statistic.a Only strains without missing data are used. (Fisher’s exact test, P � 0.05). The color indicates |D � | that
ranges from 0.5 (yellow) to 1.0 (red).b Standard error is shown in parentheses.
1580 J. C. Fay and J. A. Benavides
TABLE 7TABLE 5
Average pairwise linkage disequilibrium Population sample statistics from 45 strainswith data from all five genes
Gene No. sites CCA1 CYT1 MLS1 PDR10 ZDS2Gene �W (�100) R (�100) �W/R
CCA1 11 0.75 0.73 0.76 0.82 0.65CYT1 4 0.36 0.88 0.59 0.65 0.58 CCA1 1.28 0.48 2.66MLS1 20 0.33 0.28 0.94 0.75 0.69 CYT1 1.53 1.04 1.48PDR10 14 0.27 0.23 0.23 0.98 0.57 MLS1 0.98 0.36 2.73ZDS2 10 0.34 0.33 0.30 0.26 0.71 PDR10 0.65 0.27 2.40
ZDS2 1.30 0.94 1.38Linkage disequilibrium (LD) within a locus is shown on the Average 1.15 0.62 2.13
diagonal, LD between loci is shown above the diagonal, LDbetween randomized data is shown below the diagonal. Link- �W, a measure of variation based on the number of segregat-age disequilibrium was measured by the absolute value of D � ing sites (Watterson 1975); R , a measure of recombinationfor sites with a minor allele frequency of �10%. Only the 45 (Hudson 1987).strains with complete data for all five genes were used.
With the exception of CYT1, the genes examined in thisfrom the polymorphism data. This can be explained bystudy have a synonymous substitution rate nearly identi-higher rates of asexual compared to sexual reproduc-cal to the average rate and do not have high levels oftion as well as by mating-type switching, which enablescodon bias.a cell to mate with its forebear following meiosis.
The pattern of substitutions at synonymous sites is in-Selection on synonymous sites: The detection of se-dicative of whether synonymous sites are at mutation-lection on nonsynonymous or noncoding sites is greatlyselection balance. If they are not, the assumption thatfacilitated if synonymous sites are effectively neutral. Insynonymous sites are effectively neutral is violated. InS. cerevisiae, there is ample evidence that synonymousDrosophila, the relationship between codon bias andsites are not neutral (Bennetzen and Hall 1982; Bul-synonymous substitution rate is very weak if presentmer 1987). However, not all genes and not all synonymous(Dunn et al. 2001; Bierne and Eyre-Walker 2003).sites may be influenced by selection. For the purposes of de-There is, however, a clear difference in the pattern oftecting selection on nonsynonymous or noncoding sites,preferred and unpreferred synonymous substitutionssynonymous sites may be considered effectively neutralbetween D. melanogaster and D. similans (Akashi 1996;if their substitution rate and pattern of preferred andBegun 2001). To determine whether patterns of synony-unpreferred synonymous changes are no different frommous substitutions in S. cerevisiae show a similar nonequi-those in neutral sites.
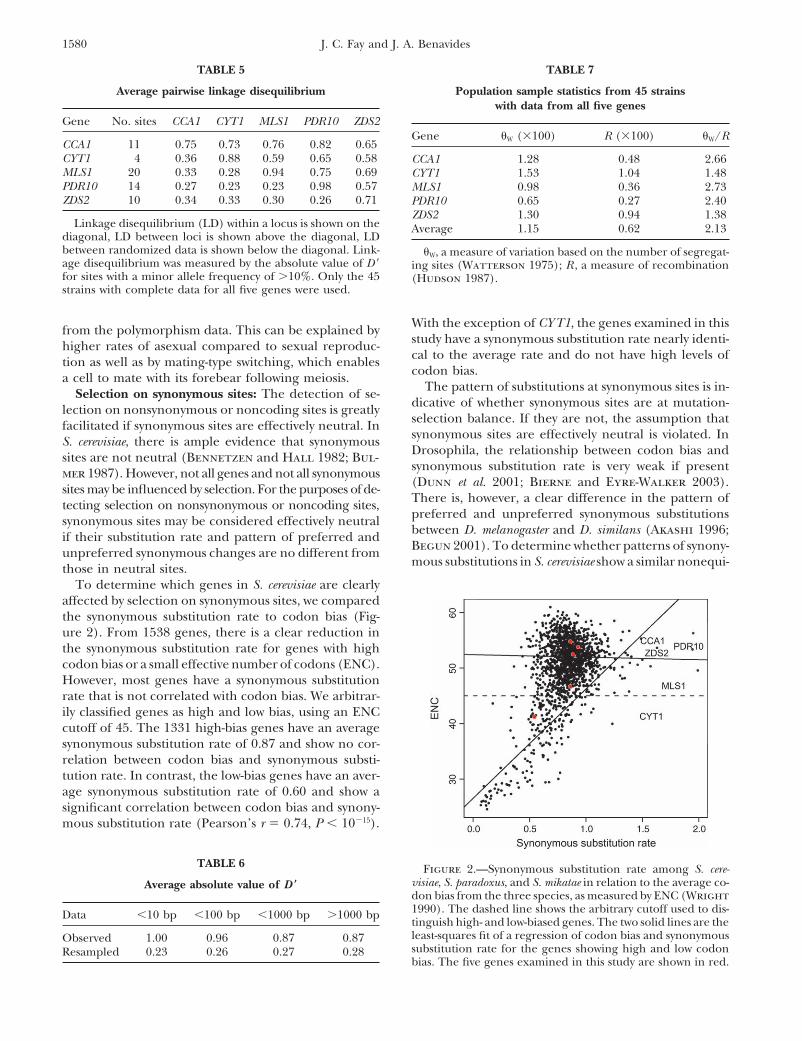
To determine which genes in S. cerevisiae are clearlyaffected by selection on synonymous sites, we comparedthe synonymous substitution rate to codon bias (Fig-ure 2). From 1538 genes, there is a clear reduction inthe synonymous substitution rate for genes with highcodon bias or a small effective number of codons (ENC).However, most genes have a synonymous substitutionrate that is not correlated with codon bias. We arbitrar-ily classified genes as high and low bias, using an ENCcutoff of 45. The 1331 high-bias genes have an averagesynonymous substitution rate of 0.87 and show no cor-relation between codon bias and synonymous substi-tution rate. In contrast, the low-bias genes have an aver-age synonymous substitution rate of 0.60 and show asignificant correlation between codon bias and synony-mous substitution rate (Pearson’s r � 0.74, P � 10�15).
TABLE 6 Figure 2.—Synonymous substitution rate among S. cere-visiae, S. paradoxus, and S. mikatae in relation to the average co-Average absolute value of D �don bias from the three species, as measured by ENC (Wright1990). The dashed line shows the arbitrary cutoff used to dis-Data �10 bp �100 bp �1000 bp �1000 bptinguish high- and low-biased genes. The two solid lines are theleast-squares fit of a regression of codon bias and synonymousObserved 1.00 0.96 0.87 0.87substitution rate for the genes showing high and low codonResampled 0.23 0.26 0.27 0.28bias. The five genes examined in this study are shown in red.

1581Hypervariable Noncoding Sequences
TABLE 8
Preferred and unpreferred synonymous polymorphism and divergence
Polymorphic changes Fixed differences
Gene P → P P → U U → P U → U P → P P → U U → P U → U
CCA1 2 3 2 2 3 5 6 5CYT1 2 3 2 1 5 4 2 3MLS1 3 3 4 0 9 8 8 2PDR10 1 0 2 1 3 11 11 5ZDS2 1 1 2 4 1 5 6 6Total 9 10 12 8 21 33 33 21
P and U , preferred and unpreferred codons, respectively; e.g., P → P is a synonymous substitution from apreferred to a different preferred codon.
librium status, we compared the number of unpreferred combined dN/d S ratios are 0.09, 0.10, and 0.09 for thebranch leading to S. cerevisiae , S. paradoxus , and S. mika-and preferred changes along the lineage leading to
S. cerevisiae and within strains of S. cerevisiae (Table 8). tae , respectively.The ratio of noncoding to synonymous substitutionsBoth polymorphic and fixed synonymous changes show
an equal number of preferred to unpreferred (P → U) (dNC/d S) measures the selective constraint on noncod-ing sequences, assuming the mutation rate is the sameand unpreferred to preferred (U → P) changes.
The data show that the synonymous substitution rate across the coding and noncoding sequences. All of thepromoters show considerable levels of functional con-and pattern of synonymous substitution in four of the
five genes are consistent with those expected for neutral straint. The combined dNC/d S ratios are 0.53, 0.49, and0.49 for the branch leading to S. cerevisiae , S. paradoxus ,sites. CYT1 has a reduced rate of synonymous substitu-
tion, but, interestingly, has the highest rate of synony- and S. mikatae , respectively. This implies that nearly one-half of intergenic sequences are functionally constrained,mous-site diversity (Table 3). The HKA test (Hudson
et al. 1987) reveals a lower ratio of synonymous polymor- only slightly �0.52, the median dNC/d S from 2098 genes(Doniger et al. 2005).phism to divergence in CYT1 compared to that in PDR10
(P � 0.048), but not in comparison to that in any of the Under the same assumptions used to test for branch-specific dN/dS ratios, the ratio of nonsynonymous- to syn-other three genes. After correction for multiple compar-
isons this difference is not significant. onymous-site polymorphism (pN/pS) should equal dN/dS .This comparison is the basis for the McDonald-KreitmanSelection on nonsynonymous and noncoding sites:
The ratio of nonsynonymous to synonymous substitu- (MK) test (McDonald and Kreitman 1991), whichcompares polymorphic sites and fixed differences rathertions (dN/d S) measures the selective constraint on a pro-
tein. In the absence of positive selection or any changes than estimates of substitution rates. The average pN/p S
ratio, 0.11, is nearly identical to that of divergence, 0.09in selective constraint, the dN/dS ratio should be constantacross lineages and should not be greater than one (Fay (Table 9). Similarly, the average pNC/p S ratio of diversity,
0.62, is similar to that of divergence, 0.54 (Table 9).and Wu 2001). None of the five proteins show signifi-cant differences in the levels of constraint among the The comparison of N/S ratios from polymorphism
and divergence can be misleading if positive selectionlineages leading to S. cerevisiae , S. paradoxus , and S. mika-tae (likelihood-ratio test using PAML, P � 0.05). The increases the N/S ratio of divergence and negative selec-
TABLE 9
Rates of DNA polymorphism compared to divergence
Polymorphism (� � 100) Divergence
Gene NC N S NC/S N/S d NC d N d S d NC/d S d N/d S
CCA1 0.39 0.03 0.76 0.52 0.04 0.13 0.01 0.21 0.59 0.02CYT1 0.25 0.01 1.32 0.19 0.01 0.06 0.00 0.14 0.47 0.04MLS1 0.91 0.10 0.80 1.14 0.13 0.15 0.00 0.21 0.69 0.02PDR10 0.55 0.15 0.33 1.65 0.46 0.13 0.05 0.28 0.45 0.18ZDS2 0.51 0.16 0.99 0.52 0.16 0.13 0.04 0.26 0.49 0.15Average 0.52 0.09 0.84 0.62 0.11 0.12 0.02 0.22 0.54 0.09
Rates of divergence were obtained for the lineage leading to S. cerevisiae using PAML.
1582 J. C. Fay and J. A. Benavides
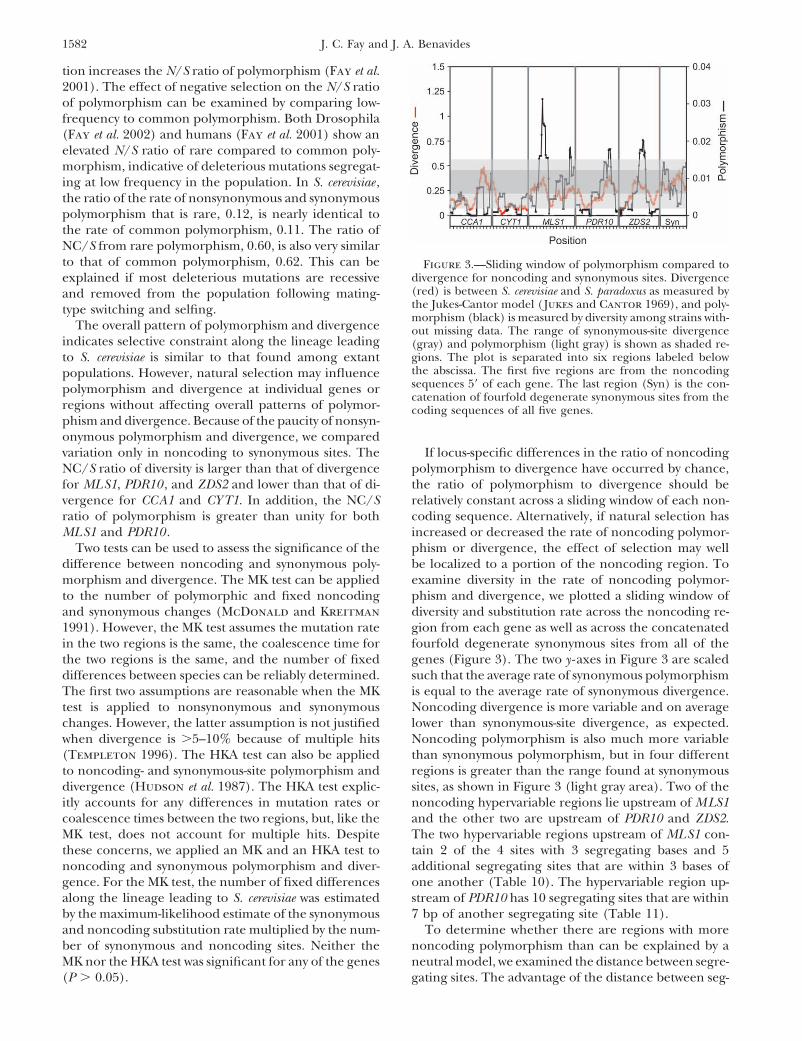
tion increases the N/S ratio of polymorphism (Fay et al.2001). The effect of negative selection on the N/S ratioof polymorphism can be examined by comparing low-frequency to common polymorphism. Both Drosophila(Fay et al. 2002) and humans (Fay et al. 2001) show anelevated N/S ratio of rare compared to common poly-morphism, indicative of deleterious mutations segregat-ing at low frequency in the population. In S. cerevisiae ,the ratio of the rate of nonsynonymous and synonymouspolymorphism that is rare, 0.12, is nearly identical tothe rate of common polymorphism, 0.11. The ratio ofNC/S from rare polymorphism, 0.60, is also very similarto that of common polymorphism, 0.62. This can be Figure 3.—Sliding window of polymorphism compared to
divergence for noncoding and synonymous sites. Divergenceexplained if most deleterious mutations are recessive(red) is between S. cerevisiae and S. paradoxus as measured byand removed from the population following mating-the Jukes-Cantor model ( Jukes and Cantor 1969), and poly-type switching and selfing.morphism (black) is measured by diversity among strains with-
The overall pattern of polymorphism and divergence out missing data. The range of synonymous-site divergenceindicates selective constraint along the lineage leading (gray) and polymorphism (light gray) is shown as shaded re-
gions. The plot is separated into six regions labeled belowto S. cerevisiae is similar to that found among extantthe abscissa. The first five regions are from the noncodingpopulations. However, natural selection may influencesequences 5� of each gene. The last region (Syn) is the con-polymorphism and divergence at individual genes orcatenation of fourfold degenerate synonymous sites from the
regions without affecting overall patterns of polymor- coding sequences of all five genes.phism and divergence. Because of the paucity of nonsyn-onymous polymorphism and divergence, we comparedvariation only in noncoding to synonymous sites. The If locus-specific differences in the ratio of noncoding
polymorphism to divergence have occurred by chance,NC/S ratio of diversity is larger than that of divergencefor MLS1, PDR10 , and ZDS2 and lower than that of di- the ratio of polymorphism to divergence should be
relatively constant across a sliding window of each non-vergence for CCA1 and CYT1. In addition, the NC/Sratio of polymorphism is greater than unity for both coding sequence. Alternatively, if natural selection has
increased or decreased the rate of noncoding polymor-MLS1 and PDR10 .Two tests can be used to assess the significance of the phism or divergence, the effect of selection may well
be localized to a portion of the noncoding region. Todifference between noncoding and synonymous poly-morphism and divergence. The MK test can be applied examine diversity in the rate of noncoding polymor-
phism and divergence, we plotted a sliding window ofto the number of polymorphic and fixed noncodingand synonymous changes (McDonald and Kreitman diversity and substitution rate across the noncoding re-
gion from each gene as well as across the concatenated1991). However, the MK test assumes the mutation ratein the two regions is the same, the coalescence time for fourfold degenerate synonymous sites from all of the
genes (Figure 3). The two y -axes in Figure 3 are scaledthe two regions is the same, and the number of fixeddifferences between species can be reliably determined. such that the average rate of synonymous polymorphism
is equal to the average rate of synonymous divergence.The first two assumptions are reasonable when the MKtest is applied to nonsynonymous and synonymous Noncoding divergence is more variable and on average
lower than synonymous-site divergence, as expected.changes. However, the latter assumption is not justifiedwhen divergence is �5–10% because of multiple hits Noncoding polymorphism is also much more variable
than synonymous polymorphism, but in four different(Templeton 1996). The HKA test can also be appliedto noncoding- and synonymous-site polymorphism and regions is greater than the range found at synonymous
sites, as shown in Figure 3 (light gray area). Two of thedivergence (Hudson et al. 1987). The HKA test explic-itly accounts for any differences in mutation rates or noncoding hypervariable regions lie upstream of MLS1
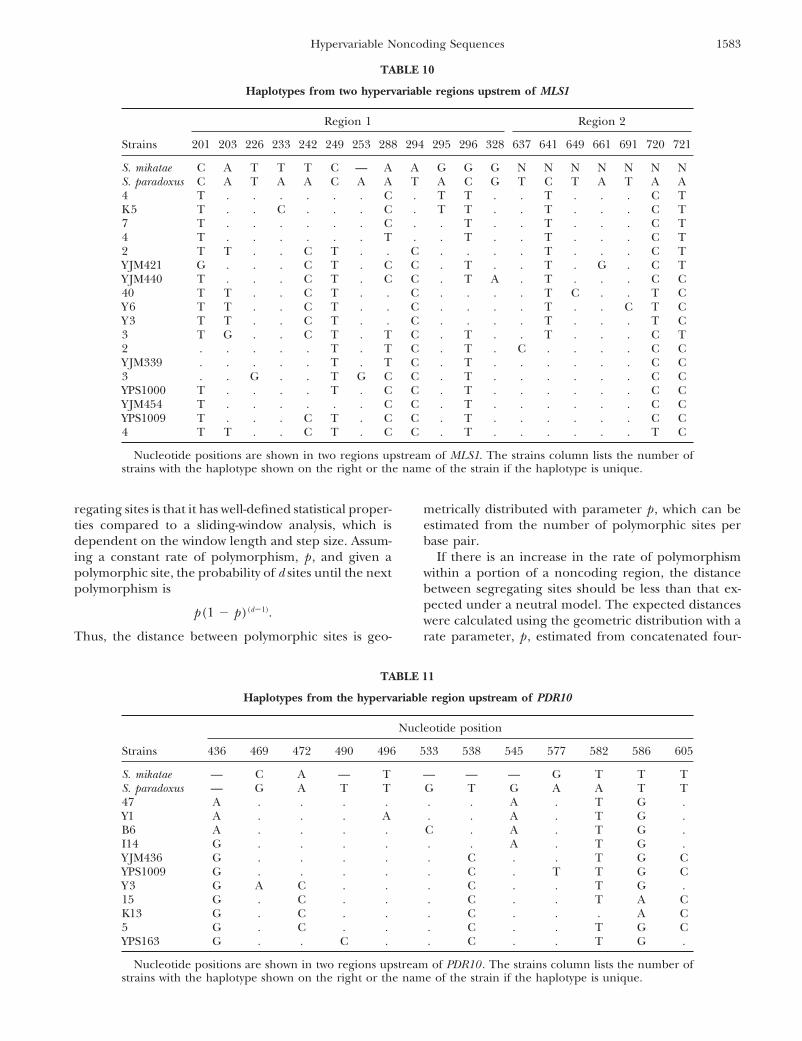
and the other two are upstream of PDR10 and ZDS2.coalescence times between the two regions, but, like theMK test, does not account for multiple hits. Despite The two hypervariable regions upstream of MLS1 con-
tain 2 of the 4 sites with 3 segregating bases and 5these concerns, we applied an MK and an HKA test tononcoding and synonymous polymorphism and diver- additional segregating sites that are within 3 bases of
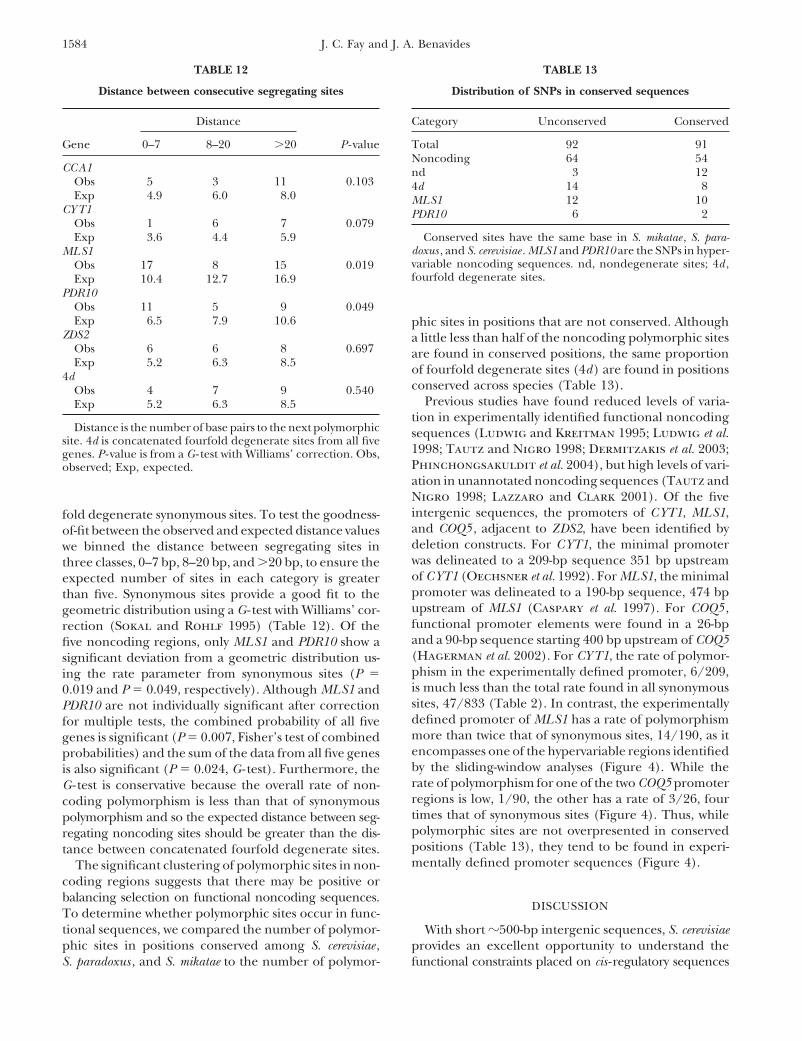
one another (Table 10). The hypervariable region up-gence. For the MK test, the number of fixed differencesalong the lineage leading to S. cerevisiae was estimated stream of PDR10 has 10 segregating sites that are within
7 bp of another segregating site (Table 11).by the maximum-likelihood estimate of the synonymousand noncoding substitution rate multiplied by the num- To determine whether there are regions with more
noncoding polymorphism than can be explained by aber of synonymous and noncoding sites. Neither theMK nor the HKA test was significant for any of the genes neutral model, we examined the distance between segre-
gating sites. The advantage of the distance between seg-(P � 0.05).
1583Hypervariable Noncoding Sequences
TABLE 10
Haplotypes from two hypervariable regions upstrem of MLS1
Region 1 Region 2
Strains 201 203 226 233 242 249 253 288 294 295 296 328 637 641 649 661 691 720 721
S. mikatae C A T T T C — A A G G G N N N N N N NS. paradoxus C A T A A C A A T A C G T C T A T A A4 T . . . . . . C . T T . . T . . . C TK5 T . . C . . . C . T T . . T . . . C T7 T . . . . . . C . . T . . T . . . C T4 T . . . . . . T . . T . . T . . . C T2 T T . . C T . . C . . . . T . . . C TYJM421 G . . . C T . C C . T . . T . G . C TYJM440 T . . . C T . C C . T A . T . . . C C40 T T . . C T . . C . . . . T C . . T CY6 T T . . C T . . C . . . . T . . C T CY3 T T . . C T . . C . . . . T . . . T C3 T G . . C T . T C . T . . T . . . C T2 . . . . . T . T C . T . C . . . . C CYJM339 . . . . . T . T C . T . . . . . . C C3 . . G . . T G C C . T . . . . . . C CYPS1000 T . . . . T . C C . T . . . . . . C CYJM454 T . . . . . . C C . T . . . . . . C CYPS1009 T . . . C T . C C . T . . . . . . C C4 T T . . C T . C C . T . . . . . . T C
Nucleotide positions are shown in two regions upstream of MLS1. The strains column lists the number ofstrains with the haplotype shown on the right or the name of the strain if the haplotype is unique.
regating sites is that it has well-defined statistical proper- metrically distributed with parameter p , which can beestimated from the number of polymorphic sites perties compared to a sliding-window analysis, which is
dependent on the window length and step size. Assum- base pair.If there is an increase in the rate of polymorphisming a constant rate of polymorphism, p , and given a
polymorphic site, the probability of d sites until the next within a portion of a noncoding region, the distancebetween segregating sites should be less than that ex-polymorphism ispected under a neutral model. The expected distances
p(1 � p)(d�1).were calculated using the geometric distribution with arate parameter, p , estimated from concatenated four-Thus, the distance between polymorphic sites is geo-
TABLE 11
Haplotypes from the hypervariable region upstream of PDR10
Nucleotide position
Strains 436 469 472 490 496 533 538 545 577 582 586 605
S. mikatae — C A — T — — — G T T TS. paradoxus — G A T T G T G A A T T47 A . . . . . . A . T G .Y1 A . . . A . . A . T G .B6 A . . . . C . A . T G .I14 G . . . . . . A . T G .YJM436 G . . . . . C . . T G CYPS1009 G . . . . . C . T T G CY3 G A C . . . C . . T G .15 G . C . . . C . . T A CK13 G . C . . . C . . . A C5 G . C . . . C . . T G CYPS163 G . . C . . C . . T G .
Nucleotide positions are shown in two regions upstream of PDR10 . The strains column lists the number ofstrains with the haplotype shown on the right or the name of the strain if the haplotype is unique.
1584 J. C. Fay and J. A. Benavides
TABLE 13TABLE 12
Distance between consecutive segregating sites Distribution of SNPs in conserved sequences
Category Unconserved ConservedDistance
Total 92 91Gene 0–7 8–20 �20 P - valueNoncoding 64 54
CCA1 nd 3 12Obs 5 3 11 0.103 4d 14 8Exp 4.9 6.0 8.0 MLS1 12 10
CYT1 PDR10 6 2Obs 1 6 7 0.079
Conserved sites have the same base in S. mikatae , S. para-Exp 3.6 4.4 5.9doxus , and S. cerevisiae . MLS1 and PDR10 are the SNPs in hyper-MLS1variable noncoding sequences. nd, nondegenerate sites; 4d ,Obs 17 8 15 0.019fourfold degenerate sites.Exp 10.4 12.7 16.9
PDR10Obs 11 5 9 0.049Exp 6.5 7.9 10.6 phic sites in positions that are not conserved. Although
ZDS2 a little less than half of the noncoding polymorphic sitesObs 6 6 8 0.697 are found in conserved positions, the same proportionExp 5.2 6.3 8.5 of fourfold degenerate sites (4d) are found in positions4d
conserved across species (Table 13).Obs 4 7 9 0.540Previous studies have found reduced levels of varia-Exp 5.2 6.3 8.5
tion in experimentally identified functional noncodingDistance is the number of base pairs to the next polymorphic sequences (Ludwig and Kreitman 1995; Ludwig et al.
site. 4d is concatenated fourfold degenerate sites from all five1998; Tautz and Nigro 1998; Dermitzakis et al. 2003;genes. P - value is from a G - test with Williams’ correction. Obs,Phinchongsakuldit et al. 2004), but high levels of vari-observed; Exp, expected.ation in unannotated noncoding sequences (Tautz andNigro 1998; Lazzaro and Clark 2001). Of the fiveintergenic sequences, the promoters of CYT1, MLS1,fold degenerate synonymous sites. To test the goodness-and COQ5 , adjacent to ZDS2, have been identified byof-fit between the observed and expected distance valuesdeletion constructs. For CYT1, the minimal promoterwe binned the distance between segregating sites inwas delineated to a 209-bp sequence 351 bp upstreamthree classes, 0–7 bp, 8–20 bp, and �20 bp, to ensure theof CYT1 (Oechsner et al. 1992). For MLS1, the minimalexpected number of sites in each category is greaterpromoter was delineated to a 190-bp sequence, 474 bpthan five. Synonymous sites provide a good fit to theupstream of MLS1 (Caspary et al. 1997). For COQ5 ,geometric distribution using a G - test with Williams’ cor-functional promoter elements were found in a 26-bprection (Sokal and Rohlf 1995) (Table 12). Of theand a 90-bp sequence starting 400 bp upstream of COQ5five noncoding regions, only MLS1 and PDR10 show a(Hagerman et al. 2002). For CYT1, the rate of polymor-significant deviation from a geometric distribution us-phism in the experimentally defined promoter, 6/209,ing the rate parameter from synonymous sites (P �is much less than the total rate found in all synonymous0.019 and P � 0.049, respectively). Although MLS1 andsites, 47/833 (Table 2). In contrast, the experimentallyPDR10 are not individually significant after correctiondefined promoter of MLS1 has a rate of polymorphismfor multiple tests, the combined probability of all fivemore than twice that of synonymous sites, 14/190, as itgenes is significant (P � 0.007, Fisher’s test of combinedencompasses one of the hypervariable regions identifiedprobabilities) and the sum of the data from all five genesby the sliding-window analyses (Figure 4). While theis also significant (P � 0.024, G - test). Furthermore, therate of polymorphism for one of the two COQ5 promoterG - test is conservative because the overall rate of non-regions is low, 1/90, the other has a rate of 3/26, fourcoding polymorphism is less than that of synonymoustimes that of synonymous sites (Figure 4). Thus, whilepolymorphism and so the expected distance between seg-polymorphic sites are not overpresented in conservedregating noncoding sites should be greater than the dis-positions (Table 13), they tend to be found in experi-tance between concatenated fourfold degenerate sites.mentally defined promoter sequences (Figure 4).The significant clustering of polymorphic sites in non-
coding regions suggests that there may be positive orbalancing selection on functional noncoding sequences.
DISCUSSIONTo determine whether polymorphic sites occur in func-tional sequences, we compared the number of polymor- With short �500-bp intergenic sequences, S. cerevisiaephic sites in positions conserved among S. cerevisiae , provides an excellent opportunity to understand the
functional constraints placed on cis -regulatory sequencesS. paradoxus , and S. mikatae to the number of polymor-

1585Hypervariable Noncoding Sequences
Figure 4.—Multiple sequence alignment ofexperimentally defined promoters (gray) up-stream of MLS1 (A) and ZDS2 (B). Polymor-phic sites are shown in green and transcriptionfactor-binding sites designated in the originalstudy are shown in red. Arrows show sites withthree segregating bases.
and their evolution. To address this issue we have com- PDR10 noncoding sequences showed any significant de-parture from neutrality by any of the statistical tests ofpared DNA sequence variation found within and be-
tween Saccharomyces species in noncoding and coding heterogeneity implemented in DNA Slider (McDonald1998). It is likely that the power of these tests is limitedsequences. The main result is the observation of non-
coding sequences with higher than expected rates of when rates of divergence are high, since at high diver-gence the number of runs should become relativelypolymorphism. A secondary finding is extensive linkage
disequilibrium, even between unlinked loci. Population constant for any distribution of polymorphic sites.There are few explanations for the clustering of poly-subdivision, possibly caused by two separate domestica-
tion events (Fay and Benavides 2005), is likely a major morphic noncoding sites upstream of MLS1 and PDR10 .Our evidence comes from comparing the distance be-contributor to linkage disequilibrium.
On average, rates of DNA polymorphism and diver- tween noncoding polymorphic sites to synonymouspolymorphic sites. Thus, a number of factors that affectgence in noncoding sites are �40% lower than those
at synonymous sites (Table 9). Yet four small regions polymorphism at synonymous sites should be consid-ered. First, a reduced mutation rate at synonymous siteswithin noncoding sequences show rates of polymor-
phism greater than those at synonymous sites (Figure 3). should cause a decrease in diversity and an increase inthe distance between polymorphic synonymous sites.The clustering of polymorphic sites upstream of MLS1
and PDR10 is significantly greater than that expected However, divergence at synonymous sites is greater thanthat found at noncoding sites. Second, selection couldon the basis of fourfold degenerate sites.
For a variety of reasons, commonly used statistical tests result in a reduction in diversity at synonymous but notat noncoding sites, thereby increasing the distance be-of neutrality show no significant results for the MLS1
and PDR10 promoter. Neither an MK test nor an HKA tween synonymous polymorphic sites. With the excep-tion of PDR10 , there is no evidence for a reduction intest showed any significant differences between rates of
polymorphism and divergence at noncoding and synon- synonymous-site diversity across the five genes (Table 3).Even if diversity at synonymous sites within PDR10 wereymous sites. The lack of significance can be explained
since both tests measure differences between the rates reduced, the statistical test for clustering of noncodingsites relies on the combined fourfold degenerate dataof polymorphism and divergence between two classes of
sites, averaged over the entire region, whereas the hyper- from all five genes. Finally, some synonymous sites maybe functionally constrained, thereby lowering rates ofvariable sequences are limited to small regions within
the intergenic sequences. The runs test is designed to polymorphism and the distance between polymorphicsites. Only CCA1 shows evidence for significant levelsdetect heterogeneity in the ratio of polymorphism to di-
vergence since polymorphic sites and fixed differences of constraint on synonymous sites (Figure 2). Yet insteadof showing a reduced rate of polymorphism, CCA1 hasare expected to be evenly interspersed between one an-
other (McDonald 1996). Neither the MLS1 nor the the highest level of synonymous-site diversity (Table 9).

1586 J. C. Fay and J. A. Benavides
at the Genome and Sequencing Center for use of an ABI 3730xl se-Hypervariable noncoding sequences could also bequencer; and two anonymous reviewers for useful comments on thecaused by mutation hotspots in noncoding sequences.interpretation of the data.
Yet hotspots should increase both polymorphism anddivergence, and only polymorphism appears inflated.Furthermore, there is little evidence for large-scale mu-
LITERATURE CITEDtational heterogeneity across the S. cerevisiae genome
Aebi, M., G. Kirchner, J. Y. Chen, U. Vijayraghavan, A. Jacobson(Chin et al. 2005). If mutational hotspots are presentet al., 1990 Isolation of a temperature-sensitive mutant with an
but not at a fixed location, polymorphic sites should altered tRNA nucleotidyltransferase and cloning of the gene en-coding tRNA nucleotidyltransferase in the yeast Saccharomycescluster but divergence should average to a uniform dis-cerevisiae. J. Biol. Chem. 265: 16216–16220.tribution over a long enough period of time. Although
Akashi, H., 1996 Molecular evolution between Drosophila melanogas-transient mutational hotspots provide a rather tenuous ter and D. simulans : reduced codon bias, faster rates of amino
acid substitution, and larger proteins in D. melanogaster. Geneticsexplanation for the data, two mechanisms are possible.144: 1297–1307.First, a polymorphic site may increase the mutation rate
Balzi, E., and A. Goffeau, 1995 Yeast multidrug resistance: theat nearby bases. Second, recombination hotspots have PDR network. J. Bioenerg. Biomembr. 27: 71–76.
Begun, D. J., 2001 The frequency distribution of nucleotide varia-been found to be transient (Ptak et al. 2005; Wincklertion in Drosophila simulans. Mol. Biol. Evol. 18: 1343–1352.et al. 2005). If recombination hotspots are transient in
Bennetzen, J. L., and B. D. Hall, 1982 Codon selection in yeast.yeast and mutagenic, or repair deficient, they may result J. Biol. Chem. 257: 3026–3031.
Bi, E., and J. R. Pringle, 1996 ZDS1 and ZDS2, genes whose prod-in transient mutational hotspots. If this is the case, hyper-ucts may regulate Cdc42p in Saccharomyces cerevisiae. Mol. Cell.variable noncoding sequences should be observed acrossBiol. 16: 5264–5275.
the genome. Little or no clustering would be observed Bierne, N., and A. Eyre-Walker, 2003 The problem of countingsites in the estimation of the synonymous and nonsynonymousin coding sequences since most mutations would besubstitution rates: implications for the correlation between theremoved by negative selection.synonymous substitution rate and codon usage bias. Genetics
Selection on noncoding sites can both increase and 165: 1587–1597.Bulmer, M., 1987 Coevolution of codon usage and transfer RNAdecrease the distance between polymorphic sites. Both
abundance. Nature 325: 728–730.changes in selective constraint and the presence ofCargill, M., D. Altshuler, J. Ireland, P. Sklar, K. Ardlie et al.,
deleterious mutations can influence the ratio of non- 1999 Characterization of single-nucleotide polymorphisms incoding regions of human genes. Nat. Genet. 22: 231–238.coding- to synonymous-site diversity. Yet, the distance
Caspary, F., A. Hartig and H. J. Schuller, 1997 Constitutive andbetween noncoding polymorphic sites should be at thecarbon source-responsive promoter elements are involved in the
least equal to that found at synonymous sites. Positive regulated expression of the Saccharomyces cerevisiae malate syn-thase gene MLS1. Mol. Gen. Genet. 255: 619–627.selection, diversifying selection, and balancing selection
Cherry, J. M., C. Ball, S. Weng, G. Juvik, R. Schmidt et al., 1997can all increase the rate of polymorphism at noncodingGenetic and physical maps of Saccharomyces cerevisiae. Nature
sites above that of synonymous sites. Although positive 387: 67–73.Chin, C. S., J. H. Chuang and H. Li, 2005 Genome-wide regulatoryselection predicts very short sojourn times for variants
complexity in yeast promoters: separation of functionally con-under selection, population subdivision would inhibitserved and neutral sequence. Genome Res. 15: 205–213.
the rapid spread of a selected allele through the entire Cliften, P., P. Sudarsanam, A. Desikan, L. Fulton, B. Fulton et al.,2003 Finding functional features in Saccharomyces genomesspecies (Slatkin and Wiehe 1998). Alternatively, bal-by phylogenetic footprinting. Science 301: 71–76.ancing or diversifying selection could account for the
Dermitzakis, E. T., C. M. Bergman and A. G. Clark, 2003 Tracingexcess of noncoding compared to synonymous polymor- the evolutionary history of Drosophila regulatory regions with
models that identify transcription factor binding sites. Mol. Biol.phism and predicts elevated rates of polymorphism butEvol. 20: 703–714.not of divergence. Although there is no clear way to
Doniger, S., J. Huh and J. C. Fay, 2005 Identification of functionalconfidently distinguish these models of selection, one transcription factor binding sites using closely related Saccharo-
myces species. Genome Res. 15: 701–709.pertinent observation is that the ratio of NC/S is greaterDrake, J. W., 1991 A constant rate of spontaneous mutation in DNA-than one within some but not all groups of strains cate-
based microbes. Proc. Natl. Acad. Sci. USA 88: 7160–7164.gorized by source of isolation. Dunn, K. A., J. P. Bielawski and Z. Yang, 2001 Substitution rates
in Drosophila nuclear genes: implications for translational selec-In conclusion, there are two plausible models thattion. Genetics 157: 295–305.can explain the hypervariable noncoding sequences.
Ewing, B., and P. Green, 1998 Base-calling of automated sequencerFirst, hypervariable regions could be caused by transient traces using phred. II. Error probabilities. Genome Res. 8: 186–194.mutational hotspots. Second, hypervariable regions could Fay, J. C., and J. A. Benavides, 2005 Evidence for domesticated and
wild populations of Saccharomyces cerevisiae. PLoS Genet. 1: e5.be caused by some form of natural selection acting onFay, J. C., and C.-I Wu, 2001 The neutral theory in the genomicmutations that affect gene expression. With hypervari- era. Curr. Opin. Genet. Dev. 11: 642–646.
able regions found in three of the five genes, only two Fay, J. C., and C.-I Wu, 2003 Sequence divergence, functional con-straint, and selection in protein evolution. Annu. Rev. Genomicsshowing significance, it is difficult to determine whetherHum. Genet. 4: 213–235.the hypervariable sites are common, and more likely the Fay, J. C., G. J. Wyckoff and C.-I Wu, 2001 Positive and negative
result of a mutational explanation, or rare, and more selection on the human genome. Genetics 158: 1227–1234.Fay, J. C., G. J. Wyckoff and C.-I Wu, 2002 Testing the neutrallikely the result of natural selection.
theory of molecular evolution with genomic data from Drosoph-We thank B. Dunn, N. Goto-Yamamoto, R. Mortimer, C. Kurtzman, ila. Nature 415: 1024–1026.
Hagerman, R. A., P. J. Trotter and R. A. Willis, 2002 The regula-J. McCusker, and P. Sniegowski for contributing yeast strains; E. Mardis

1587Hypervariable Noncoding Sequences
tion of COQ5 gene expression by energy source. Free Radic. Res. study of 43 strains of Saccharomyces cerevisiae derived from natu-ral fermentation of grape musts. Yeast 10: 1543–1552.36: 485–490.
Halushka, M. K., J. B. Fan, K. Bentley, L. Hsie, N. Shen et al., 1999 Moses, A. M., D. Y. Chiang, M. Kellis, E. S. Lander and M. B. Eisen,2003 Position specific variation in the rate of evolution in tran-Patterns of single-nucleotide polymorphisms in candidate genes
for blood-pressure homeostasis. Nat. Genet. 22: 239–247. scription factor binding sites. BMC Evol. Biol. 3: 19.Moses, A. M., D. Y. Chiang and M. B. Eisen, 2004a PhylogeneticHartig, A., M. M. Simon, T. Schuster, J. R. Daugherty, H. S.
Yoo et al., 1992 Differentially regulated malate synthase genes motif detection by expectation-maximization on evolutionary mix-tures. Pac. Symp. Biocomput., 324–335.participate in carbon and nitrogen metabolism of S. cerevisiae.
Nucleic Acids Res. 20: 5677–5686. Moses, A. M., D. Y. Chiang, D. A. Pollard, V. N. Iyer and M. B. Eisen,2004b MONKEY: identifying conserved transcription-factorHellmann, I., S. Zollner, W. Enard, I. Ebersberger, B. Nickel et al.,
2003 Selection on human genes as revealed by comparisons to binding sites in multiple alignments using a binding site-specificevolutionary model. Genome Biol. 5: R98.chimpanzee cDNA. Genome Res. 13: 831–837.
Hudson, R. R., 1987 Estimating the recombination parameter of a Oechsner, U., H. Hermann, A. Zollner, A. Haid and W. Bandlow,1992 Expression of yeast cytochrome c1 is controlled at thefinite population model without selection. Genet. Res. 50: 245–250.
Hudson, R. R., M. Kreitman and M. Aguade, 1987 A test of neutral transcriptional level by glucose, oxygen and haem. Mol. Gen. Genet.232: 447–459.molecular evolution based on nucleotide data. Genetics 116:153–159.
Hudson, R. R., D. D. Boos and N. L. Kaplan, 1992 A statistical test Phinchongsakuldit, J., S. Macarthur and J. F. Brookfield, 2004Evolution of developmental genes: molecular microevolution offor detecting geographic subdivision. Mol. Biol. Evol. 9: 138–151.
Jenkins, D. L., C. A. Ortori and J. F. Brookfield, 1995 A test for enhancer sequences at the Ubx locus in Drosophila and its impacton developmental phenotypes. Mol. Biol. Evol. 21: 348–363.adaptive change in DNA sequences controlling transcription.
Proc. R. Soc. Lond. Ser. B Biol. Sci. 261: 203–207. Ptak, S. E., D. A. Hinds, K. Koehler, B. Nickel, N. Patil et al., 2005Fine-scale recombination patterns differ between chimpanzeesJensen, M. A., H. L. True, Y. O. Chernoff and S. Lindquist, 2001
Molecular population genetics and evolution of a prion-like pro- and humans. Nat. Genet. 37: 429–434.Richards, S., Y. Liu, B. R. Bettencourt, P. Hradecky, S. Letovskytein in Saccharomyces cerevisiae. Genetics 159: 527–535.
Johnston, J. R., C. Baccari and R. K. Mortimer, 2000 Genotypic et al., 2005 Comparative genome sequencing of Drosophilapseudoobscura: chromosomal, gene, and cis-element evolution.characterization of strains of commercial wine yeasts by tetrad
analysis. Res. Microbiol. 151: 583–590. Genome Res. 15: 1–18.Roy, N., and K. W. Runge, 1999 The ZDS1 and ZDS2 proteinsJukes, T. H., and C. R. Cantor, 1969 Evolution of protein mole-
cules, pp. 21–132 in Mammalian Protein Metabolism III, edited by require the Sir3p component of yeast silent chromatin to enhancethe stability of short linear centromeric plasmids. ChromosomaH. N. Munro. Academic Press, New York.
Kang, X. L., F. Yadao, R. D. Gietz and B. A. Kunz, 1992 Elimination 108: 146–161.Rozas, J., and R. Rozas, 1999 DnaSP version 3: an integrated pro-of the yeast RAD6 ubiquitin conjugase enhances base pair transi-
tions and G.C-T.A transversions as well as transposition of the Ty gram for molecular population genetics and molecular evolutionanalysis. Bioinformatics 15: 174–175.element: implications for the control of spontaneous mutation.
Sadler, I., K. Suda, G. Schatz, F. Kaudewitz and A. Haid, 1984Genetics 130: 285–294.Sequencing of the nuclear gene for the yeast cytochrome c1Kellis, M., N. Patterson, M. Endrizzi, B. Birren and E. S. Lander,precursor reveals an unusually complex amino-terminal pre-2003 Sequencing and comparison of yeast species to identifysequence. EMBO J. 3: 2137–2143.genes and regulatory elements. Nature 423: 241–254.
Slatkin, M., and T. Wiehe, 1998 Genetic hitch-hiking in a subdi-Kern, A. D., and D. J. Begun, 2005 Patterns of polymorphism andvided population. Genet. Res. 71: 155–160.divergence from noncoding sequences of Drosophila melanogas-
Sokal, R. R., and F. J. Rohlf, 1995 Biometry: The Principles and Practiceter and D. simulans: evidence for nonequilibrium processes. Mol.of Statistics in Biological Research. W. H. Freeman, New York.Biol. Evol. 22: 51–62.
Stephens, M., N. J. Smith and P. Donnelly, 2001 A new statisticalKimura, M., 1983 The Neutral Theory of Molecular Evolution. Cambridgemethod for haplotype reconstruction from population data. Am.University Press, Cambridge, UK.J. Hum. Genet. 68: 978–989.Kohn, M. H., S. Fang and C. I. Wu, 2004 Inference of positive and
Tajima, F., 1989 Statistical method for testing the neutral mutationnegative selection on the 5� regulatory regions of Drosophilahypothesis by DNA polymorphism. Genetics 123: 585–595.genes. Mol. Biol. Evol. 21: 374–383.
Tautz, D., and L. Nigro, 1998 Microevolutionary divergence pat-Lazzaro, B. P., and A. G. Clark, 2001 Evidence for recurrent paralo-tern of the segmentation gene hunchback in Drosophila. Mol.gous gene conversion and exceptional allelic divergence in theBiol. Evol. 15: 1403–1411.Attacin genes of Drosophila melanogaster . Genetics 159: 659–671.
Templeton, A. R., 1996 Contingency tests of neutrality using intra/Ludwig, M. Z., and M. Kreitman, 1995 Evolutionary dynamics ofinterspecific gene trees: the rejection of neutrality for the evolu-the enhancer region of even-skipped in Drosophila. Mol. Biol.tion of the mitochondrial cytochrome oxidase II gene in theEvol. 12: 1002–1011.hominoid primates. Genetics 144: 1263–1270.Ludwig, M. Z., N. H. Patel and M. Kreitman, 1998 Functional
Thomas, J. W., J. W. Touchman, R. W. Blakesley, G. G. Bouffard,analysis of eve stripe 2 enhancer evolution in Drosophila: rules S. M. Beckstrom-Sternberg et al., 2003 Comparative analysesgoverning conservation and change. Development 125: 949–958. of multi-species sequences from targeted genomic regions. Na-Ludwig, M. Z., C. Bergman, N. H. Patel and M. Kreitman, 2000 ture 424: 788–793.Evidence for stabilizing selection in a eukaryotic enhancer ele- Watterson, G. A., 1975 On the number of segregating sites inment. Nature 403: 564–567. genetical models without recombination. Theor. Popul. Biol. 7:
McDonald, J. H., 1996 Detecting non-neutral heterogeneity across 256–276.a region of DNA sequence in the ratio of polymorphism to diver- Winckler, W., S. R. Myers, D. J. Richter, R. C. Onofrio, G. J.gence. Mol. Biol. Evol. 13: 253–260. Mcdonald et al., 2005 Comparison of fine-scale recombination
McDonald, J. H., 1998 Improved tests for heterogeneity across a rates in humans and chimpanzees. Science 308: 107–111.region of DNA sequence in the ratio of polymorphism to diver- Wright, F., 1990 The ‘effective number of codons’ used in a gene.gence. Mol. Biol. Evol. 15: 377–384. Gene 87: 23–29.
McDonald, J. H., and M. Kreitman, 1991 Adaptive protein evolu- Yang, Z., 1997 PAML: a program package for phylogenetic analysistion at the Adh locus in Drosophila. Nature 351: 652–654. by maximum likelihood. Comput. Appl. Biosci. 13: 555–556.
Mortimer, R. K., P. Romano, G. Suzzi and M. Polsinelli, 1994Genome renewal: a new phenomenon revealed from a genetic Communicating editor: S. Yokoyama
