impact factor 3.582 case studies journal issn (2305 … 6 issue 12 paper 6.pdfimpact factor 3.582...
TRANSCRIPT

Impact Factor 3.582 Case Studies Journal ISSN (2305-509X) – Volume 6, Issue 12–Dec-2017
http://www.casestudiesjournal.com Page 57
Pre-Emptive Budgetary Process: An Antidote for Profitability
Author’s Details: (1)
Lawal Babatunde Ph.D*, (2)
Dada John (3)
Agbatogun Taofeek (4)
Oladipo Dotun (1)
Department of Accounting & Finance, McPherson University Ogun State,(2)
Department of Accounting & Finance,
McPherson University Ogun State,(3)
Department of Accounting, Federal University of Agriculture Abeokuta, Ogun
State,(4)
Department of Economics, Osun State University, Osogbo.
Abstract
In manufacturing companies, the relevancy of pre-emptive budgetary process is significantly important. It serves as a
standard to evaluate the actual result with the objective. Hence, this study examines and establishes modalities of which
budgetary process can be used as a tool for profit maximization in a manufacturing company, with a definite reference to
Coca-Cola Company. The main hypothesis tested examines the effect of budgetary process on profit maximization of a
manufacturing company, (Coca-Cola Company). Data was collected using both Primary and Secondary data. In order to
achieve robust findings, a KAP (Knowledge, Attitudes, and Perceptions) quantitative approach was adopted in which
questionnaires’ survey was administered. The Primary data was collected from the organization’s personnel’s and
stockholders in Coca-Cola Company. The data collected/retrieved through the questionnaires were analyzed using
statistical tool: the Statistical Package for Social Sciences (SPSS). The SPSS was also used to determine the relationship
between the variables (Budgetary Process and Profitability). The findings show that budgetary process is an important
tool for profit maximization in manufacturing Company. Based on the findings of this research, it is highly recommended
that all organizations should endeavour to execute an effective budgetary process. This process will not only create or
enhance organization profitability, but will also stimulate the consumers’ patronage and stakeholders’ satisfactions.
Keywords: manufacturing company, budgetary process, pre-emptive, knowledge, attitude, perceptions.
1.0 Introduction
Pre-emptive budgetary process occurs when a shareholder of capital to a start-up company, purchase shares, shareholders
want to ensure they have as much voting power in the future as it was when they initially invested in the company. Using
pre-emptive rights in its shareholder's agreement, the shareholders can ensure that any seasoned offerings will not dilute
his/her ownership percentage. An opportunity may be extended to select shareholders of a corporation that will give them
the right to purchase additional shares in the company before the general public will have the opportunity to partake in the
event.
Pre-emptive budgetary process is used by a current stockholder to maintain the percentage ownership interest in the
company by buying new shares on a pro-rata basis before the remaining shares are issued to the public. Pre-emptive
budgetary process prevents existing stockholders from dilution in value or control. The typical procedure is that each
existing stockholder receives a subscription warrant indicating the number of shares that can be bought. Usually, the new
shares are issued to the current stockholder at a lower price than the going market price. In addition, brokerage
commissions do not have to be paid. For example, if an individual owns 2% of the shares of a company that is coming out
with a new issue of 100,000 shares, the individual is entitled to buy 2000 shares at a favorable price to maintain the
proportionate interest.
Pre-emptive budgetary process gives existing stockholders the opportunity to purchase shares of a new issue before it is
offered to the public.
Pre-emptive budget process includes:
1. Banking: The authority of the Federal Reserve Board to pre-empt the authority of state legislatures to regulate
banking when intervention is deemed necessary to maintain stability in the credit markets. An example is the
Monetary Control Act of 1980, which authorized the Federal to set aside state usury ceilings at a time when
mortgage rates in some states were at, or close to, the legally permitted limits. In most situations, states are
authorized to nullify national pre-emption if they pass legislation within three years.
Impact Factor 3.582 Case Studies Journal ISSN (2305-509X) – Volume 6, Issue 12–Dec-2017
http://www.casestudiesjournal.com Page 58
2. Finance: The right of stockholders to subscribe to new issues of common stock before a public offering is made,
protecting against dilution of ownership. Depositors in a savings institution converting from mutual to stock
ownership have the same privilege.
Although, budgeting has been sourced by some, as exercise in futility because of is depending upon the future
events which cannot be predicted with precision is yet being found by most business executive to be the best to
find a tranquil harbour in the storm-battered world economy.
Budgeting can be defined as a financial statement that is prepared and approved prior to a defined period of
time, usually a year for the purpose of attaining of given objective. A well-prepared budget provides
management with a planned programmed based on research by the entire organization. In addition, a carefully
planned budget provides away to co-ordinal and various actions of the organization. In Nigeria today, organizations are confronted with the lack of appropriate implementation of pre-emptive budgeting
process that will bring about the achievement of their organizational profitability goal. Therefore, many organizations
have not recognized the impact that pre-emptive budgeting process can have on the overall profitability of the firm as a
whole. Hence, this research is set out to examine if pre-emptive budgeting process can serve as an antidote for an
organization profitability which is identified as the basic problem.
Thus, the objectives of this paper are to:
i. Examine pre-emptive budgeting process as an antidote for profitability.
ii. Determine the relationship between budgetary process and profitability in manufacturing company.
iii. Examine the effects of budgetary process on profitability.
The above objectives will be guided by the following questions:
i. Is pre-emptive budgeting process an antidote for profitability?
ii. Is there any relationship between budgetary process and profitability in a manufacturing company?
iii. What are the possible effects of budgetary process on profitability?
The essence of this research would rest on the fact that pre-emptive budgeting process is an indispensable necessity and an
important factor that will bring about favorable profitability for an organization if appropriately implemented.
2.0 Literature Review
2.1 Conceptual Framework
Business managers are continually involved in organizing, planning, and controlling the operation of both large and small
business organizations. Budgeting is one of the most important management tools used to plan and control business
operations. In the 1920’s, budgets were introduced as a tool to manage costs and movement of money received and spent
in large industrial organizations. According to Johnson (1996), he expressed that companies began to use budgets to
dictate what people need to do. Effective improvement was based on meeting financial targets in the company. Budget is
concerned with the future and as such the data that goes into its preparation must be future-oriented but on past events.
Definition of Budget
According to Lucey (2003), he defines budget as a quantitative expression of a plan of action prepared for the business as
a whole, for functions such as sales and production, or for financial resources items such as cash, capital expenditure, man
power purchase, and others. Kamukama (2006) defines budget as a plan of action measured in quantitative terms. Bruns
and Waterhouse (1975) also define budget as financial plans that provide the basis for directing and evaluating the
performance of individuals or segments of organizations.
According to Merchant (1981), he defines budgeting system as series of knowledge flows and administrative processes
and methods that are usually necessary part of the short-range planning and control system of an organization. Drury
(2006) defines budget as a plan expressed in quantitative, usually monetary term covering a particular period of time
usually one year. Budget provides as a valuable aid to management through planning, coordination and control. It is a tool
which measures the managerial performance of an organization. It promotes good morale and generates harmony in the

Impact Factor 3.582 Case Studies Journal ISSN (2305-509X) – Volume 6, Issue 12–Dec-2017
http://www.casestudiesjournal.com Page 59
organization. Also it promotes efficiency and facilities management by exceptions. It helps in promoting a feeling of cost
consciousness among the employees in the organization.
Types of Budget
There are several types of budget. According to Adams et al (2003), they identified different classes of budget which
include; incremental budget, activity based budgeting, zero-based, value based, profit planning and rolling budget and
forecast. Oduro (2001) opined the following types of budget in the public sector as:
Incremental Budget
Traditional budgeting analyses in public services have been based on the incremental approach. This involves using the
previous year’s budget, adjusted for known factors (such as new legislative requirements, additional resources, service
developments, and anticipated price inflation and pay awards). This means that existing operations and the presently
accepted budgeted allowance for current exercise are taken as the basis for process for preparing the next annual budget.
This is called incremental budgeting because the exercise is mainly involved with the increase in operations or money
spent that will be incurred during the next budget period. A major feature of this analysis is that budget preparation
involves a process of resolving and compromise. Therefore, incremental budgeting is based on a basic different view of
decision making compared to more rational approaches.
Activity Based Budgeting
This is also known as activity cost management which is defined as “a method of budgeting based on an exercise context
and utilizing cost driver data in the budget setting and different feedback processes. It is a part of planning and controlling
system which tends to corroborate the purposes of continuous improvement. Activity budgets can be designed to reflect
an activity based costing approach to the allocation of costs. The major objective of this approach in the private sector is
to accurately identify product costs where the production process involves a high level of fixed costs. This can also be
applied in the public sector, but in practice this is currently an under-developed technique of budgeting in the public sector
where limited financial information is currently available on activity bases and cost drivers.
Zero Based Budgeting (ZBB)
Zero based budgeting (ZBB) was developed in the United States in the early 1960s by Peter Pyrrh working at Texas
Instruments in an attempt to overcome the constraints of incremental techniques. It presumes that budgets can be
recompiled from first principles i.e. from a zero base and focuses on program and activities rather than departments or
units.
Jones and Pendlebury (1984), defines budgeting as a zero based budgeting stating clearly the preparation of operating
budgets from a zero base even though the organization might be operating more or less as in previous years. This process
is usually applied to new services which, genuinely, are being built up from a zero base. In addition, zero-based budgeting
can be applied to subjective heads such as repairs, maintenance, equipment where service priorities can be established
corporately without reference to previous years’ budgets. It can also be applied in three stages:
a) The decision unit: i.e. subdividing the organization to discrete sub-units where operations can be meaningfully and
individually identified and evaluated.
b) The decision packages: each decision unit manager submits no less than three budget packages namely: the lowest level
of expenditure; the expenditure required to maintain levels of activities and the expenditure required to provide an
additional level of service or activity.
c) Agreed packages will form the budget.
ZBB is best suited to discretionary and support services and thus has extensive potential application to the public sector.
With discretionary costs such as advertising or training managers have some discretion as to the amount they will budget
for the activity in question.

Impact Factor 3.582 Case Studies Journal ISSN (2305-509X) – Volume 6, Issue 12–Dec-2017
http://www.casestudiesjournal.com Page 60
Planning Programming Budgeting System (PPBS) Approach
The planning programming budgeting system (PPBS) approach was developed in the early 1950s as a mechanism by
which non-profit making organizations could obtain information on the efficiency and effectiveness in which it was
achieving its objectives and more importantly provide a sound basis by which available resources should be allocated.
PPBS output approach also seeks for options to find the most effective means of reaching basic program exercise. It is the
process of the preparation of long term strategic plan that clearly establishes the goals that the organization has to achieve.
Program budgeting is majorly a system associated with corporate management which identifies alternative policies,
presents the implications of their adoption and provides for the efficient control of those policies chosen. The principal
features are: it relates to objectives, it relates to outputs, it emphasizes the future and it emphasizes choice (Government
and Program Budgeting, IMTA 1971).
Performance Based Budgeting
There is no single definition of performance based budgeting (PBB) but most of the literature on this subject agrees that
the aim of PBB is to connect performance information with the allocation and management of resources. It is a budgeting
system which classifies items according to direct output of activity, intermediate product, activities, and purpose. It
focuses on output or outcome rather than input and it is characterized by expenditure by work load or unit cost of activity
primary features tasks, activities orientation management. It can be argued that the PBB process is a continuum that
involves the availability and use of performance based information at each of the various stages of the budget process;
budget preparation, approval, execution, audit and evaluation.
Benefits of Budget
Lucey (2003) outlines the benefits of budget as follows:
a. The budgetary process is an important method of communication and coordination both vertically and
horizontally.
b. The integration of budgets makes possible better cash and working capital management.
c. Better control of current operations is helped by regular, systematic monitoring and reporting of activities.
d. It provides clear guidelines for managers and supervisions and is the major way which organizational objectives
are translated into specific tasks and objectives related to individual managers.
Stages in Budget Process
The Budget Process occurs in four essential phases: formulation, adoption, execution, and audit.
Formulation Phase: the economic forecast and the program and financial plans are prepared for the various departments.
Economic data and statistics are utilized in developing projected revenues for the upcoming fiscal year once revenues
have been projected, a budget call is distributed to all the line agencies. This process starts when the Bureau of Budget and
Management Research (BBMR) issues guidelines to each line agency in the preparation and development of their
respective budgets.
Adoption Phase: This is the process in which the Legislature considers the President’s proposal and passes the overall
revenue and spending plan under a General Appropriations Bill. The Bill usually receives more detailed hearings within
the auspices of the applicable legislative committees. Usually, a series of hearings will be called during which department
heads and staff members give an overview of the President’s proposed budget and are expected to provide explanations
when their department’s / agency’s appropriations are considered.
Execution Phase: it involves the release of funds appropriated per the General Appropriations Act. Each department
prepares allotment of appropriations and may request revisions, legislative or administrative transfers, or supplemental
appropriations. BBMR must approve such revisions to allotments. The Bureau also monitors and assists agencies in
carrying out the approved budget in line with the established policies of the Governor.

Impact Factor 3.582 Case Studies Journal ISSN (2305-509X) – Volume 6, Issue 12–Dec-2017
http://www.casestudiesjournal.com Page 61
Audit Phase: It involves the evaluation of departments / agencies to identify areas in need of improving compliance
procedures with applicable laws and regulations. During the audit phase, financial transactions, accounts and reports are
assessed and analyzed to improve accountability, effectiveness, and efficiency in the achievement of goals and objectives.
This phase is also to assure economic use of the resources, and to enhance achievement.
Budgetary Process and Organization Performance
According to Omolehinwa (1989), he defined budget as a plan of control individuals in an organization measured in
monetary terms and show how the available resources may be utilized, to achieve whatever the control individuals agreed
to be the organization’s priorities. Abdullah (1998) opined that budgeting processing communication with higher
authorities has significant relationship to performance goals of the cost center managers of the institute. According to
Hope and Fraser (2003), budgeting is not so much as a financial plan but as the performance management process that
leads to and executes that plan. Therefore, budget is an entire performance management process.
The Budget Cycle
In both the private and public sectors, the budget is prepared by the budget committee having regard to the organization’s
objectives. In a company, it is submitted to the board of directors or chief executive for approval. When approved it
becomes an executive order. At the national level, the national budget is approved by both Cabinet and the Legislature
before it becomes operational. It would be easy to dismiss the budgeting process as beginning when the first budget is
prepared, and as being complete when the master budget is finalized. In reality, the budgeting process begins for many
organizations a long time before the budget period begins and the process ends once the budget period has ended. This
means that budgeting process is a very lengthy process. Typically, for a large organization, the pre- budgeting phase can
begin up to a year before the budget period starts Adu-Gyamfi (2008).
Jones and Pendlebury (1984) give some insight into the beginning of the budgeting cycle when they present a timetable
for preparation of detailed revenue budget and capital program for a local authority. They show that the process starts in
June in the year proceeding the budget period with the draft budget manual being sent to Finance Officers, who will
discuss this draft with their departmental staff with a view to adoption or amendment. The budgetary planning phase is
completed in March and made ready for an April discussion when the printed budget book is published and the approved
estimates are put into the financial control system.
Budget Preparation Purposes
In the view of Williamson (1996) budgets should be prepared to serve the following purposes:
Planning
The budgeting planning process ensures that managers do plan for future operations, and that they consider how
conditions in the next year might change and what steps they should take now to respond to these changed conditions.
Coordination
This brings different parts of the budget together, reconciled into a common plan. Budgets are not prepared for the benefit
of individuals involved in the process but for the best interest of the business or the stakeholders. Without guidance
therefore, managers might make their own decision that will work against the overall objective of the business.
Communication
Everyone in the budget preparation chain must be aware of their input to the success of the entity’s financial plan. This
will ensure that all are made accountable for the implementation of the budget. This will also help in coordinating all
budget activities for smooth implementation of the plan.
Motivation
The budget provides a standard which managers will evaluate their performance with. If they meet their targets regularly,
they may be motivated to go for a higher target. If budget are dictated from above and imposed on those who are to

Impact Factor 3.582 Case Studies Journal ISSN (2305-509X) – Volume 6, Issue 12–Dec-2017
http://www.casestudiesjournal.com Page 62
implement the plan, it will rather not motivate workers and may be resisted. It can also serve as a useful device for
influencing management behaviour and motivating managers to perform in line with the organizational objectives.
Control
Planned activities can be compared to the actual so that effort will be concentrated on ascertaining the reasons behind the
differences. By investigating the reasons for the differences, managers may be able to identify inefficiencies such as the
purchases of inferior quality materials. Appropriate control action will then be taken when reasons for inefficiencies have
been found.
Performance Evaluation
Performance is often evaluated by measuring a manager’s performance against budget and the ability to achieve the
targets would lead to promotion or bonus. The budget thus provides a very useful means of informing managers of how
well they are performing in meeting targets that they have previously helped to set. Williamson (Ibid) shares the view that,
budgets are simply exercises in calculation unless they are used. When an organization draws a budget it does so as part of
a system of budgetary control. The controls are some basic ideas of what the entity wants to do. It prepares budgets to
help to achieve those ideas; and then once that is done whatever it is that has to be done, budgetary controls check to see if
expenditures are on course.
The Budget as a Tool for Measuring Financial Performance
Merchants, Stede and Zheng (2003) opined that performance relates to qualitative and quantitative description of results
which can help shape the wealth of an organization. The importance of performance measurement is highlighted by the
popular dictum “what you measure is what you get” (Kaplan & Norton, 1996).
According to Bogt (2004), he mentioned that measurement is associated to organizational activities, production or output,
and in the public sector performance measurement is associated to primary activities and outcome resulting from public
policy. Performance measurement is simply a method for assessing progress towards stated goals. It is not intended to act
as a reward or punishment mechanism, but rather as a communication and management tool. The goal of instituting
performance measurement in government is to shift the focus from the amount of resources allocated, to the results
achieved with those resources. Performance measurement in the public sector can serve a variety of purposes.
First, it serves as a vehicle for communication. To the public, they signal the things that government deems important, and
how the government should be judged. Second, it serves as a motivational tool. To those within the organization,
measures signal what is important, and what is necessary for success. Finally, measures can serve as a vital management
and decision-making tool, providing information that can be used to make improvements in program design and service
delivery (Alberta’s Treasury Guide on Performance Measurement, 1996). The primary focus of the government’s
performance measures is for public reporting purposes. Therefore, the foremost consideration is that the measures and the
information they provide should be clear and easy to understand.
3.0 Methodology
The research design for this research was based on descriptive/survey design. Survey design was adopted in this research
because it allows data to be collected from a sample with the aim of discovering the relationship or interaction among
variables. According to Adedayo (2000) population is defined “as the totality number of cases in our focus of interest
when conducting a research”. The population of respondents covered by the scope of this research work cuts across the
top management staff of the manufacturing company. The type of data used in this study is primary data. Questionnaires
were administered to sixty (60) staff members of Coca-Cola Manufacturing Company in Asejire, Oyo State. In analyzing
the data collected, descriptive statistics was used and the results were expressed in percentages. The following hypotheses
were formulated and tested:
Hypothesis One
H0: There is no significant relationship between budgetary process and profit maximization in a manufacturing company.
H1: There is significant relationship between budgetary process and profit maximization in a manufacturing company.
Impact Factor 3.582 Case Studies Journal ISSN (2305-509X) – Volume 6, Issue 12–Dec-2017
http://www.casestudiesjournal.com Page 63
Hypothesis Two
H0: Budgetary process does not improve profitability in manufacturing company
H1: Budgetary process improve profitability in manufacturing company
Frequency tables, bar charts and pie charts were also used to ensure easy understanding of the analysis. Simple linear
regression analysis will be used to analyze the hypotheses. Atoyebi, (2012) defines simple linear regression analysis as a
model in which uses the historical relationship between an independent and a dependent variable to predict the future
values of the dependent variable. The main strength of using Simple linear regression analysis is its ability to measure the
effect of one independent variable upon one dependent variable. Ordinary test square will be used to estimate the model.
F-test is used to test the model. The standard for the rejection of the null hypotheses for a determination of statistical
significance at the P < 0.05 level of probability.
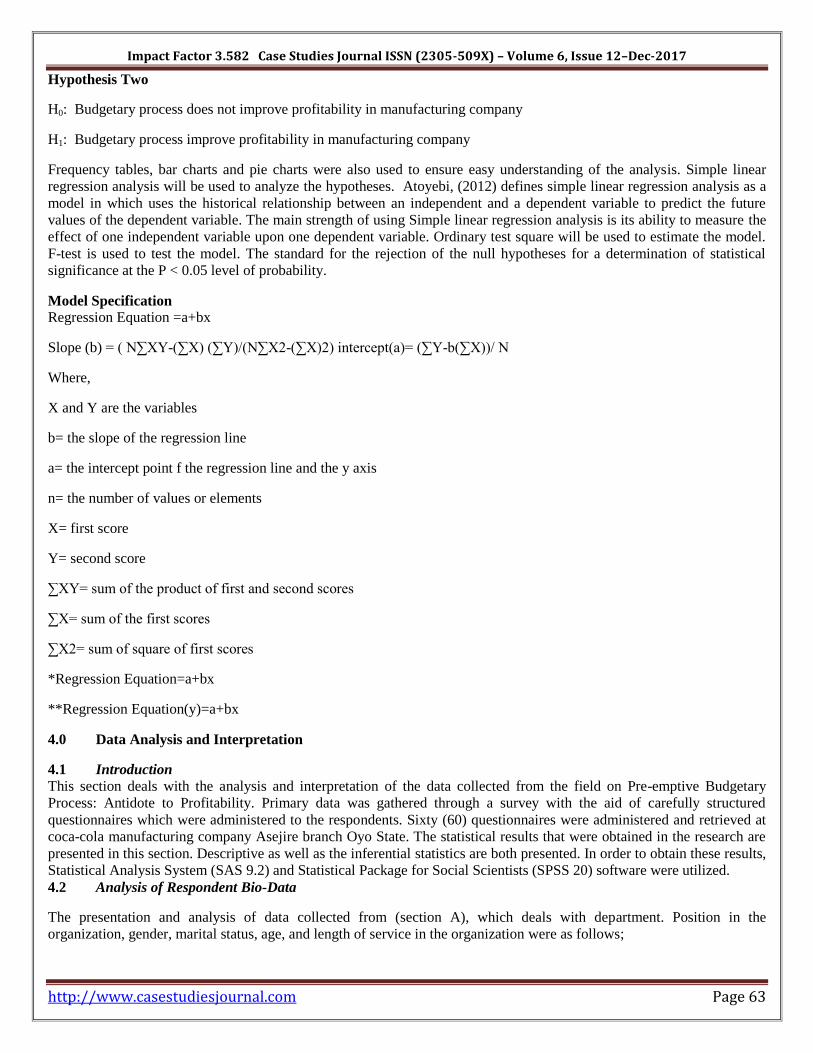
Model Specification
Regression Equation =a+bx
Slope (b) = ( N∑XY-(∑X) (∑Y)/(N∑X2-(∑X)2) intercept(a)= (∑Y-b(∑X))/ N
Where,
X and Y are the variables
b= the slope of the regression line
a= the intercept point f the regression line and the y axis
n= the number of values or elements
X= first score
Y= second score
∑XY= sum of the product of first and second scores
∑X= sum of the first scores
∑X2= sum of square of first scores
*Regression Equation=a+bx
**Regression Equation(y)=a+bx
4.0 Data Analysis and Interpretation
4.1 Introduction
This section deals with the analysis and interpretation of the data collected from the field on Pre-emptive Budgetary
Process: Antidote to Profitability. Primary data was gathered through a survey with the aid of carefully structured
questionnaires which were administered to the respondents. Sixty (60) questionnaires were administered and retrieved at
coca-cola manufacturing company Asejire branch Oyo State. The statistical results that were obtained in the research are
presented in this section. Descriptive as well as the inferential statistics are both presented. In order to obtain these results,
Statistical Analysis System (SAS 9.2) and Statistical Package for Social Scientists (SPSS 20) software were utilized.
4.2 Analysis of Respondent Bio-Data
The presentation and analysis of data collected from (section A), which deals with department. Position in the
organization, gender, marital status, age, and length of service in the organization were as follows;

Impact Factor 3.582 Case Studies Journal ISSN (2305-509X) – Volume 6, Issue 12–Dec-2017
http://www.casestudiesjournal.com Page 64
Figure 4.1: Distribution of Respondents by Gender
Gender Frequency Percent Cumulative Frequency Cumulative Percent
Male 36 60.00 36 60.00
Female 24 40.00 60 100.00
Source: Researcher’s Compilation, 2016
Table 4.1 shows the gender distribution of the respondents with the percentages of their responses. The results showed
that 36 of the respondents representing 60.00% are male while 24 of the respondents representing 40.00% are female. The
results indicate that both male and female participated in the study devoid of gender discrimination.
Table 4.2: Distribution of Respondents by Marital status
Marital status Frequency Percent Cumulative Frequency Cumulative Percent
Single 25 41.67 25 41.67
Married 29 48.33 54 90.00
Widowed 6 10.00 60 100.00
Source: Researcher’s Compilation, 2016
Table 4.2 shows the marital status of the respondents with their frequencies. The results showed that 25 of the respondents
representing 41.67% are single, 29 of the respondents representing 48.33% are married while 6 of the respondents
representing 10.00% are widowed. This indicated that majority of the respondents are married.
Table 4.3: Distribution of Respondents by Department
Department Frequency Percent Cumulative Frequency Cumulative Percent
Account 21 35.00 21 35.00
Production 13 21.67 34 56.67
Sales and Marketing 19 31.67 53 88.33
Administration 7 11.67 60 100.00
Source: Researcher’s Compilation, 2016
Table 4.3 indicates the various frequencies of the respondents on the basis of Departments in selected organization. The
table showed that 21 respondents representing 35% work in the Account Department, 13 respondents representing 21.67%
work in the Production Department, 19 of the respondents representing 31.67% work in the Sales and Marketing
Department while 7 of the respondents representing 11.67% work in the Administration Department. Therefore, majority
of the respondents work in the Account Department.
Table 4.4: What is your Position in the organization?
Position Frequency Percent Cumulative Frequency Cumulative Percent
Top level 11 18.33 11 18.33
Middle level 21 35.00 32 53.33
Low level 28 46.67 60 100.00
Source: Researcher’s Compilation, 2016
Table 4.4 shows the position held by the respondents with their frequencies. The results indicates that 11 of the
respondents representing 18.33% are top level managers, 21 of the respondents representing 35.00% are middle level

Impact Factor 3.582 Case Studies Journal ISSN (2305-509X) – Volume 6, Issue 12–Dec-2017
http://www.casestudiesjournal.com Page 65
managers while 28 of the respondents representing 46.67% are low level managers. Therefore, majority of the respondents
are low level managers.
Table 4.5: Distribution of Respondents by Length of services
Length of services Frequency Percent Cumulative Frequency Cumulative Percent
Less than 1 year 8 13.33 8 13.33
1 to 2 years 19 31.67 27 45.00
Above 4 years 33 55.00 60 100.00
Source: Researcher’s Compilation, 2016
Table 4.5 indicates that 8 of the respondents representing 13.33% have spent less than 1 year in the company, 19 of the
respondents representing 31.67% have spent between 1 and 2 years in the company, while 33 of the respondents
representing 55.00% have spent above 4 years with the company. Therefore, majority of the respondents have spent more
than 4 years in the company.
4.3 Analysis of Data Related to Pre-Emptive Budgetary Process: Antidote to Profitability
Table 4.6: Budgetary process in organization leads to profitability.
Frequency Valid Percent Cumulative Percent
Strongly Agree 11 18.3 18.3
Agree 34 56.7 75.0
Undecided 2 3.3 78.3
Disagreed 9 15.0 93.3
Strongly Disagree 4 6.7 100.0
Total 60 100.0
Source: Researcher’s Compilation, 2016
Table 4.6 shows that 75.0% of the respondents agreed that budgetary process in organization leads to profitability, while
21.7% of the respondents disagreed. 3.3% were undecided. It could be inferred that budgetary process in organization
leads to profitability. Table 4.7: Budgetary analysis contributed to the performance of profitability.
Frequency Percent Cumulative Percent
Strongly Agree 22 36.7 36.7
Agree 25 41.6 78.3
Disagreed 9 15.0 93.3
Strongly Disagree 4 6.7 100.0
Total 60 100.0
Source: Researcher’s Compilation, 2016

Impact Factor 3.582 Case Studies Journal ISSN (2305-509X) – Volume 6, Issue 12–Dec-2017
http://www.casestudiesjournal.com Page 66
Table 4.7 shows that 78.3% of the respondents agreed that budgetary analysis contributed to the performance of
profitability, while 21.7% of the respondents disagreed. It could be inferred that budgetary analysis contributed to the
performance of profitability. Table 4.8: Budgetary process has helped to increase your sales compared to previous years.
Frequency Percent Cumulative Percent
Strongly Agree 20 33.3 33.3
Agree 27 45.0 78.3
Undecided 5 8.3 86.7
Disagreed 5 8.3 95.0
Strongly Disagree 3 5.0 100.0
Total 60 100.0
Source: Researcher’s Compilation, 2016
Table 4.8 shows that 78.3% of the respondents agreed that budgetary process has helped to increase your sales compared
to previous years, while 13.3% of the respondents disagreed. (8.3%) were undecided. It could be inferred that budgetary
process has helped to increase your sales compared to previous years.
Table 4.9: Has your current expenditure compared to previous year reduced.
Frequency Percent Cumulative Percent
Strongly Agree 29 48.3 48.3
Agree 27 45.0 93.3
Disagreed 4 6.7 100.0
Total 60 100.0
Source: Researcher’s Compilation, 2016
Table 4.9 shows that 93.3% of the respondents agreed that their current expenditure had reduced compared to their
previous year, while 6.7% of the respondents disagreed. It could be inferred that their current expenditure had reduced
compared to their previous year. Table 4.10: Your sales and expenditure are according to the budget or target.
Frequency Percent Cumulative Percent
Strongly Agree 35 58.3 58.3
Agree 25 41.7 100.0
Total 60 100.0
Source: Researcher’s Compilation, 2016
Table 4.10 shows that all the respondents agreed that sales and expenditure are according to the budget or target. It could
be inferred that sales and expenditure are according to the budget or target.

Impact Factor 3.582 Case Studies Journal ISSN (2305-509X) – Volume 6, Issue 12–Dec-2017
http://www.casestudiesjournal.com Page 67
Table 4.11: Budgetary process contributes positively to profitability of your company.
Frequency Percent Cumulative Percent
Strongly Agree 9 15.0 15.0
Agree 28 46.7 61.7
Undecided 10 16.7 78.3
Disagreed 9 15.0 93.3
Strongly Disagree 4 6.7 100.0
Total 60 100.0
Source: Researcher’s Compilation, 2016
Table 4.11 shows that 61.7% of the respondents agreed that budgetary process contributes positively to profitability of
your company, while 21.7% of the respondents disagreed. 16.7% were undecided. It could be inferred that budgetary
process contributes positively to profitability of your company. Table 4.12: Budgets motivate managers to achieve objectives and establish profitability within your company.
Frequency Percent Cumulative Percent
Strongly Agree 14 23.3 23.3
Agree 31 51.7 75.0
Undecided 7 11.7 86.7
Disagreed 5 8.3 95.0
Strongly Disagree 3 5.0 100.0
Total 60 100.0
Source: Researcher’s Compilation, 2016
Table 4.12 shows that 75.0% of the respondents agreed that budgets motivate managers to achieve objectives and
establish profitability within your company, while 11.7% of the respondents disagreed, 13.3% were undecided. It could be
inferred that budgets motivate managers to achieve objectives and establish profitability within your company. Table 4.13 Management contributes in disturbing accounting before carrying out their budgetary planning.
Frequency Percent Cumulative Percent
Strongly Agree 18 30.0 30.0
Agree 29 48.3 78.3
Undecided 3 5.0 83.3
Disagreed 6 10.0 93.3
Strongly Disagree 4 6.7 100.0
Total 60 100.0
Source: Researcher’s Compilation, 2016

Impact Factor 3.582 Case Studies Journal ISSN (2305-509X) – Volume 6, Issue 12–Dec-2017
http://www.casestudiesjournal.com Page 68
Table 4.13 shows that 78.3% of the respondents agreed that management contributes in disturbing accounting before
carrying out their budgetary planning, while 16.7% of the respondents’ disagreed, 5.0% were undecided. It could be
inferred that management contributes in disturbing accounting before carrying out their budgetary planning.
4.4 Testing of Hypotheses.
Two research hypotheses were formulated to enable the researcher subject some important aspects of the data to statistical
verifications. Research hypotheses are statements or assumption about a population parameter and such a statement
should be subjected to a test. Research hypotheses are based on researcher(s) experience and previous knowledge of the
subject being investigated, these ideas are believed to be true, but the result of the researcher(s) may prove to be
otherwise. As a result of this, the need arises for research hypotheses to be tested.
Hypothesis One:
H0: There is no significant relationship between budgetary process and profit maximization in a manufacturing company.
H1: There is significant relationship between budgetary process and profit maximization in a manufacturing
company.
Table 4.14: Parameter Estimates Model Summaryb
Varia
ble Label
Parame
ter
Estimat
e
Standar
d
Error t Value
Interc
ept
Intercept 0.46465 0.27066 1.72 R-Square 0.6909
Budgetary process 2.01010 0.17656 11.39 Adj R-
Square
0.6855
a. Predictors: (Constant), Budgetary process.
b. Dependent Variable: Tool for profit maximization.
Table 4.14 shows the relationship between budgetary process and profit maximization in a manufacturing company, it
shows that budgetary process accounted for 69.09 percent while the remaining 30.91 percent is explained by other
exogenous variables that are excluded in the model. The adjusted R2 of 0.6855 means the explanatory power of the
independent variables is considerably high. The statistical relationship between tool for profit maximization and budgetary
process is presented thus: Tool for profit maximization = 0.46465 + 2.01010 Budgetary process. This regression equation
shows the importance of budgetary process as tool for profit maximization in manufacturing company. Evidently, there is
a relationship between budgetary process and profit maximization in a manufacturing.
Table 4.15: Summary of Regression Analysis of budgetary process on tool for profit maximization a
Source DF Sum of Squares Mean Square F Value Pr > F
Model 1 60.00152 60.00152 129.62 <.0001
Error 58 26.84848 0.46290
Corrected Total 59 86.85000
a. Dependent Variable: Tool for profit maximization.
b. Predictors: (Constant), Budgetary process.
Decision Rule We reject the null hypothesis if the value of F calculated is greater than the value of F tabulated (F cal>F tab), otherwise
accept it. At 95% level of significance (α = 0.05), the F tabulated is given as: F 0.05, (1, 59) = 4.00.
Decision

Impact Factor 3.582 Case Studies Journal ISSN (2305-509X) – Volume 6, Issue 12–Dec-2017
http://www.casestudiesjournal.com Page 69
Since F calculated = 129.62> F tabulated = 4.00. We reject the null hypothesis. In conclusion, the results of the regression
confirm with 95% confidence that there is a relationship between budgetary process and profit maximization in a
manufacturing company.
Hypothesis Two
H0: Budgetary process does not improve profitability in manufacturing company.
H1: Budgetary process improves profitability in manufacturing company.
Table 4.16: Parameter Estimates Model Summaryb
Varia
ble Label
Parame
ter
Estimat
e
Standar
d
Error t Value
Interc
ept
Intercept 0.43750 0.14625 2.99 R-Square 0.5805
Budgetary process 0.81250 0.09070 8.96 Adj R-
Square
0.5732
a. Predictors: (Constant), Budgetary process.
b. Dependent Variable: Profitability in manufacturing company.
Table 4.16 reveals the how budgetary process has improved profitability in manufacturing company, it shows that
budgetary process accounted for 58.05 percent while the remaining 41.95 percent is explained by other exogenous
variables that are excluded in the model. The adjusted R2 of 0.5732 means the explanatory power of the independent
variables is considerably high. The statistical relationship between profitability in manufacturing company and budgetary
process is presented thus: Profitability in manufacturing company = 0.43750 + 0.81250 Budgetary process
This regression equation shows the degree of improvement on profitability in manufacturing company by their budgetary
process. Evidently, budgetary process improves profitability in manufacturing company.
Table 4.17: Summary of Regression Analysis of budgetary process on profitability in manufacturing
company a
Source DF Sum of Squares Mean Square F Value Pr > F
Model 1 9.85833 9.85833 80.25 <.0001
Error 58 7.12500 0.12284
Corrected Total 59 16.98333
a. Dependent Variable: Profitability in manufacturing company.
b. Predictors: (Constant), Budgetary process.
Decision Rule We reject the null hypothesis if the value of F calculated is greater than the value of F tabulated (F cal>F tab), otherwise
accept it. At 95% level of significance (α = 0.05), the F tabulated is given as: F 0.05, (1, 59) = 4.00.
Decision
Since F calculated = 80.25> F tabulated = 4.00. We reject the null hypothesis. In conclusion, the results of the regression
confirm with 95% confidence that budgetary process improve profitability in manufacturing company.
5.0 Conclusion and Recommendations
This study has been carried out to examine pre-emptive budgetary process: antidote for profitability using Coca-Cola
Bottling Company Asejire branch, Ibadan. The research has shown that there is a relationship between budgetary process

Impact Factor 3.582 Case Studies Journal ISSN (2305-509X) – Volume 6, Issue 12–Dec-2017
http://www.casestudiesjournal.com Page 70
and profit maximization in a manufacturing company. Therefore, to stay visible and remain in business, the growth,
survival and profitability of the organization can be traced to budgetary process.
Also as it could be seen in the study, a well designed and structured budgetary process is important before any company
could be successful and remain competitive in the market. However, the nature of the company must be put into
consideration before choosing a suitable and appropriate budgetary process.
Conclusively, organization should be able to execute an effective budgetary process which will serve to create and
increase organization profitability, boost the image of the organization as well as stimulate the consumer into patronage.
Based on the findings, the study therefore recommends the following:
1. The organization should work on making their budgetary process to be flexible enough to encompass and
facilitate contingent project that are crucial to the organization.
2. The organization should Endeavour to let it budgetary process cover a wide range of departmental product
development so that the organization will remain flexible and competitive.
3. It is important also that the company should put up an effective and efficient budgetary process that will facilitate
openness and good employee perception to the organization.
4. Finally, Durability, functionality and accessibility are another variable that organization must make sure they
work on if they want their product to be leading in the market and exist in the mind of the consumer.
References
i. Abdullah, F. J. (1998). Budget Related Behavior and Performance Goals of Cost Centre Managers in a
public Institute of Higher Learning in Malaysia. Master of Accounting Curtin University of Technology.
ii. Adams, C., Neely, A., & Bourne, M. (2003). Better budgeting or beyond budgeting? Measuring Business
Excellence, (Vol 7 (3). iii. Adedayo, O. A. (2000). Understanding Statistics, Akoka, Lagos, Nigeria: JAS publishers.
iv. Adu-Gyamfi, O. (2008), Public Sector Financial Management, Accounting and Auditing in Ghana.
Pages 139-161.
v. Alberta, Canada, performance measures, 6–7, 23, 34.
vi. Bogt, H. J. (2004). Politicians in Search of Performance Information? Survey Research on Dutch
Aldermen‘s Use of Performance Information.‖ Financial Accountability and Management, 20/3: 221–
252.
vii. Bruns, W. J. & Waterhouse, J. H. (1975). Budgetary control and organizational structure, Journal of
Accounting Research, vol. 33: 101-129.
viii. Drury, C. (2006). Cost and Management Accounting (6th ed). London: Thomson Learning.
ix. Hope, J. & Fraser, R. (2003). Beyond Budgeting – how managers can break free from the annual
performance trap. The United States of America: Harvard Business
x. Institute of Municipal Treasurers and Accountants. (1971). Programme Budgeting: Some Practical
Problems of Implementation. London: IMTA
xi. Jones, R. & Pendlebury, M. (1984). Public Sector Accounting. London: Pitman.
xii. Kamukamu N. A. (2006). Cost na management Accounting ,1st Edition.
xiii. Kaplan, R. S. & Norton, D. P (1996). Using the Balanced Scorecard as a Strategic Management
System", Harvard Business Review, Jan/Feb Ed.
xiv. Lucey, T. (2003) "Management Accounting" 4th ed. London Ledts Educational Aldine House Publishers.
Impact Factor 3.582 Case Studies Journal ISSN (2305-509X) – Volume 6, Issue 12–Dec-2017
http://www.casestudiesjournal.com Page 71
xv. Merchant, K .A. (1981). “The Design of the Corporate Budgeting System: Influences on Managerial
Behavior and Performance”, the Accounting Review, Vol. 56, No. 4, pp. 813-829.
xvi. Merchant, K. A., Van der Stede, W. A., & Zheng, L. (2003). Disciplinary Constraints on the
Advancement of Knowledge: the Case of Organizational Incentive Systems', Accounting, Organizations
and Society, Vol. 28, No. 2-3, pp. 251-286.
xvii. Oduro, J. (2006). Public Sector Accounting, pp 126-148.
xviii. Omolehinwa, E. (1989). PPBS in Nigeria: Its origin, progress and problems. Public Administration and
Development, Public Budgeting & Finance, 9(2), pp. 43–65.
xix. Williamson, D. (1996), Accounting Prentice Hall.