inclusion removal by bubble flotation in continuous
TRANSCRIPT
Inclusion Removal by Bubble Flotation in Continuous Casting Mold
Lifeng Zhang, Jun Aoki, Brian G. Thomas
University of Illinois at Urbana-Champaign, 1206 W. Green St., Urbana, IL 61801, USA Phone number: 1-217-244-4656, Fax number: 1-217-244-6534
Email: [email protected], Email: [email protected]
Keywords: Inclusion Removal, Bubble Flotation, Continuous Casting Mold, Attachment Probability
Abstract
Fundamentally-based computational models are developed to quantify the removal of inclusions by bubbles during the continuous casting of steel. First, the attachment probability of inclusions on a bubble surface is investigated based on fundamental fluid flow simulations, incorporating the turbulent inclusion trajectory and sliding time of each individual inclusion along the bubble surface as a function of particle and bubble size. Then, the turbulent fluid flow in a typical continuous casting mold, trajectories of bubbles and their path length in the mold are calculated. The change in inclusion distribution due to removal by bubble transport in the mold is calculated based on the computed attachment probability of inclusion on each bubble and the computed path length of the bubbles. In addition to quantifying inclusion removal for many different cases, the results are important to estimate the significance of different inclusion removal mechanisms. This work is part of a comprehensive effort to optimize steelmaking and casting operations to lower defects.
Introduction The ever-increasing demands for high quality have made the steelmaker increasingly aware of product “cleanliness” requirements. Non-metallic inclusions can lead to excessive casting repairs or rejected castings. Many methods have been developed to remove inclusions from molten steel. Gas injection is commonly applied to many secondary metallurgical processes such as ladle treatment, the RH degassing vessel, and the Submerged Entry Nozzle (SEN) during the continuous casting (CC) process. Although it is well-known that gas injection helps to remove inclusions, the mechanisms and removal rates have not been quantified. This work presents fundamental models to quantify the removal of inclusions by bubbles in steel refining processes and applies them to the continuous casting mold for typical conditions. After reviewing previous work on three relevant topics, the models and corresponding results are presented in three sections: 1) fundamental inclusion - bubble interactions, 2) bubble trajectories and 3) inclusion removal.
Defects Related to Inclusions and Bubbles in Steel
The development of gas injection processes focuses on achieving two conditions: fine bubbles and good mixing. During steel secondary refining, fine bubbles provide large gas/liquid interfacial area and high attachment probability of inclusions to bubbles, and good mixing enhances the efficiency of the transfer of the alloy elements. Bubbles injected into the SEN and CC mold have five effects related to steel quality control:
- Helping to reduce nozzle clogging; - Helping to influence and control the flow pattern in the mold; - Generating top surface level fluctuations and even emulsification if the gas flow rate is too large; - Capturing inclusions moving within the molten steel, and removing them into the top slag.[1-4] - Entrapping inclusions into the solidified shell, eventually leading to line defects such as surface slivers, blisters,
pencil pipes or internal defects in the product.[1, 2, 5-7]
Aided by surface tension effects, solid inclusions agglomerate on surfaces such as bubbles, as shown in Figure 1 [8, 9]. Line defects appear on the surface of finished strip products, with several tens of micrometers to millimeter width and as long as 0.1-1 meter [10]. This surface defect is believed to result from nonmetallic inclusions caught near the surface of the slab (<15mm from the surface). This defect is also called slivers, or called pencil pipe if coupled with elongated bubbles. A serious pencil pipe defect called pencil blisters on the finished product [10] is a tubular shape surface defect, with a smooth slightly raised surface, typically ~1mm wide and 150-300mm long [10, 11] (Figure 2[10]).
The process of inclusion removal by gas bubbles is influenced by many factors including the turbulent fluid flow of the molten steel, the shape and size of both the bubbles and the inclusions, surface tension effects, and bubble removal rates,
MS&T 2004 Conference Proceedings, (New Orleans, LA), AIST, Warrendale, PA ,161

which are affected by slag properties. W.Pan et al studied the removal of particles (100~800µm in size) by bubble flotation in a water model by analyzing high speed camera photos. [12] Zhang and Taniguchi studied inclusion removal by bubble flotation in a water model under turbulent conditions by measuring the particle number density with a Coulter Counter .[13]
Several papers studies the contribution of turbulence to the attachment of inclusions to bubbles in terms of turbulent energy dissipation rate in the water system. Schubert [14] reported that the attachment probability P is related to the bubble size (dB),
particle size (dp), and turbulent energy dissipation rate (ε) by ( ) ( )[ ] 2/1297B2
297P1
94 dCdCP +∝ ε , which can only be used under the condition of ( ) 41315 , εν≥Bp dd . For metallurgical melts, the typical value of the energy dissipation rateε is
0.0001-1m2/s3, so this equation can be used only if dp,dB≥458µm. Zhang et al [13] derived the attachment probability to be ( ) 630.1104.065.2
p gB QddP ε∝ , where Qg is the gas flow rate. Focusing on inclusion removal by bubble flotation in liquid metal systems, Zhang discussed the fundamentals of inclusion removal by bubble flotation in the molten steel under laminar flow conditions and tentatively discussed the effect of turbulence; [4] A.G.Szekely investigated the removal of solid particles from the molten aluminum during the spinning nozzle flotation process; [15] K.Okumura et al studied the removal rate of SiO2 inclusions from the molten Cu to the slag under gas injection stirring conditions; [16] Y.Miki et al investigated inclusion removal during steel RH degassing considering bubble flotation as one of the inclusion removal methods [17] .
Fig.1 Inclusions around bubble shape domain in the ingot steel (a,b,c) [8] and in the continuous casting steel [9]
Fig.2 Inclusion sliver in the longitudinal section of a sheet product [9], and typical pencil blister defect on a steel sheet [10].
Bubble Size in Molten Steel
Gas can be injected into the molten steel by various devices, such as tuyeres, lances, and porous refractory plugs. Large bubbles can breakup according to the local turbulence levels. The size of the largest surviving bubbles can be estimated by the force balance imposed on the bubble. [4] The average equivalent size of bubbles to survive in secondary steel refining processes is 10-20mm [4, 18] and ~5mm in the CC mold. Bubble shape changes with its size. Wellek et al [19] investigated the shape of bubbles in, and got the following empirical relationship,
757.0163.01 Eoe += , (1) where e is the aspect ratio of the bubble and Eo is the Eötvös number, which represents the ratio between the buoyancy force and the surface tension force by
( )σ
ρρ gBgdEo
−=
2
, (2)
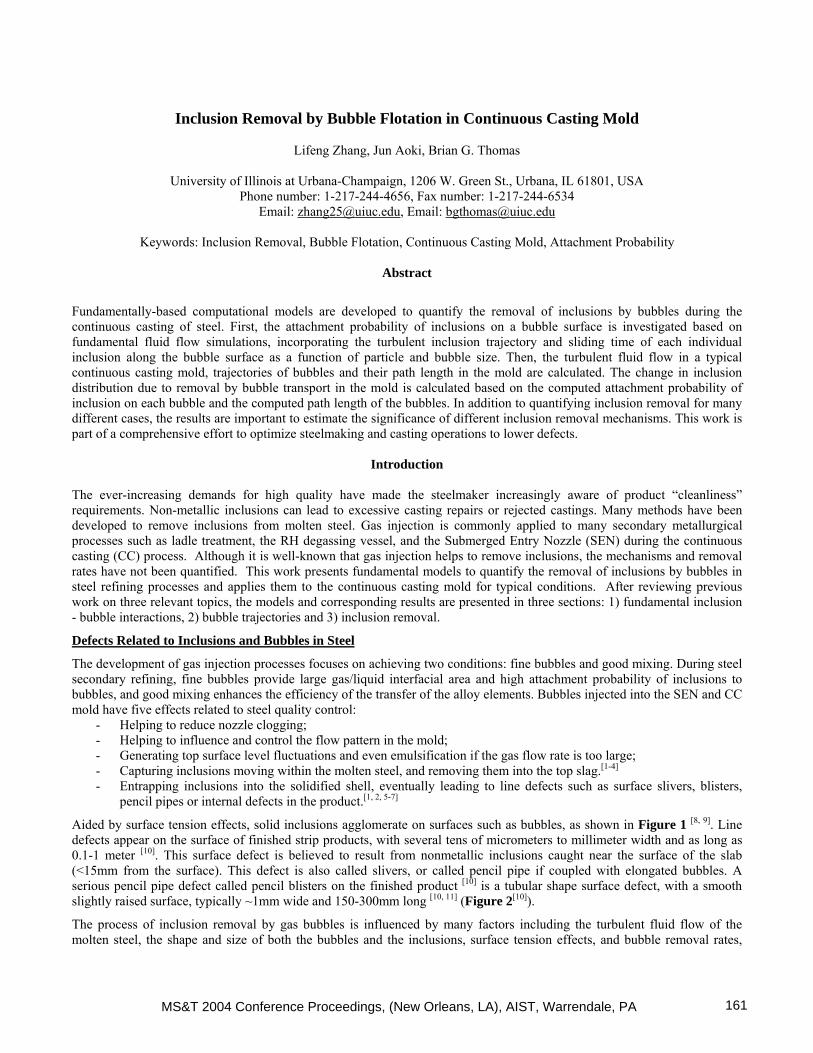
where g is the gravitational acceleration, dB is bubble diameter, ρ and ρg are densities of the molten steel and the argon gas respectively, and σ is the surface tension of the molten steel. Figure 3 shows the aspect ratio e of bubbles in molten steel, indicating that <3mm bubbles are spherical, 3-10mm bubbles are spheroidal, and >10mm bubble are spherical-cap shaped. Most bubbles in steel refining are spherical-cap shaped. [20-22]
The shape of the bubble also depends on the ratio of the turbulent pressure fluctuation to the capillary pressure, which is related to the Weber number. If the bubble Weber number exceeds a critical value, the bubble will breakup. Furthermore, it
MS&T 2004 Conference Proceedings, (New Orleans, LA), AIST, Warrendale, PA162
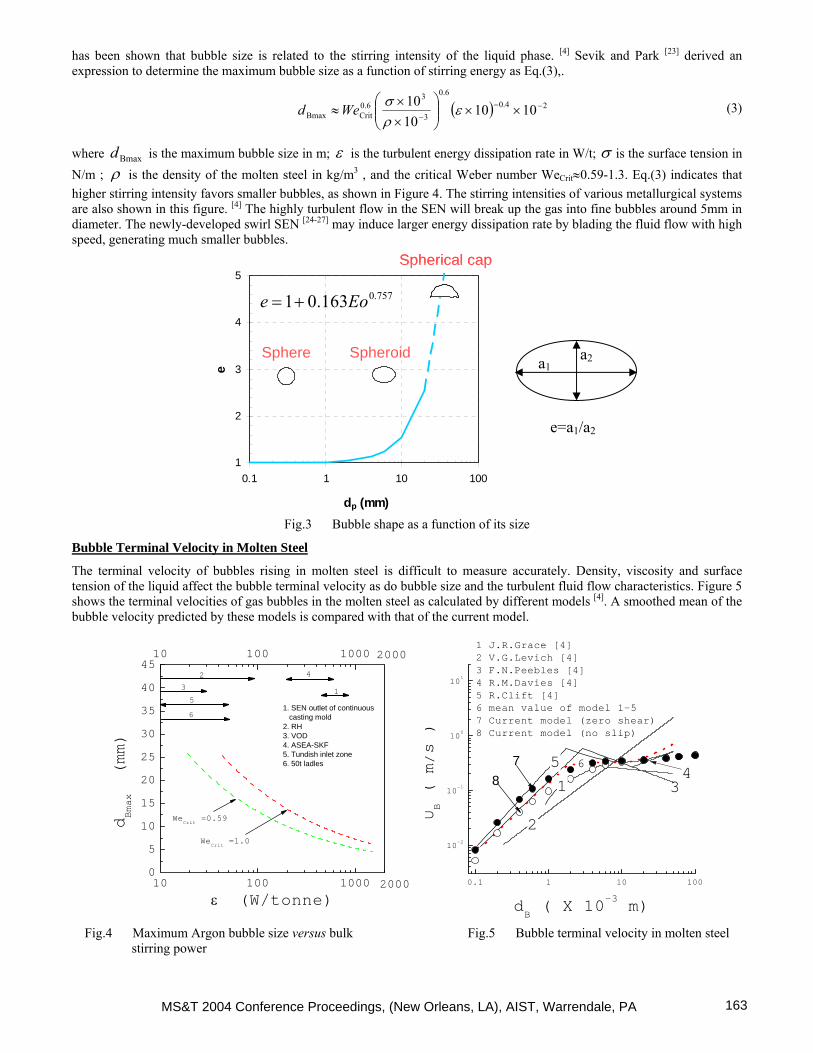
has been shown that bubble size is related to the stirring intensity of the liquid phase. [4] Sevik and Park [23] derived an expression to determine the maximum bubble size as a function of stirring energy as Eq.(3),.
( ) 24.06.0
3
30.6CritBmax 1010
1010 −−
−××⎟⎟
⎠
⎞⎜⎜⎝
⎛××
≈ ερσWed (3)
where Bmaxd is the maximum bubble size in m; ε is the turbulent energy dissipation rate in W/t; σ is the surface tension in N/m ; ρ is the density of the molten steel in kg/m3 , and the critical Weber number WeCrit≈0.59-1.3. Eq.(3) indicates that higher stirring intensity favors smaller bubbles, as shown in Figure 4. The stirring intensities of various metallurgical systems are also shown in this figure. [4] The highly turbulent flow in the SEN will break up the gas into fine bubbles around 5mm in diameter. The newly-developed swirl SEN [24-27] may induce larger energy dissipation rate by blading the fluid flow with high speed, generating much smaller bubbles.
1
2
3
4
5
0.1 1 10 100
dp (mm)
e
757.0163.01 Eoe +=
Spherical cap
Sphere Spheroid
1
2
3
4
5
0.1 1 10 100
dp (mm)
e
757.0163.01 Eoe +=
Spherical cap
Sphere Spheroid
Fig.3 Bubble shape as a function of its size
Bubble Terminal Velocity in Molten Steel
The terminal velocity of bubbles rising in molten steel is difficult to measure accurately. Density, viscosity and surface tension of the liquid affect the bubble terminal velocity as do bubble size and the turbulent fluid flow characteristics. Figure 5 shows the terminal velocities of gas bubbles in the molten steel as calculated by different models [4]. A smoothed mean of the bubble velocity predicted by these models is compared with that of the current model.
10 100 10000
5
10
15
20
25
30
35
40
4510 100 1000
6
2000
15
4
3
2
2000
1. SEN outlet of continuous casting mold2. RH3. VOD4. ASEA-SKF5. Tundish inlet zone6. 50t ladles
WeCrit
=1.0
WeCrit
=0.59dBmax (mm)
ε (W/tonne)0.1 1 10 100
10-2
10-1
100
101
8
1 J.R.Grace [4]2 V.G.Levich [4]3 F.N.Peebles [4]4 R.M.Davies [4]5 R.Clift [4]6 mean value of model 1-57 Current model (zero shear)8 Current model (no slip)
64
3
5
2
1
UB ( m/s )
dB ( X 10-3 m)
7
Fig.4 Maximum Argon bubble size versus bulk Fig.5 Bubble terminal velocity in molten steel
stirring power
a1 a2
e=a1/a2
MS&T 2004 Conference Proceedings, (New Orleans, LA), AIST, Warrendale, PA 163
In this work, the terminal velocity of a bubble can be calculated from a force balance between the buoyancy force (FB) and the drag force (FD) acting on the bubble. The buoyancy force is expressed by
( )gB
BdF ρρπ
−=6
3
(4)
and the drag force FD is calculated using FLUENT by integrating the surface force on the bubble.
dAxu
xu
pdAFS j
i
i
jij
SijD ∫
⎥⎥⎦
⎤
⎢⎢⎣
⎡⎟⎟⎠
⎞⎜⎜⎝
⎛
∂∂
+∂
∂+−=∫= µδτ (5)
where τij is the shear force on the bubble surface, p is the pressure, µ is the viscosity of the molten steel, ui and uj are the velocity components of the fluid flow, xi and xj are the coordinates, and δij is the Kronecker delta, which equals zero if i=j, else equals unit.
The drag force depends on the size, velocity, and surface boundary condition of the bubble, while the buoyancy force only depends on the bubble size. By applying FB=FD, for a given size bubble and surface condition, the terminal velocity of the bubble can be obtained, also shown in Fig.5. For a free bubble, the zero shear condition is more appropriate than the no slip BC. The alternative surface boundary condition, no slip, is more appropriate for bubbles with rigid surfaces, such as caused by surface-active elements or covering the surface with particles. Fig.5 shows that the calculated terminal velocity for free bubbles (zero shear surface condition) agrees well with the mean of other models. A peak occurs at a bubble diameter of 3 mm exists, where the bubble shape changes from spherical to ellipsoidal. Elipsoidal bubbles (3-10 mm) have similar velocity. For bubbles larger than 10mm, terminal velocity increases rapidly with increasing size due to their spherical cap shape.
Inclusion - Bubble Interactions in Molten Steel
Model Formulation
The attachment process of an inclusion to a gas bubble in the molten steel proceeds through the following steps: the inclusion approaches the gas bubble, and collides if it gets close enough. If the thin film of liquid between the particle and the bubble decreases to less than a critical thickness, it will suddenly rupture causing the inclusion to attach permanently to the surface of the bubble during the collision. Otherwise, if it slides along the surface of the bubble for a long enough time, the thin film can drain away and rupture , again leading to inclusion attachment. Otherwise, the inclusion will move away and detach from the bubble.
The collision time, tc, starts with the deformation of the bubble by the inclusion and finishes at the instant of restoration of the bubble to its original size. The film drainage time, tF, is the time required for the drainage of the liquid film between the bubble and the inclusion until a critical film thickness is reached and rupture occurs. The interaction time between the bubble and the inclusion, tI, includes the time while the inclusion collides with the bubble (collision time) and possibly slides across its surface (sliding time). In this work, tI is calculated from the inclusion centerline trajectory results by tracking the time that elapses while the distance from the inclusion center to the surface of the bubble is less than the inclusion radius. Then, if tI >tF, the inclusion will be attached to the surface of the bubble.
Ye and Miller [28] give the collision time as Eq.(6) 21
p3p
C 12 ⎟⎟⎠
⎞⎜⎜⎝
⎛=
σρd
t . (6)
where ρP is inclusion density (kg/m3). The collision time depends mainly on the inclusion size, and is independent of the bubble size.
H.J.Schulze [29] derived the rupture time of the film formed between a solid particle and a gas bubble,
3P2
Cr
2
F 643 d
hkt
σαµ= (7)
where k =4. α is the angle (in rad) for the transition of the spherically deformed part of the bubble surface to the non-spherically deformed part, given by Eq(8) [4]
⎟⎟
⎠
⎞
⎜⎜
⎝
⎛
⎟⎟⎠
⎞⎜⎜⎝
⎛−=
212Bpp
1202.11arccos
σρπ
αud
(8)
MS&T 2004 Conference Proceedings, (New Orleans, LA), AIST, Warrendale, PA164
where Crh is the critical thickness of liquid film for film rupture, given by [4]
( )[ ] 16.08Cr cos110001033.2 θσ −×= −h (9)
where θ is the contact angle of the inclusions.
In order to calculate the interaction time and the attachment probability of inclusions to the bubble surface, a computational simulation of turbulent flow around an individual bubble and a simulation of inclusion transport through the flow field are required. First, the steady turbulent fluid flow of molten steel around an argon bubble is calculated by solving the continuity equation, Navier-Stokes equations, and turbulent energy and its dissipation rate equations in two dimensions, assuming axisymmetry. Possible deformation of the bubble shape by the flow and inclusion motion is ignored. The inlet velocity and far-field velocity condition are set to of the bubble terminal velocity, assuming a suitable turbulent energy and dissipation rate, and a far field pressure outlet. The trajectory of each particle is then calculated by integrating the following particle velocity equation, which considers the balance between drag and buoyancy forces.
( ) ( )i
P
pipiD
pp
pi guuCddt
duρ
ρρρρ −
−−= 2143
(10)
where up,i, is the particle velocity, m/s; and CD, is the drag coefficient given below as a function of particle Reynolds number (Rep),
( )653.0Re186.01Re24
pp
DC += . (11)
To incorporate the “stochastic” effect of turbulent fluctuations on the particle motion, this work uses the “random walk” model in FLUENT. [30] In this model, particle velocity fluctuations are based on a Gaussian-distributed random number, chosen according to the local turbulent kinetic energy. The random number is changed, thus producing a new instantaneous velocity fluctuation, at a frequency equal to the characteristic lifetime of the eddy. The instantaneous fluid velocity is given by
uuu ′+= , (12)
322 kuu ξξ =′=′ (13)
where u is the instantaneous fluid velocity, m/s; u is the mean fluid phase velocity, m/s; u′ is random velocity fluctuation, m/s; ξ is the random number, and k is the local level of turbulent kinetic energy in m2/s3.
As boundary conditions, inclusions reflect if they touch the surface of the bubble. Several thousand inclusions are uniformly injected into the domain in the column with diameter dB+2dp for non-stochastic model and far larger column than dB+2dp for stochastic model. The inclusions are injected with the local velocity at the place of the 15-20 times of the bubble diameter far from the bubble center. If it is assumed that there is no detachment after inclusions are attached to the surface of the bubble, the attachment probability can be obtained by the following steps. If the normal distance of the inclusion center to the surface of the bubble is first less than the inclusion radius, the collision between the inclusion and the bubble takes place. And if this distance keeps less than the inclusion radius for some time, then it is the sliding time. Inclusions will be attached to the surface of the bubble according to the criterion discussed before.
The attachment probability without considering the stochastic effect can be defined as follows: 2
o
2 ⎟⎟⎠
⎞⎜⎜⎝
⎛
+==
pB
o
T ddd
NNP , (14)
where No is the number of inclusions attaching to the bubble by satisfying either tI>tF, and NT is the number of inclusions injected into the bubble column with diameter dB+2dP. Without the stochastic effect, only particles starting within a critical distance from the bubble axis dos will be entrapped, as shown in Figure 6a.
If the stochastic effect is taken into account, some inclusions inside the column of dOS may not collide with the bubble due to its random walk. On the other hand other inclusions even far outside the column dB+2dp may collide and attach onto the bubble surface. Thus, many inclusions must be injected in a large column in order to compute this accurately. Then the attached probability, as shown in Figure 6b, can be obtained by
MS&T 2004 Conference Proceedings, (New Orleans, LA), AIST, Warrendale, PA 165

( )( )( )
( )( ) ∑
⎥⎥⎦
⎤
⎢⎢⎣
⎡ ∆⋅≈
+
∑⎥⎥⎦
⎤
⎢⎢⎣
⎡∆+∆⋅
≈+
∑⎥⎥⎦
⎤
⎢⎢⎣
⎡−∆+
=∑
=+ i B
ii
it
io
pB
iiii
iT
io
pB
iii
iT
io
PB
iii
dRR
NN
dd
RRRNN
dd
RRRNN
A
APP 2
,
,2
2
,
,
2
22
,
,
2
82
24
42π
ππ, (15)
where No is the number of inclusions attaching to the bubble by satisfying either tI>tF, AB+2P is the section area of the column with diameter of dB+2dP. NTi is the total number of inclusions injected through the area Ai, and i is the sequence number of the annular position at which the inclusions are injected.
In the current investigation, the following parameters are used: ρ=7020 kg/m3, ρP=2800 kg/m3, ρg=1.6228kg/m3, σ=1.40 N/m, θ=112o, µ=0.0067 kg/m-s, dp=1-100µm, and dB=1-10mm. These parameters represent typical spherical solid inclusions such as silica or alumina in molten steel.
(a) Non-Stochastic (b) Stochastic
Fig.6 Schematic of the attachment probability of inclusions to the bubble surface.
Results: Fluid Flow and Inclusion Motion Around a Bubble
Figure 7 shows the fluid flow pattern behind a rigid sphere (1.5mm in diameter) in water. The simulation agrees well with the measurement. There is a recirculation region or swirl behind the solid particle. This swirl is not observed in fluid flow around a free bubble, as shown in Figure 8. Figure 8 shows the fluid flow pattern and trajectories of 100µm inclusions around a 5mm bubble in molten steel. The tracer particles (7020 kg/m3 density) follow the stream lines and tend to touch the surface of the bubble at the top point (exactly half-way around the bubble). Particles with density smaller than that of the liquid (such as inclusions in the molten steel) tend to touch the bubble after the top point, while denser particles, such as solid particles in water in mineral processing, tend to touch the bubble before the top point. Stochastic fluctuation of the turbulence makes the inclusions very dispersed, so attachment may occur at a range of positions (Fig.8e)
Fig.7 Simulation (left) and experiment (right [31] ) of fluid flow behind a rigid sphere (1.5mm in diameter) in water
bubble
db dp
Ri Ri+∆Ri
dOC
uB
uP
dOS
Bubble
MS&T 2004 Conference Proceedings, (New Orleans, LA), AIST, Warrendale, PA166
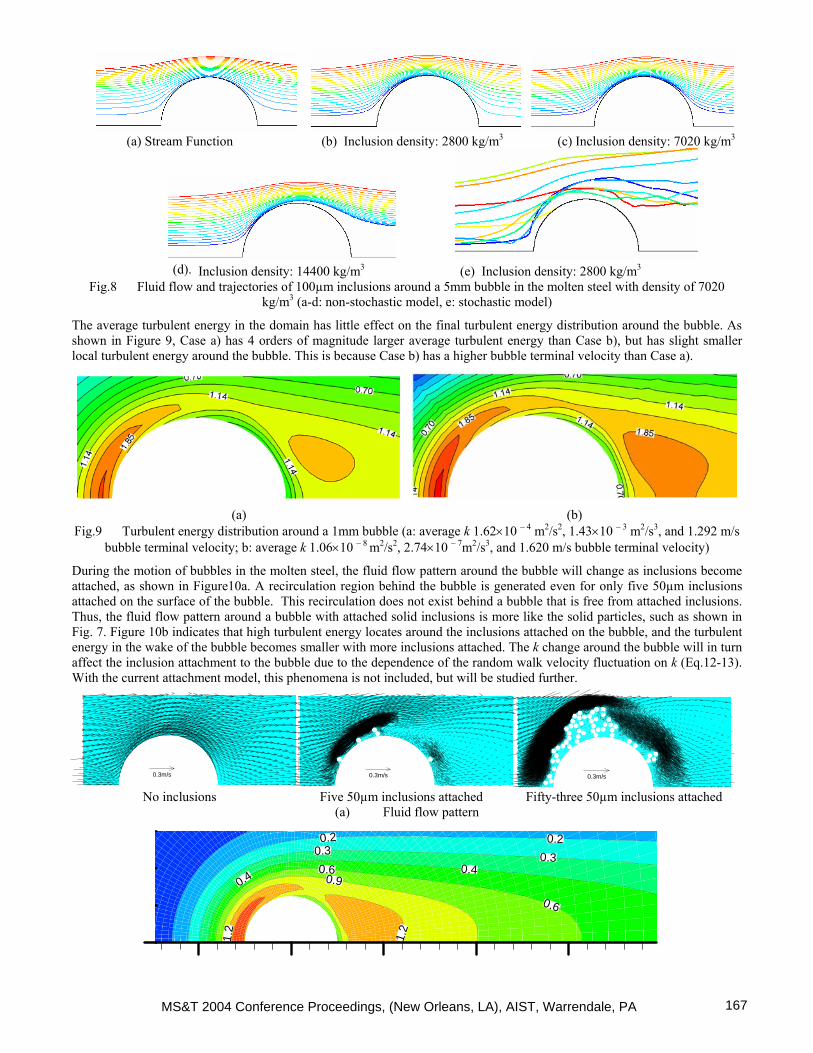
(a) Stream Function (b) Inclusion density: 2800 kg/m3 (c) Inclusion density: 7020 kg/m3
(d). Inclusion density: 14400 kg/m3 (e) Inclusion density: 2800 kg/m3
Fig.8 Fluid flow and trajectories of 100µm inclusions around a 5mm bubble in the molten steel with density of 7020 kg/m3 (a-d: non-stochastic model, e: stochastic model)
The average turbulent energy in the domain has little effect on the final turbulent energy distribution around the bubble. As shown in Figure 9, Case a) has 4 orders of magnitude larger average turbulent energy than Case b), but has slight smaller local turbulent energy around the bubble. This is because Case b) has a higher bubble terminal velocity than Case a).
(a) (b)
Fig.9 Turbulent energy distribution around a 1mm bubble (a: average k 1.62×10 – 4 m2/s2, 1.43×10 – 3 m2/s3, and 1.292 m/s bubble terminal velocity; b: average k 1.06×10 – 8 m2/s2, 2.74×10 – 7m2/s3, and 1.620 m/s bubble terminal velocity)
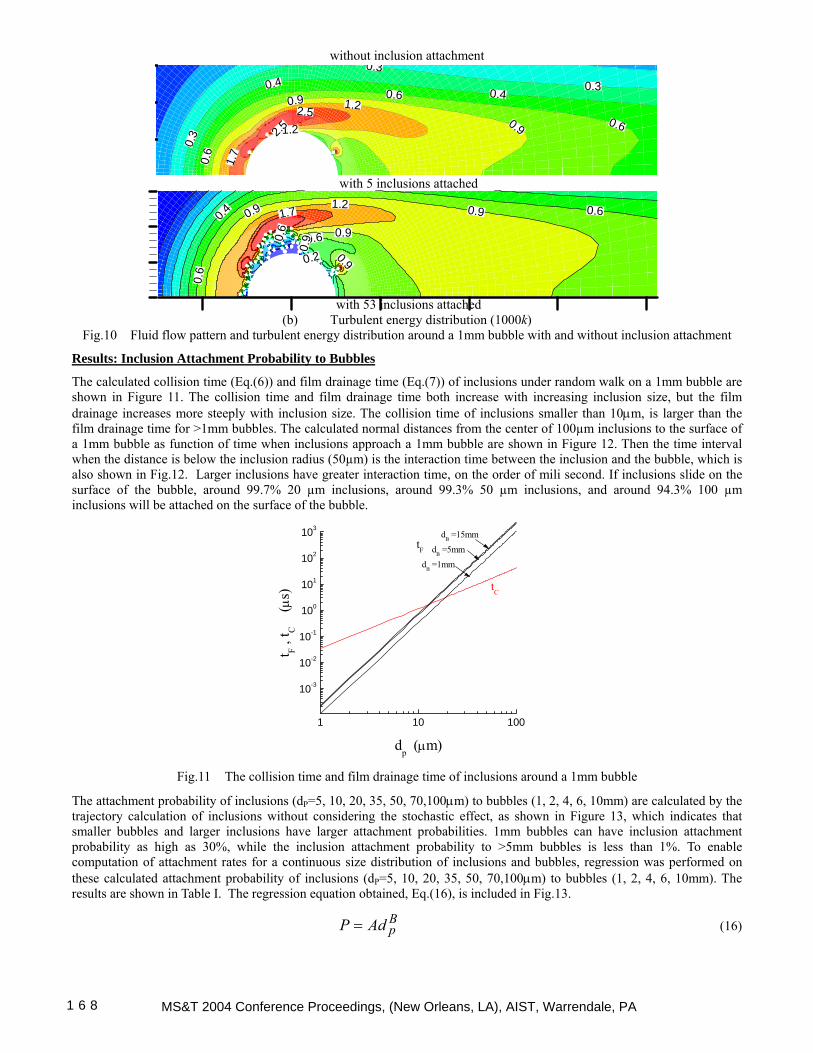
During the motion of bubbles in the molten steel, the fluid flow pattern around the bubble will change as inclusions become attached, as shown in Figure10a. A recirculation region behind the bubble is generated even for only five 50µm inclusions attached on the surface of the bubble. This recirculation does not exist behind a bubble that is free from attached inclusions. Thus, the fluid flow pattern around a bubble with attached solid inclusions is more like the solid particles, such as shown in Fig. 7. Figure 10b indicates that high turbulent energy locates around the inclusions attached on the bubble, and the turbulent energy in the wake of the bubble becomes smaller with more inclusions attached. The k change around the bubble will in turn affect the inclusion attachment to the bubble due to the dependence of the random walk velocity fluctuation on k (Eq.12-13). With the current attachment model, this phenomena is not included, but will be studied further.
0.3m/s 0.3m/s 0.3m/s
No inclusions Five 50µm inclusions attached Fifty-three 50µm inclusions attached (a) Fluid flow pattern
0.2 0.20.3 0.3
0.40.40.6
0.6
0.9
1.2
1.2
MS&T 2004 Conference Proceedings, (New Orleans, LA), AIST, Warrendale, PA 167
without inclusion attachment
0.3
0.30.30.4
0.4
0.6
0.6
0.6
0.9
0.9
1.2
1.2
1.7
2.5
2.5
with 5 inclusions attached
0.2
0.4 0.60.
6
0.6
0.6
0.90.9
0.9
0.9
0.9
1.21.7
with 53 inclusions attached
(b) Turbulent energy distribution (1000k) Fig.10 Fluid flow pattern and turbulent energy distribution around a 1mm bubble with and without inclusion attachment
Results: Inclusion Attachment Probability to Bubbles
The calculated collision time (Eq.(6)) and film drainage time (Eq.(7)) of inclusions under random walk on a 1mm bubble are shown in Figure 11. The collision time and film drainage time both increase with increasing inclusion size, but the film drainage increases more steeply with inclusion size. The collision time of inclusions smaller than 10µm, is larger than the film drainage time for >1mm bubbles. The calculated normal distances from the center of 100µm inclusions to the surface of a 1mm bubble as function of time when inclusions approach a 1mm bubble are shown in Figure 12. Then the time interval when the distance is below the inclusion radius (50µm) is the interaction time between the inclusion and the bubble, which is also shown in Fig.12. Larger inclusions have greater interaction time, on the order of mili second. If inclusions slide on the surface of the bubble, around 99.7% 20 µm inclusions, around 99.3% 50 µm inclusions, and around 94.3% 100 µm inclusions will be attached on the surface of the bubble.
1 10 100
10-3
10-2
10-1
100
101
102
103
dB =5mm
dB =15mm
dB =1mm
tF
tC
t F , t C
(µ
s)
dp (µm)
Fig.11 The collision time and film drainage time of inclusions around a 1mm bubble
The attachment probability of inclusions (dP=5, 10, 20, 35, 50, 70,100µm) to bubbles (1, 2, 4, 6, 10mm) are calculated by the trajectory calculation of inclusions without considering the stochastic effect, as shown in Figure 13, which indicates that smaller bubbles and larger inclusions have larger attachment probabilities. 1mm bubbles can have inclusion attachment probability as high as 30%, while the inclusion attachment probability to >5mm bubbles is less than 1%. To enable computation of attachment rates for a continuous size distribution of inclusions and bubbles, regression was performed on these calculated attachment probability of inclusions (dP=5, 10, 20, 35, 50, 70,100µm) to bubbles (1, 2, 4, 6, 10mm). The results are shown in Table I. The regression equation obtained, Eq.(16), is included in Fig.13.
BpAdP = (16)
MS&T 2004 Conference Proceedings, (New Orleans, LA), AIST, Warrendale, PA1 6 8

where A and B are
20615.00737.0268.0 BB ddA +−= (17)
334.0077.1 −= BdB (18)
where dB is in mm, dp is in µm.
0.00 0.05 0.10 0.15 0.20 0.25 0.300.000
0.005
0.010
0.015
0.020
5µm10µm20µm
50µm
Inte
ract
ion
time
(s)
Distance from the bubble axis (mm)
dp=100µm
1mm bubble
Fig.12 The normal distance from the center of 100µm inclusions to the surface of a 1mm bubble (left), and the interaction
time of inclusions on a 1mm bubble (right)
The example attachment probabilities of inclusions to a bubble including the stochastic effect of the turbulent flow are shown in Table II. The Stochastic effect slightly increases the attachment of inclusions to the bubble surface. Figure 14 shows that by including the stochastic effect, 50µm inclusions in the column with 4mm in diameter have opportunities to collision and attach to the 1mm bubble surface, and the largest attachment opportunity is at the border of 2mm diameter. While, without considering the stochastic effect, only and all of the 50µm inclusions in the column with 0.17mm in diameter attach to the bubbles. Owing to the extra computational effort required for the stochastic model, it was not performed for all sizes of bubbles and inclusions. The Stochastic attachment probability was estimated from the 2 cases to be 16.5/11.6=1.4 times of the non-Stochastic attachment probability.
10 100
0.1
1
10
100
Big Dots: Numerical simulation (NS)small dots and lines: Regression from NS
Bubble diameter (mm) 1 2 4 6 10
Atta
chm
ent P
roba
bilit
y (%
)
Inclusion diameter (µm) Fig.13 The calculated and regressed attachment probability of inclusions to bubbles
Table I. Regressed inclusion attachment probability to the bubble larger than 1mm.
dP= 50µm
MS&T 2004 Conference Proceedings, (New Orleans, LA), AIST, Warrendale, PA 169
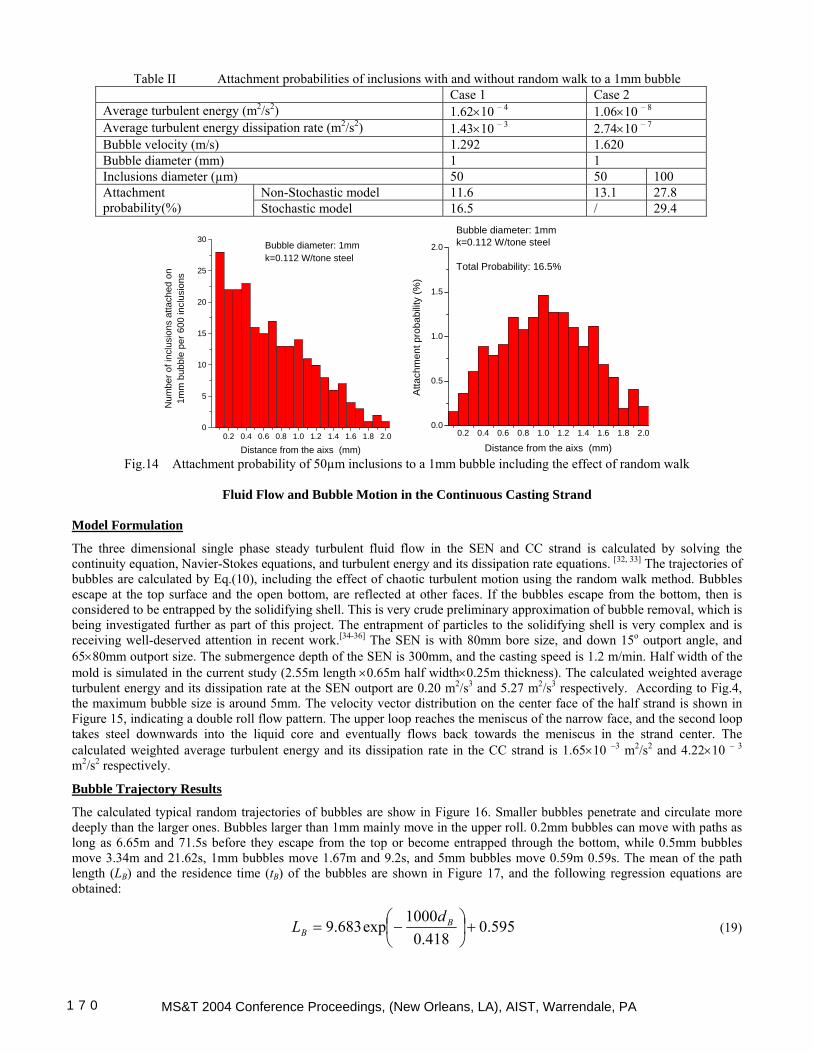
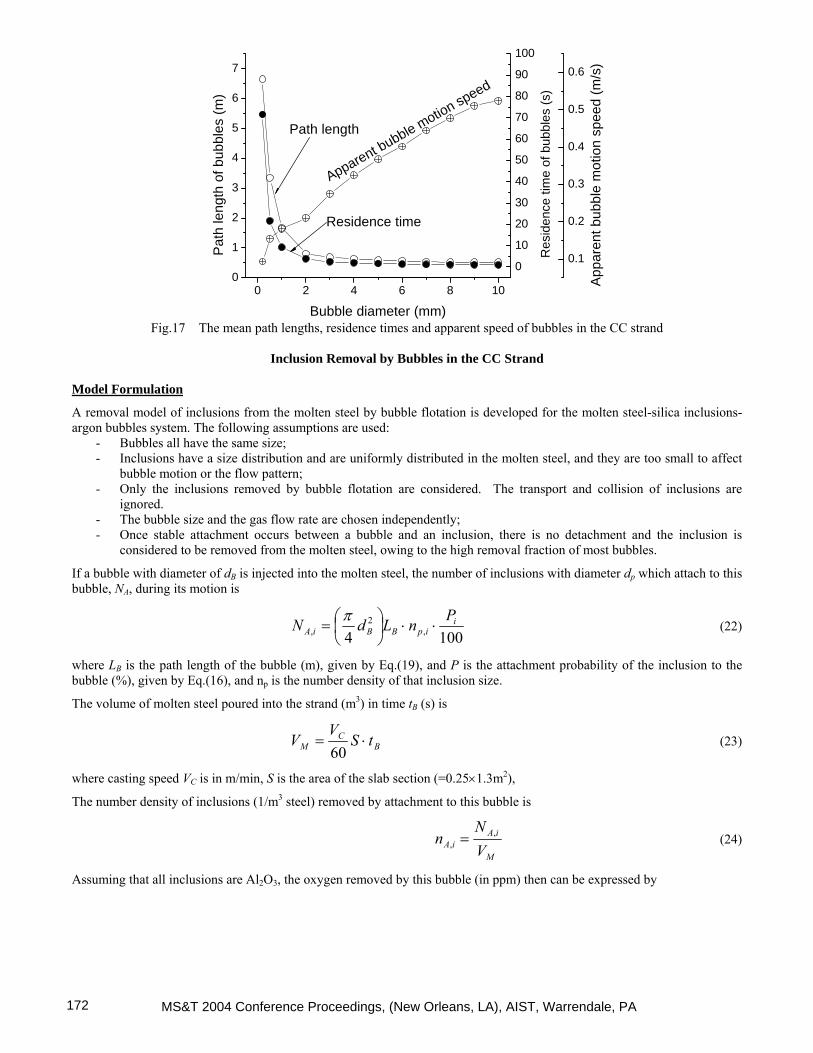
Table II Attachment probabilities of inclusions with and without random walk to a 1mm bubble Case 1 Case 2 Average turbulent energy (m2/s2) 1.62×10 – 4 1.06×10 – 8 Average turbulent energy dissipation rate (m2/s2) 1.43×10 – 3 2.74×10 – 7 Bubble velocity (m/s) 1.292 1.620 Bubble diameter (mm) 1 1 Inclusions diameter (µm) 50 50 100
Non-Stochastic model 11.6 13.1 27.8 Attachment probability(%) Stochastic model 16.5 / 29.4
0.2 0.4 0.6 0.8 1.0 1.2 1.4 1.6 1.8 2.00
5
10
15
20
25
30Bubble diameter: 1mmk=0.112 W/tone steel
Num
ber o
f inc
lusi
ons
atta
ched
on
1mm
bub
ble
per 6
00 in
clus
ions
Distance from the aixs (mm)
0.2 0.4 0.6 0.8 1.0 1.2 1.4 1.6 1.8 2.00.0
0.5
1.0
1.5
2.0
Bubble diameter: 1mmk=0.112 W/tone steel
Total Probability: 16.5%
Atta
chm
ent p
roba
bilit
y (%
)
Distance from the aixs (mm) Fig.14 Attachment probability of 50µm inclusions to a 1mm bubble including the effect of random walk
Fluid Flow and Bubble Motion in the Continuous Casting Strand
Model Formulation
The three dimensional single phase steady turbulent fluid flow in the SEN and CC strand is calculated by solving the continuity equation, Navier-Stokes equations, and turbulent energy and its dissipation rate equations. [32, 33] The trajectories of bubbles are calculated by Eq.(10), including the effect of chaotic turbulent motion using the random walk method. Bubbles escape at the top surface and the open bottom, are reflected at other faces. If the bubbles escape from the bottom, then is considered to be entrapped by the solidifying shell. This is very crude preliminary approximation of bubble removal, which is being investigated further as part of this project. The entrapment of particles to the solidifying shell is very complex and is receiving well-deserved attention in recent work.[34-36] The SEN is with 80mm bore size, and down 15o outport angle, and 65×80mm outport size. The submergence depth of the SEN is 300mm, and the casting speed is 1.2 m/min. Half width of the mold is simulated in the current study (2.55m length ×0.65m half width×0.25m thickness). The calculated weighted average turbulent energy and its dissipation rate at the SEN outport are 0.20 m2/s3 and 5.27 m2/s3 respectively. According to Fig.4, the maximum bubble size is around 5mm. The velocity vector distribution on the center face of the half strand is shown in Figure 15, indicating a double roll flow pattern. The upper loop reaches the meniscus of the narrow face, and the second loop takes steel downwards into the liquid core and eventually flows back towards the meniscus in the strand center. The calculated weighted average turbulent energy and its dissipation rate in the CC strand is 1.65×10 –3 m2/s2 and 4.22×10 – 3 m2/s2 respectively.
Bubble Trajectory Results
The calculated typical random trajectories of bubbles are show in Figure 16. Smaller bubbles penetrate and circulate more deeply than the larger ones. Bubbles larger than 1mm mainly move in the upper roll. 0.2mm bubbles can move with paths as long as 6.65m and 71.5s before they escape from the top or become entrapped through the bottom, while 0.5mm bubbles move 3.34m and 21.62s, 1mm bubbles move 1.67m and 9.2s, and 5mm bubbles move 0.59m 0.59s. The mean of the path length (LB) and the residence time (tB) of the bubbles are shown in Figure 17, and the following regression equations are obtained:
595.0418.0
1000exp683.9 +⎟⎠⎞
⎜⎝⎛−= B
BdL (19)
MS&T 2004 Conference Proceedings, (New Orleans, LA), AIST, Warrendale, PA1 7 0

⎟⎠⎞
⎜⎝⎛−+⎟
⎠⎞
⎜⎝⎛−+⎟
⎠⎞
⎜⎝⎛−=
959.81000exp409.2
139.01000exp65.23
149.01000exp6.195 BBB
Bdddt (20)
where the path length LB and bubble size dB are in m, and the residence time tB is in s. With the path length and the residence time, the bubble apparent motion speed is obtained by WB=LB/tB. The following regression equation is obtained:
( ) 487.01000170.0 BB dW = (21) Larger bubbles have larger apparent motion speed, which can be as high as 0.5 m/s for 10mm bubbles.
1.51.41.31.21.11.00.90.80.70.60.50.40.30.20.10.0
Speed (m/s)
0
5
0
5
0
5
0.0 0.2 0.4 0.6Half Mold Width (m)
0 0.25 0.5(m)
0.02
4.61
0.02
0.061.92
0.06
0.33
0.06
0.060.06
0.14
0.06
0.330.80
0.140.800.80
0.33
0.06
0.80
0.14
0.33
0.33
Fig.15 Flow pattern in the CC strand center face with half width (velocity vectors, streamline, turbulent energy 100k m2/s2
and its dissipation rate 1000ε m2/s3 respectively)
(a) 0.2mm (b) 0.5mm (c) 1mm (d) 5mm
Fig.16 Typical bubble trajectories in the mold with half width
MS&T 2004 Conference Proceedings, (New Orleans, LA), AIST, Warrendale, PA 171
0 2 4 6 8 100
1
2
3
4
5
6
7
0
10
20
30
40
50
60
70
80
90
100
0.1
0.2
0.3
0.4
0.5
0.6
Pat
h le
ngth
of b
ubbl
es (m
)
Bubble diameter (mm)
Res
iden
ce ti
me
of b
ubbl
es (s
)
Apparent bubble motion speed
Residence time
App
aren
t bub
ble
mot
ion
spee
d (m
/s)
Path length
Fig.17 The mean path lengths, residence times and apparent speed of bubbles in the CC strand
Inclusion Removal by Bubbles in the CC Strand
Model Formulation
A removal model of inclusions from the molten steel by bubble flotation is developed for the molten steel-silica inclusions-argon bubbles system. The following assumptions are used:
- Bubbles all have the same size; - Inclusions have a size distribution and are uniformly distributed in the molten steel, and they are too small to affect
bubble motion or the flow pattern; - Only the inclusions removed by bubble flotation are considered. The transport and collision of inclusions are
ignored. - The bubble size and the gas flow rate are chosen independently; - Once stable attachment occurs between a bubble and an inclusion, there is no detachment and the inclusion is
considered to be removed from the molten steel, owing to the high removal fraction of most bubbles.
If a bubble with diameter of dB is injected into the molten steel, the number of inclusions with diameter dp which attach to this bubble, NA, during its motion is
1004 ,2
,i
ipBBiAPnLdN ⋅⋅⎟
⎠⎞
⎜⎝⎛=
π (22)
where LB is the path length of the bubble (m), given by Eq.(19), and P is the attachment probability of the inclusion to the bubble (%), given by Eq.(16), and np is the number density of that inclusion size.
The volume of molten steel poured into the strand (m3) in time tB (s) is
BC
M tSV
V ⋅=60
(23)
where casting speed VC is in m/min, S is the area of the slab section (=0.25×1.3m2),
The number density of inclusions (1/m3 steel) removed by attachment to this bubble is
M
iAiA V
Nn ,
, = (24)
Assuming that all inclusions are Al2O3, the oxygen removed by this bubble (in ppm) then can be expressed by
MS&T 2004 Conference Proceedings, (New Orleans, LA), AIST, Warrendale, PA172
∑∑⎥⎥⎥⎥
⎦
⎤
⎢⎢⎢⎢
⎣
⎡
⋅⋅⎟⎠⎞
⎜⎝⎛
⋅
⋅⋅⎟⎠⎞
⎜⎝⎛
=⎥⎦
⎤⎢⎣
⎡⋅⋅⎟
⎠⎞
⎜⎝⎛=∆
i M
pip
BC
iipBB
i M
pipiA d
tSV
PnLddnO 63
,
,2
63,, 10
10248
660
10041010248
6 ρρπ
π
ρρπ
which can be rewritten as
( )∑ ⋅⋅⋅×=∆i
ipiipM
p
B
BB
C
dPntLd
SVO 3
,,
25 11016.1
ρρ
(25)
Because it is assumed that all bubbles in the molten steel have the same size, the total number of bubbles with diameter dB entering the molten steel during time tB is
B
B
MG
B td
TQn
3
6
27321
π
⋅=
which can be rewritten as
32733
B
BMGB d
tTQnπ
= (26)
where QG is the gas flow in Nl/min, TM is the steel temperature (1823K), and the factor of ½ is due to the simulation domain of a half mold.
Therefore the total oxygen removal can be expressed by
( )∑ ⎥⎦⎤
⎢⎣⎡∑ ⋅⋅⋅×=∆
=
Bn
j iipiAjip
M
p
B
BB
C
dPntLd
SVO
1
3,,,
25 11016.1
ρρ
(27)
where jipn , is the number density of inclusion with diameter dp,i when bubble j is injected, which can be represented by
( )
BC
BBi
jipjip
tSV
LdPnn
⋅
⎟⎠⎞
⎜⎝⎛
×−
×=−
60
4100
1002
1,,
π
(28)
This equation updates the inclusion number density distribution after the calculation of each individual bubble, in order to account for the significant change in inclusion concentration caused by the simultaneous inclusion removal of many bubbles.
Results and Discussion
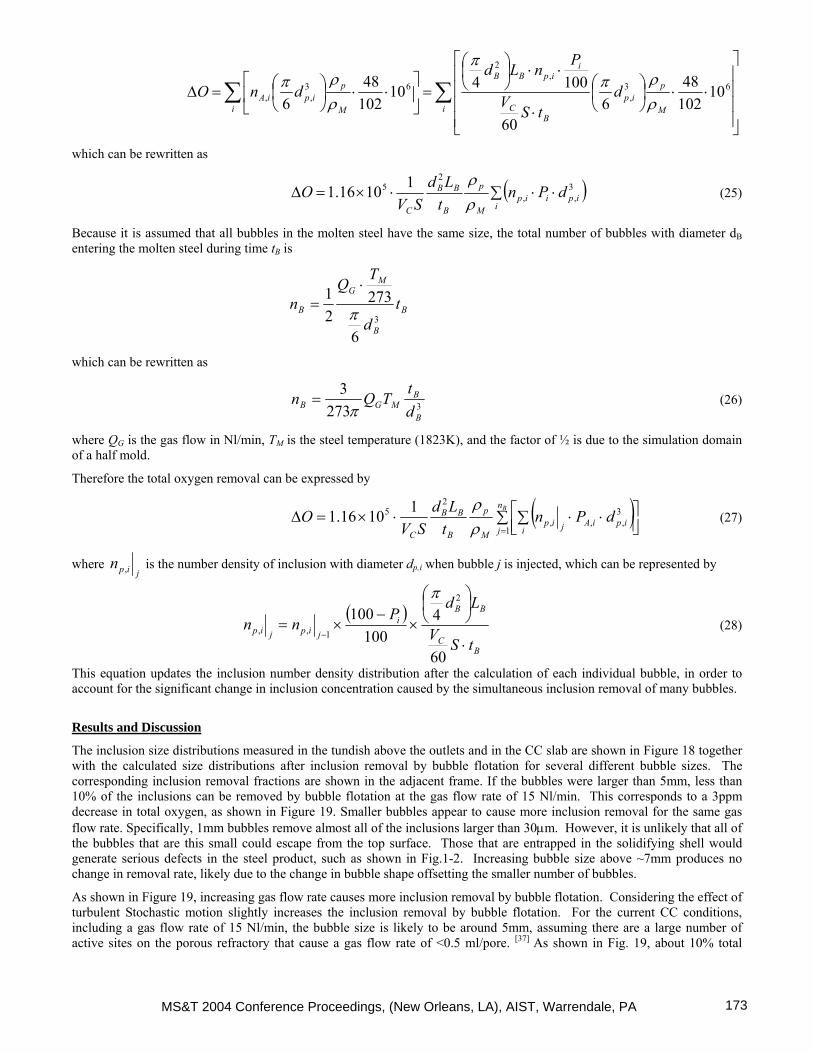
The inclusion size distributions measured in the tundish above the outlets and in the CC slab are shown in Figure 18 together with the calculated size distributions after inclusion removal by bubble flotation for several different bubble sizes. The corresponding inclusion removal fractions are shown in the adjacent frame. If the bubbles were larger than 5mm, less than 10% of the inclusions can be removed by bubble flotation at the gas flow rate of 15 Nl/min. This corresponds to a 3ppm decrease in total oxygen, as shown in Figure 19. Smaller bubbles appear to cause more inclusion removal for the same gas flow rate. Specifically, 1mm bubbles remove almost all of the inclusions larger than 30µm. However, it is unlikely that all of the bubbles that are this small could escape from the top surface. Those that are entrapped in the solidifying shell would generate serious defects in the steel product, such as shown in Fig.1-2. Increasing bubble size above ~7mm produces no change in removal rate, likely due to the change in bubble shape offsetting the smaller number of bubbles.
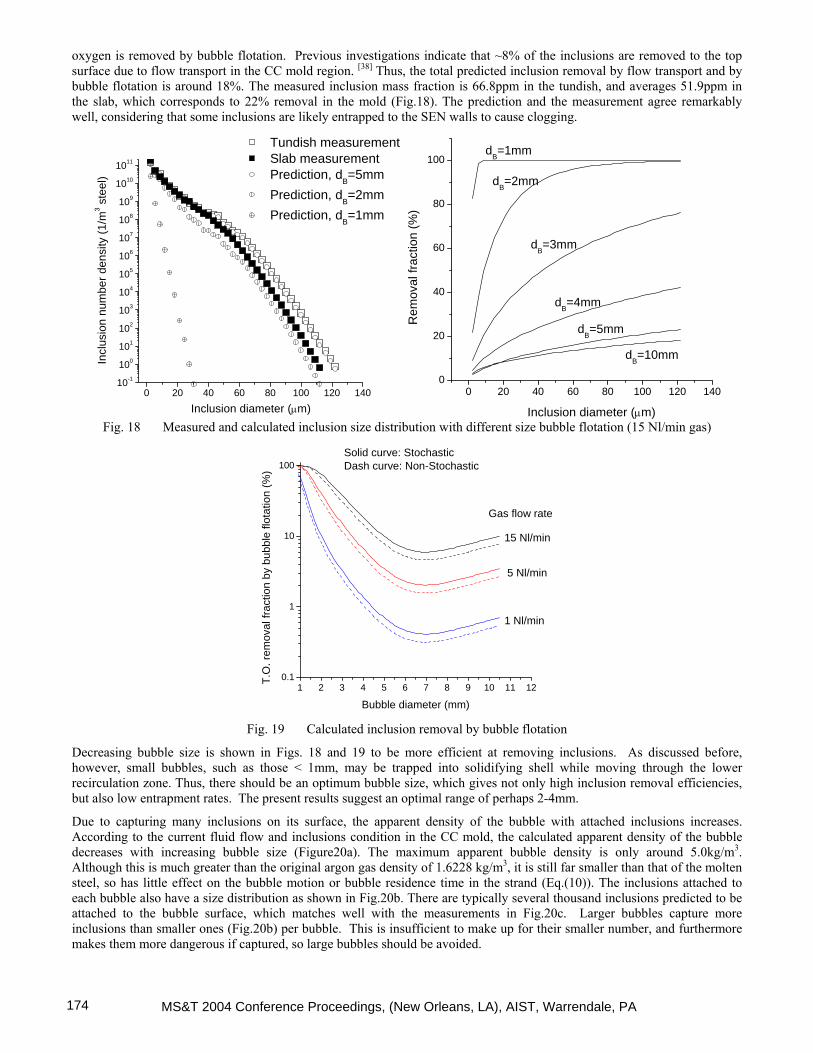
As shown in Figure 19, increasing gas flow rate causes more inclusion removal by bubble flotation. Considering the effect of turbulent Stochastic motion slightly increases the inclusion removal by bubble flotation. For the current CC conditions, including a gas flow rate of 15 Nl/min, the bubble size is likely to be around 5mm, assuming there are a large number of active sites on the porous refractory that cause a gas flow rate of <0.5 ml/pore. [37] As shown in Fig. 19, about 10% total
MS&T 2004 Conference Proceedings, (New Orleans, LA), AIST, Warrendale, PA 173
oxygen is removed by bubble flotation. Previous investigations indicate that ~8% of the inclusions are removed to the top surface due to flow transport in the CC mold region. [38] Thus, the total predicted inclusion removal by flow transport and by bubble flotation is around 18%. The measured inclusion mass fraction is 66.8ppm in the tundish, and averages 51.9ppm in the slab, which corresponds to 22% removal in the mold (Fig.18). The prediction and the measurement agree remarkably well, considering that some inclusions are likely entrapped to the SEN walls to cause clogging.
0 20 40 60 80 100 120 14010-1
100
101
102
103
104
105
106
107
108
109
1010
1011
Tundish measurement Slab measurement Prediction, dB=5mm Prediction, dB=2mm Prediction, dB=1mm
Incl
usio
n nu
mbe
r den
sity
(1/m
3 ste
el)
Inclusion diameter (µm)0 20 40 60 80 100 120 140
0
20
40
60
80
100
dB=4mm
dB=3mm
dB=10mm
dB=5mm
dB=2mm
dB=1mm
Inclusion diameter (µm)R
emov
al fr
actio
n (%
)
Fig. 18 Measured and calculated inclusion size distribution with different size bubble flotation (15 Nl/min gas)
1 2 3 4 5 6 7 8 9 10 11 120.1
1
10
100Solid curve: StochasticDash curve: Non-Stochastic
1 Nl/min
5 Nl/min
15 Nl/min
Gas flow rate
T.O
. rem
oval
frac
tion
by b
ubbl
e flo
tatio
n (%
)
Bubble diameter (mm) Fig. 19 Calculated inclusion removal by bubble flotation
Decreasing bubble size is shown in Figs. 18 and 19 to be more efficient at removing inclusions. As discussed before, however, small bubbles, such as those < 1mm, may be trapped into solidifying shell while moving through the lower recirculation zone. Thus, there should be an optimum bubble size, which gives not only high inclusion removal efficiencies, but also low entrapment rates. The present results suggest an optimal range of perhaps 2-4mm.
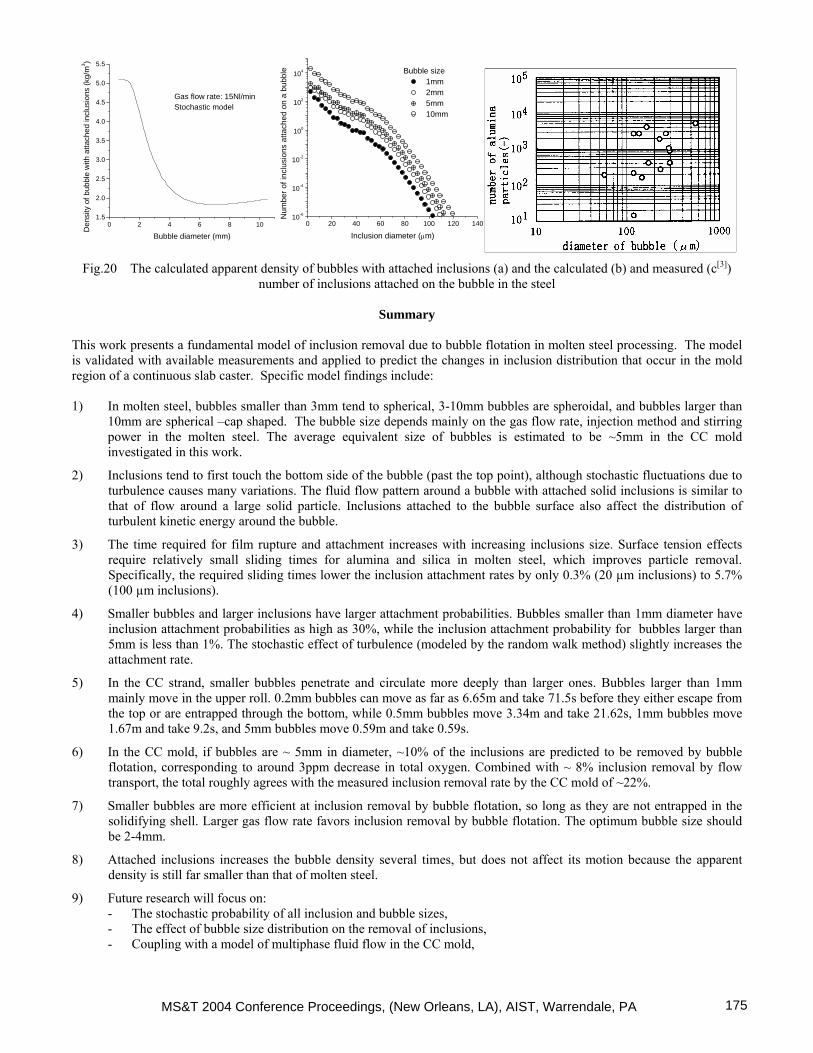
Due to capturing many inclusions on its surface, the apparent density of the bubble with attached inclusions increases. According to the current fluid flow and inclusions condition in the CC mold, the calculated apparent density of the bubble decreases with increasing bubble size (Figure20a). The maximum apparent bubble density is only around 5.0kg/m3. Although this is much greater than the original argon gas density of 1.6228 kg/m3, it is still far smaller than that of the molten steel, so has little effect on the bubble motion or bubble residence time in the strand (Eq.(10)). The inclusions attached to each bubble also have a size distribution as shown in Fig.20b. There are typically several thousand inclusions predicted to be attached to the bubble surface, which matches well with the measurements in Fig.20c. Larger bubbles capture more inclusions than smaller ones (Fig.20b) per bubble. This is insufficient to make up for their smaller number, and furthermore makes them more dangerous if captured, so large bubbles should be avoided.
MS&T 2004 Conference Proceedings, (New Orleans, LA), AIST, Warrendale, PA174
0 2 4 6 8 101.5
2.0
2.5
3.0
3.5
4.0
4.5
5.0
5.5
Gas flow rate: 15Nl/minStochastic model
Den
sity
of b
ubbl
e w
ith a
ttach
ed in
clus
ions
(kg/
m3 )
Bubble diameter (mm)
0 20 40 60 80 100 120 14010-6
10-4
10-2
100
102
104 Bubble size 1mm 2mm 5mm 10mm
Num
ber o
f inc
lusi
ons
atta
ched
on
a bu
bble
Inclusion diameter (µm)
Fig.20 The calculated apparent density of bubbles with attached inclusions (a) and the calculated (b) and measured (c[3])
number of inclusions attached on the bubble in the steel
Summary This work presents a fundamental model of inclusion removal due to bubble flotation in molten steel processing. The model is validated with available measurements and applied to predict the changes in inclusion distribution that occur in the mold region of a continuous slab caster. Specific model findings include: 1) In molten steel, bubbles smaller than 3mm tend to spherical, 3-10mm bubbles are spheroidal, and bubbles larger than
10mm are spherical –cap shaped. The bubble size depends mainly on the gas flow rate, injection method and stirring power in the molten steel. The average equivalent size of bubbles is estimated to be ~5mm in the CC mold investigated in this work.
2) Inclusions tend to first touch the bottom side of the bubble (past the top point), although stochastic fluctuations due to turbulence causes many variations. The fluid flow pattern around a bubble with attached solid inclusions is similar to that of flow around a large solid particle. Inclusions attached to the bubble surface also affect the distribution of turbulent kinetic energy around the bubble.
3) The time required for film rupture and attachment increases with increasing inclusions size. Surface tension effects require relatively small sliding times for alumina and silica in molten steel, which improves particle removal. Specifically, the required sliding times lower the inclusion attachment rates by only 0.3% (20 µm inclusions) to 5.7% (100 µm inclusions).
4) Smaller bubbles and larger inclusions have larger attachment probabilities. Bubbles smaller than 1mm diameter have inclusion attachment probabilities as high as 30%, while the inclusion attachment probability for bubbles larger than 5mm is less than 1%. The stochastic effect of turbulence (modeled by the random walk method) slightly increases the attachment rate.
5) In the CC strand, smaller bubbles penetrate and circulate more deeply than larger ones. Bubbles larger than 1mm mainly move in the upper roll. 0.2mm bubbles can move as far as 6.65m and take 71.5s before they either escape from the top or are entrapped through the bottom, while 0.5mm bubbles move 3.34m and take 21.62s, 1mm bubbles move 1.67m and take 9.2s, and 5mm bubbles move 0.59m and take 0.59s.
6) In the CC mold, if bubbles are ~ 5mm in diameter, ~10% of the inclusions are predicted to be removed by bubble flotation, corresponding to around 3ppm decrease in total oxygen. Combined with ~ 8% inclusion removal by flow transport, the total roughly agrees with the measured inclusion removal rate by the CC mold of ~22%.
7) Smaller bubbles are more efficient at inclusion removal by bubble flotation, so long as they are not entrapped in the solidifying shell. Larger gas flow rate favors inclusion removal by bubble flotation. The optimum bubble size should be 2-4mm.
8) Attached inclusions increases the bubble density several times, but does not affect its motion because the apparent density is still far smaller than that of molten steel.
9) Future research will focus on: - The stochastic probability of all inclusion and bubble sizes, - The effect of bubble size distribution on the removal of inclusions, - Coupling with a model of multiphase fluid flow in the CC mold,
MS&T 2004 Conference Proceedings, (New Orleans, LA), AIST, Warrendale, PA 175
- Coupling with a model of inclusions collision, - Inclusion removal by bubble flotation in gas stirred ladles.
Acknowledgments
This material is based upon work supported by the U.S. Department of Energy under cooperative agreement number DE-FC36-03ID14279. Such support does not constitute an endorsement by DOE of the views expressed in the article. This research is also supported by the National Science Foundation (Grant DMI-0115486) and the Continuous Casting Consortium at UIUC.
References
1. G. Abbel, W. Damen, G. deendt, W. Tiekink, "Argon Bubbles in Slabs," ISIJ, Vol. 36, 1996, S219-S222. 2. W.H. Emling, T.A. Waugaman, S.L. Feldbauer, A.W. Cramb, "Subsurface Mold Slag Entrainment in Ultra-Low
Carbon Steels," in Steelmaking Conference Proceedings, Vol. 77, ISS, Warrendale, PA, (Chicago, IL), 1994, 371-379.
3. L. Kiriha, H. Tosawa and K. Sorimachi, "Behavior of Alumina CLuster in Ultra Low Carbon Steel during Steelmaking Process," CAMP-ISIJ, Vol. 13, 2000, 120.
4. L. Zhang and S. Taniguchi, "Fundamentals of Inclusions Removal from Liquid Steel by Bubbles Flotation," International Materials Reviews, Vol. 45 (2), 2000, 59-82.
5. B.G. Thomas, A. Denissov and H. Bai, "Behavior of Argon Bubbles during Continuous Casting of Steel," in Steelmaking Conference Proceedings, Vol. 80, ISS, Warrendale, PA., 1997, 375-384.
6. J. Knoepke, M. Hubbard, J. Kelly, R. Kittridge, J. Lucas, "Pencil Blister Reduction at Inland Steel Company," in Steelmaking Conference Proceedings, Vol. 77, ISS, Warrendale, PA, 1994, 381-388.
7. W. Damen, G. Abbel, H. Schulte, G. desendt, "The Influence of the Mould Process on Argon Bubbles in Slabs," 1996,
8. L. Zhang, B.G. Thomas and B. Rietow, "Investigation of Ingot Inclusions Using Microscope and SEM . Univ. of Illinois at Urbana-Champaign. IMF project report.," Report No. CCC200406, University of Illinois at Urbana-Champaign, 2004.
9. H. Yin and H.T. Tsai, "Application of Cathodoluminescence Microscopy (CLM) in Steel Research," in ISSTech2003 Conference Proceedings, ISS, Warrandale, PA, 2003, 217-226.
10. R. Gass, H. Knoepke, J. Moscoe, R. Shah, J. Beck, J. Dzierzawski, P.E. Ponikvar, "Conversion of Ispat Inland's No.1 Slab Caster to Vertical Bending," in ISSTech2003 Conference Proceedings, ISS, Warrandale, PA, 2003, 3-18.
11. P. Rocabois, J.-N. Pontoire, V. Delville, I. Marolleau, "Different Slivers Type Observed in Solla Steel Plants and Improved Practice to Reduce Surface Defects on Cold Roll Sheet," in ISSTech2003 Conference Proceedings, ISS, Warrandale, PA, 2003, 995-1006.
12. W. Pan, K. Uemura and S. Koyama, "Cold Model Experiment on Entrapment of Inclusions in Steel by Inert Gas Bubbles," Tetsu-to-Hagane, Vol. 78 (8), 1992, 87-94.
13. L. Zhang and S. Taniguchi, "Water Model Study on Inclusion Removal by Bubble FLotation from Liquid Steel by Bubble Flotation under Turbulent Condition," Ironmaking & Steelmaking, Vol. Vol.29 (5), 2002, 326-336.
14. H. Schubert, Int. J. Miner. Process., Vol. 56, 1999, 257-276. 15. A.G. Szekely, "The Removal of Solid Particles from Molten Aluminum in the Spinning Nozzle Inert Gas Flotation
Process," Metal. Trans. B, Vol. 7B (3), 1976, 259-270. 16. K. Okumura, M. Kitazawa, N. Hakamada, M. Hirasawa, M. Sano, K. Mori, "Rate of SiO2 Inclusion Removal from
Molten Copper to Slag Under Gas Injection Stirring Condition," ISIJ Inter., Vol. 35 (7), 1995, 832-837. 17. Y. Miki, B.G. Thomas, A. Denissov, Y. Shimada, "Model of Inclusion Removal During RH Degassing of Steel,"
Iron and Steelmaker, Vol. 24 (8), 1997, 31-38. 18. Y. Xie, S. Orsten and F. Oeters, "Behaviour of Bubbles at Gas Blowing Into Liquid Wood's Metal," ISIJ Int., Vol.
32 (1), 1992, 66-75. 19. R.M. Wellek, A.K. Agrawal and A.H.P. Skelland, "Shape of Liquid Drops Moving in Liquid Media," A. I. Ch. E.
Journal, Vol. 12 (5), 1966, 854-862. 20. Y. Sahai and R.I.L. Guthrie, "Hydrodynamics of Gas Stirred Melts. I.--Gas/Liquid Coupling," Metal. Trans B, Vol.
13B (2), 182, 193-202. 21. H. Tokunaga, M. Iguchi and H. Tatemichi, "Turbulence structure of bottom-blowing bubbling jet in a molten
Wood's metal bath," Metall. Mater. Trans. B, Vol. 30B (1), 1999, 61-66. 22. M. Iguchi, H. Tokunaga and H. Tatemichi, "Bubble and liquid flow characteristics in a Wood's metal bath stirred by
bottom helium gas injection," Metall. Mater. Trans. B, Vol. 28B (6), 1997, 1053-1061.
MS&T 2004 Conference Proceedings, (New Orleans, LA), AIST, Warrendale, PA176

23. M. Sevik and S.H. Park, "The splitting of drops and bubbles by turbulent fluid flow," J. of Fluids Eng. Trans. AIME (53-60), 1973,
24. S. Yokoya, S. Takagi, K. Tada, M. Iguchi, K. Marukawa, S. Hara, "Swirling Flow Effect in Bottomless Immersion Nozzle on Bulk Flow in High Throughput Slab Continuous Casting Mold," ISIJ Int., Vol. 41 (10), 2001, 1201-1207.
25. S. Yokoya, S. Takagi, S. Ootani, M. Iguchi, K. Marukawa, "Swirling Flow Effect in Submerged Entry Nozzle on Bulk Flow in High Throughput Slab Continuous Casting Mold," ISIJ Int., Vol. 41 (10), 2001, 1208-1214.
26. S. Yokoya, S. Takagi, M. Kaneko, M. Iguchi, K. Marukawa, S. Hara, "Swirling Flow Effect in Off-center Immersion Nozzle on Bulk Flow in Billet Continuous Casting Mold," ISIJ Int., Vol. 41 (10), 2001, 1215-1220.
27. S. Yokoya, S. Takagi, M. Iguchi, K. Marukawa, S. Hara, "Swirling Flow Effect in Immersion Nozzle for Continuous Casting Process," ISIJ Int., Vol. 41 (Supplement), 2001, S47-S51.
28. Y. Ye and J.D. Miller, "The Significance of Bubble Particle COntact Time during Collision in the Analysis of Flotation Phenomena," Int. J. Miner. Process., Vol. 25 (3-4), 1989, 199-219.
29. H.J. Schulze, Miner. Process. Extractive Metall. Rev., Vol. 5, 1989, 43-76. 30. FLUENT5.1, Report, Fluent. Inc., Lebanon, New Hampshire, 2000. 31. R. Clift, J.R. Grace and M.E. Weber, Bubbles, Drops and Particles, Academics Press, INC., New York, 1978. 32. L. Zhang and B.G. Thomas, "Fluid Flow and Inclusion Motion in the Continuous Casting Strand," in Steelmaking
National Symposium Mexico, (Morelia, Mich, Mexico), 2003. 33. B.G. Thomas and L. Zhang, "Mathematical Modeling of Fluid Flow in Continuous Casting," ISIJ Inter., Vol. 41
(10), 2001, 1181-1193. 34. M. Yemmou, M.A.A. Azouni and P. Casses, "Thermal Aspects of Particle Engulfment by a Solidifying Front," J.
Crystal Growth, Vol. 128 (4), 1993, 1130-1136. 35. J.K. Kim and P.K. RRRohatgi, "An Analysis Solution of the Critical Interface Velocity for the Encapturing of
Insoluable Particles by a Moving Solid/Liquid Interface," Metall. & Mater. Trans. B, Vol. 29A (1), 1998, 351-375. 36. D.M. Stefanescu and A.V. Catalina, "Note: Calculation of the critical velocity for the pusying/engulfment transition
of nonmetallic inclusions in steel," ISIJ Int., Vol. 38 (5), 1998, 503-505. 37. H. Bai and B.G. Thomas, "Bubble Formation during Horizontal Gas Injection into Downward Flowing Liquid,"
Metall. Mater. Trans. B, Vol. 32B, 2001, 1143-1159. 38. L. Zhang, B.G. Thomas, K. Cai, L. Zhu, J. Cui, "Inclusion Investigation during Clean Steel Production at Baosteel,"
in ISSTech2003, ISS, Warrandale, PA, 2003, 141-156.
MS&T 2004 Conference Proceedings, (New Orleans, LA), AIST, Warrendale, PA 177