induced seismicity associated with fluid injection into a...
TRANSCRIPT
Induced seismicity associated with fluid injection into a deep wellin Youngstown, Ohio
Won-Young Kim1
Received 1 February 2013; revised 6 June 2013; accepted 10 June 2013.
[1] Over 109 small earthquakes (Mw 0.4–3.9) were detected during January 2011 to February2012 in the Youngstown, Ohio area, where there were no known earthquakes in the past.These shocks were close to a deep fluid injection well. The 14 month seismicity included sixfelt earthquakes and culminated with aMw 3.9 shock on 31 December 2011. Among the 109shocks, 12 events greater than Mw 1.8 were detected by regional network and accuratelyrelocated, whereas 97 small earthquakes (0.4<Mw< 1.8) were detected by the waveformcorrelation detector. Accurately located earthquakes were along a subsurface fault trendingENE-WSW—consistent with the focal mechanism of the main shock and occurred at depths3.5–4.0 km in the Precambrian basement. We conclude that the recent earthquakes inYoungstown, Ohio were induced by the fluid injection at a deep injection well due toincreased pore pressure along the preexisting subsurface faults located close to the wellbore.We found that the seismicity initiated at the eastern end of the subsurface fault—close to theinjection point, and migrated toward the west—away from the wellbore, indicating that theexpanding high fluid pressure front increased the pore pressure along its path andprogressively triggered the earthquakes. We observe that several periods of quiescence ofseismicity follow the minima in injection volumes and pressure, which may indicate that theearthquakes were directly caused by the pressure buildup and stopped whenpressure dropped.
Citation: Kim, W.-Y. (2013), Induced seismicity associated with fluid injection into a deep well in Youngstown, Ohio,J. Geophys. Res. Solid Earth, 118, doi:10.1002/jgrb.50247.
1. Introduction
[2] Since the early 1960s, it has been known that wastedisposal by fluid injection at high pressure into subsurfacerock formations can cause earthquakes known as inducedseismicity [e.g., Nicholson and Wesson, 1992; McGarret al., 2002]. There are well-documented cases ofinduced seismicity including Rocky Mountain Arsenal(RMA), Colorado, in the 1960s [Healy et al., 1968];Ashtabula, Ohio, in the 1980s [Seeber et al., 2004]; ParadoxValley, Colorado, in the 1990s [Ake et al., 2005]; and Guy,Arkansas, during 2011 [Horton, 2012], among others.The largest events at those induced seismicities range fromMw 3.9 at Ashtabula, Ohio, Mw 4.3 at Paradox Valley,Mw 4.7 at Guy, Arkansas, and Mw 4.85 at Rocky MountainArsenal [Herrmann et al., 1981].[3] Since early 2011, many significant earthquakes
suspected to be induced events occurred in the United Statesmidcontinent region [Ellsworth et al., 2012]. They are Mw
5.7 earthquake on 06 November 2011 at Prague, Oklahoma[Keranen et al., 2013]; Mw 5.3 event on 23 August 2011 atTrinidad, Colorado [Rubinstein et al., 2012; Viegas et al.,2012]; Mw 4.8 event on 20 October 2011 at Fashing, Texas[Brunt et al., 2012]; Mw 4.8 earthquake on 17 May 2012 atTimpson, Texas [Brown et al., 2012]; Mw 4.3 earthquake on11 September 2011 at Cogdell oil field, Snyder, Texas[Davis and Pennington, 1989]; and Mw 3.3 event on 16 May2009 at Dallas-Fort Worth, Texas [Frohlich et al., 2011],and are listed in Table 1. These are broadly related to fluidinjection into subsurface strata through disposal wells suchas; for secondary recovery of oil (Cogdell, TX), waste fluidfrom coal bed methane production (Trinidad, CO), wastewater(Prague, OK) and brine from hydraulic fracturing of shale gas(Dallas-Fort Worth, TX).[4] Over the last several years, hydraulic fracturing has
become widely used in the northeastern United States toextract natural gas from the Marcellus Shale (tight Devonianblack shale) [see, e.g., National Academy of Sciences, 2012].Much of the hydraulic fracturing of shale gas has been carriedout in Pennsylvania, but the wastewater (brine) from thehydraulic fracturing process is being transported to Ohio anddisposed of by injecting into deep wells at a depth range of2.2–3.0 km under high pressure of up to 17.2 MPa (2500 psi[pounds per square inch]). The target injection intervals areusually sandstone layers in the Knox Dolomite (LowerOrdovician to Upper Cambrian) to Mt. Simon sandstone(Middle Cambrian). Five deep injection wells were drilled in
Additional supporting information may be found in the online version ofthis article.
1Lamont-Doherty Earth Observatory, Columbia University, Palisades,New York, USA.
Corresponding author: W.-Y. Kim, Lamont-Doherty Earth Observatory,Columbia University, 61 Rt. 9W, Palisades, NY 10964, USA.([email protected])
©2013. American Geophysical Union. All Rights Reserved.2169-9313/13/10.1002/jgrb.50247
1
JOURNAL OF GEOPHYSICAL RESEARCH: SOLID EARTH, VOL. 118, 1–13, doi:10.1002/jgrb.50247, 2013
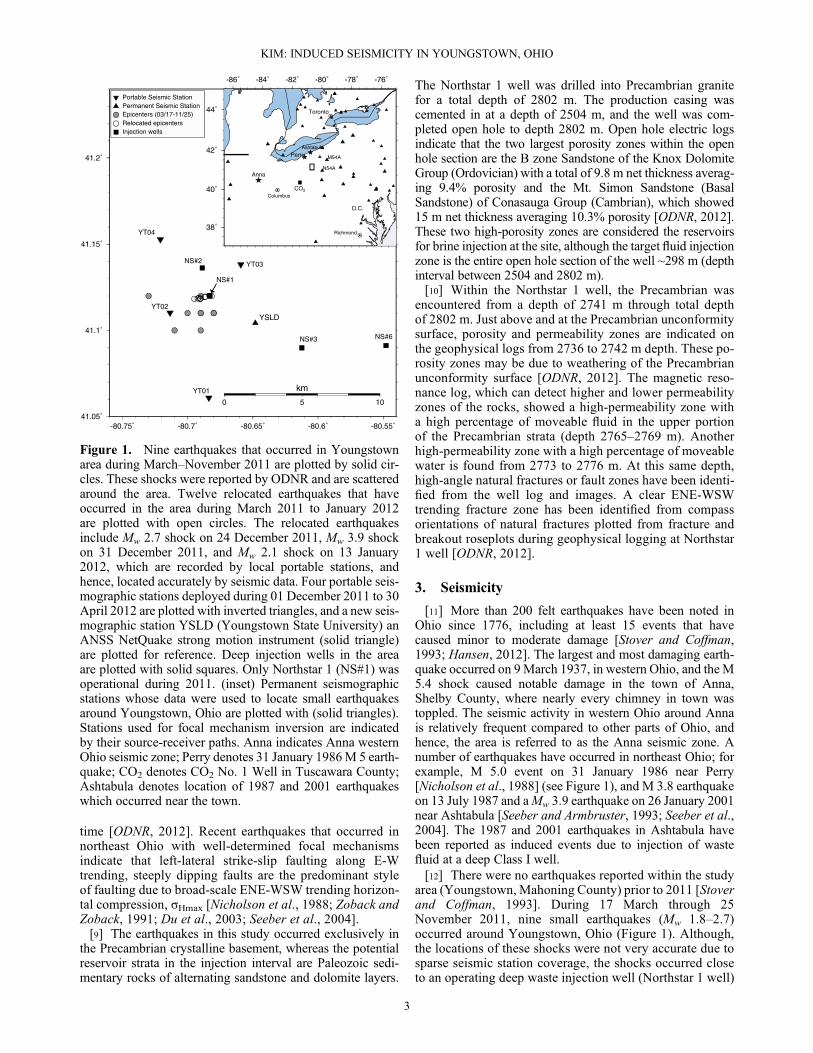
the Youngstown, Ohio area since 2010, but only the Northstar 1injection well was operational during 2011 (Figure 1). Since theNorthstar 1 waste disposal well became operational in lateDecember 2010, Youngstown, Ohio has experienced smallearthquakes. On 17 March 2011, residents in Youngstown,Ohio felt a Mw 2.3 earthquake. By 25 November 2011, nineearthquakes (Mw ~1.8–2.8) occurred near Youngstown, Ohio.These shocks are reported by the Division of GeologicalSurvey of the Ohio Department of Natural Resources(ODNR) [see Ohio Department of Natural Resources(ODNR), 2012, Table 5] by using data from sparse seismicstations in the region [Hansen and Ruff, 2003]. Prior to 2011,no earthquakes were recorded around Youngstown [Stoverand Coffman, 1993; Hansen, 2012]. Although these earth-quakes could not be accurately located due to sparse coverageof seismic stations in the region, these shocks were occurringclose to a deep waste injection well Northstar 1 (Figure 1).On 1 December 2011, Lamont Cooperative SeismographicNetwork deployed four portable seismographic stationsaround Youngstown at the request of and in collaboration withODNR to monitor seismicity at close distances and to deter-mine hypocenters of the small earthquakes accurately forassessing whether these shocks were induced by the deepwaste disposal well injecting fluid since the end of 2010 inthe area (see Figure 1).[5] On 24 December 2011, a magnitude 2.7 shock occurred
in the epicentral area, which was well recorded by the four-station local network in the distance range from 1.9 to 6.5km from the epicenter. The hypocenter of the shock was verywell determined by the local station data, which had adequatecoverage with the station azimuthal gap of 119° and distanceto the two closest stations less than the focal depth. The shockwas located about 0.8 ± 0.4 km west of the Northstar 1 well ata focal depth of 3.6 ± 0.8 km (95% confidence level). On 30December 2011, ODNR requested the operator to shut downthe Northstar 1 well, because the 24 December 2011 eventwas located close to the injection well with high confidence.On 31 December 2011 at 20:05 (UTC), a magnitude Mw 3.9earthquake occurred in the same epicentral area within 24 hfrom the shutdown of the injection operation.[6] This is a rare case of likely induced seismicity in the
northeastern United States where major events in a sequence
have been well recorded by local portable seismographs inplace (with a high sample rate of up to 500 samples/s), pro-viding an opportunity to study the sequence of seismicity indetail. In this study, we analyzed the spatiotemporal distribu-tion of seismicity in detail and compared it with availablefluid injection parameters to determine if the seismicity inYoungstown area during January 2011 to February 2012was triggered by the fluid injection into a deep well or not.We also analyzed seismic data in detail in an attempt to shedlight on relations between the induced seismicity and physi-cal injection parameters of the deep well injection in theYoungstown area. The study area or Youngstown area refersto an area about 15 km radius from the main shock on 31December 2011 (41.118°N, 80.692°W) around Youngstown,Ohio (Figure 1) [see ODNR, 2012, Figures 20 and 22].
2. Geologic and Geohydrologic Setting
[7] The study area (northeast Ohio around Youngstown) islocated in a stable continental region of North America.Subhorizontal Paleozoic sedimentary strata composed ofcarbonates, evaporates, shale, sandstone, and siltstone ofapproximately 2.7 km thickness overlies the Precambrianbasement. The bedrock units of the study area dip gently(~1°) to the southeast into the Appalachian Basin [ODNR,2012]. The Precambrian crystalline basement in northeastOhio is composed of igneous and metamorphic rocks,extending the ~1.1 billion years old Grenville Provinceexposed to the north in Canada. Geologic structures, includ-ing faults, pervasive in the Grenville terrain, are consideredas the origin of many faults and general structures withinthe overlying sedimentary strata [Baranoski, 2002].[8] Most known fault systems in the study area trend ESE-
WNW [Baranoski, 2002]. The Smith Township fault, locatedabout 20 km southwest of the study area, is the closestknown fault system, which is a northwest-southeastoriented fault with the upthrown side to the northeast[Baranoski, 2002, Map PG-23]. This fault can be mappedon multiple units from the Precambrian surface throughthe Berea Sandstone (Late Devonian) and above based onwell logs and driller's reported formation tops, illustratingthat it has had recurrent movement throughout geologic
Table 1. Recent Potentially Induced Earthquakes Occurring in the United Statesa
Date Time Lat. Long. Depth Magnitude Location
(year-mo-dy) (hh:mm:ss) (ºN) (ºW) (km) (Mw) (references)
2011-11-06 03:53:10 35.53 96.77 5 5.7 Prague, OKb
2011-08-23 05:46:18 37.06 104.70 4 5.3 Trinidad, COc
2011-10-20 12:24:41 28.86 98.08 5 4.8 Fashing, TXd
2012-05-17 08:12:00 31.93 94.37 5 4.8 Timpson, TXe
2011-02-28 05:00:50 35.27 92.34 3 4.7 Guy, ARf
2011-09-11 12:27:44 32.85 100.77 5 4.3 Snyder, TXg
2011-12-31 20:05:01 41.12 80.68 5 3.9 Youngstown, OHh
2009-05-16 16:24:06 32.79 97.02 4 3.3 Dallas-Fort Worth, TXi
aListed according to their magnitudes.bKeranen et al. [2013].cMeremonte et al. [2002], Rubinstein et al. [2012], and Viegas et al. [2012].dBrunt et al. [2012].eBrown et al. [2012].fHorton [2012].gDavis and Pennington [1989], http://www.eas.slu.edu/eqc/eqc_mt/MECH.NA/20110911122745.hODNR [2012].iFrohlich et al. [2011].
KIM: INDUCED SEISMICITY IN YOUNGSTOWN, OHIO
2
time [ODNR, 2012]. Recent earthquakes that occurred innortheast Ohio with well-determined focal mechanismsindicate that left-lateral strike-slip faulting along E-Wtrending, steeply dipping faults are the predominant styleof faulting due to broad-scale ENE-WSW trending horizon-tal compression, σHmax [Nicholson et al., 1988; Zoback andZoback, 1991; Du et al., 2003; Seeber et al., 2004].[9] The earthquakes in this study occurred exclusively in
the Precambrian crystalline basement, whereas the potentialreservoir strata in the injection interval are Paleozoic sedi-mentary rocks of alternating sandstone and dolomite layers.
The Northstar 1 well was drilled into Precambrian granitefor a total depth of 2802 m. The production casing wascemented in at a depth of 2504 m, and the well was com-pleted open hole to depth 2802 m. Open hole electric logsindicate that the two largest porosity zones within the openhole section are the B zone Sandstone of the Knox DolomiteGroup (Ordovician) with a total of 9.8 m net thickness averag-ing 9.4% porosity and the Mt. Simon Sandstone (BasalSandstone) of Conasauga Group (Cambrian), which showed15 m net thickness averaging 10.3% porosity [ODNR, 2012].These two high-porosity zones are considered the reservoirsfor brine injection at the site, although the target fluid injectionzone is the entire open hole section of the well ~298 m (depthinterval between 2504 and 2802 m).[10] Within the Northstar 1 well, the Precambrian was
encountered from a depth of 2741 m through total depthof 2802 m. Just above and at the Precambrian unconformitysurface, porosity and permeability zones are indicated onthe geophysical logs from 2736 to 2742 m depth. These po-rosity zones may be due to weathering of the Precambrianunconformity surface [ODNR, 2012]. The magnetic reso-nance log, which can detect higher and lower permeabilityzones of the rocks, showed a high-permeability zone witha high percentage of moveable fluid in the upper portionof the Precambrian strata (depth 2765–2769 m). Anotherhigh-permeability zone with a high percentage of moveablewater is found from 2773 to 2776 m. At this same depth,high-angle natural fractures or fault zones have been identi-fied from the well log and images. A clear ENE-WSWtrending fracture zone has been identified from compassorientations of natural fractures plotted from fracture andbreakout roseplots during geophysical logging at Northstar1 well [ODNR, 2012].
3. Seismicity
[11] More than 200 felt earthquakes have been noted inOhio since 1776, including at least 15 events that havecaused minor to moderate damage [Stover and Coffman,1993; Hansen, 2012]. The largest and most damaging earth-quake occurred on 9March 1937, in western Ohio, and the M5.4 shock caused notable damage in the town of Anna,Shelby County, where nearly every chimney in town wastoppled. The seismic activity in western Ohio around Annais relatively frequent compared to other parts of Ohio, andhence, the area is referred to as the Anna seismic zone. Anumber of earthquakes have occurred in northeast Ohio; forexample, M 5.0 event on 31 January 1986 near Perry[Nicholson et al., 1988] (see Figure 1), and M 3.8 earthquakeon 13 July 1987 and aMw 3.9 earthquake on 26 January 2001near Ashtabula [Seeber and Armbruster, 1993; Seeber et al.,2004]. The 1987 and 2001 earthquakes in Ashtabula havebeen reported as induced events due to injection of wastefluid at a deep Class I well.[12] There were no earthquakes reported within the study
area (Youngstown, Mahoning County) prior to 2011 [Stoverand Coffman, 1993]. During 17 March through 25November 2011, nine small earthquakes (Mw 1.8–2.7)occurred around Youngstown, Ohio (Figure 1). Although,the locations of these shocks were not very accurate due tosparse seismic station coverage, the shocks occurred closeto an operating deep waste injection well (Northstar 1 well)
Figure 1. Nine earthquakes that occurred in Youngstownarea during March–November 2011 are plotted by solid cir-cles. These shocks were reported by ODNR and are scatteredaround the area. Twelve relocated earthquakes that haveoccurred in the area during March 2011 to January 2012are plotted with open circles. The relocated earthquakesinclude Mw 2.7 shock on 24 December 2011, Mw 3.9 shockon 31 December 2011, and Mw 2.1 shock on 13 January2012, which are recorded by local portable stations, andhence, located accurately by seismic data. Four portable seis-mographic stations deployed during 01 December 2011 to 30April 2012 are plotted with inverted triangles, and a new seis-mographic station YSLD (Youngstown State University) anANSS NetQuake strong motion instrument (solid triangle)are plotted for reference. Deep injection wells in the areaare plotted with solid squares. Only Northstar 1 (NS#1) wasoperational during 2011. (inset) Permanent seismographicstations whose data were used to locate small earthquakesaround Youngstown, Ohio are plotted with (solid triangles).Stations used for focal mechanism inversion are indicatedby their source-receiver paths. Anna indicates Anna westernOhio seismic zone; Perry denotes 31 January 1986M 5 earth-quake; CO2 denotes CO2 No. 1 Well in Tuscawara County;Ashtabula denotes location of 1987 and 2001 earthquakeswhich occurred near the town.
KIM: INDUCED SEISMICITY IN YOUNGSTOWN, OHIO
3
located in Youngstown. The error ellipses of these shockswere up to 1.99 × 1.57 km at 68% confidence level asreported by ODNR (M. Hansen, personal communication,2011). Hence, these shocks were suspected as inducedearthquakes. The seismicity continued, and on 24 December2011, a magnitude 2.7 shock occurred in the study area, whichwas followed by a Mw 3.9 event on 31 December 2011. TheMw 2.1 event on 13 January 2012 was the lastMw> 2.0 earth-quake of the 2011–2012 sequence (Table 2).
3.1. Single Event Location and Location Accuracy
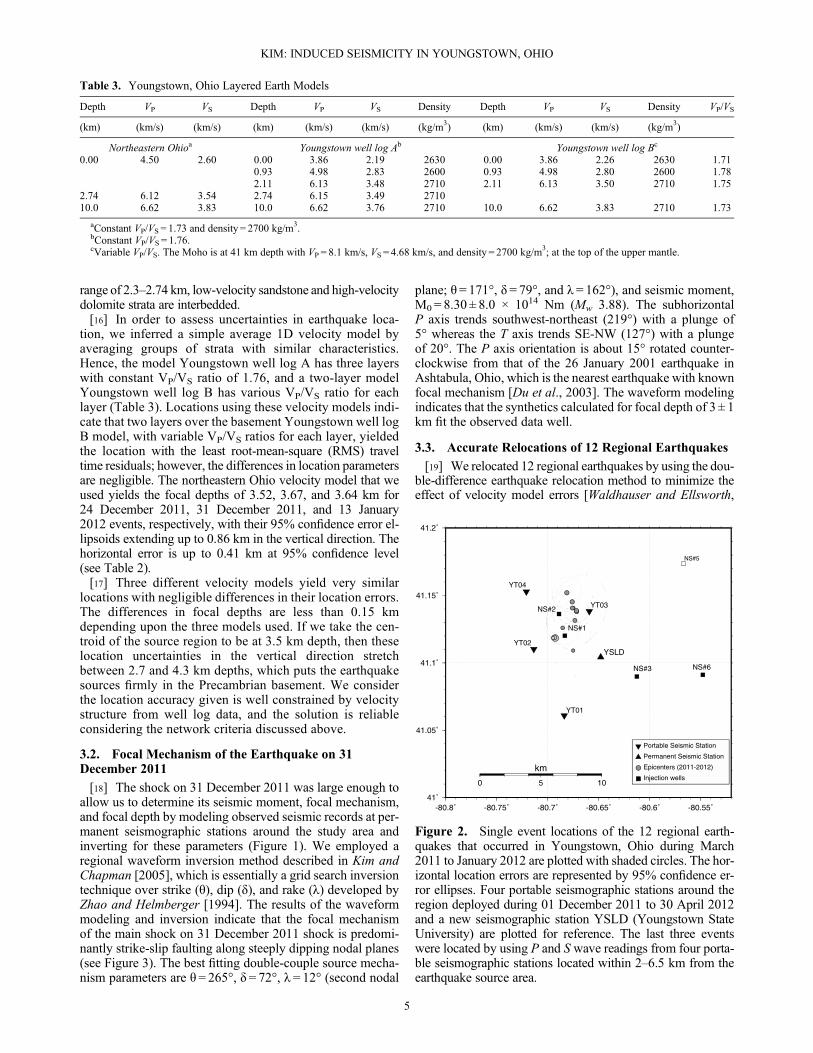
[13] Twelve regional events with Mw ≥ 1.8 that occurredduring 17 March 2011 to 13 January 2012 in Youngtownarea were first located by using HYPOINVERSE [Klein,2007]. The velocity model used for location is an average1D model for northeastern Ohio that consists of the top layerwith P wave velocity of 4.5 km/s and thickness of 2.7 km,and a 7.3 km thick crystalline basement with Pwave velocityof 6.12 km/s [Seeber et al., 2004]. The S wave velocities areconsidered to be VP/√3 (Table 3). All events were locatedwith P and Swave arrival times from at least a dozen seismo-graphic stations around Youngstown, Ohio. For the nineearthquakes during March–November 2011, the nearest sta-tion is at about 60 km, but most stations were at distances100 to 300 km with azimuthal gap of about 90° (Figure 1);hence, the location uncertainties are large—horizontal erroris up to 2.8 km for 95% confidence level as listed inTable 2. The locations of 12 earthquakes with their horizontalerror ellipse are plotted in Figure 2.[14] The last three events among the 12 shocks were also
recorded by a four-station local network deployed during 1December 2011 to 30 April 2012 around the epicentral area
(Figures 1 and 2). Hence, these shocks were accuratelylocated by the local network data. Three shocks exceed thenetwork criteria [e.g., Gomberg et al., 1990], which arebased on the geometry of stations, and can be used to assessthe reliability of the location. For three shocks, the numberof local P or S wave arrival times used for each event weregreater than eight (nobs = 8–10) of which half are S wavearrivals; the greatest azimuthal gap without observationwas less than 180° (gap = 90–120°); distance to the closeststation was less than focal depth (dmin = 1.9 km); and atleast one S wave arrival time was within a distance of about1.4 times the focal depth for good depth constraint[Gomberg et al., 1990]. Three earthquakes that wererecorded both by regional and local networks provide datato assess the event location uncertainty and will be used ina later section to anchor relocation of earlier shocks withno local data coverage.[15] To assess the effect of vertical velocity heterogene-
ities on focal depth and epicenter determination, weconstructed 1D Earth models from the available acousticwell logs in the study area (NS#1 and CO2 No. 1 Well, seeFigure 1). We inferred crustal velocity structure for the top2.74 km of Paleozoic sedimentary rocks in the region (seethe supporting information). The Youngstown well log ve-locity model consists of 19 layers and is characterized byinterbedded high-velocity carbonate rock layers and thicklow-velocity shale strata. The prominent strata are theSalina Group of Upper Silurian formation with interbeddedsalt, anhydrite, dolomite, and shale, which show large ve-locity and density fluctuations, followed by LockportDolomite of Lower Silurian that exhibit very high Pwave ve-locity (see Figure S1). At the injection target interval depth
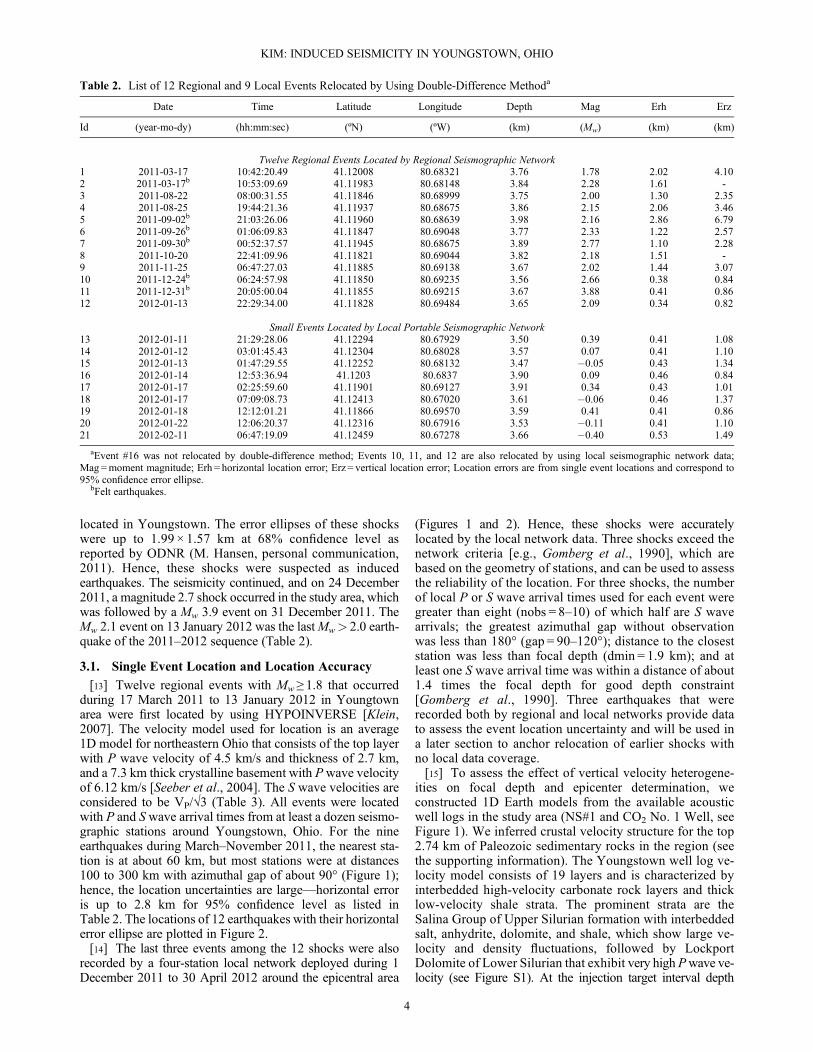
Table 2. List of 12 Regional and 9 Local Events Relocated by Using Double-Difference Methoda
Date Time Latitude Longitude Depth Mag Erh Erz
Id (year-mo-dy) (hh:mm:sec) (ºN) (ºW) (km) (Mw) (km) (km)
Twelve Regional Events Located by Regional Seismographic Network1 2011-03-17 10:42:20.49 41.12008 80.68321 3.76 1.78 2.02 4.102 2011-03-17b 10:53:09.69 41.11983 80.68148 3.84 2.28 1.61 -3 2011-08-22 08:00:31.55 41.11846 80.68999 3.75 2.00 1.30 2.354 2011-08-25 19:44:21.36 41.11937 80.68675 3.86 2.15 2.06 3.465 2011-09-02b 21:03:26.06 41.11960 80.68639 3.98 2.16 2.86 6.796 2011-09-26b 01:06:09.83 41.11847 80.69048 3.77 2.33 1.22 2.577 2011-09-30b 00:52:37.57 41.11945 80.68675 3.89 2.77 1.10 2.288 2011-10-20 22:41:09.96 41.11821 80.69044 3.82 2.18 1.51 -9 2011-11-25 06:47:27.03 41.11885 80.69138 3.67 2.02 1.44 3.0710 2011-12-24b 06:24:57.98 41.11850 80.69235 3.56 2.66 0.38 0.8411 2011-12-31b 20:05:00.04 41.11855 80.69215 3.67 3.88 0.41 0.8612 2012-01-13 22:29:34.00 41.11828 80.69484 3.65 2.09 0.34 0.82
Small Events Located by Local Portable Seismographic Network13 2012-01-11 21:29:28.06 41.12294 80.67929 3.50 0.39 0.41 1.0814 2012-01-12 03:01:45.43 41.12304 80.68028 3.57 0.07 0.41 1.1015 2012-01-13 01:47:29.55 41.12252 80.68132 3.47 �0.05 0.43 1.3416 2012-01-14 12:53:36.94 41.1203 80.6837 3.90 0.09 0.46 0.8417 2012-01-17 02:25:59.60 41.11901 80.69127 3.91 0.34 0.43 1.0118 2012-01-17 07:09:08.73 41.12413 80.67020 3.61 �0.06 0.46 1.3719 2012-01-18 12:12:01.21 41.11866 80.69570 3.59 0.41 0.41 0.8620 2012-01-22 12:06:20.37 41.12316 80.67916 3.53 �0.11 0.41 1.1021 2012-02-11 06:47:19.09 41.12459 80.67278 3.66 �0.40 0.53 1.49
aEvent #16 was not relocated by double-difference method; Events 10, 11, and 12 are also relocated by using local seismographic network data;Mag =moment magnitude; Erh = horizontal location error; Erz = vertical location error; Location errors are from single event locations and correspond to95% confidence error ellipse.
bFelt earthquakes.
KIM: INDUCED SEISMICITY IN YOUNGSTOWN, OHIO
4
range of 2.3–2.74 km, low-velocity sandstone and high-velocitydolomite strata are interbedded.[16] In order to assess uncertainties in earthquake loca-
tion, we inferred a simple average 1D velocity model byaveraging groups of strata with similar characteristics.Hence, the model Youngstown well log A has three layerswith constant VP/VS ratio of 1.76, and a two-layer modelYoungstown well log B has various VP/VS ratio for eachlayer (Table 3). Locations using these velocity models indi-cate that two layers over the basement Youngstown well logB model, with variable VP/VS ratios for each layer, yieldedthe location with the least root-mean-square (RMS) traveltime residuals; however, the differences in location parametersare negligible. The northeastern Ohio velocity model that weused yields the focal depths of 3.52, 3.67, and 3.64 km for24 December 2011, 31 December 2011, and 13 January2012 events, respectively, with their 95% confidence error el-lipsoids extending up to 0.86 km in the vertical direction. Thehorizontal error is up to 0.41 km at 95% confidence level(see Table 2).[17] Three different velocity models yield very similar
locations with negligible differences in their location errors.The differences in focal depths are less than 0.15 kmdepending upon the three models used. If we take the cen-troid of the source region to be at 3.5 km depth, then theselocation uncertainties in the vertical direction stretchbetween 2.7 and 4.3 km depths, which puts the earthquakesources firmly in the Precambrian basement. We considerthe location accuracy given is well constrained by velocitystructure from well log data, and the solution is reliableconsidering the network criteria discussed above.
3.2. Focal Mechanism of the Earthquake on 31December 2011
[18] The shock on 31 December 2011 was large enough toallow us to determine its seismic moment, focal mechanism,and focal depth by modeling observed seismic records at per-manent seismographic stations around the study area andinverting for these parameters (Figure 1). We employed aregional waveform inversion method described in Kim andChapman [2005], which is essentially a grid search inversiontechnique over strike (θ), dip (δ), and rake (λ) developed byZhao and Helmberger [1994]. The results of the waveformmodeling and inversion indicate that the focal mechanismof the main shock on 31 December 2011 shock is predomi-nantly strike-slip faulting along steeply dipping nodal planes(see Figure 3). The best fitting double-couple source mecha-nism parameters are θ= 265°, δ= 72°, λ = 12° (second nodal
plane; θ = 171°, δ= 79°, and λ = 162°), and seismic moment,M0 = 8.30 ± 8.0 × 10¹⁴ Nm (Mw 3.88). The subhorizontalP axis trends southwest-northeast (219°) with a plunge of5° whereas the T axis trends SE-NW (127°) with a plungeof 20°. The P axis orientation is about 15° rotated counter-clockwise from that of the 26 January 2001 earthquake inAshtabula, Ohio, which is the nearest earthquake with knownfocal mechanism [Du et al., 2003]. The waveform modelingindicates that the synthetics calculated for focal depth of 3 ± 1km fit the observed data well.
3.3. Accurate Relocations of 12 Regional Earthquakes
[19] We relocated 12 regional earthquakes by using the dou-ble-difference earthquake relocation method to minimize theeffect of velocity model errors [Waldhauser and Ellsworth,
Figure 2. Single event locations of the 12 regional earth-quakes that occurred in Youngstown, Ohio during March2011 to January 2012 are plotted with shaded circles. The hor-izontal location errors are represented by 95% confidence er-ror ellipses. Four portable seismographic stations around theregion deployed during 01 December 2011 to 30 April 2012and a new seismographic station YSLD (Youngstown StateUniversity) are plotted for reference. The last three eventswere located by using P and S wave readings from four porta-ble seismographic stations located within 2–6.5 km from theearthquake source area.
Table 3. Youngstown, Ohio Layered Earth Models
Depth VP VS Depth VP VS Density Depth VP VS Density VP/VS
(km) (km/s) (km/s) (km) (km/s) (km/s) (kg/m3) (km) (km/s) (km/s) (kg/m3)
Northeastern Ohioa Youngstown well log Ab Youngstown well log Bc
0.00 4.50 2.60 0.00 3.86 2.19 2630 0.00 3.86 2.26 2630 1.710.93 4.98 2.83 2600 0.93 4.98 2.80 2600 1.782.11 6.13 3.48 2710 2.11 6.13 3.50 2710 1.75
2.74 6.12 3.54 2.74 6.15 3.49 271010.0 6.62 3.83 10.0 6.62 3.76 2710 10.0 6.62 3.83 2710 1.73
aConstant VP/VS = 1.73 and density = 2700 kg/m3.bConstant VP/VS = 1.76.cVariable VP/VS. The Moho is at 41 km depth with VP = 8.1 km/s, VS = 4.68 km/s, and density = 2700 kg/m3; at the top of the upper mantle.
KIM: INDUCED SEISMICITY IN YOUNGSTOWN, OHIO
5
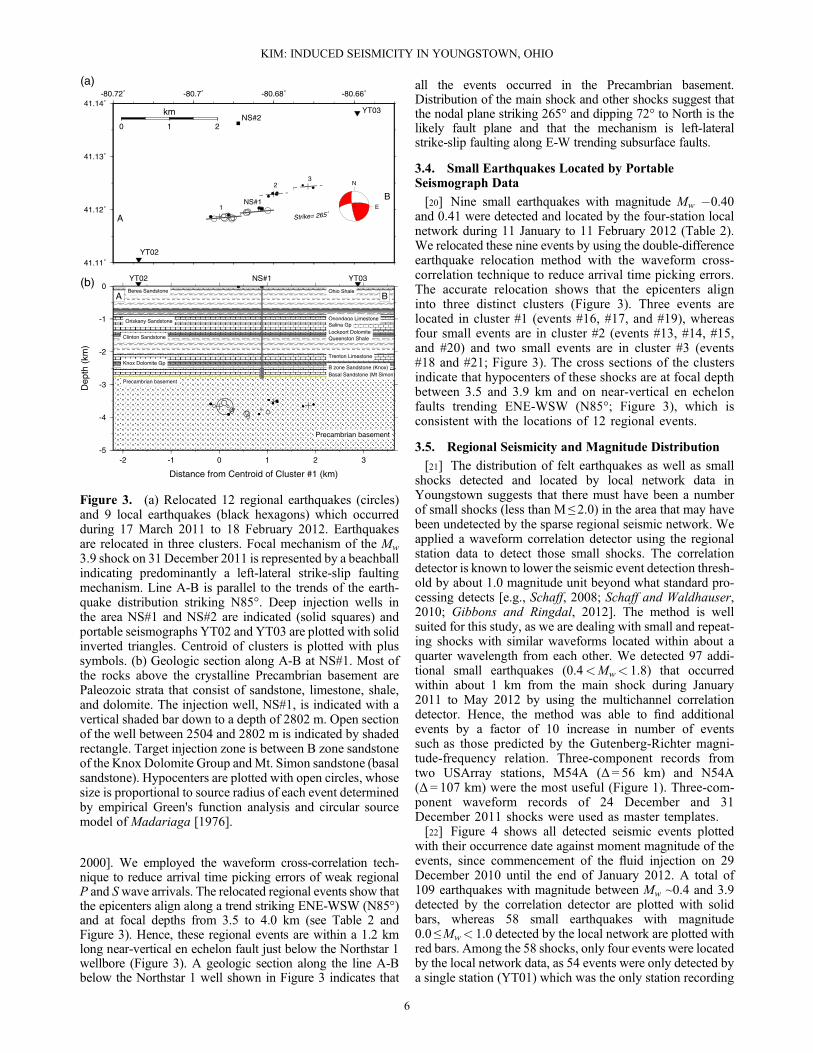
2000]. We employed the waveform cross-correlation tech-nique to reduce arrival time picking errors of weak regionalP and Swave arrivals. The relocated regional events show thatthe epicenters align along a trend striking ENE-WSW (N85°)and at focal depths from 3.5 to 4.0 km (see Table 2 andFigure 3). Hence, these regional events are within a 1.2 kmlong near-vertical en echelon fault just below the Northstar 1wellbore (Figure 3). A geologic section along the line A-Bbelow the Northstar 1 well shown in Figure 3 indicates that
all the events occurred in the Precambrian basement.Distribution of the main shock and other shocks suggest thatthe nodal plane striking 265° and dipping 72° to North is thelikely fault plane and that the mechanism is left-lateralstrike-slip faulting along E-W trending subsurface faults.
3.4. Small Earthquakes Located by PortableSeismograph Data
[20] Nine small earthquakes with magnitude Mw �0.40and 0.41 were detected and located by the four-station localnetwork during 11 January to 11 February 2012 (Table 2).We relocated these nine events by using the double-differenceearthquake relocation method with the waveform cross-correlation technique to reduce arrival time picking errors.The accurate relocation shows that the epicenters aligninto three distinct clusters (Figure 3). Three events arelocated in cluster #1 (events #16, #17, and #19), whereasfour small events are in cluster #2 (events #13, #14, #15,and #20) and two small events are in cluster #3 (events#18 and #21; Figure 3). The cross sections of the clustersindicate that hypocenters of these shocks are at focal depthbetween 3.5 and 3.9 km and on near-vertical en echelonfaults trending ENE-WSW (N85°; Figure 3), which isconsistent with the locations of 12 regional events.
3.5. Regional Seismicity and Magnitude Distribution
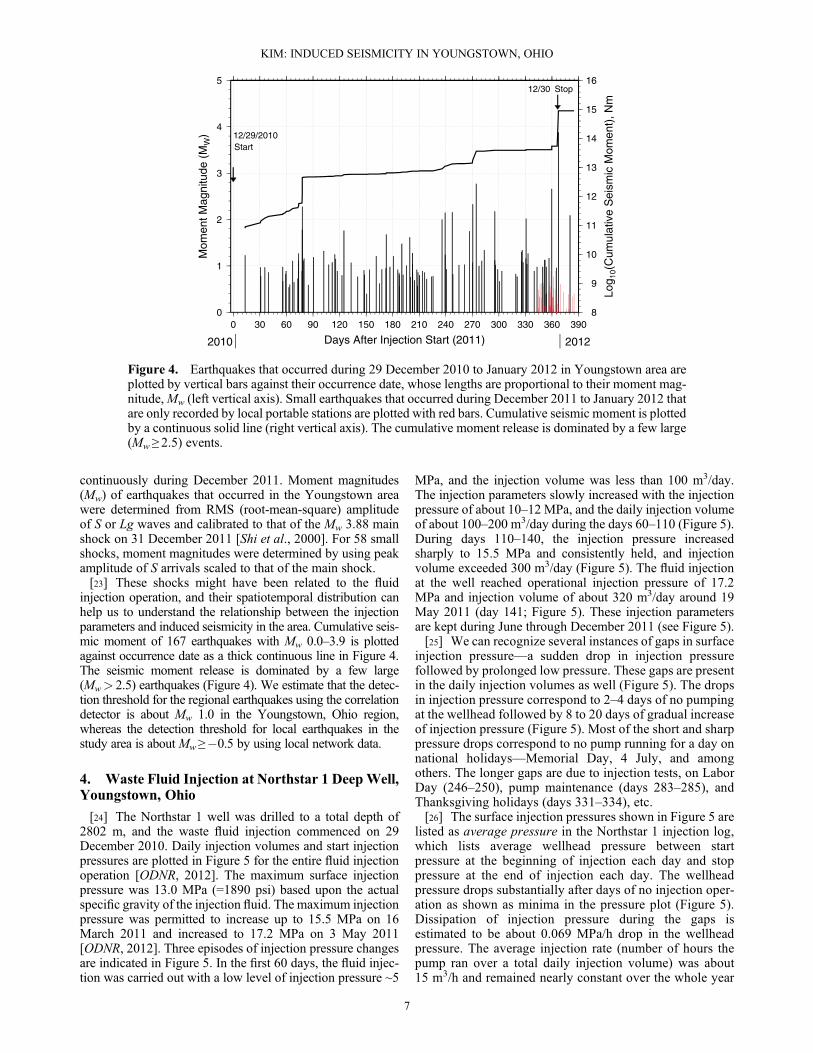
[21] The distribution of felt earthquakes as well as smallshocks detected and located by local network data inYoungstown suggests that there must have been a numberof small shocks (less than M ≤ 2.0) in the area that may havebeen undetected by the sparse regional seismic network. Weapplied a waveform correlation detector using the regionalstation data to detect those small shocks. The correlationdetector is known to lower the seismic event detection thresh-old by about 1.0 magnitude unit beyond what standard pro-cessing detects [e.g., Schaff, 2008; Schaff and Waldhauser,2010; Gibbons and Ringdal, 2012]. The method is wellsuited for this study, as we are dealing with small and repeat-ing shocks with similar waveforms located within about aquarter wavelength from each other. We detected 97 addi-tional small earthquakes (0.4<Mw< 1.8) that occurredwithin about 1 km from the main shock during January2011 to May 2012 by using the multichannel correlationdetector. Hence, the method was able to find additionalevents by a factor of 10 increase in number of eventssuch as those predicted by the Gutenberg-Richter magni-tude-frequency relation. Three-component records fromtwo USArray stations, M54A (Δ= 56 km) and N54A(Δ = 107 km) were the most useful (Figure 1). Three-com-ponent waveform records of 24 December and 31December 2011 shocks were used as master templates.[22] Figure 4 shows all detected seismic events plotted
with their occurrence date against moment magnitude of theevents, since commencement of the fluid injection on 29December 2010 until the end of January 2012. A total of109 earthquakes with magnitude between Mw ~0.4 and 3.9detected by the correlation detector are plotted with solidbars, whereas 58 small earthquakes with magnitude0.0 ≤Mw< 1.0 detected by the local network are plotted withred bars. Among the 58 shocks, only four events were locatedby the local network data, as 54 events were only detected bya single station (YT01) which was the only station recording
Figure 3. (a) Relocated 12 regional earthquakes (circles)and 9 local earthquakes (black hexagons) which occurredduring 17 March 2011 to 18 February 2012. Earthquakesare relocated in three clusters. Focal mechanism of the Mw
3.9 shock on 31 December 2011 is represented by a beachballindicating predominantly a left-lateral strike-slip faultingmechanism. Line A-B is parallel to the trends of the earth-quake distribution striking N85°. Deep injection wells inthe area NS#1 and NS#2 are indicated (solid squares) andportable seismographs YT02 and YT03 are plotted with solidinverted triangles. Centroid of clusters is plotted with plussymbols. (b) Geologic section along A-B at NS#1. Most ofthe rocks above the crystalline Precambrian basement arePaleozoic strata that consist of sandstone, limestone, shale,and dolomite. The injection well, NS#1, is indicated with avertical shaded bar down to a depth of 2802 m. Open sectionof the well between 2504 and 2802 m is indicated by shadedrectangle. Target injection zone is between B zone sandstoneof the Knox Dolomite Group andMt. Simon sandstone (basalsandstone). Hypocenters are plotted with open circles, whosesize is proportional to source radius of each event determinedby empirical Green's function analysis and circular sourcemodel of Madariaga [1976].
KIM: INDUCED SEISMICITY IN YOUNGSTOWN, OHIO
6
continuously during December 2011. Moment magnitudes(Mw) of earthquakes that occurred in the Youngstown areawere determined from RMS (root-mean-square) amplitudeof S or Lg waves and calibrated to that of the Mw 3.88 mainshock on 31 December 2011 [Shi et al., 2000]. For 58 smallshocks, moment magnitudes were determined by using peakamplitude of S arrivals scaled to that of the main shock.[23] These shocks might have been related to the fluid
injection operation, and their spatiotemporal distribution canhelp us to understand the relationship between the injectionparameters and induced seismicity in the area. Cumulative seis-mic moment of 167 earthquakes with Mw 0.0–3.9 is plottedagainst occurrence date as a thick continuous line in Figure 4.The seismic moment release is dominated by a few large(Mw> 2.5) earthquakes (Figure 4). We estimate that the detec-tion threshold for the regional earthquakes using the correlationdetector is about Mw 1.0 in the Youngstown, Ohio region,whereas the detection threshold for local earthquakes in thestudy area is about Mw≥�0.5 by using local network data.
4. Waste Fluid Injection at Northstar 1 DeepWell,Youngstown, Ohio
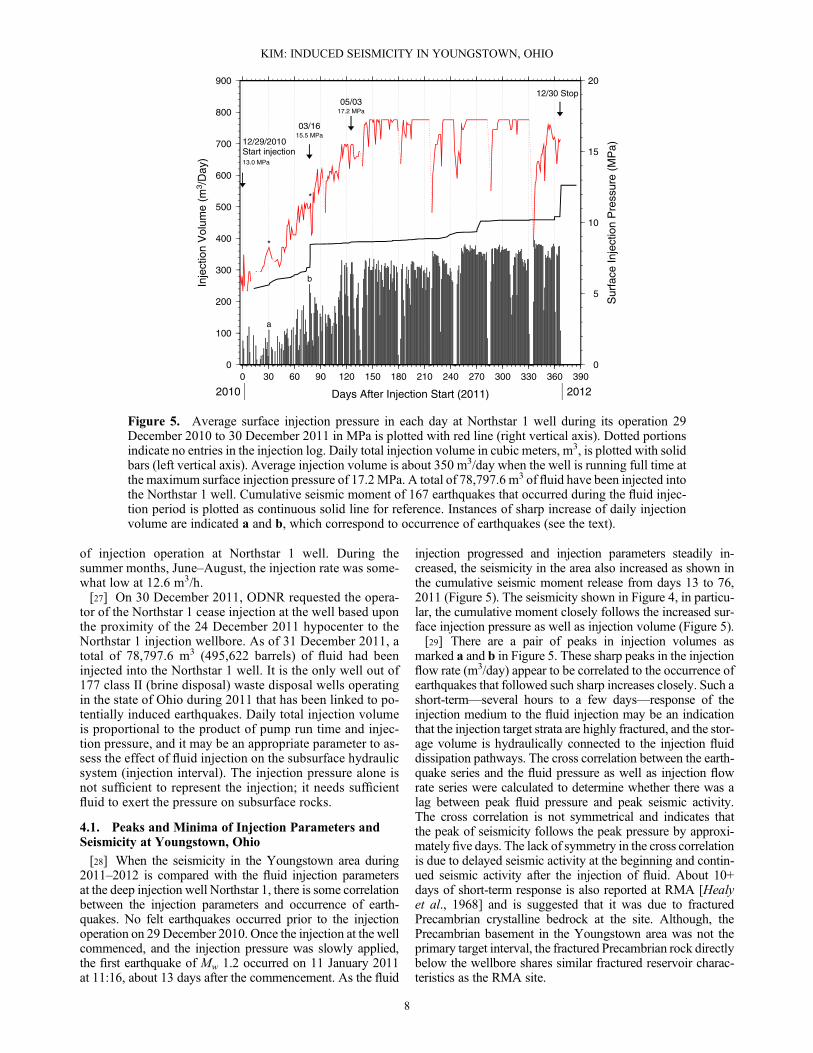
[24] The Northstar 1 well was drilled to a total depth of2802 m, and the waste fluid injection commenced on 29December 2010. Daily injection volumes and start injectionpressures are plotted in Figure 5 for the entire fluid injectionoperation [ODNR, 2012]. The maximum surface injectionpressure was 13.0 MPa (=1890 psi) based upon the actualspecific gravity of the injection fluid. The maximum injectionpressure was permitted to increase up to 15.5 MPa on 16March 2011 and increased to 17.2 MPa on 3 May 2011[ODNR, 2012]. Three episodes of injection pressure changesare indicated in Figure 5. In the first 60 days, the fluid injec-tion was carried out with a low level of injection pressure ~5
MPa, and the injection volume was less than 100 m3/day.The injection parameters slowly increased with the injectionpressure of about 10–12 MPa, and the daily injection volumeof about 100–200 m3/day during the days 60–110 (Figure 5).During days 110–140, the injection pressure increasedsharply to 15.5 MPa and consistently held, and injectionvolume exceeded 300 m3/day (Figure 5). The fluid injectionat the well reached operational injection pressure of 17.2MPa and injection volume of about 320 m3/day around 19May 2011 (day 141; Figure 5). These injection parametersare kept during June through December 2011 (see Figure 5).[25] We can recognize several instances of gaps in surface
injection pressure—a sudden drop in injection pressurefollowed by prolonged low pressure. These gaps are presentin the daily injection volumes as well (Figure 5). The dropsin injection pressure correspond to 2–4 days of no pumpingat the wellhead followed by 8 to 20 days of gradual increaseof injection pressure (Figure 5). Most of the short and sharppressure drops correspond to no pump running for a day onnational holidays—Memorial Day, 4 July, and amongothers. The longer gaps are due to injection tests, on LaborDay (246–250), pump maintenance (days 283–285), andThanksgiving holidays (days 331–334), etc.[26] The surface injection pressures shown in Figure 5 are
listed as average pressure in the Northstar 1 injection log,which lists average wellhead pressure between startpressure at the beginning of injection each day and stoppressure at the end of injection each day. The wellheadpressure drops substantially after days of no injection oper-ation as shown as minima in the pressure plot (Figure 5).Dissipation of injection pressure during the gaps isestimated to be about 0.069 MPa/h drop in the wellheadpressure. The average injection rate (number of hours thepump ran over a total daily injection volume) was about15 m3/h and remained nearly constant over the whole year
Figure 4. Earthquakes that occurred during 29 December 2010 to January 2012 in Youngstown area areplotted by vertical bars against their occurrence date, whose lengths are proportional to their moment mag-nitude,Mw (left vertical axis). Small earthquakes that occurred during December 2011 to January 2012 thatare only recorded by local portable stations are plotted with red bars. Cumulative seismic moment is plottedby a continuous solid line (right vertical axis). The cumulative moment release is dominated by a few large(Mw ≥ 2.5) events.
KIM: INDUCED SEISMICITY IN YOUNGSTOWN, OHIO
7
of injection operation at Northstar 1 well. During thesummer months, June–August, the injection rate was some-what low at 12.6 m3/h.[27] On 30 December 2011, ODNR requested the opera-
tor of the Northstar 1 cease injection at the well based uponthe proximity of the 24 December 2011 hypocenter to theNorthstar 1 injection wellbore. As of 31 December 2011, atotal of 78,797.6 m3 (495,622 barrels) of fluid had beeninjected into the Northstar 1 well. It is the only well out of177 class II (brine disposal) waste disposal wells operatingin the state of Ohio during 2011 that has been linked to po-tentially induced earthquakes. Daily total injection volumeis proportional to the product of pump run time and injec-tion pressure, and it may be an appropriate parameter to as-sess the effect of fluid injection on the subsurface hydraulicsystem (injection interval). The injection pressure alone isnot sufficient to represent the injection; it needs sufficientfluid to exert the pressure on subsurface rocks.
4.1. Peaks and Minima of Injection Parameters andSeismicity at Youngstown, Ohio
[28] When the seismicity in the Youngstown area during2011–2012 is compared with the fluid injection parametersat the deep injection well Northstar 1, there is some correlationbetween the injection parameters and occurrence of earth-quakes. No felt earthquakes occurred prior to the injectionoperation on 29 December 2010. Once the injection at the wellcommenced, and the injection pressure was slowly applied,the first earthquake of Mw 1.2 occurred on 11 January 2011at 11:16, about 13 days after the commencement. As the fluid
injection progressed and injection parameters steadily in-creased, the seismicity in the area also increased as shown inthe cumulative seismic moment release from days 13 to 76,2011 (Figure 5). The seismicity shown in Figure 4, in particu-lar, the cumulative moment closely follows the increased sur-face injection pressure as well as injection volume (Figure 5).[29] There are a pair of peaks in injection volumes as
marked a and b in Figure 5. These sharp peaks in the injectionflow rate (m3/day) appear to be correlated to the occurrence ofearthquakes that followed such sharp increases closely. Such ashort-term—several hours to a few days—response of theinjection medium to the fluid injection may be an indicationthat the injection target strata are highly fractured, and the stor-age volume is hydraulically connected to the injection fluiddissipation pathways. The cross correlation between the earth-quake series and the fluid pressure as well as injection flowrate series were calculated to determine whether there was alag between peak fluid pressure and peak seismic activity.The cross correlation is not symmetrical and indicates thatthe peak of seismicity follows the peak pressure by approxi-mately five days. The lack of symmetry in the cross correlationis due to delayed seismic activity at the beginning and contin-ued seismic activity after the injection of fluid. About 10+days of short-term response is also reported at RMA [Healyet al., 1968] and is suggested that it was due to fracturedPrecambrian crystalline bedrock at the site. Although, thePrecambrian basement in the Youngstown area was not theprimary target interval, the fractured Precambrian rock directlybelow the wellbore shares similar fractured reservoir charac-teristics as the RMA site.
Figure 5. Average surface injection pressure in each day at Northstar 1 well during its operation 29December 2010 to 30 December 2011 in MPa is plotted with red line (right vertical axis). Dotted portionsindicate no entries in the injection log. Daily total injection volume in cubic meters, m3, is plotted with solidbars (left vertical axis). Average injection volume is about 350 m3/day when the well is running full time atthe maximum surface injection pressure of 17.2MPa. A total of 78,797.6 m3 of fluid have been injected intothe Northstar 1 well. Cumulative seismic moment of 167 earthquakes that occurred during the fluid injec-tion period is plotted as continuous solid line for reference. Instances of sharp increase of daily injectionvolume are indicated a and b, which correspond to occurrence of earthquakes (see the text).
KIM: INDUCED SEISMICITY IN YOUNGSTOWN, OHIO
8
4.1.1. Quiescence of Seismicity and Minima of FluidInjection Pressure[30] There are quiescences in seismicity during certain time
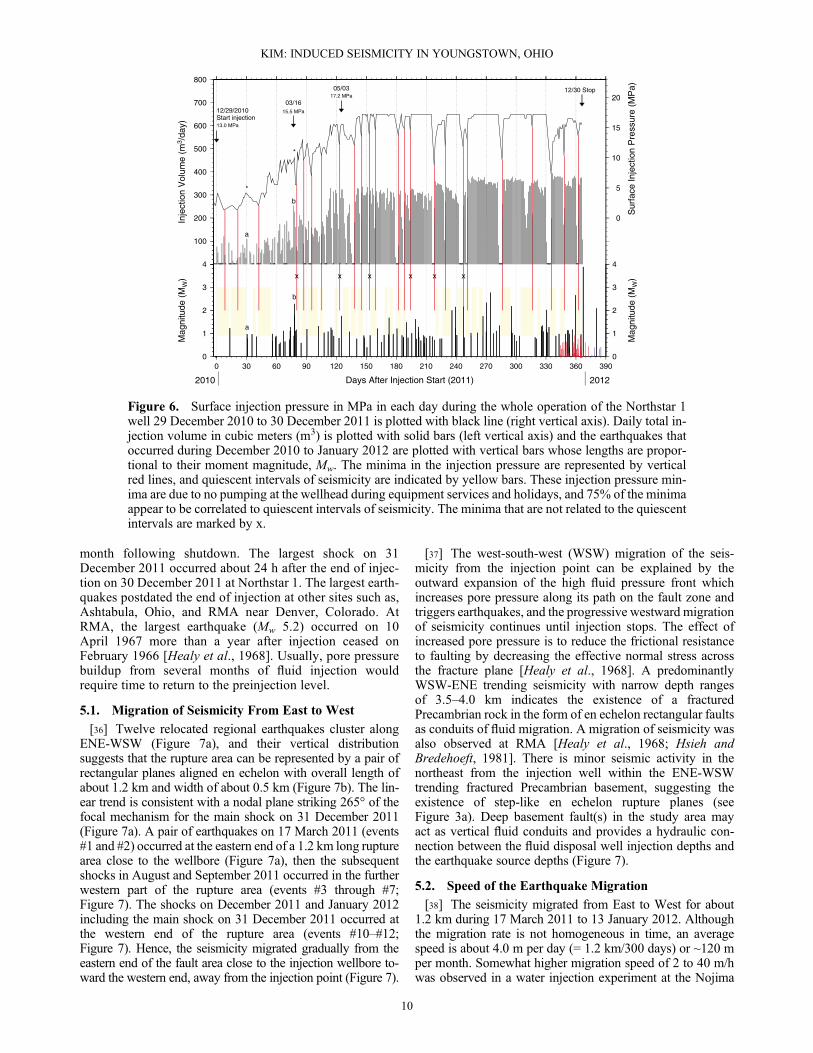
intervals such as days: 285–296 and 305–320 (see Figure 4),as marked with yellow bars in Figure 6. Those quiescent pe-riods are defined as time intervals at least four consecutivedays without earthquakes (Mw ≥ 0.9), and they appear to fol-low the minima in the injection pressure as represented by ver-tical red lines in Figure 6. Although not all the injectionpressure minima correlate with the quiescence in seismicity,75% of the pressure minima (18 out of 24 minima) fall withinthe quiescent intervals (Figure 6), whereas about 62% of thequiescent intervals (18 out of 29 intervals) are associated withthe pressure minima (Figure 6). We suggest that the cessationof fluid injection may have caused quiescences of earthquakesas illustrated in Figure 6. We are unable to model such behav-ior with reservoir analysis due to lack of detailed knowledgeon the ambient pore pressure at the Northstar 1 well [e.g.,Hsieh and Bredehoeft, 1981].
4.2. Physical Basis of the Induced Seismicity inYoungstown, Ohio
[31] The basic mechanism for initiation of induced earth-quakes during fluid injection into deep wells is well under-stood [e.g., Hubbert and Rubey, 1959; Healy et al., 1968;Raleigh et al., 1976]: tectonic strain stored in the basementrock is released via earthquakes that are triggered by theinjection of fluid into the basement rock. The Mohr-Coulomb fracture criterion may be written as [Healy et al.,1968; Yeats et al., 1997]:
τ ¼ τ0 þ μσn; (1)
where τ is the shear stress on the fault plane at failure, τ0 isthe fracture cohesion, μ is the coefficient of friction, and σnis the effective normal stress. Under the presence of porepressure, the effective normal stress consists of two parts, apore pressure P and the total stress S; hence, σn = (Sn � P),in which Sn is the total normal stress acting on the fault plane,and P is the pressure of the ambient fluid [Healy et al., 1968].For fault slip on preexisting faults, the cohesive strength (τ0)is taken to be close to zero [Zoback and Healy, 1984; Zoback,1992]. μ ranges from 0.6 to 1.0 [Zoback and Townend,2001], and Byerlee [1978] reports μ = 0.85 for a variety ofrock types at normal stress up to 200 MPa. The right sideof the equation consists of a frictional term μ (Sn � P), plusthe cohesive strength, τ0 and, hence as long as the right sideis greater than the shear stress (τ), fault slip will not occur.This empirical relation indicates that the effect of increasingpore pressure is to reduce the friction resistance to fault slipby decreasing the effective normal stress (σn) acting on thefault plane.[32] If the area has preexisting weak zones (fractures
and faults), and the area is already close to failure, thena small increase in pore pressure would trigger earthquakes.Therefore, the gaps in injection parameters at the Northstar1 well reduced the pore pressure (P) in the above equationand effectively strengthened the friction resistance on thesubsurface fault. This leads to reduced size and number oftriggered earthquakes and the quiescence in seismicity asshown in Figure 6.
[33] The parameters in the above equation can be evaluatedfor the Youngstown area on the basis of the followingassumptions and relations between τ, σn, and the principalstresses. For strike-slip faulting in Youngstown area, the least(S3) and greatest (S1) principal stresses are horizontal [Yeatset al., 1997]. We take the least principal stress (S3) to be thebottom hole pressure (BHP) of 27.5 MPa (=1000 kg/m3 × 9.8 m/s2 × 2802 m); the intermediate principal stress S2is vertical and equal to the lithostatic pressure (mainly over-burden) [Healy et al., 1968]. S2 at the bottom of injection wellat 2802 m is 74.1 MPa (=2700 kg/m3 × 9.8 m/s2 × 2802 m).The greatest principal stress S1 must be at least 74.1 MPa.Estimates of the pore pressure before the fluid injection (P)at the Northstar 1 well is unknown. If we take a similar valueto that of RMA well, which was about 75% of the BHP, P is20.6 MPa (=27.5 MPa x 0.75) which corresponds to the staticfluid level of 700 m below the wellhead after injection stopped[Hsieh and Bredehoeft, 1981]. From the Mohr failure enve-lope, the shear and effective normal stresses are given as[Healy et al., 1968; Yeats et al., 1997]:
τ ¼ S1 � S3ð Þ2
sin 2α (2)
σn ¼ S1 þ S3 � 2Pð Þ2
þ S1 � S3ð Þ2
cos 2α (3)
where α is the angle between the fault plane and the planenormal to σ1. α ~ 45° for the strike-slip focal mechanismwith P axis trending 219° and fault plane striking 265°given in the previous section for Youngstown area. GivenS1 = 74.1 MPa, S3 = 27.5 MPa, P = 20.6 MPa, and α= 45°,the shear and effective normal stresses on a potential faultplane are τ =28.3 MPa and σn=30.2 MPa. Therefore,according to the Mohr-Coulomb failure criterion, the cohesivestrength, τ0 would have to be at least 2.6 MPa to prevent faultslip in the reservoir rocks in Youngstown area prior to fluid in-jection. If the cohesive strength is taken to be τ0 = 0 on thefault plane, then pore pressure (P) must be less than ~17.5MPa to prevent failure.[34] Average injection pressure of 7.5MPa for two days and
a daily total injection volume of 102 m3/day may have trig-gered an Mw 1.0 shock on 3 February 2011 (day 35,Figure 6). If we use this injection pressure, the pore pressureis raised to 35.5 MPa (27.5 MPa + 7.5 MPa; BHP plussurface injection pressure), and it yields; τ = 28.3 MPa,σn=15.3 MPa, and τ0 = 15.3 MPa. The occurrence of faultingupon reduction of the frictional term due to increased porepressure indicates a value for τ0 of 15.3 MPa or less. This iscomparable to τ0 = 15.1 MPa estimated for the RMA [Healyet al., 1968]. The cohesive strength for crystalline basementrocks is about 50 MPa [Healy et al., 1968]. The cohesivestrength of 15.3 MPa may be reasonable for the fracturedinjection media at the Youngtown area, which appears to befractured Precambrian rocks with preexisting fault or fracturezones, to hold the fault together.
5. Discussion
[35] The earthquakes did not stop immediately after theshutdown of the injection operation at Northstar 1, althoughthe rate and size of earthquakes steadily dropped within a
KIM: INDUCED SEISMICITY IN YOUNGSTOWN, OHIO
9
month following shutdown. The largest shock on 31December 2011 occurred about 24 h after the end of injec-tion on 30 December 2011 at Northstar 1. The largest earth-quakes postdated the end of injection at other sites such as,Ashtabula, Ohio, and RMA near Denver, Colorado. AtRMA, the largest earthquake (Mw 5.2) occurred on 10April 1967 more than a year after injection ceased onFebruary 1966 [Healy et al., 1968]. Usually, pore pressurebuildup from several months of fluid injection wouldrequire time to return to the preinjection level.
5.1. Migration of Seismicity From East to West
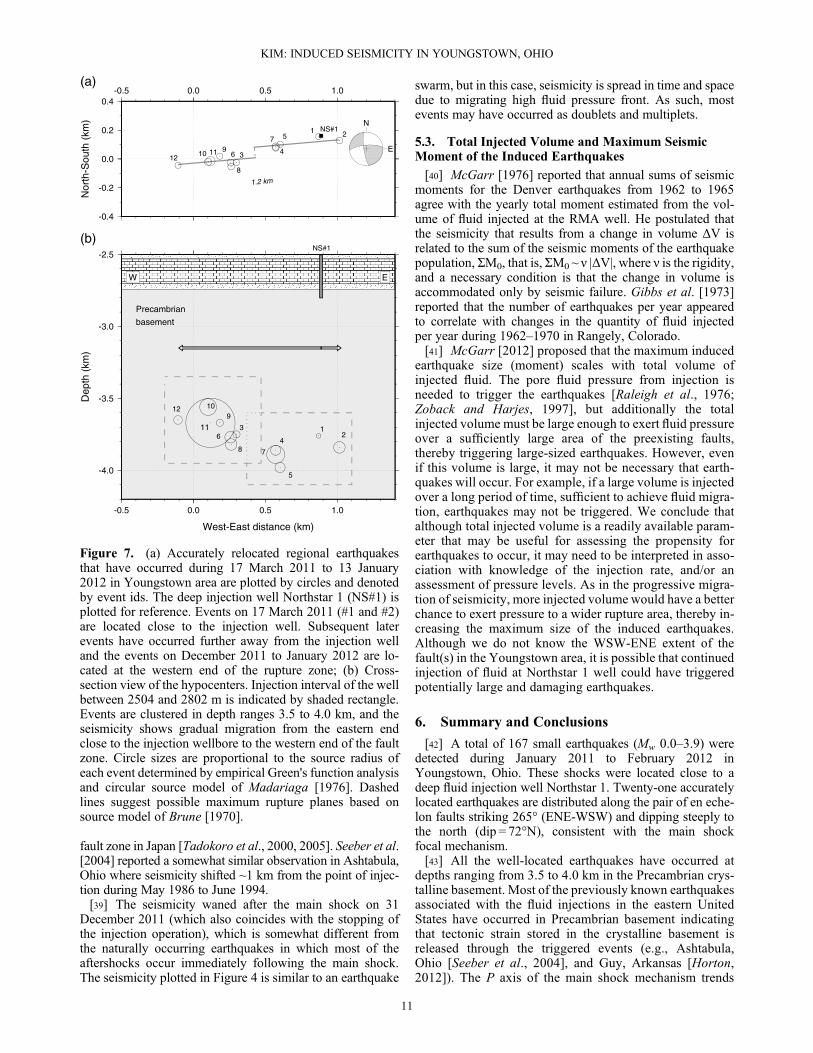
[36] Twelve relocated regional earthquakes cluster alongENE-WSW (Figure 7a), and their vertical distributionsuggests that the rupture area can be represented by a pair ofrectangular planes aligned en echelon with overall length ofabout 1.2 km and width of about 0.5 km (Figure 7b). The lin-ear trend is consistent with a nodal plane striking 265° of thefocal mechanism for the main shock on 31 December 2011(Figure 7a). A pair of earthquakes on 17 March 2011 (events#1 and #2) occurred at the eastern end of a 1.2 km long rupturearea close to the wellbore (Figure 7a), then the subsequentshocks in August and September 2011 occurred in the furtherwestern part of the rupture area (events #3 through #7;Figure 7). The shocks on December 2011 and January 2012including the main shock on 31 December 2011 occurred atthe western end of the rupture area (events #10–#12;Figure 7). Hence, the seismicity migrated gradually from theeastern end of the fault area close to the injection wellbore to-ward the western end, away from the injection point (Figure 7).
[37] The west-south-west (WSW) migration of the seis-micity from the injection point can be explained by theoutward expansion of the high fluid pressure front whichincreases pore pressure along its path on the fault zone andtriggers earthquakes, and the progressive westward migrationof seismicity continues until injection stops. The effect ofincreased pore pressure is to reduce the frictional resistanceto faulting by decreasing the effective normal stress acrossthe fracture plane [Healy et al., 1968]. A predominantlyWSW-ENE trending seismicity with narrow depth rangesof 3.5–4.0 km indicates the existence of a fracturedPrecambrian rock in the form of en echelon rectangular faultsas conduits of fluid migration. A migration of seismicity wasalso observed at RMA [Healy et al., 1968; Hsieh andBredehoeft, 1981]. There is minor seismic activity in thenortheast from the injection well within the ENE-WSWtrending fractured Precambrian basement, suggesting theexistence of step-like en echelon rupture planes (seeFigure 3a). Deep basement fault(s) in the study area mayact as vertical fluid conduits and provides a hydraulic con-nection between the fluid disposal well injection depths andthe earthquake source depths (Figure 7).
5.2. Speed of the Earthquake Migration
[38] The seismicity migrated from East to West for about1.2 km during 17 March 2011 to 13 January 2012. Althoughthe migration rate is not homogeneous in time, an averagespeed is about 4.0 m per day (= 1.2 km/300 days) or ~120 mper month. Somewhat higher migration speed of 2 to 40 m/hwas observed in a water injection experiment at the Nojima
Figure 6. Surface injection pressure in MPa in each day during the whole operation of the Northstar 1well 29 December 2010 to 30 December 2011 is plotted with black line (right vertical axis). Daily total in-jection volume in cubic meters (m3) is plotted with solid bars (left vertical axis) and the earthquakes thatoccurred during December 2010 to January 2012 are plotted with vertical bars whose lengths are propor-tional to their moment magnitude, Mw. The minima in the injection pressure are represented by verticalred lines, and quiescent intervals of seismicity are indicated by yellow bars. These injection pressure min-ima are due to no pumping at the wellhead during equipment services and holidays, and 75% of the minimaappear to be correlated to quiescent intervals of seismicity. The minima that are not related to the quiescentintervals are marked by x.
KIM: INDUCED SEISMICITY IN YOUNGSTOWN, OHIO
10
fault zone in Japan [Tadokoro et al., 2000, 2005]. Seeber et al.[2004] reported a somewhat similar observation in Ashtabula,Ohio where seismicity shifted ~1 km from the point of injec-tion during May 1986 to June 1994.[39] The seismicity waned after the main shock on 31
December 2011 (which also coincides with the stopping ofthe injection operation), which is somewhat different fromthe naturally occurring earthquakes in which most of theaftershocks occur immediately following the main shock.The seismicity plotted in Figure 4 is similar to an earthquake
swarm, but in this case, seismicity is spread in time and spacedue to migrating high fluid pressure front. As such, mostevents may have occurred as doublets and multiplets.
5.3. Total Injected Volume and Maximum SeismicMoment of the Induced Earthquakes
[40] McGarr [1976] reported that annual sums of seismicmoments for the Denver earthquakes from 1962 to 1965agree with the yearly total moment estimated from the vol-ume of fluid injected at the RMA well. He postulated thatthe seismicity that results from a change in volume ΔV isrelated to the sum of the seismic moments of the earthquakepopulation, ΣM0, that is, ΣM0~ ν |ΔV|, where ν is the rigidity,and a necessary condition is that the change in volume isaccommodated only by seismic failure. Gibbs et al. [1973]reported that the number of earthquakes per year appearedto correlate with changes in the quantity of fluid injectedper year during 1962–1970 in Rangely, Colorado.[41] McGarr [2012] proposed that the maximum induced
earthquake size (moment) scales with total volume ofinjected fluid. The pore fluid pressure from injection isneeded to trigger the earthquakes [Raleigh et al., 1976;Zoback and Harjes, 1997], but additionally the totalinjected volume must be large enough to exert fluid pressureover a sufficiently large area of the preexisting faults,thereby triggering large-sized earthquakes. However, evenif this volume is large, it may not be necessary that earth-quakes will occur. For example, if a large volume is injectedover a long period of time, sufficient to achieve fluid migra-tion, earthquakes may not be triggered. We conclude thatalthough total injected volume is a readily available param-eter that may be useful for assessing the propensity forearthquakes to occur, it may need to be interpreted in asso-ciation with knowledge of the injection rate, and/or anassessment of pressure levels. As in the progressive migra-tion of seismicity, more injected volume would have a betterchance to exert pressure to a wider rupture area, thereby in-creasing the maximum size of the induced earthquakes.Although we do not know the WSW-ENE extent of thefault(s) in the Youngstown area, it is possible that continuedinjection of fluid at Northstar 1 well could have triggeredpotentially large and damaging earthquakes.
6. Summary and Conclusions
[42] A total of 167 small earthquakes (Mw 0.0–3.9) weredetected during January 2011 to February 2012 inYoungstown, Ohio. These shocks were located close to adeep fluid injection well Northstar 1. Twenty-one accuratelylocated earthquakes are distributed along the pair of en eche-lon faults striking 265° (ENE-WSW) and dipping steeply tothe north (dip = 72°N), consistent with the main shockfocal mechanism.[43] All the well-located earthquakes have occurred at
depths ranging from 3.5 to 4.0 km in the Precambrian crys-talline basement. Most of the previously known earthquakesassociated with the fluid injections in the eastern UnitedStates have occurred in Precambrian basement indicatingthat tectonic strain stored in the crystalline basement isreleased through the triggered events (e.g., Ashtabula,Ohio [Seeber et al., 2004], and Guy, Arkansas [Horton,2012]). The P axis of the main shock mechanism trends
Figure 7. (a) Accurately relocated regional earthquakesthat have occurred during 17 March 2011 to 13 January2012 in Youngstown area are plotted by circles and denotedby event ids. The deep injection well Northstar 1 (NS#1) isplotted for reference. Events on 17 March 2011 (#1 and #2)are located close to the injection well. Subsequent laterevents have occurred further away from the injection welland the events on December 2011 to January 2012 are lo-cated at the western end of the rupture zone; (b) Cross-section view of the hypocenters. Injection interval of the wellbetween 2504 and 2802 m is indicated by shaded rectangle.Events are clustered in depth ranges 3.5 to 4.0 km, and theseismicity shows gradual migration from the eastern endclose to the injection wellbore to the western end of the faultzone. Circle sizes are proportional to the source radius ofeach event determined by empirical Green's function analysisand circular source model of Madariaga [1976]. Dashedlines suggest possible maximum rupture planes based onsource model of Brune [1970].
KIM: INDUCED SEISMICITY IN YOUNGSTOWN, OHIO
11
NE-SW and corresponds to horizontal compression (σHmax)which is slightly rotated from the ENE-WSW trendingbroad-scale regional stress field in the northeastern UnitedStates [Du et al., 2003; Zoback and Zoback, 1991].[44] The first detected earthquake (Mw 1.2) occurred on 11
January 2011, 13 days after the commencement of injectionat Northstar 1 well. At that time, a total of ~700 m3 of fluidhad been injected at a rate of up to 5 m3/h, and the surfaceinjection pressure was up to 13.5 MPa. Total injection vol-ume was a very small quantity when it started to trigger anearthquake, and the injection pressure was relatively low,and hence, there must have been nearly direct fluid conduitsto the ENE-WSW trending fault very close to the injectionwellbore, and the subsurface condition at the Precambrianbasement may have been near critical for the earthquakes tooccur. The cross correlation between the earthquake seriesand the injection flow rate series indicates that the peak ofseismicity follows the peak pressure with approximately fivedays lag. This short-term response of the injection media atYoungstown is similar to an observation at RMA whereabout 10 days of time lag in earthquake occurrences wasobserved following fluid injection [Healy et al., 1968].[45] We conclude that the recent, 2011–2012, earthquakes
in Youngstown, Ohio were induced by the fluid injection atNorthstar 1 deep injection well due to increased pore pressurealong the preexisting (ENE-WSW trending) faults locatedclose to the wellbore in the Precambrian basement. This isbased on the facts that: (1) well-located earthquakes clusteredin a narrow zone along the fault trace striking ENE-WSW inthe Precambrian basement (Figures 3 and 6); (2) migrationof seismicity from the east—close to the injection point,toward the west—away from the wellbore, indicating thatthe expanding high fluid pressure front increased the porepressure along its ENE-WSW trending path and progres-sively triggered the earthquakes; (3) occurrence of earth-quakes was generally correlated with the total dailyinjection volume and injection pressure, and a pair of peaksin the injection parameters appears to be correlated with theoccurrence of earthquakes at the early stage of fluid injectionwhen the subsurface hydraulic system started to build uppore pressure; (4) 75% of the minima in surface injectionpressure (no pumping operations) appeared to correlate withquiescent intervals of seismicity, which may indicate that theearthquakes were caused by the pressure buildup in thefractured Precambrian basement and stopped when pressuredropped; and (5) a short-term response of the injectionmedia to the fluid injection parameters on the time scale ofhours to few days (5+) suggests that the site behaved as afractured Precambrian reservoir as in the Rocky MountainArsenal, Colorado.
[46] Acknowledgments. John Armbruster at Lamont-Doherty EarthObservatory of Columbia University (LDEO) led fieldwork inYoungstown, Ohio and processed raw data during January–March 2012.Chris Grope at Youngstown State University participated in the fieldworkand helped in portable station service and data retrieval. Mike Hansen andTim Leftwitch of the Ohio Division of Geological Survey, OhioDepartment of Natural Resources, helped to carry out the fieldwork andsupported this study, as well as provided well log data and other materialfor the study. Jeffrey Dick of Youngstown State University helped us todeploy a NetQuake station, YSLD, at the campus. Larry Smyers of D&LEnergy Inc. provided a spreadsheet of injection parameters at Northstar 1well. Paul Richards and Heather Savage at LDEO provided critical com-ments that improved the paper. Alberto Malinverno helped to interpret welllogging data. I thank Bill Menke for helping me with Poisson distribution.
Stephen Holtkamp and Michael Brudzinski of Miami University of Ohioshared their result of regional event detection which helped us to solidifydetection of regional events down toMw ~0.5. Mitchell Gold of LDEO readthe manuscript and provided editorial help. Bill Leith of U.S. GeologicalSurvey supported the field work, and Bill Ellsworth and Art McGarr ofUSGS provided useful comments. The U.S. Geological Survey hasprovided partial support for this study under contract G10AC00094. Thisis Lamont-Doherty Earth Observatory contribution 7681.
ReferencesAke, J., K. Mahrer, D. O'Connell, and L. Block (2005), Deep-injection andclosely monitored induced seismicity at Paradox Valley, Colorado, Bull.Seismol. Soc. Am., 95, 664–683.
Baranoski, M. T. (2002), Structure contour map on the Precambrianunconformity surface in Ohio and related basement features, report,Div. Geol. Surv. Map PG-23, scale 1:500,000, Ohio Dep. of Nat.lResour., Columbus. [Available at http://www.dnr.state.oh.us/Portals/10/pdf/mappg23.pdf.]
Brown, W. A., C. A. Frohlich, W. L. Ellsworth, J. H. Luetgert, andM. R. Brunt (2012), The May 17th, 2012 M4.8 earthquake nearTimpson, east Texas: Was it natural or was it induced?, AbstractS53I-06 presented at 2012 Fall Meeting, AGU, San Francisco, Calif.,3–7 Dec.
Brune, J. N. (1970), Tectonic stress and the spectra of seismic shear wavesfrom earthquakes, J. Geophys. Res., 75, 4997–5009.
Brunt, M. R., W. A. Brown, and C. A. Frohlich (2012), Felt reportsand intensity maps for two M4.8 Texas earthquakes: 17 May 2012near Timpson and 20 October 2011 near Fashing, Abstract S51E-2454 presented at 2012 Fall Meeting, AGU, San Francisco, Calif.,3–7 Dec.
Byerlee, J. D. (1978), Friction of rocks, Pure Appl. Geophys., 116, 615–626.Davis, S. D., and W. D. Pennington (1989), Induced seismic deformation inthe Cogdell oil field of west Texas, Bull. Seismol. Soc. Am., 79,1477–1495.
Du, W.-X., W.-Y. Kim, and L. R. Sykes (2003), Earthquake source parame-ters and state of stress for northeastern United States and southeasternCanada from analysis of regional seismograms, Bull. Seismol. Soc. Am.,93, 1633–1648.
Ellsworth, W. L., S. H. Hickman, A. L. Llenos, A. McGarr, A. J. Michael, andJ. L. Rubinstein (2012), Are seismicity rate changes in the midcontinentnatural or manmade?, paper presented at 2012 Seismological Society ofAmerica Annual Meeting, San Diego, Calif.
Frohlich, C., C. Hayward, B. Stump, and E. Potter (2011), The Dallas-FortWorth earthquake sequence: October 2008 through May 2009, Bull.Seismol. Soc. Am., 101, 327–340.
Gibbons, S. J., and F. Ringdal (2012), Seismic monitoring of the North Koreanuclear test site using a multichannel correlation detector, IEEE Trans.Geosci. Remote Sens., 50, 1897–1909, doi:10.1109/TGRS.2011.2170429.
Gibbs, J. F., J. H. Healy, C. B. Raleigh, and J. Coakley (1973), Seismicity inthe Rangely, Colorado, area: 1962–1970, Bull. Seismol. Soc. Am., 63,1557–1570.
Gomberg, J. S., K. M. Shedlock, and S. W. Roecker (1990), The effect of S-wave arrival times on the accuracy of hypocenter estimation, Bull.Seismol. Soc. Am., 80, 1605–1628.
Hansen, M. C. (2012), Earthquakes in Ohio, Educ. Leaflet 9, Div. of Geol.Surv., Ohio Dep. of Nat. Resour., Columbus. [Available at http://www.dnr.state.oh.us/Portals/10/pdf/EL/el09.pdf.]
Hansen, M. C., and L. J. Ruff (2003), The Ohio seismic network, Seismol.Res. Lett., 74, 561–564.
Healy, J. T., W. W. Rubey, D. T. Griggs, and C. B. Raleigh (1968), TheDenver earthquakes, Science, 161, 1301–1310.
Herrmann, R. B., S.-K. Park, and C.-Y. Wang (1981), The Denver earth-quakes of 1967–1968, Bull. Seismol. Soc. Am., 71, 731–745.
Horton, S. (2012), Disposal of hydrofracking waste fluid by injection intosubsurface aquifers triggers earthquake swarm in central Arkansas withpotential for damaging earthquake, Seismol. Res. Lett., 83, 250–260,doi:10.1785/gssrl.83.2.250.
Hsieh, P. A., and J. S. Bredehoeft (1981), A reservoir analysis of the Denverearthquakes—A case study of induced seismicity, J. Geophys. Res., 86,903–920.
Hubbert, M. K., and W. W. Rubey (1959), Role of fluid pressure in mechan-ics of overthrust faulting, Geol. Soc. Am. Bull., 70, 115–206.
Keranen, K., H. M. Savage, G. Abers, and E. S. Cochran (2013), Potentiallyinduced earthquakes in Oklahoma, USA: Links between wastewater injec-tion and the 2011 MW 5.7 earthquake sequence, Geology, 41, 699–702,doi:10.1130/G34045.1.
Kim, W.-Y., and M. Chapman (2005), The 9 December 2003 centralVirginia earthquake sequence: A compound earthquake in the centralVirginia seismic zone, Bull. Seismol. Soc. Am., 95, 2428–2445.
KIM: INDUCED SEISMICITY IN YOUNGSTOWN, OHIO
12
Klein, F. W. (2007), User's guide to HYPOINVERSE-2000, a Fortran pro-gram to solve for earthquake locations and magnitudes, U.S. Geol. Surv.Open File Rep., 02-171, 121 pp.
Madariaga, R. (1976), Dynamics of an expanding circular fault, Bull.Seismol. Soc. Am., 66, 639–666.
McGarr, A. (1976), Seismic moments and volume changes, J. Geophys.Res., 81, 1487–1494.
McGarr, A. (2012), Factors influencing the seismic hazard of earthquakesinduced by fluid injection at depth, paper presented at SPE/SEGWorkshop on Injection Induced Seismicity, Soc. of Pet. Eng.,Broomfield, Colo, 12–14 Sept. 2012.
McGarr, A., D. Simpson, and L. Seeber (2002), Case histories of inducedand triggered seismicity, in International Handbook of Earthquake andEngineering Seismology, edited by W. Lee, H. Kanamori, P. Jennings,and C. Kisslinger, chap. 40, pp. 647–664, Academic Press, London.
Meremonte, M. E., J. C. Lahr, A. D. Frankel, J. W. Dewey, A. J. Crone,D. E. Overturf, D. L. Carver, and W. T. Bice (2002), Investigation of anearthquake swarm near Trinidad, Colorado, August–October 2001, U.S.Geol. Surv. Open File Rep., 02-0073.
National Academy of Sciences (2012), Induced Seismicity Potential inEnergy Technologies, 225 pp., Natl. Acad. Press, Washington, D. C.
Nicholson, C., and R. L. Wesson (1992), Triggered earthquakes and deepwell activities, Pure Appl. Geophys., 139, 561–578.
Nicholson, C., E. Roeloffs, and R. L. Wesson (1988), The northeastern Ohioearthquake of 31 January 1986: Was it induced?, Bull. Seismol. Soc. Am.,78, 188–217.
Ohio Department of Natural Resources (ODNR) (2012), Preliminary reporton the Northstar 1 class II injection well and the seismic events in theYoungstown, Ohio, area, report, 23 pp., Columbus, March.
Raleigh, C. B., J. H. Healy, and J. D. Bredehoeft (1976), An experiment inearthquake control at Rangely, Colorado, Science, 91, 1230–1237.
Rubinstein, J. L., W. L. Ellsworth, and A. McGarr (2012), The 2001–pres-ent triggered seismicity sequence in the Raton Basin of southernColorado/northern New Mexico, Abstract S34A-02 presented at 2012Fall Meeting, AGU, San Francisco, Calif., 3–7 Dec.
Schaff, D. P. (2008), Semiempirical statistics of correlation-detector perfor-mance, Bull. Seismol. Soc. Am., 98, 1495–1507.
Schaff, D. P., and F. Waldhauser (2010), One magnitude unit reduction indetection threshold by cross correlation applied to Parkfield (California)and China seismicity, Bull. Seismol. Soc. Am., 100, 3224–3238,doi:10.1785/0120100042.
Seeber, L., and J. G. Armbruster (1993), Natural and induced seismicity inthe Erie-Ontario region: Reactivation of ancient faults with littleneotectonic displacement, Geogr. Phys. Quat., 47, 363–378.
Seeber, L., J. Armbruster, and W. Y. Kim (2004), A fluid-injection-triggered earthquake sequence in Ashtabula, Ohio: Implications forseismogenesis in stable continental regions, Bull. Seismol. Soc. Am., 94,76–87.
Shi, J., P. G. Richards, and W. Y. Kim (2000), Determination of seismic en-ergy from Lg waves, Bull. Seismol. Soc. Am., 90, 483–493.
Stover, C. W., and Coffman, J. L. (1993), Seismicity of the UnitedStates, 1568–1989 (Revised), U.S. Geol. Surv. Prof. Pap., 1527,418 pp.
Tadokoro, K., M. Ando, and K. Nishigami (2000), Induced earthquakes ac-companying the water injection experiment at the Nojima fault zone,Japan: Seismicity and its migration, J. Geophys. Res., 105(B3),6089–6104, doi:10.1029/1999JB900416.
Tadokoro, K., M. Ando, and K. Nishigami (2005), Correction to “Inducedearthquakes accompanying the water injection experiment at the Nojimafault zone, Japan: Seismicity and its migration,” J. Geophys. Res., 110,B03305, doi:10.1029/2004JB003602.
Viegas, G., K. Buckingham, A. Baig, and T. Urbancic (2012), Large scaleseismicity related to wastewater injection near Trinidad, Colorado, USA,paper presented at GeoConvention 2012, Can. Soc. of Pet. Eng.,Calgary, Alberta, Canada.
Waldhauser, F., andW. L. Ellsworth (2000), A double-difference earthquakelocation algorithm: Method and application to the northern Hayward fault,California, Bull. Seismol. Soc. Am., 90, 1353–1368.
Yeats, R. S., K. Sieh, and C. R. Allen (1997), Geology of Earthquakes,568 pp., Oxford Univ. Press, New York.
Zhao, L. S., and D. V. Helmberger (1994), Source estimation from broad-band regional seismograms, Bull. Seismol. Soc. Am., 84, 91–104.
Zoback, M. D., and H.-P. Harjes (1997), Injection-induced earthquakes andcrustal stress at 9 km depth at the KTB deep drilling site, Germany,J. Geophys. Res., 102, 18,477–18,491.
Zoback, M. D., and J. H. Healy (1984), In situ stress measurements to3.5 km depth in the Cajon Pass scientific research borehole:Implications for the mechanics of crustal faulting, J. Geophys.Res., 97, 5039–5057.
Zoback, M. D., and J. Townend (2001), Implications of hydrostatic porepressures and high crustal strength for the deformation of intraplate litho-sphere, Tectonophysics, 336, 19–30.
Zoback, M. D., and M. L. Zoback (1991), Tectonic stress field ofNorth America and relative plate motions, in Neotectonics ofNorth America, edited by Slemmons et al. pp. 339–366, Geol.Soc. of Am., Boulder, Colo.
Zoback, M. L. (1992), Stress field constraints on intra-plate seismicity ineastern North America, J. Geophys. Res., 97, 11,761–11,782.
KIM: INDUCED SEISMICITY IN YOUNGSTOWN, OHIO
13