induced seismicity: issues and paths forward · 2018-03-16 · induced seismicity: issues and paths...
TRANSCRIPT
Induced Seismicity: Issues and Paths Forward
Ernest MajerLawrence Berkeley National Laboratory
May 17, 2011

Acknowledgements
Katie Boyle, John Peterson,(LBNL), David Oppenheimer (USGS), Bill Leith (USGS)Art McGarr (USGS), Bill Smith (NCPA), David Simpson (IRIS)
Steve Hickman (USGS) Bill Ellsworth, Nick Beeler ( USGS), Jon Ake (NRC) Mark Walters (Calpine) Bill Smith (NCPA) Paul Segall (Stanford), Mark Zoback
(Stanford) plus many moreDOE Geothermal and NETL/Oil and Gas Program
( complied from many recent workshops, road mappings and conferences)

Definitions
• Triggered Seismicity– Causative activity accounts for only a small
fraction of the stress change associated with the earthquakes.
– Pre-existing tectonic stress plays the primary role
• Induced Seismicity– Causative activity accounts for most of the stress
change or energy to produce the earthquakes

Induced Seismicity: Recent Issues• High-profile press coverage and congressional/regulatory
inquiries have focused attention on induced seismicity related to energy projects in the U.S. and Europe
– The Geysers, CA; Basel, Switzerland; Soultz, France; Landau, Germany
– Oil and gas: Texas , shale gas sites– CO2 sequestration sites (various)
• However, industry has successfully dealt with induced seismicity issues for almost 100 years (mining, oil and gas, waste injections, reservoir impoundment, etc.)
• How does one assess hazard risk and economic risk– Investors want to know– Regulators want to know– Seismicity related to injection cannot be assessed the same as natural
seismicity– Scale and distance of influence
• Seismicity is also be useful as a resource management tool– Geothermal, Oil and Gas, CO2 Seq ??
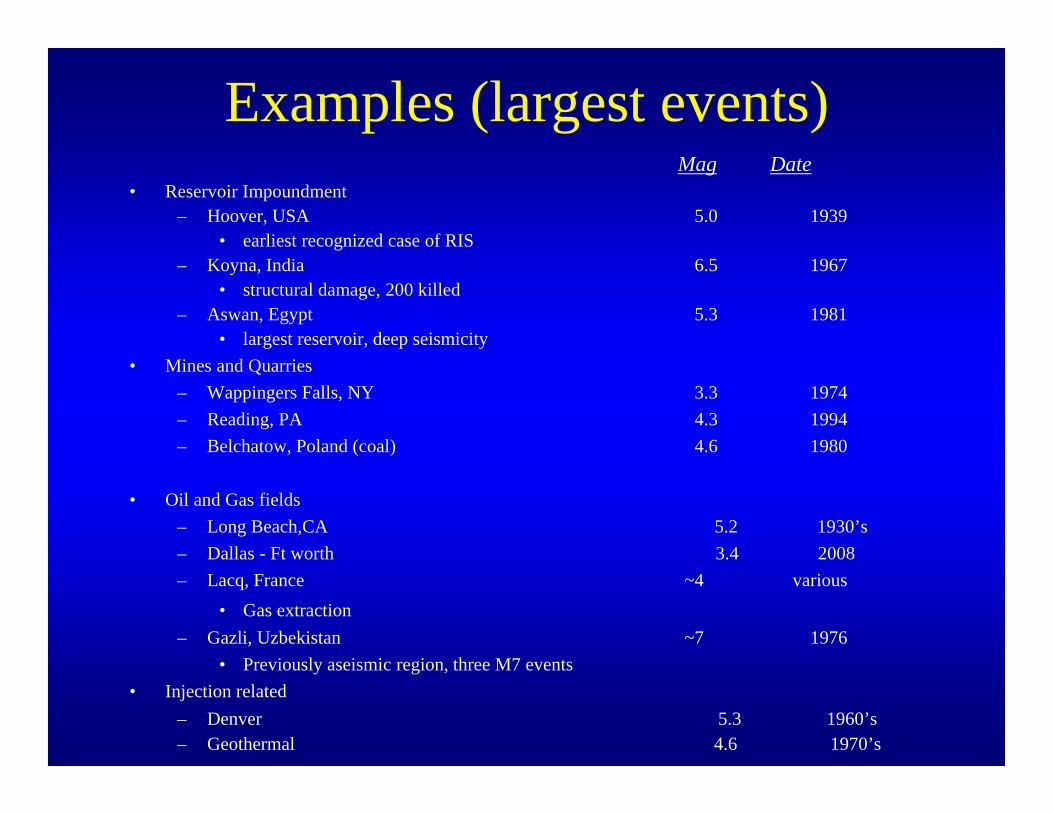
Examples (largest events)Mag Date
• Reservoir Impoundment– Hoover, USA 5.0 1939
• earliest recognized case of RIS– Koyna, India 6.5 1967
• structural damage, 200 killed – Aswan, Egypt 5.3 1981
• largest reservoir, deep seismicity• Mines and Quarries
– Wappingers Falls, NY 3.3 1974– Reading, PA 4.3 1994– Belchatow, Poland (coal) 4.6 1980
• Oil and Gas fields– Long Beach,CA 5.2 1930’s– Dallas - Ft worth 3.4 2008– Lacq, France ~4 various
• Gas extraction– Gazli, Uzbekistan ~7 1976
• Previously aseismic region, three M7 events• Injection related
– Denver 5.3 1960’s– Geothermal 4.6 1970’s
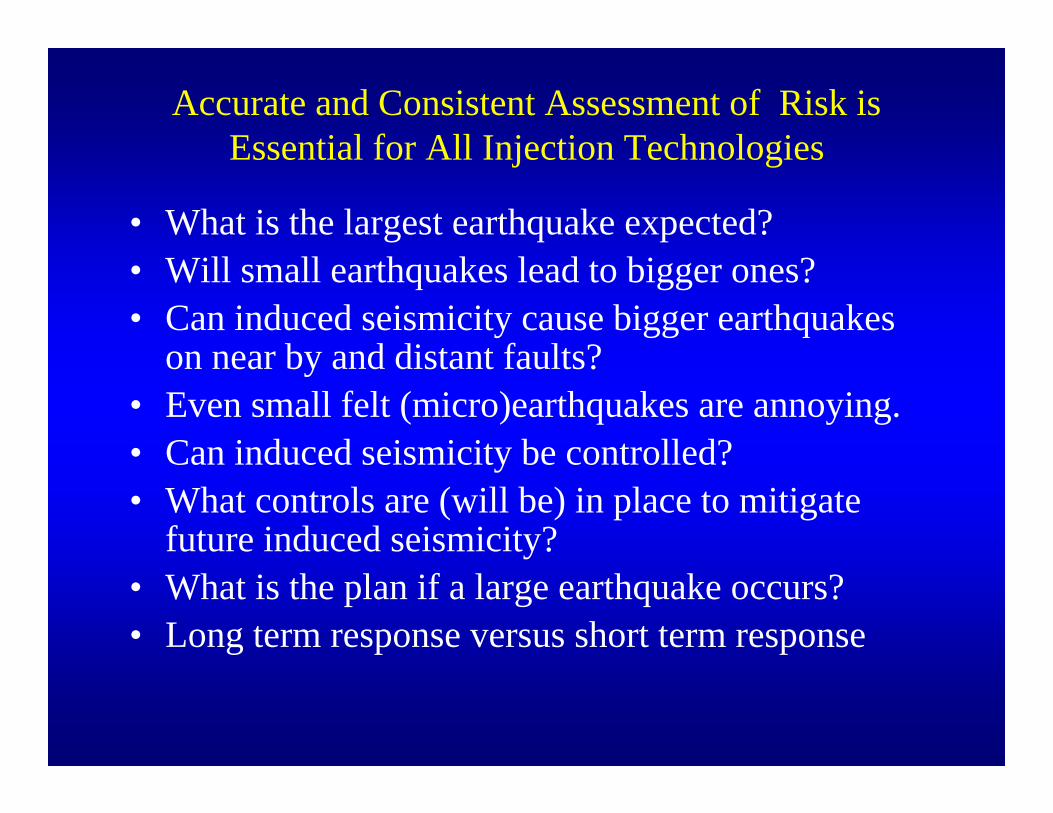
Accurate and Consistent Assessment of Risk is Essential for All Injection Technologies
• What is the largest earthquake expected?• Will small earthquakes lead to bigger ones?• Can induced seismicity cause bigger earthquakes
on near by and distant faults?• Even small felt (micro)earthquakes are annoying.• Can induced seismicity be controlled?• What controls are (will be) in place to mitigate
future induced seismicity?• What is the plan if a large earthquake occurs?• Long term response versus short term response
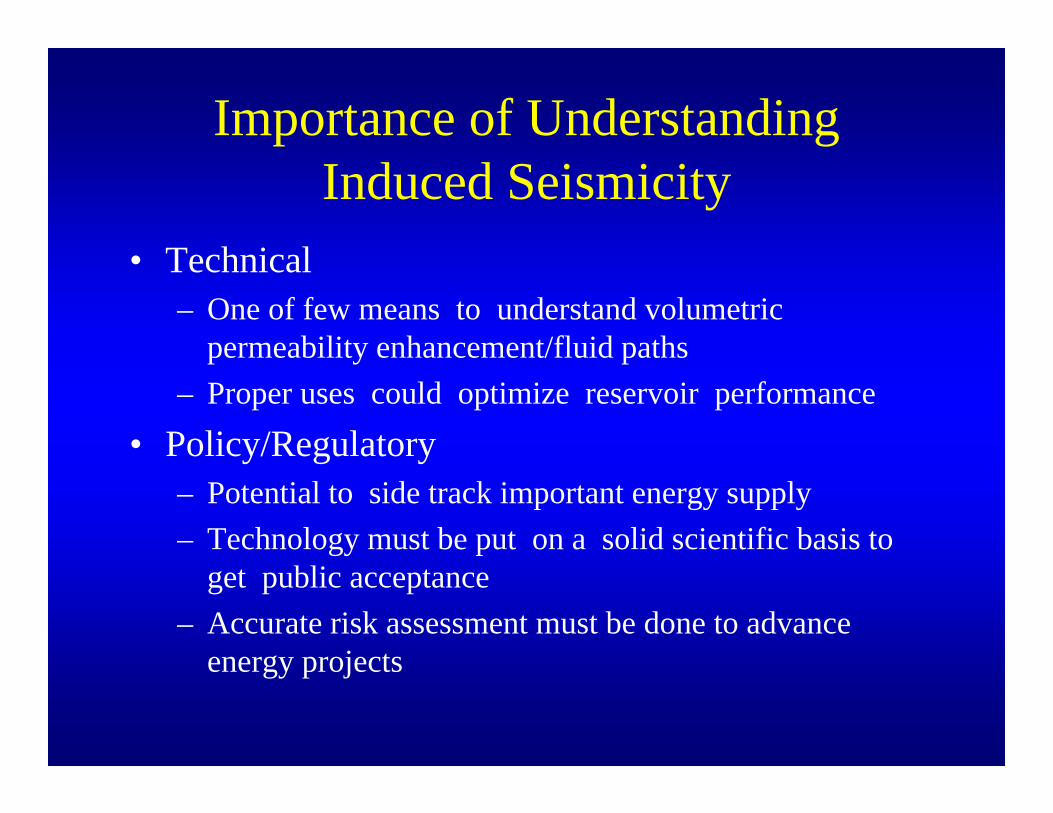
Importance of Understanding Induced Seismicity
• Technical– One of few means to understand volumetric
permeability enhancement/fluid paths– Proper uses could optimize reservoir performance
• Policy/Regulatory– Potential to side track important energy supply– Technology must be put on a solid scientific basis to
get public acceptance– Accurate risk assessment must be done to advance
energy projects
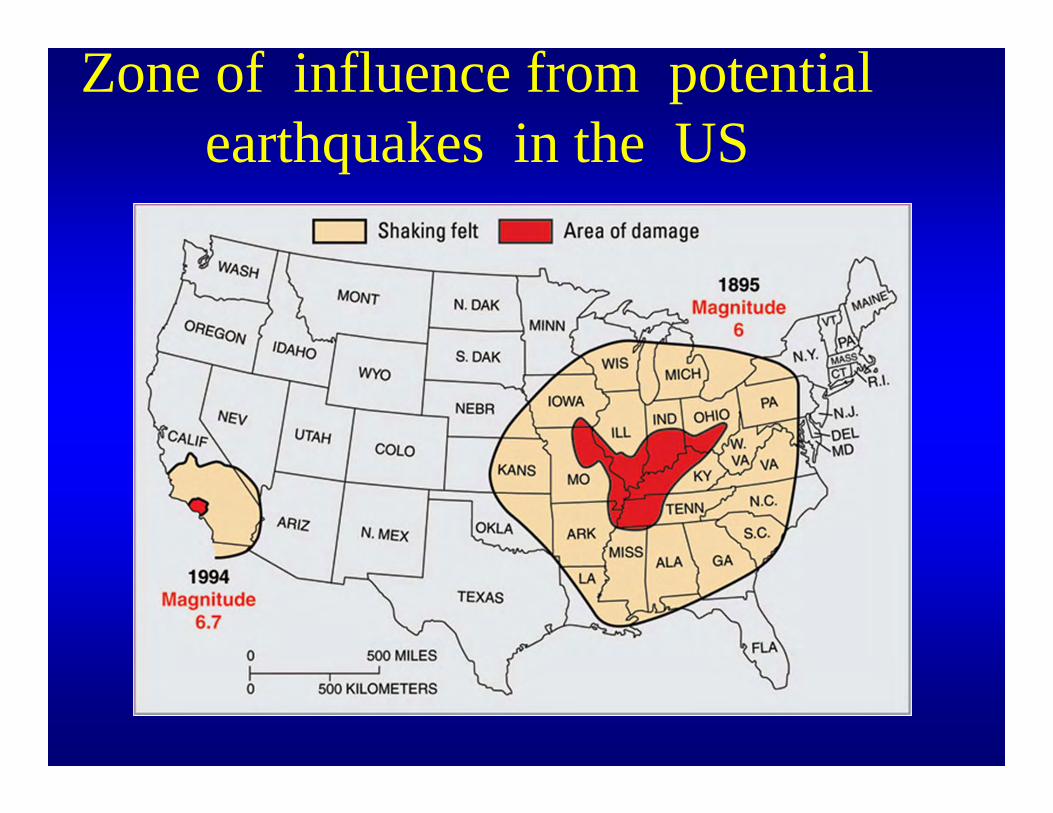
Zone of influence from potential earthquakes in the US
Therefore• Three main issues to address to
advance Energy Applications–How does one assess risk–How does one minimize risk–How does one effectively utilize
Induced seismicity

Small versus Large Earthquakes• Earthquake magnitude determined by the size
of the slipping faultSmall faults imply small earthquakesMany more small faults than large faultsMany more small earthquakes than large
earthquakes• Most Large earthquakes start deep
– Shallow injection implies small earthquakes

Causal Mechanisms
• Earthquakes (fault rupture) occur when the shear stress along a fault is greater than the strength of the fault.
• Induced or triggered earthquakes occur when human activity causes changes in stresses within the Earth that are sufficient to produce rupture.
• This can result from either:– An increase in shear stress along the fault – A decrease in strength of the fault
• Decrease the normal stress across the fault• Increase the pore pressure within the fault• Decrease in cohesion on fault (chemical changes)• Thermal stresses• Stress diffusion• Other

Elevated Fluid Pressure:• Reduces effective normal stress on fault, lowering resistance to
shearing. Implies that if pressure balance can be maintained seismicity can be controlled
Role of Fluid Pressure in Earthquake generationFor a microearthquake to occur one must exceed the critical shear stress on the fault:
c + (n - p)
Normal (clamping) Stress = n
In situ ShearStress Water/fluid pressure
in fault = p
= coefficient of friction on fault
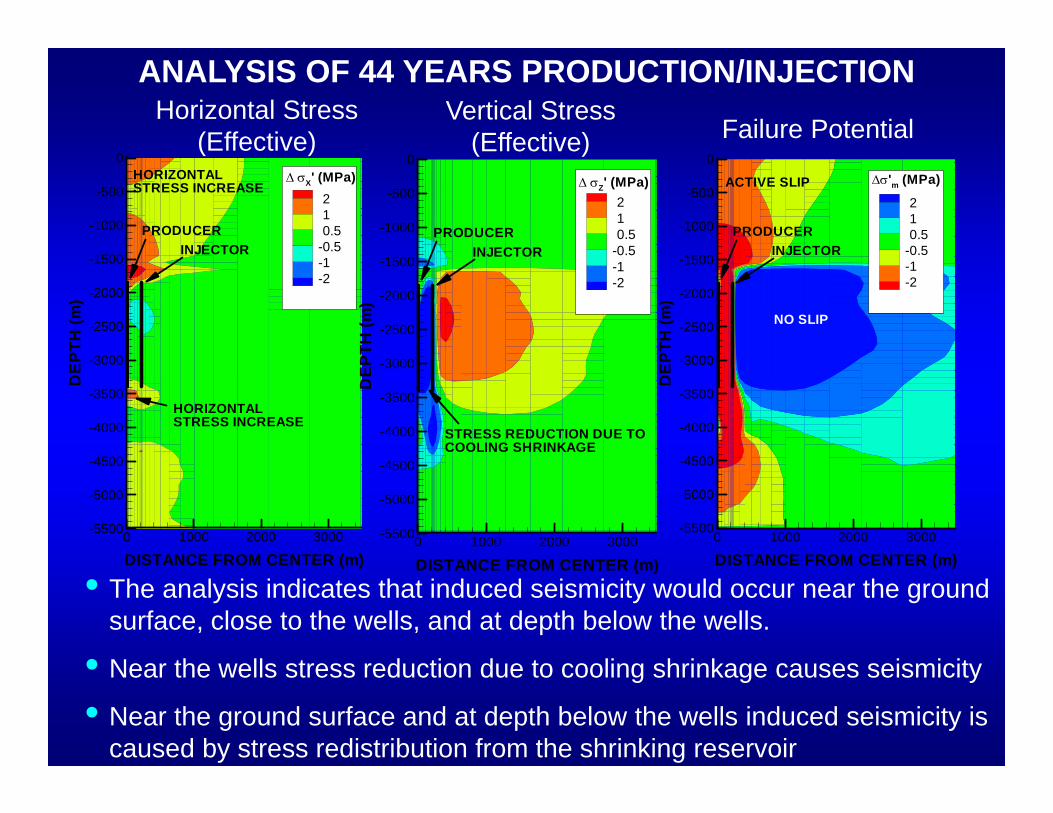
ANALYSIS OF 44 YEARS PRODUCTION/INJECTIONHorizontal Stress
(Effective)Vertical Stress
(Effective)
• The analysis indicates that induced seismicity would occur near the ground surface, close to the wells, and at depth below the wells.
• Near the wells stress reduction due to cooling shrinkage causes seismicity
• Near the ground surface and at depth below the wells induced seismicity is caused by stress redistribution from the shrinking reservoir
DISTANCE FROM CENTER (m)
DE
PTH
(m)
0 1000 2000 3000-5500
-5000
-4500
-4000
-3500
-3000
-2500
-2000
-1500
-1000
-500
0
210.5
-0.5-1-2
X' (MPa)HORIZONTALSTRESS INCREASE
INJECTORPRODUCER
HORIZONTALSTRESS INCREASE
DISTANCE FROM CENTER (m)
DE
PTH
(m)
0 1000 2000 3000-5500
-5000
-4500
-4000
-3500
-3000
-2500
-2000
-1500
-1000
-500
0
210.5
-0.5-1-2
Z' (MPa)
INJECTORPRODUCER
STRESS REDUCTION DUE TOCOOLING SHRINKAGE
DISTANCE FROM CENTER (m)
DE
PTH
(m)
0 1000 2000 3000-5500
-5000
-4500
-4000
-3500
-3000
-2500
-2000
-1500
-1000
-500
0
210.5
-0.5-1-2
'm (MPa)ACTIVE SLIP
NO SLIP
INJECTORPRODUCER
Failure Potential
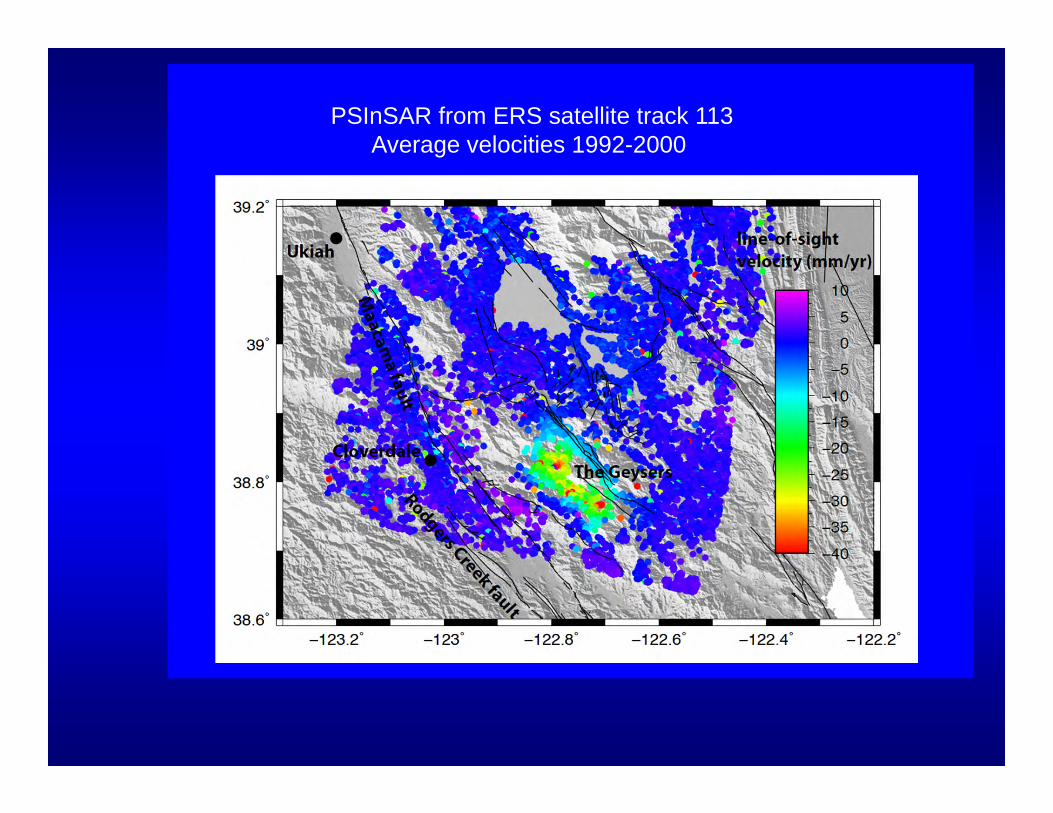
PSInSAR from ERS satellite track 113Average velocities 1992-2000
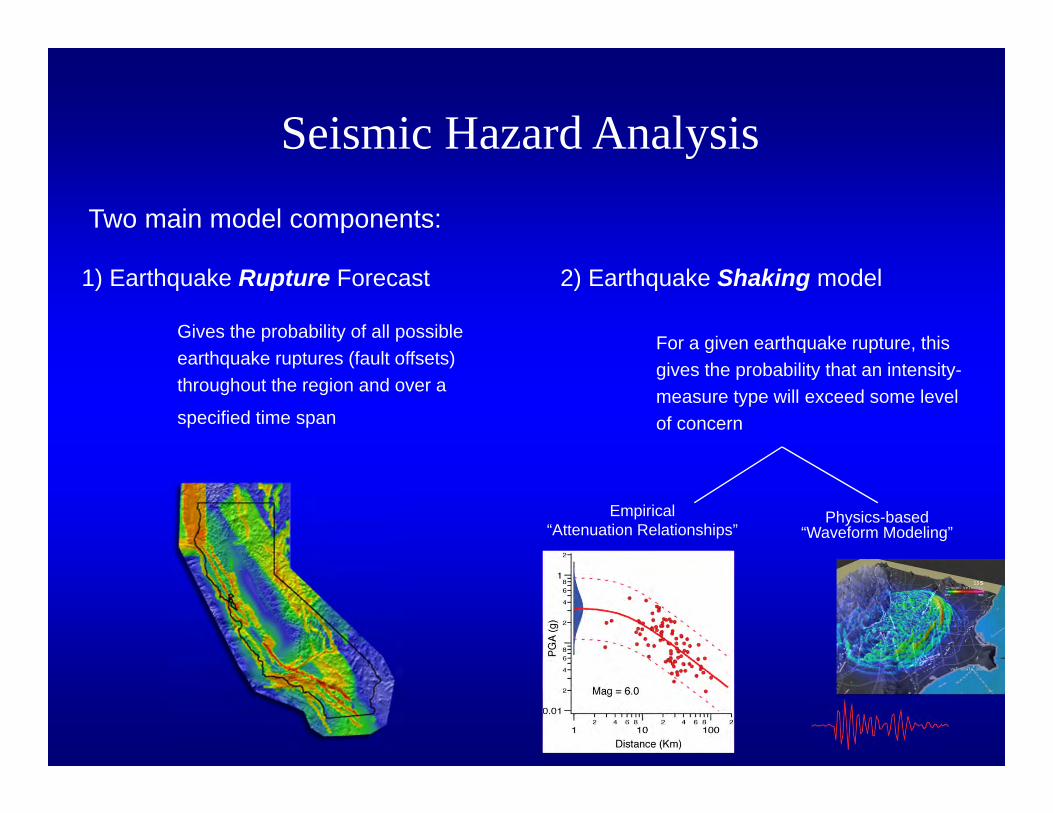
2) Earthquake Shaking model
For a given earthquake rupture, this gives the probability that an intensity-measure type will exceed some level of concern
1) Earthquake Rupture Forecast
Gives the probability of all possible earthquake ruptures (fault offsets) throughout the region and over a
specified time span
Two main model components:
Physics-based“Waveform Modeling”
Empirical “Attenuation Relationships”
Seismic Hazard Analysis
PSHA Basics
• Probabilistic Seismic Hazard Analysis (PSHA) integrates the hazard from all sources and includes the effect of uncertainty explicitly
• State of Practice for Critical Facilities• Required for any Risk Informed
Assessment
Earthquake Risk
• Risk in this context can be thought of as: R = AF(a | eq)*(Pr(f | a)*C($;LL | f)
Where R=“risk”, AF= annual frequency of ground motion a, given occurrence of an earthquake(s), Pr(f | a) =probability of failure of something of interest given ground motion a, and C=consequences (dollars, or any metric of interest).
AF developed using Probabilistic Seismic Hazard Analysis (PSHA)

FaultModels
Specifies the spatial geometryof faults in reservoir.
StressModels
Specifies the magnitude and orientation of stress in
reservoir.
Earthquake-RateModels
Gives the rate of earthquake on each fault as a function of the perturbing
pore pressure.
ProbabilityModels
Gives the probability that each earthquake will
occur during a specific time span.
Components (??) of an Induced Seismicity Rupture Forecast
Examples• Geothermal
– EGS– Hydrothermal
• Carbon Sequestration– Saline formations– Tight formations

Geothermal

Enhanced Geothermal Systems
• Located at depths of 3-10 km• It requires increasing
permeability by stimulating fracturing and shearing of fractures through fluid/propant injection
• Fluid circulated between injection and production wells to capture and extract heat from system
• i.e. Requires creating controlled seismicity
Injection Well
Man-made Fracture System
Hot Basement
Rock
Production Well
Electric or Thermal Application

Northern California Historical Seismicity (M 3.5 to 5.0) 1900- 2005
The Geysers

U13
U16
SONOMA
U18
U20
CALISTOGA W FORD FLATU14
U5/6
U7/8
U11
U17
U12
BEAR CN
0 1.0 2.0
MILES
Hi Pt Tank
Terminal Tank
NON-SRGRP INJECTION WELLHEAD
SEGEP PIPELINESRGRP PIPELINESRGRP INJECTION WELLHEAD
SEISMIC STATIONS
CalpineNCPA
STRONGMOTIONLBNLCALPINENCSN
SRGRP WELL STUDY AREA
1,80
8,00
0 E
391,000 N
1,75
9,00
0 E
431,000 N
Figure 1. Location of USGS stations, Current Calpine array, and the new LBNL stations. Also shown are thelocations of the pipelines used for the water from Santa Rosa. (from Calpine)
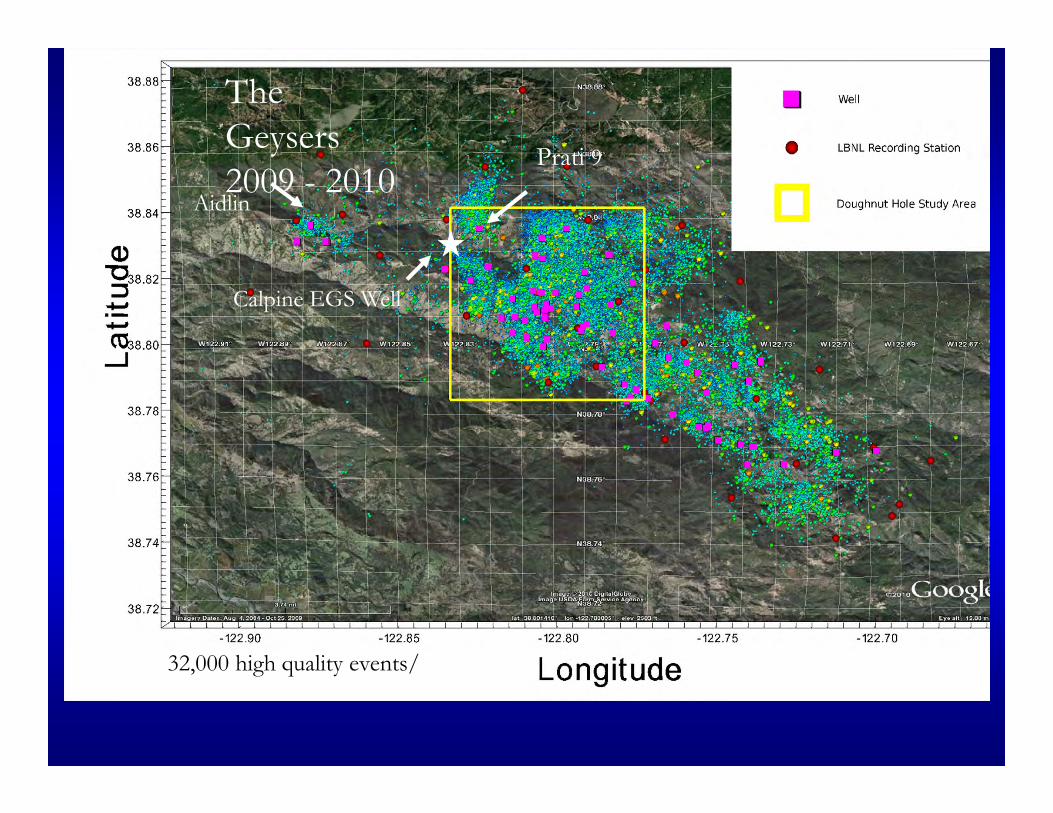
Aidlin
Prati 9
Calpine EGS Well
32,000 high quality events/
The Geysers2009 - 2010
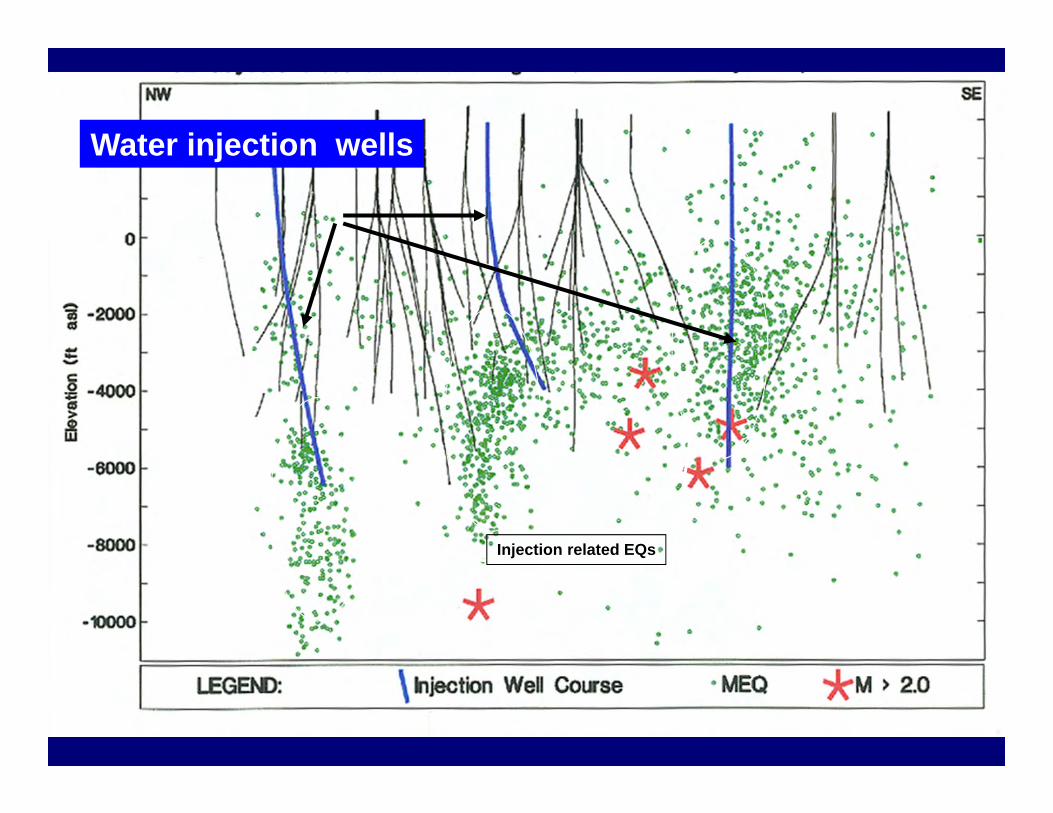
Injection related EQs
Water injection wells

(Smith 2011)
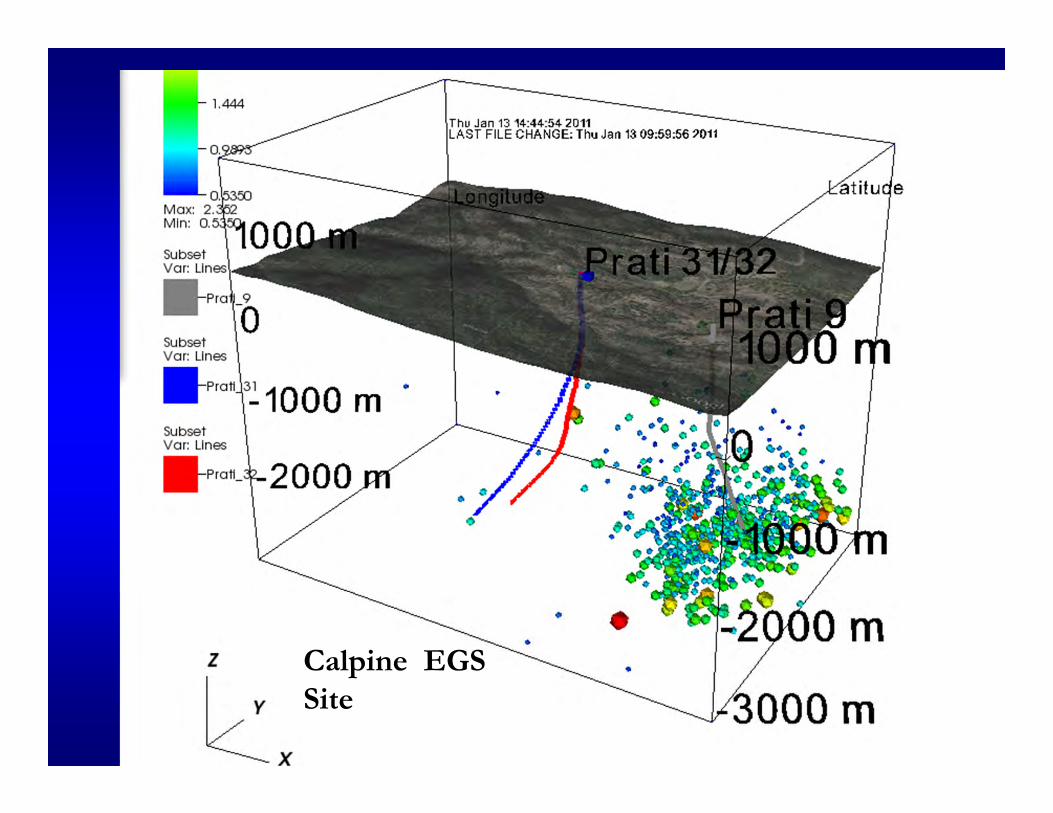
Calpine EGS Site

Seismic moment & Injection Rate
McGarr (1976)
VKM ..0
Total Seismic Moment
K ~ 0.5
Volume added to region in expansion in direction NW/SE(2) and NE-SW
(3)
Fluid injected

Volume change for Geysers• Total volume change = 1.42 e9 meters cubed (over 35
Years)
• Sum Moments = e18.45 N-m– 1 Mag 6.2– 10 Mag 5.2– 100 Mag 4.2– 1,000 Mag 3.2– 10,000 Mag 2.2– etc.
• Not Far Off!!

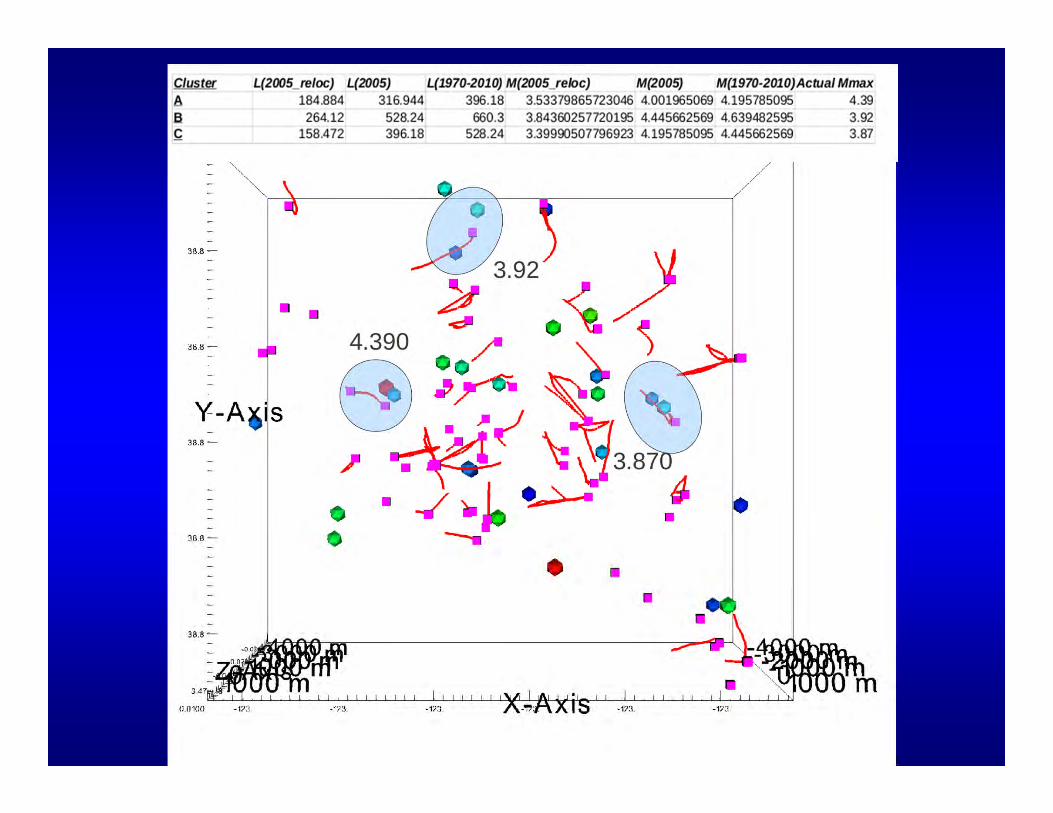
Determination of Max Magnitude(Shapario 2011, 2010)
Assumptions/Hypothesis/Observations
1. Large events are under represented in fluid stimulated volume2. Geometry of a stimulated volume influences frequency magnitude relation3. Seismicity cloud defines the volume of fluid pressure increase4. Majority of area of slip ( fault) must be pressurized to fail5. Therefore, minimum principle axis of a fluid stimulated rock volume controls
size of “largest events”
2 Log · L min -1 = Max Magnitude
ie, rupture of fluid induced events is only probable along a surface mainly inside a stimulated volume
L min = min axis of stimulated volume (in meters)

One year of data data


1970 – 2010 data
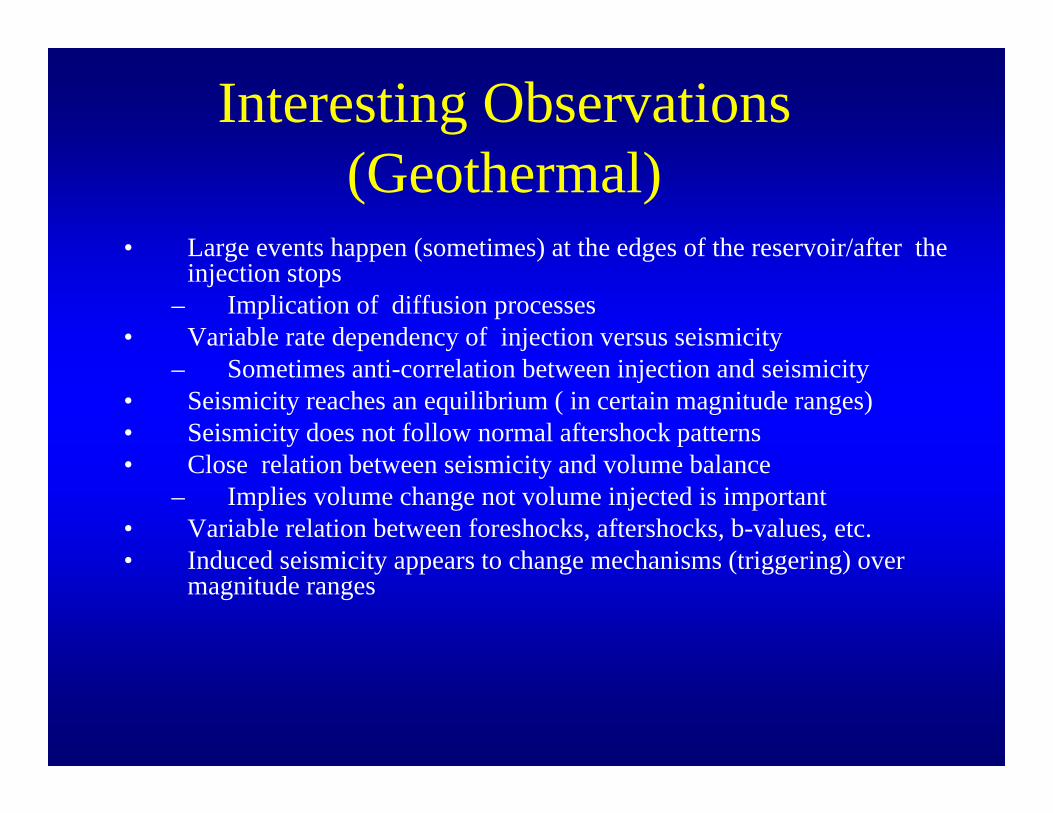
Interesting Observations (Geothermal)
• Large events happen (sometimes) at the edges of the reservoir/after the injection stops
– Implication of diffusion processes• Variable rate dependency of injection versus seismicity
– Sometimes anti-correlation between injection and seismicity• Seismicity reaches an equilibrium ( in certain magnitude ranges)• Seismicity does not follow normal aftershock patterns• Close relation between seismicity and volume balance
– Implies volume change not volume injected is important• Variable relation between foreshocks, aftershocks, b-values, etc.• Induced seismicity appears to change mechanisms (triggering) over
magnitude ranges

Carbon Sequestration

CO2 Sequestration
IPCC (2005)
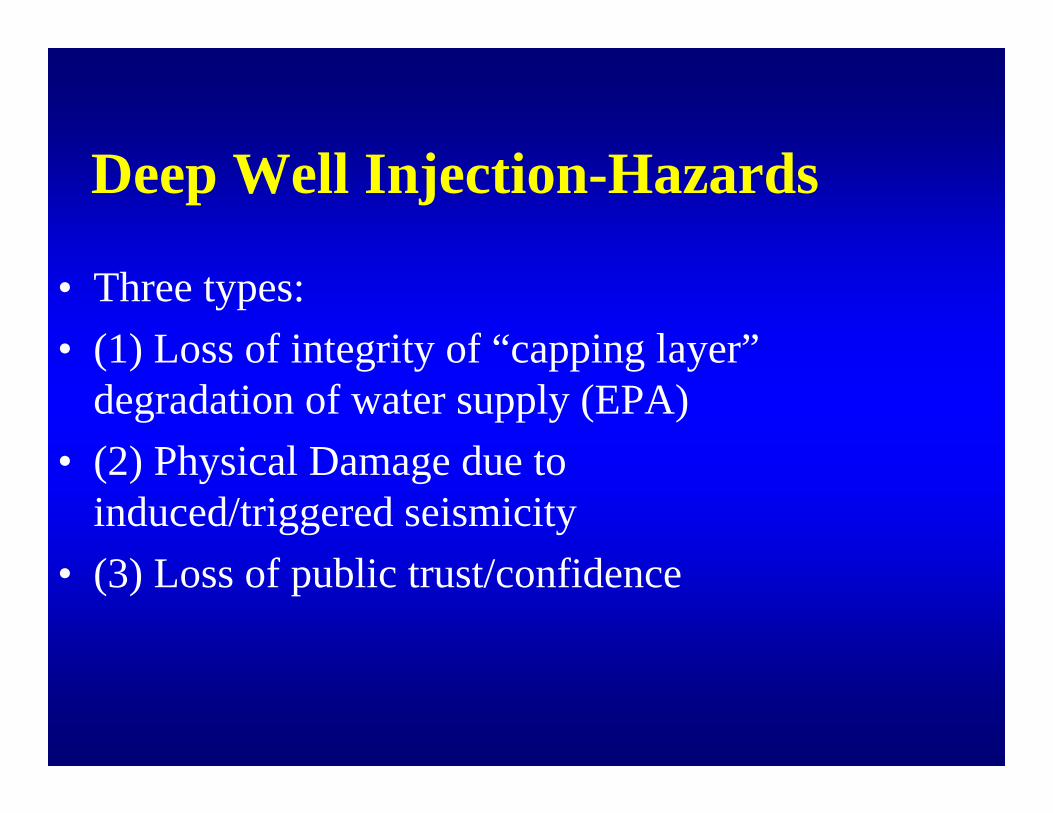
Deep Well Injection-Hazards
• Three types: • (1) Loss of integrity of “capping layer”
degradation of water supply (EPA)• (2) Physical Damage due to
induced/triggered seismicity• (3) Loss of public trust/confidence
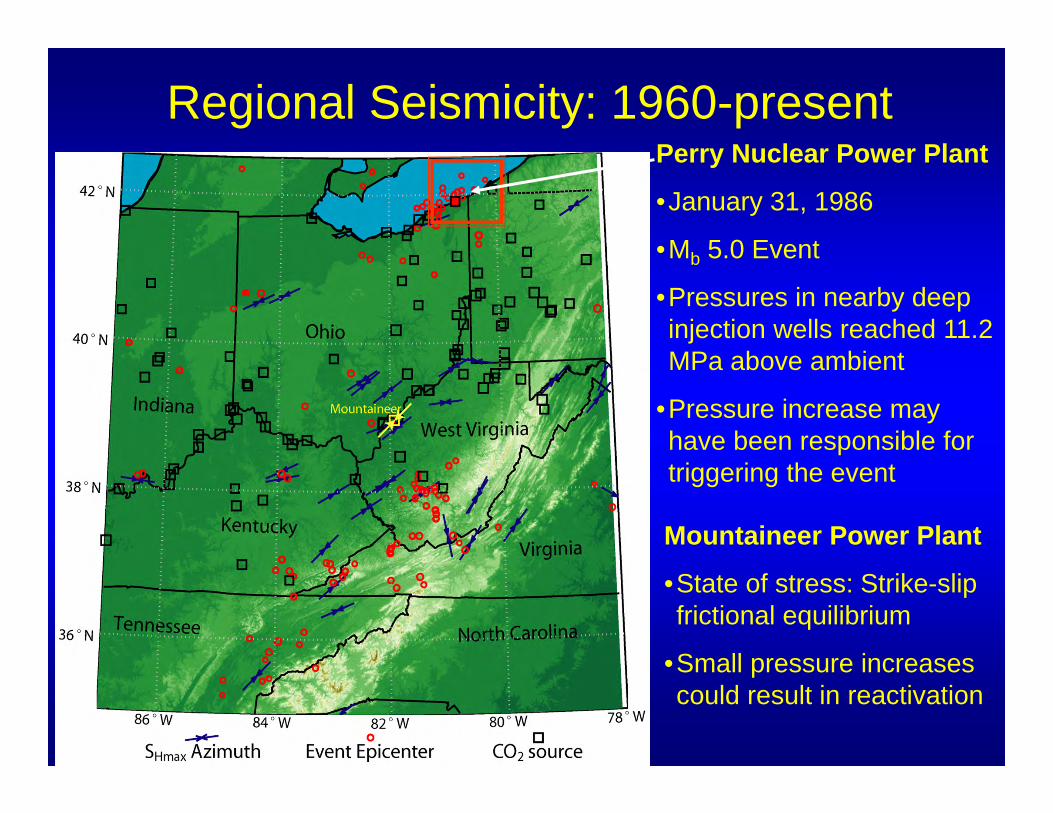
Regional Seismicity: 1960-presentPerry Nuclear Power Plant
•January 31, 1986
•Mb 5.0 Event
•Pressures in nearby deep injection wells reached 11.2 MPa above ambient
•Pressure increase may have been responsible for triggering the event
Mountaineer Power Plant
•State of stress: Strike-slip frictional equilibrium
•Small pressure increases could result in reactivation

CO2 Sources in the Illinois Basin
Midwest Geological Sequestration Consortium (MGSC)
Annual CO2 Emissions from Stationary Sources 300 million tons (MT)
Illinois
Indiana
Kentucky

Basin-Scale Pressure Buildup (bar)
Illin
ois
Nor
thin
g(k
m)
500
600
700
800
900
1000
1100
3025201510864210.2
0.5 years
Near-Field
Far-Field
3025201510864210.2
5 years
Illinois Easting (km)
llino
isN
orth
ing
(km
)
800 900 1000 1100 1200 1300
500
600
700
800
900
1000
1100
3025201510864210.2
50 years
Illinois Easting (km)800 900 1000 1100 1200 1300
3025201510864210.2
100 years
Cutoff Pressure: 0.1 bar

Kanamori and Anderson, BSSA, 65, 1975

VKM ..0
Example for CO2 sequestration, 1 million tons/yr of injection
Also , assume that the relation between volume injected and Seismicity is similar as in geothermal case (let K =1)
Assuming normal magnitude: moment relationsThen one could expect total Magnitude = 4.6(Also works out for stress drop of 50 bars and fault radius of 500 meters)
Also assumes b value of 1
Or 10 M = 3.6100 M = 2.61000 M = 1.6 etc

Recent and Current DOE Activities for Geothermal Induced Seismicity
• Three international workshops (2005-2009) – Peer reviewed white paper (IEA Report, Majer et al., 2007)– Protocol for the development of geothermal sites and good practice guidelines (IEA 2009)
Current Activities 2010 -2011• Establish induced seismicity website for scientific collaboration and community
outreach – includes CO2 and oil & gas• Instrument all DOE EGS projects to monitor, analyze, and learn from induced
seismicity• Require all DOE EGS projects to follow Induced Seismicity Protocol• Establish additional international scientific collaborations• Ensure that real-time seismic data is available to public in community gathering spots
near EGS project sites• Hold series of workshops to address research/technical needs and establish risk
assessment and updated Protocol and best practices for industry• Updated protocol and best practices guide for US

Path Forward/Current Needs
• Technical Issues
• Regulatory/Risk Issues/Community Interaction

Technical Issues/NeedsFurther understanding of complex interactions
among stress, temperature, rock and fluid properties
• Alternative methods for creating reservoirs/injection volume
• Adaptive seismic hazard estimation • Leverage existing expertise and capabilities to
address technical issues common to all injection applications

Policy Needs
• Supply stakeholders with guidelines (protocols/best practices)– Update as technology progresses– Follow technical and community/regulator interaction
• Community Interaction– Supply timely, open, and complete information– Educate operators on importance of public outreach– Technical based risk analysis
• Develop risk based procedure for estimating potential mitigation requirements (Adapt Seismic hazard analysis for induced seismicity applications)– Probabilistic– Physics based

What should/could be done? –Research Needs
• Quantify relation between seismicity and permeability enhancement
• Improve means to quantify the relation between stress change and seismicity rate?
• Is there time dependence or stressing rate dependence in stress-seismicity rate changes/ or is the theory of effective stress all we need to know?
• Determine the role of slip-dilatancy (slip-permeability) in fault zones in EQ generation?
• Determine role of mechanical processes (fault healing, permeability reduction) versus other changes in the induced seismicity generation
– What do we need to know about fault zone poroelasticity?
– What do we need to know about chemical processes?
• Do induced earthquakes follow the same decay relations as tectonic earthquakes in the same province? (why or why not)
• Active experiments to manipulate seismicity without compromising production– reservoir performance assessment– integrated reservoir analysis
Dedicated test sites for exploring research issues?

• Technical issues– Further understanding of complex interaction between
stress, temperature, rock and fluid properties (we do not fully understand the linkage between all of the subsurface paramenters
• Community Interaction/Regulatory– Supply timely, open, and complete information– Consistent science based “rules”

• Modeling/Theory needs– Fully coupled thermo-mechanical-chemical codes
• Stress, temp, and chemical effects • Dynamic fracture codes in 3-D
– Joint inversion of EM/seismic data• Links fluid and matrix properties
– Full anisotropic 3-d models• Fracture imaging at different scales

• Data needs– Improved high pressure-high temperature rock
physics data• Rock physics measurements
– Coupled chem/mechanical
– High resolution field measurements • Wide band • Dynamic fracture imaging• High res MEQ

What could/should we do?- Operational• Deploy advanced monitoring systems
– experimental data– continuous data-stream as basis for operational control decisions
during development and long-term operation • Risk-based decision making for operational control
– adapt probabilistic seismic hazard/risk method coupled with physics-based approach incorporating uncertainty
• Mitigation and Control Procedures
– Site characterization and selection; faults, communities
– Engineering design – well locations, injection pressures, etc.
– Data-driven operational control
• Establish a best practices/protocol based on accepted scientific knowledge in order to allow implementation of energy projects – i.e set out the rules!!
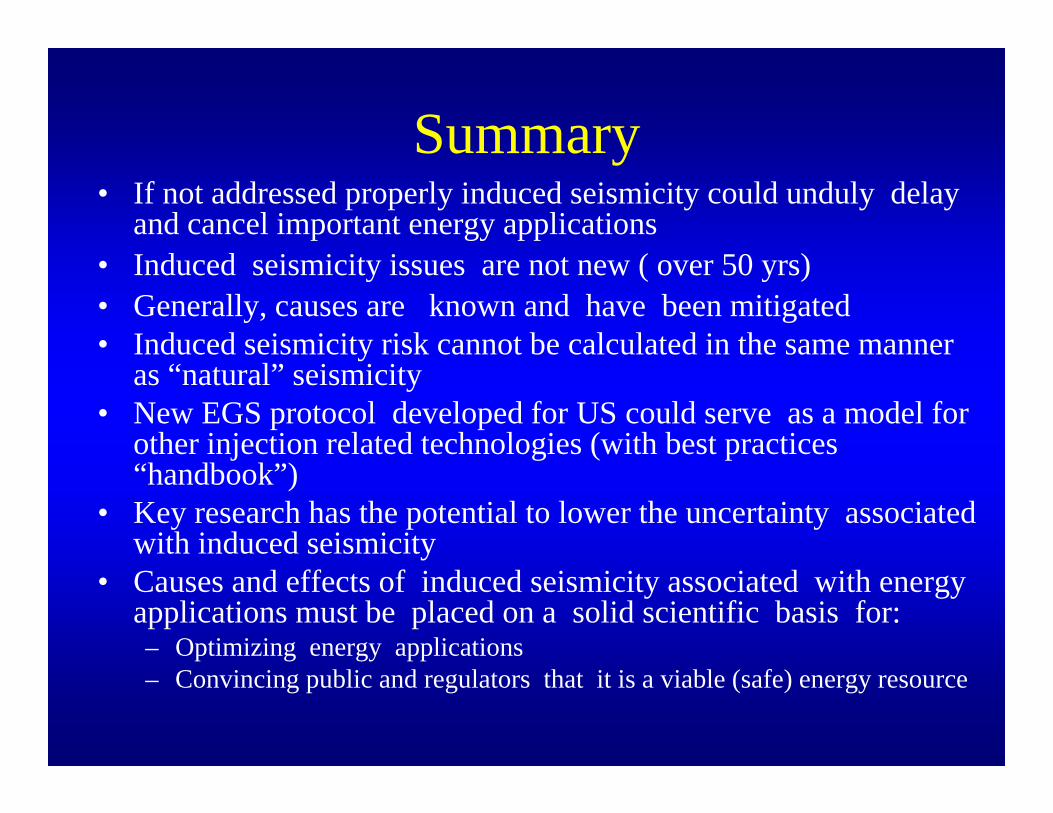
Summary• If not addressed properly induced seismicity could unduly delay
and cancel important energy applications• Induced seismicity issues are not new ( over 50 yrs)• Generally, causes are known and have been mitigated• Induced seismicity risk cannot be calculated in the same manner
as “natural” seismicity• New EGS protocol developed for US could serve as a model for
other injection related technologies (with best practices “handbook”)
• Key research has the potential to lower the uncertainty associated with induced seismicity
• Causes and effects of induced seismicity associated with energy applications must be placed on a solid scientific basis for:– Optimizing energy applications– Convincing public and regulators that it is a viable (safe) energy resource